Building Conway’s Future 64 th Annual Presentation of the Faulkner County 2014 Economic Report.
41
-
Upload
angel-mcgee -
Category
Documents
-
view
217 -
download
3
Transcript of Building Conway’s Future 64 th Annual Presentation of the Faulkner County 2014 Economic Report.


Prepared for

With the Support of:
Dr. Michael HargisDean of the College of Business

Roger Lewis, PhD Report Author Pat Cantrell, PhD Report Coordinator
Stacey Spinks, MBA Graduate Assistant
2014 Economic Report Prepared by:

National Economic Gross Domestic Product
2004 2005 2006 2007 2008 2009 2010 2011 2012 2013 2014
3.6%
3.1%2.7%
1.9%
0.0%
-2.6%
3.0%
1.8%
2.8%
1.9%
2.4%

DOW Jones Industrial Average Year-End Closings
2004 2005 2006 2007 2008 2009 2010 2011 2012 2013 20148,000
10,000
12,000
14,000
16,000
18,000
20,000
10,783 10,718
12,463 13,265
8,776
10,285
11,578 12,218
13,104
16,577
17,823
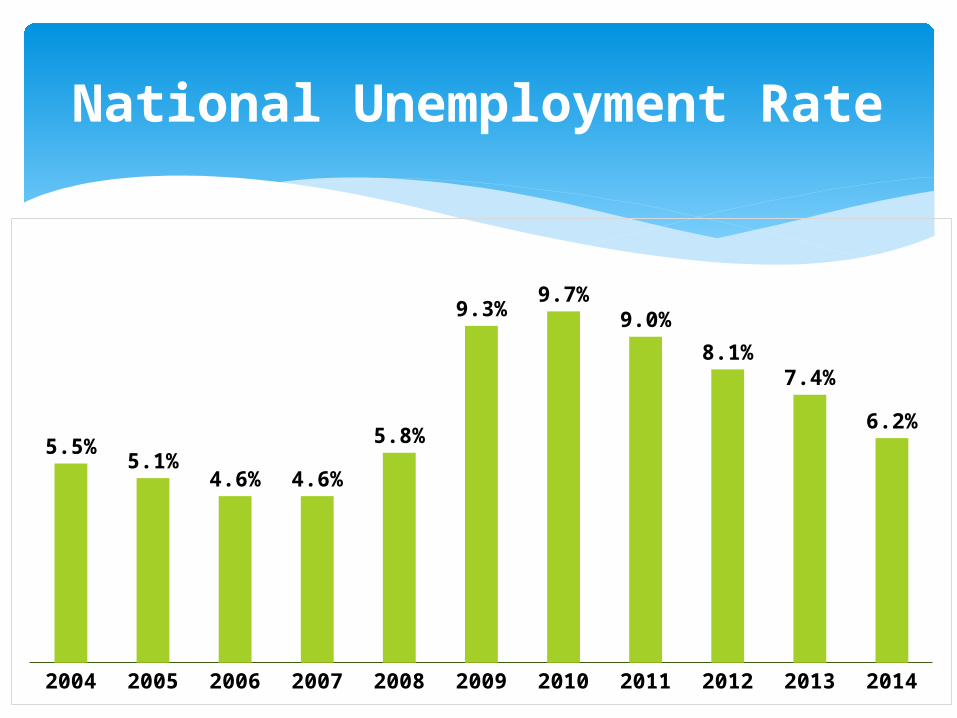
National Unemployment Rate
2004 2005 2006 2007 2008 2009 2010 2011 2012 2013 2014
5.5%5.1%
4.6% 4.6%
5.8%
9.3%9.7%
9.0%
8.1%7.4%
6.2%
2014
2013
2012
2011
2010
2009
2008
2007
2006
2005
2004
3.5
4.5
5.5
6.5
7.5
8.5
9.5
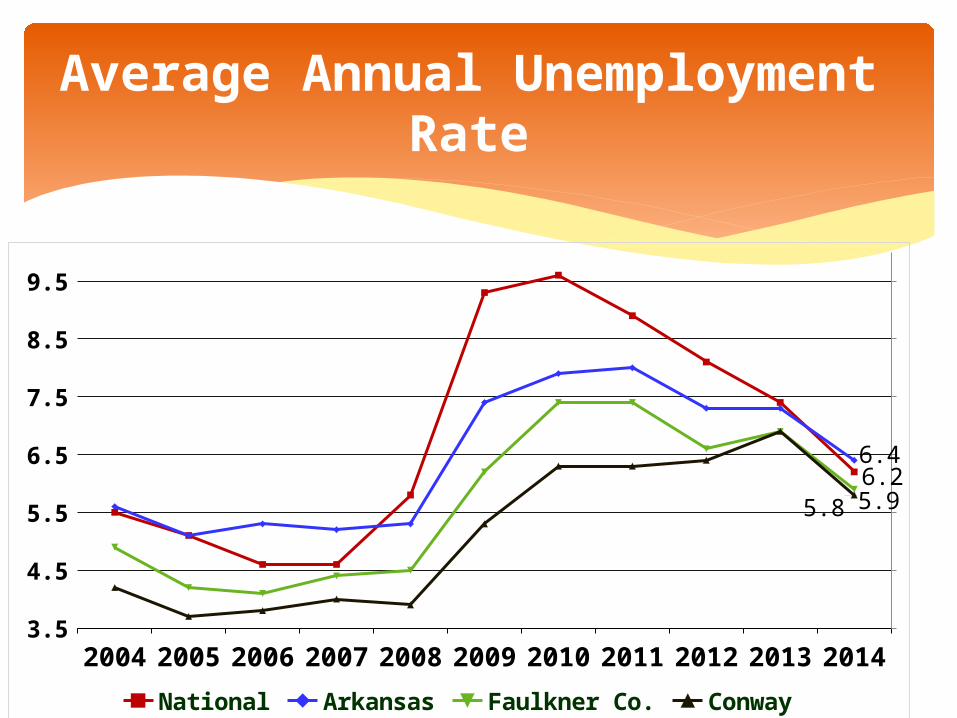
6.26.4
5.95.8
National Arkansas Faulkner Co. Conway
Average Annual Unemployment Rate

Decem
ber
Nov
embe
r
Oct
ober
Sept
embe
r
Augus
tJu
lyJu
neM
ay
April
Mar
ch
Febru
ary
Janu
ary
4.00
4.50
5.00
5.50
6.00
6.50
7.00
7.50
8.00
8.50
5.45.6
5.14.9
U.S. ArkansasFaulkner County Conway
2014 Monthly Unemployment

National Consumer Price Index
2004
2005
2006
2007
2008
2009
2010
2011
2012
2013
2014
2.7%
3.4%3.2%
2.8%
3.8%
-0.4%
1.6%
3.2%
2.1%
1.2%0.8%

Consumer Price Index
Percentage Change Per Select Category, Seasonally Adjusted
Category 2013 2014
Apparel 0.6 -2.0
Education & Communications
1.6 0.4
Energy 0.5 -10.6
Food & Beverage 1.1 2.0
Housing 2.2 2.5
Medical Care 2.0 3.0
Other Goods & Services 1.8 1.6
Recreation 0.4 0.0
Transportation 0.5 -6.2
All Items 1.2 0.8

Cities Composite
Equivalent to $50,000 Salary in Conway
Conway 91.9 $50,000
Fayetteville, AR 90.3 49,129 Hot Springs, AR 93.2 50,707 Jonesboro, AR 87.2 47,334 LR-NLR, AR 98.4 53,536 Memphis, TN 85.8 46,404
New York (Manhattan), NY 218.2 119,368
San Jose, CA 148.5 80,794
Seattle, WA 124.0 67,465
St. Louis, MO 94.1 51,305
Washington-Arlington, VA
139.3 79,060
National Average 100 $54,407
Cost of Living Comparison

Family Units Constructed
2005 2006 2007 2008 2009 2010 2011 2012 2013 2014
488 407314 192 259 223 153 186 147 119
2427
90
5228 58
216
12 16
1010
16844
689
846668
12112 92
78
Single Family Duplex Multi-Family

Value of All Building PermitsIn Million Dollars
2008 2009 2010 2011 2012 2013 2014
82.1 80.7 74.9
36.2 38.651.1
35.2
58.9 65.4 75.7
94.176.6 59.5 105.1
Residential Commercial$141
$146 $1
30
$151
$115 $1
10
$140

Population of Conway and Faulkner County
1950 1960 1970 1980 1990 2000 2005 2010 20140
20,000
40,000
60,000
80,000
100,000
120,000
140,000
63,016
122,426
Conway Faulkner County

Faulkner County Births and Deaths
Year Births Deaths Net Gain
2013 1536 887 649
2012 1544 800 744
2011 1444 800 644
2010 1532 811 734
2009 1538 756 782
2008 1511 746 765
2007 1481 737 744
2006 1,530 726 804
2005 1,398 717 681
2004 1365 684 681

4.2 4.1
7.7
4.4
9.4 9.4
3.53.74.4
6.9
4.4
14.1
9.4
3.5
2010 2013Murder, Rape, Robbery, & Assault
Per 1,000 in cities whose population is 50,000+
Violent Crime

Per 1,000 in cities whose population is 50,000+
42.434.7
55.9
43.1
76.7
84.6
27.2
43.3
59.352.6
42.1
78.7
59.7
28.6
2010 2013Burglary, Larceny, Vehicle Theft
Property Crime

Year RevenueCapital
Expenditures
Residential
Electric Meters
% Increase
Population
Estimate
2015* 111.9 21.0 26,892 0.7 63,465
2014 111.0 19.6 26,701 1.0 63,014
2013 107.1 12.6 26426 1.2 62,365
2010 95.1 10.3 25,237 3.0 58,908
*2015 Figures Estimated
(In Millions of Dollars)
Conway Corporation

Faulkner County ½% Sales Tax Receipts
Year Amount Change OverPrevious Year
2014 $8,272,423 $178,154
2013 $8,094,270 -$371,317
2012 $8,465,586 $654,215
Year Amount Change OverPrevious Year
2014 $12,915,263 $104,018
2013 $12,811,245 $890
2012 $12,810,355 $501,714
Conway 1% Sales Tax
Sales Tax Receipts
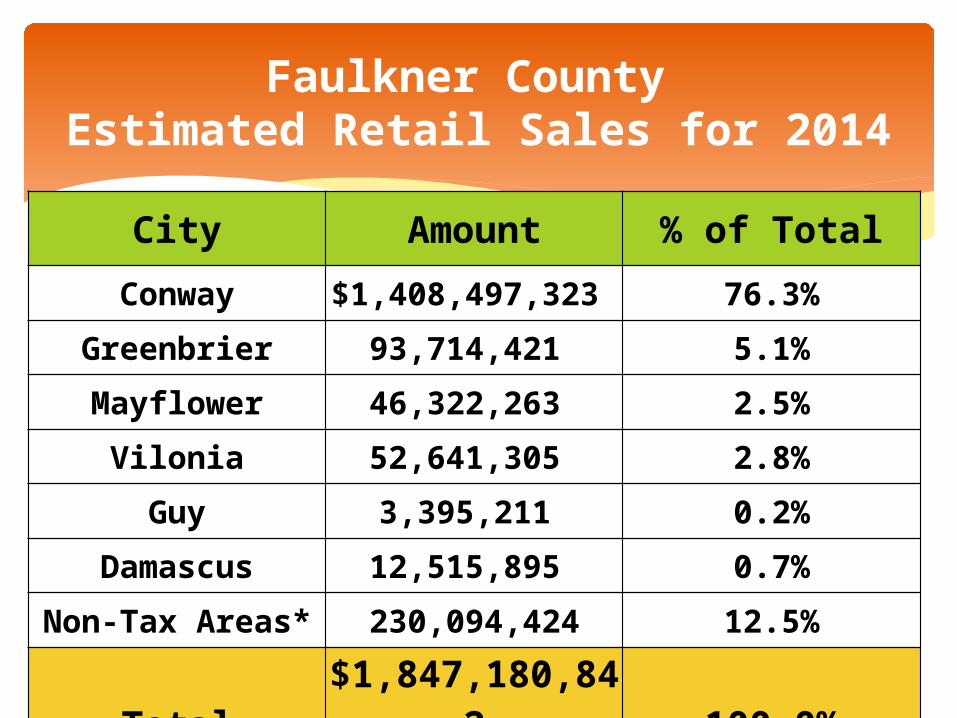
Faulkner County Estimated Retail Sales for 2014
City Amount % of Total
Conway $1,408,497,323 76.3%
Greenbrier 93,714,421 5.1%
Mayflower 46,322,263 2.5%
Vilonia 52,641,305 2.8%
Guy 3,395,211 0.2%
Damascus 12,515,895 0.7%
Non-Tax Areas* 230,094,424 12.5%
Total$1,847,180,8
42 100.0%

2010 2011 2012 2013 201416
16.5
17
17.5
18
18.5
19
19.5
17.4
18.6 18.7 18.6
19.3
Sales in Millions of Dollars
Conway Hotel Sales

Hotel Total Sales
Hilton Garden Inn $2,581,390 Holiday Inn Express 1,884,761
Fairfield Inn 1,741,328
Hampton Inn 1,497,548
LaQuinta Inn 1,267,347
Total $8,972,374* Based on Advertising and Promotion Tax
Top 5 Conway Hotels by2014 Annual Sales

2010 2011 2012 2013 20140
20406080
100120140160180200
131.4144.7
153.4 156.7176.3
Sales in Millions of Dollars
Conway Restaurant Sales

Restaurant Total Sales
Chick-Fil-A $4,419,80
5Chili’s Bar & Grill #1067 4,043,730Cracker Barrel 3,865,830Golden Corral 3,714,666TGI Friday’s 3,408,720McDonald’s #29917 Salem Rd. 3,270,456McDonald’s #32901 Dave Ward Dr. 3,141,075McDonald’s #2872 Oak St. 2,789,307
McDonald’s #10667 Hwy 65 N 2,789,307Marketplace Grill 2,604,547
Total$34,056,2
45
19.3% of Total Sales
Top 10 Restaurants by2014 Annual Sales

2008 2009 2010 2011 2012 2013 2014
$1,374,715,000.00
$1,462,019,000.00
$1,582,979,000.00
$1,641,056,000.00
$1,647,492,000.00$1,596,876
,000.00
$1,744,832,000.00
Total Deposits (Billions of Dollars)
There are fifteen banking institutions in
Faulkner County
with 58 offices.
Bank Deposits

Centennial Bank
31.5%
First Se-curity Bank
29.80%
Regions Bank
8.90%All Others29.80%
Bank Deposits
The top three
banking institution
s hold 71% of the
market share.
Bank Market ShareFaulkner County

Bank Return on Assets and EquityBank Return on
ssetsReturn on
Equity
Fort Sill NB 2.12 19.74
First Security Bank 2.22 16.96
Bank of the Ozarks
2.05 14.70
U S Bank 1.46 13.67
Centennial Bank 1.70 12.71
First Arkansas Bank
2.06 11.02
Delta Trust 1.02 10.53
First Service Bank 1.04 8.33
Regions Bank 1.13 8.23
Eagle Bank & Trust
0.86 8.22
Simmons First NB 0.79 7.74
Arvest Bank 0.83 7.53
Bank of America .085 6.85
Home Bank of Ark 0.24 2.58
River Town Bank -0.03 1.77

1990 1995 2000 2005 2010 2011 2012 2013 2014
39
51
65
76
89 91 9397
109(in thousands of vehicles)
Faulkner County Motorized Vehicle Registrations

0
10,000,000
20,000,000
30,000,000
40,000,000
50,000,000
60,000,000
70,000,000
80,000,000
90,000,000
100,000,000
$1,314,723
$27,468,97
0
$54,484,82
1
$58,905,88
3
$40,670,199
$62,685,91
4
$89,318,68
5
Arkansas Severance Tax RevenueIn Millions of Dollars

Faulkner County
2014: $296,411 2013: $224,455
The City of Conway
2014: $363,8372013: $276,523
31.6% Increase
32.1% Increase
Municipal HighwaySeverance Tax Distribution

Van Buren 1586
White 1281
Conway 1141
Cleburne 993
Faulkner 399
Fayetteville Shale2014 Well Production
County Number of Wells
577 total wells have produced a total of
5,538,172,105Thousand Cubic Feet
of Natural Gas

Total since 2010: $2,221,225,338
2010 2011 2012 2013 2014360
380
400
420
440
460
480
500
459.9
474.9
452.2
432.9
401.3
Sales in Millions of Dollars
Arkansas Scholarship Lottery Sales
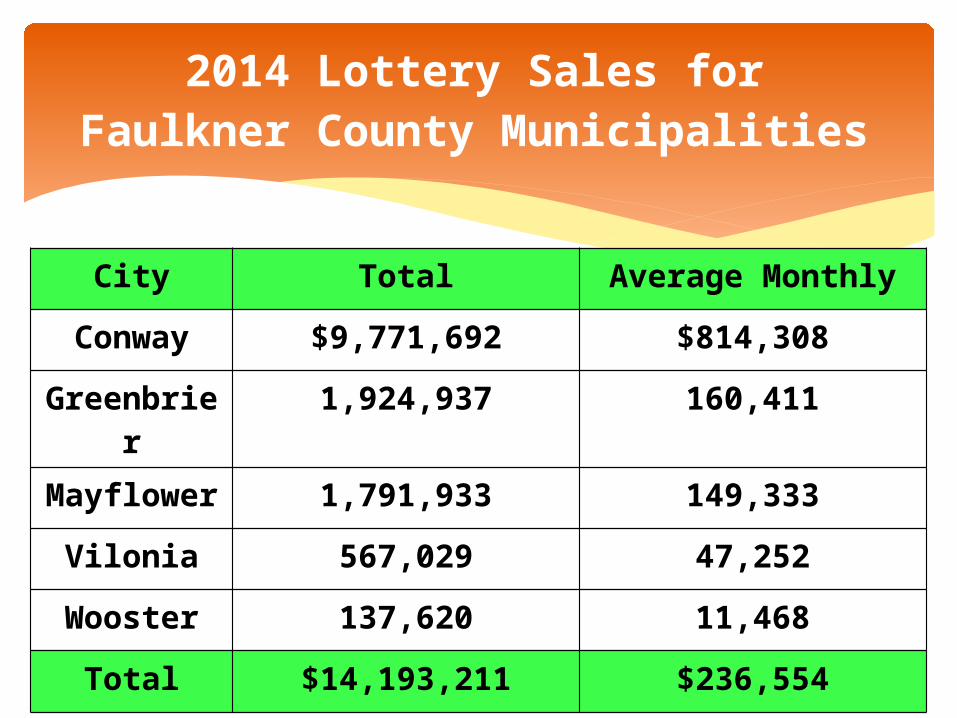
City Total Average Monthly
Conway $9,771,692 $814,308
Greenbrier
1,924,937 160,411
Mayflower
1,791,933 149,333
Vilonia 567,029 47,252
Wooster 137,620 11,468
Total $14,193,211 $236,554
2014 Lottery Sales forFaulkner County Municipalities

Type Total # of Employers
Total # of Employees
Average Annual Wages
Government 56 6,841 $36,487
Private 2,753 33,366 $37,159
Total 2,809 40,207 $37,044
Employment & EarningsFaulkner County 2014

CropIncome from Production
Sold% Change 2013-
2014Beef $10,000,000 77.78%
Greenhouses 5,000,000 0.0Rice 2,325,757 14.4
Soybeans 2,300,550 55.4Wheat 1,235,000 -29.3Dairy 960,000 0.0Hay 800,000 -4.8Corn 478,000 -39.0
Forestry 600,000 0.0Fruits &
Vegetables 500,000 0.0Hogs 72,000 0.0Silage 0 0.0
Total $24,271,307 23.6%
Agricultural Production

Category2013
Statistics%
ChangeVisitors Trips 347,876 -0.65
Total Travel Expenditures $82,144,009 0.88
Expenditure per Visitor $236.13 1.54
State Tax receipts $5,031,742 0.74
Local Tax Receipts $1,378,042 0.7
Number employed 936 -1.58
Payroll $15,307,529 0.8
Average Annual Pay $16,354 2.42
The Effects of Tourism on Faulkner County


Questions?

Thank you!