Design and Evaluation of Targeted Biosecurity Surveillance Systems

APEC WORKSHOPS ON BUILDING BIOSECURITY PLANNING AND
SURVEILLANCE CAPACITY FOR APEC MEMBER ECONOMIES
August 15-20, 2005 The Legend Hotel, Kuala Lumpur, Malaysia
LIST OF PAPERS AND PRESENTATIONS
B. SURVEILLANCE CAPACITY WORKSHOP
APEC Agricultural and Technical Cooperation Working Group
2005

Reproduced electronically in April 2006 © 2005 APEC Secretariat Produced for APEC Secretariat 35 Heng Mui Keng Terrace Singapore 119616 Tel: (65) 67756012 Fax: (65) 67756013 Email: [email protected] Website: www.apec.org APEC#205-AT-04.2
SURVEILLANCE WORKSHOP – LIST OF PRESENTATIONS
Session I 1. Pest Pathways from Borders to Rural
Agricultural Zones Dr. Phaul Pheloung
2. Why Do We Survey? Dr. Graeme Evans
Session II
1. Questionnaire Findings on Current Surveillance Capacity in APEC Member Economies Elizabeth Asteraki
2. Role of Surveillance in Accessing International Markets Asna Booty Othman
3. SPS : The Cost of Compliance Wan Normah Wan Ismail
Session III
1. Introduction to Surveillance Guidelines Dr. Graeme Evans
2. Role of Statistics in Surveys Mr. Kalaivanan
Session IV
1. Insects and Other Arthropods Yusof Othman
2. Plant Pathogens Dr. Lum Keng Yeang
Session V
1. Considerations in the Field Dr. S. Soetikno
2. The Guidelines in Practice in Thailand Dr. Paul Pheloung
Session VI
1. Member Economy Presentations on Identifying Market Access Negotiations that are held up
- Australia - Indonesia - Japan - Philippines - Thailand - Malaysia

Session VII
1. Opportunities for Regional Collaboration - A Surveillance Network? Dr. Graeme Evans and Dr. Paul Pheloung
Workshop Summary and Recommendations

APEC Workshop on Surveillance Capacity
Pathways from Borders to Rural Agricultural Zones
Dr Paul Pheloung Office of the Chief Plant Protection Officer,
Australian Government Department of Agriculture, Fisheries and Forestry A particular challenge to effective plant health surveillance is to detect a rare occurrence of a plant pest before it becomes common. This applies regardless of whether the purpose of the surveillance is to provide early warning of the presence of a new pest, to provide evidence that the pest is not present in an area or to provide reliable knowledge on the true extent of an infestation as a pre-requisite to attempting eradication. The likelihood of finding a pest, if present, is greatly improved if the surveillance methodology is based on an analysis of potential pathways for introduction and spread. In other words, look for the pest where you would be most likely to find it. A simple example of the application of this principle is to conduct surveillance for a pest in a crop that is the host of the pest or, using climate similarity modelling, in areas where the climate is suitable for pest establishment. This approach is reasonable for monitoring the prevalence of an established pest in order to make pest control management decisions, but the approach may not be appropriate if the objective is to detect the presence of a new pest. The path from introduction to a cropping situation can be quite long and the pest will probably have had time to establish to a point where eradication is very difficult or impossible. Pathway analysis can help to target surveillance by helping to identify what to look for and where to look for it.
Early Detection
Identifying target pests The commodities that are imported and the source of those commodities will determine what associated pests might be introduced with trade. In addition to being present in the country of origin, the pest would need to infest or infect the part that is traded, such as the fruit. A well known risk are timber pests that infest or infect the materials the commodity is packed in, such as wooden cartons, or the pest may simply reside as hitchhikers on the containers or vessels. A commodity based pest risk analysis is perhaps the best documented approach to identifying pests that could be the target of a surveillance program. This analysis would also take into account the effectiveness of measures employed prior to export and at the border to manage the risk. Consideration of previous experience, such as the detection of pests during border inspection or previous border breaches, can

provide direct evidence that the risk is real and warrants a post border surveillance program.
Identifying sites to survey The post border fate of an imported commodity should provide some guidance on where to survey for a pest. As an example, after clearing quarantine at the border, containers are transported to various premises in the metropolitan area for unpacking. The goods in the container, packing materials, and the container itself may harbour pests that could find suitable conditions for establishment in the vicinity of the premises. We describe these sites as secondary risk sites (the border is the primary risk site). Other examples would be importing nurseries, post entry quarantine facilities and businesses, such as timber mills, that operate close to ports and provide suitable hosts and conditions for pest establishment. The next stage in the pathway for pest introduction are the tertiary risk sites which could include transport corridors, distribution points such as wholesale markets, first stop accommodation such as campsites for international travellers, golf courses, military camps and garbage dumps. These tertiary sites would extend into peri-urban areas where small scale market gardens and farming operations may occur. The quarternary risk sites are the agricultural production areas and forests, the end point of a pest incursion. Where a survey methodology can actively attract a pest of concern, the need to identify sites based on a pathway analysis becomes less critical. For about a decade, Australia has maintained traps for exotic fruit flies and Asian gypsy moth in ports of entry throughout the country. The traps are arranged in a grid within a set radius of each port. The spacing of traps within the grid is based on a technical assessment of the effective range of the pheromone lures used.
Communication The third element of a program is to identify and then engage people that are associated with the pathway to introduction of a pest, at primary, secondary and tertiary risk sites. These would include travellers, staff employed at the shipping terminals, container warehouses, business owners, military personnel. The key elements are to raise awareness of the risk of introducing new pests, provide information on what to look for (eg pamphlets and pest information sheets) and provide a reporting mechanism such as a telephone hotline. The reporting mechanism would need to have the capacity to respond to reports, particularly diagnostic capacity.
Application of these principles in Australia The Northern Australia Quarantine Strategy (NAQS) is a program of the Australian Quarantine Inspection Service (AQIS) that has operated for over 20 years. Pathway

analysis for the introduction of both plant and animal and pests determines how the the program is delivered. This is reflected in the development of NAQS target pest lists, which focus on pests that are already established in Australia’s nearest neighbours to the north, and the location and frequency of surveillance activities by NAQS scientists. The Torres Strait Islands are close to Papua New Guinea and the risk of movement of pests with people or by natural means (eg wind) is very high. NAQS surveys are consequently very frequent on these islands. We are in the process of implementing a hazard site surveillance program in the major port of entry of each state, employing the principles described above. This will include systems to record the activities so that the effectiveness of the measures can be assessed. In an early detection program, most of the work will (hopefully) not result in a detection of a new pest. Nevertheless records of negative results can help to quantify the level of confidence that quarantine measures are effective and the pathways for pest introduction are effectively managed.
Response Upon detection of a new pest, it is critical that an attempt is made to determine the likely pathway of introduction, and then to apply trace forward and trace back analysis. This analysis will indicate where best to conduct surveillance to determine the full extent of the pest. The response to a detection of citrus canker on a citrus production property in Queensland in 2004 illustrates this principle. The pest was first detected in a quaternary risk site, a place of commercial fruit production in an isolated part of central Queensland. A reliable trace back pathway analysis could not be done however, records of the exchange of planting material and nursery stock enabled a trace forward analysis to determine that only one pathway, the movement of nursery stock out of an orchard adjacent to the infected property, had the potential to lead to a spread of the disease. A surveillance program was conducted to thoroughly examine trees in orchards that were linked to the infected area and fortunately no evidence of citrus canker was found. Surveillance in the pest quarantine area (PQA), linked properties in another area in Queensland and in citrus blocks sampled from throughout Australia provided assurance both domestically and internationally that the pest was confined to the PQA. Similarly, a fundamental component of the branched broomrape eradication campaign in South Australia involves annual surveys not only within the defined pest quarantine area but in other properties that have been linked to infected properties because of movement of machinery between these properties. As an example of a successful trace back, powder post beetle (Minthea reticulata) was detected in timber used in the construction of a house in Cairns. This was traced back to infested timber in a timber yard. Both occurrences were treated and the pest eradicated from Australia.

Conclusions The principles of pathway analysis as a means of optimising plant pest surveillance is a well understood component of a response to a pest incursion, but has not been well applied to post border surveillance for the early detection of the arrival of new plant pests. A national program that applies these principles in urban areas is being implemented in Australia.

1
Why Survey for Plant PestsWhy Survey for Plant Pests
Graeme Evans & Teresa Graeme Evans & Teresa McMaughMcMaugh
Structure of the PresentationStructure of the Presentation
Overarching Reasons for plant surveysOverarching Reasons for plant surveys–– BiosecurityBiosecurity–– Trade and QuarantineTrade and Quarantine–– Pest ManagementPest Management
General surveillanceGeneral surveillanceSpecific surveys:Specific surveys:–– DetectionDetection–– MonitoringMonitoring–– DelimitingDelimiting

2
Developing Pest Lists/Host ListsDeveloping Pest Lists/Host Lists
Done to establish baseline data on pests in Done to establish baseline data on pests in a cropa cropRequired for PRA purposes (ISPM 2)Required for PRA purposes (ISPM 2)Lists of alternate hosts Lists of alternate hosts –– also important for also important for PRA purposesPRA purposes
When is a Pest List FinishedWhen is a Pest List Finished
Presence of pests variesPresence of pests varies–– From site to siteFrom site to site–– Over timeOver time
SeasonsSeasonsGrowth stage of cropGrowth stage of crop
Developing species accumulation curves will Developing species accumulation curves will help to identify when a pest list is finishedhelp to identify when a pest list is finished

3
Developing Species Accumulation Developing Species Accumulation CurvesCurves
Record number of new pests collected at Record number of new pests collected at different sitesdifferent sitesPlot accumulated number of pest species Plot accumulated number of pest species against site surveyedagainst site surveyed–– Repeat in different production areasRepeat in different production areas–– SeasonsSeasons–– Growth stages of cropGrowth stages of crop
A Species Accumulation CurveA Species Accumulation Curve

4
General SurveillanceGeneral Surveillance
Does not involve field surveysDoes not involve field surveysA term used to describe the compilation of A term used to describe the compilation of all existing information about the distribution all existing information about the distribution of pests (see ISPM 6).of pests (see ISPM 6).–– SpecimenSpecimen--based recordsbased records–– Publications, journals, reportsPublications, journals, reports
Detection SurveysDetection Surveys
A survey conducted in an area to determine if A survey conducted in an area to determine if pests are present (ISPM 5)pests are present (ISPM 5)Involve looking for pests if not known to be present Involve looking for pests if not known to be present in the areain the areaCarried out forCarried out for–– Developing pest lists/host listsDeveloping pest lists/host lists–– Establishing Establishing PFAPFA’’ss, PFPP, PFPS, PFPP, PFPS–– Early detection of pests in areas vulnerable to Early detection of pests in areas vulnerable to
new pest invasionsnew pest invasions–– Examine for quarantine breachesExamine for quarantine breaches

5
Monitoring SurveysMonitoring Surveys
……on going survey to verify the on going survey to verify the characteristics of a pest population (ISPM 5)characteristics of a pest population (ISPM 5)Carried out toCarried out to–– Assist with pest managementAssist with pest management–– To establish and monitor an Area of Low To establish and monitor an Area of Low
Pest Prevalence (ALPP)Pest Prevalence (ALPP)
Delimiting SurveysDelimiting Surveys
………………survey conducted to establish the survey conducted to establish the boundaries of an area considered to be boundaries of an area considered to be infested or free from a pest (ISPM 6)infested or free from a pest (ISPM 6)Usually carried out to determine the Usually carried out to determine the boundaries of an infestationboundaries of an infestation
-- rather than to define an area that is rather than to define an area that is free from a pestfree from a pestDiffer from other surveys in how sites are Differ from other surveys in how sites are selected.selected.

6
The main difference between delimiting The main difference between delimiting surveys and other surveys is how sites are surveys and other surveys is how sites are selected. The initial detection site is used selected. The initial detection site is used as a starting point to determine how the pest as a starting point to determine how the pest arrived, where it originated and where it may arrived, where it originated and where it may have spread. Determining where the pest have spread. Determining where the pest may have spread will determine where may have spread will determine where surveying and resources for managing the surveying and resources for managing the pest need to be focused.pest need to be focused.

1
Results of the questionnaireSurveillance
• Is there a national database of plant pest records?20% of economies have no national database. For those economies that do have a database, it is easily accessible by NPPO• Legal requirement for anyone identifying a new pest in the country to report it to the NPPO?Only 50% of economies require new pests to be reported

2
How many of the crops grown in the country are officially surveyed regularly?
On average 75% of crops are regularly surveyedButthe range is between 27% & 100%
One economy did not survey crops but targeted specific pests.
Most countries undertake both targeted and random surveys
The frequency of staff training varied. Some economies trained staff twice a year, others once every 3-4 years

3
Most pest records conform to ISPM standards in most economies. However, only 40% of economies used GIS to specify pest location
And
Only 70% of economies had this information on a computerised retrieval system
80% of all NPPOs publish and distribute information on pests detected and their distribution.

4
Only 50% of economies have national standards or guidelines for the declaration of:Pest free areasPest free places of productionPest free production sites
However 78% of economies have the expertise to declare pest free areas
Examples of pests for which pest free areas have been established are:
Mango seed weevilCitrus cankerKhapra beetleSome fruit flies

5
In conclusion
• Most economies seem to have adequate surveillance capacity.
• However, the use of GIS and easily accessible databases is not so common.
• The questionnaire did not ask what other information economies held in their database e.g. photos
In conclusion
• Declaration of pest free areas, production sites etc. has not been done in most economies.
• A few had PFAs for only 1 or 2 pest species.
• Very few economies have declared pest free areas of production or production sites
• The reasons were not clear – a topic for discussion?
1
Role of Surveillance in Accessing International Markets
Asna Booty Othman
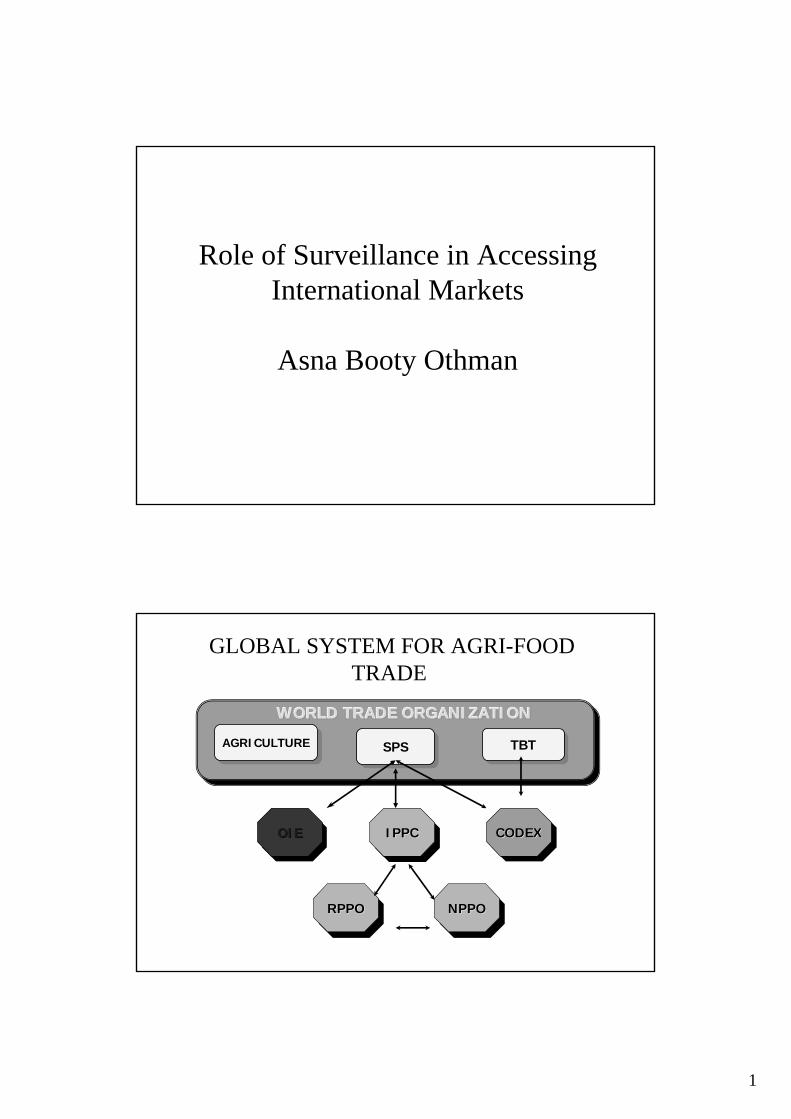
GLOBAL SYSTEM FOR AGRI-FOOD TRADE
WORLD TRADE ORGANIZATIONWORLD TRADE ORGANIZATIONWORLD TRADE ORGANIZATION
SPSSPS TBTTBT
OIEOIE CODEXCODEXIPPCIPPC
RPPORPPO NPPONPPO
AGRICULTUREAGRICULTURE

2
Responsibilities of a National Plant Protection Organization
• Surveillance of growing plants including areas under cultivation, wild flora and plants in storage or in transportationrequires collaboration with relevant scientific institutions
- reporting the occurrence outbreak and spread of pests and their control
- to respond urgently to the introduction of a new destructive pest- to determine which pests should be regulated- to develop a pest list for trading partners on request
Responsibilities of the NPPO
• The protection of endangered areas and the designation, maintenance and surveillance of pest free areas and areas of low pest prevalence.
-cultivated areas, natural vegetation and forests,-the environment from direct or indirect effects-allows for exports from areas of low or no pestswithout treatment

3
Principles for protection of plant health as related to International trade.
Surveillance : Contracting parties have a responsibility to collect and record data on pest occurrence and absence to support phytosanitary certification and technical justification of their phytosanitary measures.

4
Pest listingContracting parties “ Shall to the best ablilityestablished and update list of regulated pests...
(article VII. 2i )
Pest ReportingContracting parties….shall cooperate … to thefullest practicable extent in… the reporting ofthe occurrence, outbreak or spread of pests that may be of immediate or potential danger…to other contracting party.

5
Information exchangeContracting parties have a responsibility toprovide information specified in the IPPC List of Regulated pests (article VII.2i)- Pest reporting(article IV.2b and VIII .1a)
(IPSM 17)- Pest status (article VII.2j) (ISPM 8).
Guidelines for surveillance ISPM 6DefinitionAn official process which collects and records data on pest occurrence or absence by survey, monitoring or other procedures.

6
IPPC PLANT PESTS CATEGORIES
PESTS
REGULATED NOT REGULATED
QUARANTINE RNQP
ABSENT
NOT WIDELY DISTRIBUTED
Surveillance2 major types1. General surveillance2. Specific surveillance

7
Sources• NPPO or designated institution acting as national
repository for plant pest records• research institutions, universities, scientific bodies• producers, consultants• museums, general public, • scientific and trade journals• contemporary observations• regional and international sources
1. General Surveillance
2. Specific Surveys
• Detection- presence or absence • Delimiting- to establish boundaries of
infested or non infested area• Monitoring- ongoing survey to verify
characteristics of a pest population

8
• Host – Pest list- Pest records- Pest status- Pest reporting- List of regulated Pest (ISPM19)
Role of surveillance
Importing country use of information
- conduct a pest risk analysis (PRA) on a pest in another country
- establish phytosanitary regulations to prevent the entry, establishment or spread of a pest
- conduct a PRA on a non-quarantine pest in their own territory with a view to regulating it.

9
Exporting country use of information
- comply with import regulations- meet requests for information from other
countries for the purpose of PRA on pests in their territory
- Must apply- Only when necessary - Minimal impact- Not trade restrictive - Consistent with international standard- Based on sc. principles and evidences - Harmonised to the extent possible- Transparent / notified / non discriminatory - Safe trade , to meet the ALOP.- Justify and defend decision avoid dispute- Evaluate decision of others.
Phytosanitary Measures

10
Pest reporting1.To communicate immediate or potential danger• immediate danger -one that has already been identified
(pest already regulated) or is obvious on the basis of observation or previous experience
• potential danger- identified as the result of a PRA. 2.To communicate change in pest status3.Provide information on other pests
Pest reporting:-allows countries to adjust as necessary their
phytosanitary requirements and actions to take into account any changes in risk.
-provides useful current and historical information for operation of phytosanitary systems.
-facilitates technical justification of measures - helps to minimize unjustified interferencewith trade

11
Recommended Reporting Practices
Accurate reports are an essential part of theinternational cooperation to facilitate trade. Failure to discover and report pests, orinaccurate, incomplete, untimely, ormisinterpreted reports can lead to theestablishment of unjustified trade barriers, orto the introduction and/or spread of pests.
Establishment, maintenance and verifying PFA and ALPP. (ISPM4, ISPM 10)CP should ensure that their phytosanitaryimport requirements take into account the status of areas in exporting countries.
PFA and ALPP

12
Systems to establish pest freedom
– General surveillance-scientific and trade journals-unpublished historical data-contemporary observations
– Specific surveys-detection surveys-delimiting surveys
Phytosanitary measures to maintain pest freedom
• Regulatory action such as– listing of pest on quarantine pest list – specification of import requirements into a country
or area including buffer zones– restricting movement of produce
• Routine monitoring• Extension advice to producers

13
Checks to verify pest freedom
For verification and internal management, thecontinuing pest free status should be checked afterthe PFA has been established and phytosanitary measures for maintenance have been put in place.
– ad hoc inspection of exported consignments– requirement that researchers, advisers or inspectors notify the NPPO
of any occurrences of the pest– monitoring surveys
Documentation and Review
The establishment and maintenance of a PFA should be adequately documented and periodically reviewed.
– data assembled to establish PFA– phytosanitary regulations applied– technical details of surveillance systems used– various administrative measures taken in support of the PFA– delimitation of the PFA

14
Market Access
1. New Market Access Submission.2. Market Access Maintenance. 3. Market Access Improvements.
New Market Access Submission
• Preparation of Tech. Document- Pest Management Surveillance / Pest list / data sheet
• Conduct PRA by recipient country.

15
New Market Access Maintenance
• Activities to maintain existing markets inresponses to external threats resulting innon-viable trade or trade slow down or market closure
New Market Access Improvements
Improvements to existing market access protocol for on going trade.- New surveillance data- Review Phytosanitary measures- Modification / Removal

16
Pest Eradication Program
- one of the main activities is surveillance.- to verify successful and assurance to trading
partners.- survey data to meet their phytosanitary requirements.
6. Transparency
The NPPO should on request, distribute reports of pest presence, distribution, or absence derived from general surveillance and specific surveys.

17
DOMINO EFFECT
surveillance
pest listing
pest categorisation
pest risk analysis
scientific justification forphytosanitary measures

1
Sanitary and Phytosanitary(SPS) Measures
The Cost of Compliance
GLOBAL SYSTEM FOR AGRI-FOOD TRADE
WORLD TRADE ORGANIZATION
AOA SPS TBT
OIE IPPC CODEX

2
GovtSocial and Economic damage caused by entry, establishment or spread of pests
A Country4
CODEXrisks from additives, contaminants, toxins, pathogens in feed and beverages
Food Safety3
OIEzoonotics & plant carried diseases
Animal Health2
IPPCpest, diseases & pathogensPlant Health1
Agency(Reference Pt)
FromTo Protect
SPS measures
A Country’s Sanitary and Phytosanitary Measures)
• Apply only when necessary
• Based on scientific principles
• Must not be maintained without sufficient scientific evidence (Article 2 (2))
• SPS must also not arbitrarily or unjustifiably discriminate between countries
• SPS cannot be applied in a manner that would constitute a disguised restriction on international trade (Article 2 (3))

3
Requirements For Market Access
1. Import Requirements: eg. PRA, Low Pest Prevalence
2. Production Methods and Processing
3. Compliance (Quarantine Treatments)
4. PhytosanitaryCertification
1. Risk Assessments2. Inspection & accreditation
of establishments 3. Production Methods and
Processing4. Import Documentation &
certification5. Inspection and entry
clearance6. Quarantine7. Sampling and testing
Phytosanitary Sanitary
Processes involved for Market Access
Information
Commodity Plant Health Pest Problem/StatusTechnical DocumentsRisk AnalysisQuarantine TreatmentSystem ApproachesNegotiations
DECISIONMarket Demand
Profitability
Sustainability
Quality Inspection
$A7.99/kg

4
COST OF COMPLIANCE
• PRA • TREATMENT FACILITIES• INFRASTRUCTURE INVESTMENT• ACCREDITATION• ISPM 15
Article 5:Pest Risk Analysis (PRA)
Done Prior to importation of any agricultural goods.
Based on ISPM Nos. 2, 11, 21
e.g. to export Crysanthemum and Pineapple to Australia
PRA by Biosecurity AustraliaCrysanthemum = AU$ 60,000 (about 1 year)
Pineapple = AU$ 40,000 (2 years and not yet approved)

5
PRA for SALB• Brazil wants to export fruits (Apple, orange, Grapes)
to Malaysia and the region
• The consignment can be a ‘PATHWAY’ for SALB to
be introduced into the region.
• The region need to do PRA on SALB.
Already spent US$ 150,000 (over a period of > 2 years)
(may take 5 years to resolve the issue)
E.g of COST IMPLICATIONS to carry out PRA
•Thailand’s durian to Australia - 9 years (1991-2000)•Malaysia’s durian to Australia - <1 years•Malaysia’s pineapple to Australia - not yet (2 years)•China’s potted plants in growing medium to U.S.A - 6 years•Thailand’s milled Rice to Mexico - 3 ½ years•China’s longan to U.S.A - 3 Years
Conducting a PRA, for a commodity is a long and tedious process and expensive. Requires: Technical Information, research studies, consultation, expertise, Bilateral discussion
COST- RANGES FROM US$ 50,000 – FEW MILLIONS

6
Treatment Facilities
• Exporters have to establish facilities to meet
treatment requirement for pest disinfestation
• Countries impose specific treatment
for export of same product, e.g for Papaya:
Japan - Vapour Heat Treatment (US $ 200,000)
China - Hot water Treatment (US $ 100,000)
Others - ? ? E.g irradiation
ACCREDITATION COST
• Cost to Malaysia to carry out surveillance for(“ Low Prevalence of White Rust Disease”)
• = US $ 7,000 (T&T and salary)• = US$ 20,000 (For AQIS to visit and accredit
the farms)• Additional infrastructure cost for farm/
packing house improvements (>US$ 200,000)

7
05000
10000150002000025000300003500040000
2002 2003 2004
Total number of PC issued
Year
Cost Implication ISPM 15: Wood Packaging Material
Long Horned Beetle Pinewood Nematode
ISPM 15 - COST OF COMPLIANCE
• Cost increase by 15 -20 %• Increase in cost for industry not normally regulated• Losses due to time factor• Service providers unjustifiably increase cost of
treatment• Some less developed economies do not have
treatment facilities – trade disrupted

8
Challenges of Developing Economies :
• Lack of Regulatory framework to take into account SPS commitments
• Uncoordinated organisation/administration for implementing
SPS measures
• Inadequate infrastructure to implement SPS measures
• Limited Knowledge Base
• Lack of funds for implementation
• Inability to effectively participate in Standard Setting Committees
• Inadequate SPS information Data Base
• *Limited benefits derived from the SPS Agreement
1. Further Strengthening of national food control system
- Food Quality and Quality Assurance scheme
2. Plant and Animal Health Infrastructure
- Surveillance, Inspection and approval procedures
3. Farm Improvement (Good Agricultural Practice)
4. Phytosanitary Accreditation Scheme for Farms &
Packing House5. Efficient marketing chain (Refrigeration facilities)6. Transportation (competitive air cargo charges)
To Improve Market Competitiveness Requires:

9
Challenges to developing economies for market access
Food QualityFood Safety
Change
Global trade
Environment
SPS
Marine ProductsFruitsVegetables
Demand (US,EU, Japan)
Shift to ready to consume
HACCP
Many cases of rejection- importers and - domestic consumers
Food ContaminationInadequate labellingOutbreak of diseasesGMO in FoodPesticide Residues
$
Consequencesof SPS Non compliance
• Goods destroyed• Goods refuse entry• Treated on arrival• Penalty• Delay of clearance• Quality affected
IMPACTTotal Trade loss
Additional Cost
Credibility of stakeholder

10
To implement SPS1. Administrative Set Up
- reorganize or revamped- adequate number of staff
2. Legal Framework (Legislation)- national legislation to take into account international standards/requirements
3. National Capacities – expertise to carry out : research on crop protection and quarantine treatments, PRA, diagnostic, surveillance etc- Adequate Funds
- Establishment of plant health information and pest reference collection
Thank You

1
Introduction to the Surveillance Guidelines
Graeme Evans and Teresa McMaugh
Office of the Chief Plant Protection Officer (OCPPO), Australian Government Department of Agriculture, Fisheries and Forestry
INTRODUCTION Most international trade in food products is conducted under the rules of the World Trade Organization (WTO) as set out in the Agreement on the Application of Sanitary and Phytosanitary (SPS) Measures. It has become increasingly apparent that trade in these commodities is constrained by deficiencies in the basic infrastructure underpinning plant health, particularly in the developing countries that have not enjoyed the same growth in exports of agricultural commodities as the developed countries. The problem arises because developing countries often lack the technical capacity and resources to:
• Survey for pests to provide baseline data on the health status of plant industries;
• Accurately and rapidly identify pests; • Database records of pests and retrieve this information when needed; and • Detect and control invasive pests.
Responding to the problem in the ASEAN region, the Office of the Chief Plant Protection Officer (OCPPO) has developed a program of work that focuses on building the arthropod pest collections, plant disease herbaria and plant pathogen collections in Member countries. The Office has been supported in this endeavour with generous assistance provided by the Australian Agency for International Development (AusAID). The rationale for the work on building these important biological collections is to address the Australian Government’s policies of promoting the liberalisation of international trade and of addressing pest threats off-shore. The work program also reflects a growing awareness in many countries of the threats posed by invasive alien species and the opportunities to mitigate pest threats through biosecurity planning, robust quarantine action and a capacity to address exotic pests that cross national borders. Well-populated collections of arthropod pests and plant pathogens contain multiple entries of the same pests from different hosts and from different geographic and production areas, and represent the pests that exist in a country. A capacity to survey for plant pests is critical to populating pest collections. With this in mind, the OCPPO has been collaborating with countries of the ASEAN region to build the capacity of plant health scientists to survey for plant pests. A manual providing guidelines for surveying for plant pests in south east Asia and the Pacific was seen as a useful approach. The Australian Centre for International Agricultural Research (ACIAR) and the Rural Industries Research and Development Corporation (RIRDC) generously supported the task of writing of the guidelines. The project was led by Dr Teresa

2
McMaugh, with support provided by her colleagues in the OCPPO and national and international collaborators. Developing the Guidelines In November 2004, a workshop as convened in Australia that was attended by thirty-five plant health scientists from Australia, south east Asia, the Pacific and the to discuss the content, scope and direction of the guidelines and the needs of regional plant health scientists in order to target the guidelines to the correct audience. Recommendations from the workshop participants were that the guidelines: Align with international standards and requirements, such as the FAO ISPMs,
where possible Provide clear guidance as to how to comply with the standards Be instructive and simple Be ‘guidance’ rather than a ‘manual’ which could be enforceable and
constraining That the guidelines not provide detailed information on statistics or specimen
collection as these can be found elsewhere. That the guidelines place strong emphasis on reporting the survey That the guidelines contain case studies of surveys that are performed in the
region Content of the guidelines The guidelines target plant pest surveillance in crops and forests where pests
include weeds, plant pathogens, insects and their allies. The guidelines use the terms and definitions in ISPM 5 to align with international
standards for plant pest surveillance. The guidelines cover:
• Designing Specific Surveys • Designing General surveillance plans
With more details in chapters on: • Detection surveys • Monitoring surveys • Delimiting surveys • Reporting the results (Figure 1)
An appendix has been included of 23 regional and Australian survey case studies. The main guidance is provided on how to design, implement and analyse specific
surveys for plant pests. This is laid out in 21 steps that can be followed according to the purpose and nature of the survey to be designed (Figure 2). Advice is provided as to how to approach such aspects as identifying field sites,
applying statistics, collecting specimens, coping with field conditions, data analysis and reporting. Availability of the guidelines The final draft has been completed and is being edited by the funding body,
ACIAR. The guidelines are to be translated in Thai, Vietnamese, Bahasa and Spanish in
CD format.

3
ACIAR will publish and distribute the guidelines. The guidelines will be made freely available to people in developing countries.
Figure 1. Chapter structure of the guidelines.
Chapter 1 - Introduction
Chapter 2 – Specific surveys
Chapter 5 – Delimiting surveys Chapter 4- Monitoring surveys
Chapter 7 – Reporting the results
Chapter 6 – General Surveillance
Chapter 3 – Detection surveys

4
Figure 2 : The components of designing a specific survey in 21 steps.

1
STATISTICS IN PEST SURVEILLANCE
Building Biosecurity Planning and Surveillance Capacity For APEC Member Economies, 15-
20 Aug 2005Kalaivanan Nadarajah
2
Abundance of Raw Data
• Millions of raw data from surveillance (from systematic sampling)
• Temporal data• Spatial data• Population and Sample data• Remote sensing• Calculate basic statistics create a
map

2
3
Guide lines -Teresa McMaugh
• ISPM - delimiting survey-outbreak, detection survey-noxious, general surveillance - info on regular pest, monitoring survey – specific pest-pop /ongoing
• general surveillance – early detection• designing survey• Target pest list – concern list, incursion, risk
assessment, production, quarantine pests etc.• Eg. Rice pests surveillance system – reduce
economic loss• Can develop MOP for each country based on
local needs• Farm size, type of pest and type of survey
4
Statistical Application• Survey Design• Site selection• Pests list -prevailing• Forms• Accuracy of survey methods; sweep net,
vacuum, trap (light t., hormone t.), visual counting etc.
• Sampling, Level of processing & analyzing data
• Confidence and Validity

3
5
Statistical Tools
• SAAS, QM, SPSS etc• Excel Spread sheet, dBase• Mapping software • Sampling tables, random no.• Linear programming• Forecasting• Hypothesis Testing, Regression
Models
6
Presenting Averages – No Good !
• Averages to conclude pest status! • Averages to make control decisions!• Averages only for compiling data for a
small plot or say 10 hills of rice from a spot
• Info on Spread of data is important for mgt
• Details on variables, measurement, accuracy and confidence level

4
7
Data Presentation• Array (simplest) can create class
interval• Frequency distribution histograms• Measure of central tendency mean,
median, mode• Measure of variability range, SD,
variance, CV• Measure of data Level of Scale;
– nominal, ordinal, interval & ratio
8
Principles to explore!
• Descriptive statistics from raw data• Inferential – inductive statistics from
samples• Sampling and methods accuracy• Hypothesis testing & testing models• Forecasting (time series data)

5
9
Sampling – Random/Systematic• Sampling -Full, Random, Stratified, Systematic,
insect trap• Stratified random sampling to select number of
plots in each district / village• Simple random sampling to choose plots• W, U or zigzag to collect samples• Stratification (better option)
– Expert opinion-when, frequency, where and how– Discriminately– Practicality- Manpower,,Physical factors,Urgency,Cost
factors
10
Sampling – Random• Simple random sampling to choose plots - random
no. table in p.46 (several ways of selecting no. from the table of 5 digits)
• Systematic sampling within the plot !• Sampling frame• Sample size eg. From Krejcie & Morgan’s• Look out for selection bias, counting bias, recall bias,
sampling error• Sample size for measuring the proportion of sites
infested with pests –GPPS p.56• No. of plots infested with pest? expressed in %• To cal. no.of pest/unit area – count of pests /unit area
& where pests are numerous, consider scale of coverage or scores

6
11
Actual / Design / Estimated Pest Level
• Actual Pest level – true pest pop or true proportion of infest units
• Estimated pest level – from survey• Design pest level - from pre-survey estimate (0-
100%) to determine sample size. If over estimated – sample no. too low!
• Statistical confidence is the probability that the actual pest level will be within the range of the design pest level.
• Monitoring Survey. Design pest prevalence 20%,CI=0.95,Z=1.96(Normal distribution)
• Sample size = (1.96 / 0.05) 2 x 0..2 (1- 0.2) = 246
• Design threshold of 95% acceptable p.57,58
12
Confidence Level
• Eg. Pest status 20% CI 95% means + 5%, actual pop is likely to occur within the chosen level of CI eg. 46.5% (95% CI:44.2-48.8).
• 95% detection threshold is considered acceptable• Confidence is usually expressed as an interval of
values within which the actual prevalence is likely to occur with the chosen CI.
• Eg. A pest level of 46.5% with a confidence of 95% can be expressed as: 46.5% (95% CI: 44.2-48.8%)

7
13
Sampling – Systematic • Walking and examining hosts in a W, diagonal or
zigzag pattern across the field makes sampling sufficiently random to chosen sites (GPPS p.44)
• Sample no. is proportionate to the population• Move the starting point by one row to avoid
repeat• Every 10th row, 3rd farmer, 2nd canal etc• Independence – intervals of sampling and
expected pest distribution. Eg. Regularly spaced out sites should not coincide consistently with the presence or absence of a pest (GPPS,p.43)
14
Record Forms
• Farmer level processing (mgt unit)• Center level processing (monitor pest levels,
practices, controls within a locality)• Regional /national level - monitoring & advisory• Format – standardization for processing/comparing• What data to record – GPPS p.64 Eg. GPS grid….• Design a form – GPPS p.65• Consider sample size, coverage, practicality, date,
position /GPS Xref & format for input to PC• Scale of intensity & smallest unit

8
15
Central tendency: mode and median
• Mode: Most frequent mark (Note: there may be multiple modes)
• Median: score from the middle of the list when ordered from lowest to highest. Cuts data into halves (doesn’t take account of values of all scores but only of the scores in middle position).
Statistics
mark87
054,6256,00
55a
ValidMissing
N
MeanMedianMode
Multiple modes exist. The smallest value is showna.
16
Spread of distributions

9
17
Spread of the population: variance measures
• Variance: sum of squared deviations from the mean Variance =
• Standard deviation: square root of variance
18
Skewed distributions and measures of central tendency

10
19
What kind of tranformation?
e.g.f(x) = x1.5
e.g.f(x) = log(x)
Transformation
20
Standard Normal Curve• Since all normal distributions have the same normal
curve we can use standard normal curve to analysis this distribution, take advantage of the symmetry & the SN table
• The standard normal curve; mean= 0, standard dev = 1. The values along the X-axis is given a Z score.
• Changing x values into Z score (how far fr mean)
• SD is also none the Std Error• Total area under curve is 1, area to left of a Z score
(%) or % of values bet say Z=2.0 to -2.0!

11
21
Normal distribution (Gaussian distribution)
• Example: IQ scores, mean=100, sd=16
Mean = Median = Mode
22
Data Analysis
• Basic statistics to describe pest pop• Estimate confidence of data collected• Create map• Examine changes in pest location and
density over time

12
23
Hypothesis testing• Quantitative statement about a pop or statistical
statement about the probability distribution of a random variable
• Type 1 &Type II error – test must minimize errors by sample size and significant level
• Answers questions about a population or subject of study.
• How is pop of BPH influenced by plant pop, fertilizer rate, crop age, other pest pop, rainfall etc.
• How is the Frequency of surveillance influenced by factors such as farmers edu level, age, farm size, pest symptoms, method of surveillance etc.
24
Freq of surveillance
Theoretical FrameworkEducation level / Age
Farm size
Level of Symptoms/ pest level
Method /Type of surveillance
Irrigation Block

13
25
Dependent and independent variables
• Independent variable:– Variable(s) manipulated by the experimenter– experimenter determines the values it will assume– Independent variables may have a number of different
levels• Dependent variable:
– Subject of Study Eg. Frequency of surveillance, BHP pop, Staistical Application in Surveillance
Important that you measure the right thing and not something else!(validity)
26
• Cross tabs to tabulate the diff gps of var both dependent and indep to test how they group or match
• Pearson Chi Sq. tests – to investigate the rel bet 2 nominal var
• Independent sample T test – to investigate if there is a diff bet 2 gps of independent var for a particular test var.
• One way ANOVA – to investigate if there is a sigdiff bet gps of >2 (eg. Irri blocks) on pest level (interval scale)
• Linear Regression – to explain how much of the variance in Freq of surveillance is explained by ind var such as

14
27
Hypothesis Testing 2
• Directional or non directional• Directional hypo. Postulates a sig. + or – relation
bet 2 variables. • Linear Regression analysis – to establish which
factor contributes sig. to the variance in surveillance freq.
• Multiple Regression Analysis – to regress all 3 independent var. to explain if all 3 var together will sig. explain the variance in surveillance freq.
28
Testing Relations – various tests
• Pearson correlation matrix• Regression model• T test – any sig difference bet 2 groups eg. High &
low education gp. on the Freq of surveillance at least 1 on interval or ratio scale
• One way ANOVA to see if there is any differences bet > 2 gps Eg. Types of surveillance (3 types)
• CHI SQ to prove relationship (strength of rel. between 2 variables in nominal scale Eg. Block A and Block B with Freq of surveillance.

15
29
• Perform cross-tabs for all to visualize relations• Surveillance freq – both interval & nominal data
(high/low)• Edu level / age – nominal (high-low)• There Is no rel bet SF and the diff Edu level / age (SF is
dep on the diff Edu levels!)(i)T-test - any sig. diff in mean values, interval & nominal
(ii) Cross tabs & Chi sq test sig relationship? using both nominal.
• There is no sig diff in SF bet the diff Edu level / age (There is a sig + corel bet SF & the edu gps)(i) T-test using SF interval and Edu. Nominal (ii) Cross tabs and chi sq. using both nominal
• There is no rel bet SF and the diff Surveillance methods ( Eg. 3 methods) or ( 4 diff irri blocks)One-way ANOVA - any sig. diff in mean values, interval & nominal
Testing Relations – Level of scale
30
Research Hypothesis
• Is there any correlation bet SF and farm size –use bivariate Pearson correlation (-1.0 to 1.0)
• The 4 independent variables of edu level, farm size, sur methods & symptom level will sig. explain the diff in Freq of Surveillance– Regression-multiple correlation – R2 value– F statistic produced is sig.
• Level of Symptoms/ pest level Is more important than others in in significantly explaining the differences in the Freq of Surveillance
• Farmers with a larger farm will show higher SF?

16
31
Null-hypothesis H0
• phrased to negate the possiblity of a relationship bet. the independent and dependent variables
• If the null-hypothesis is true, there is no interaction bet dependent & independent var.
• Alternative hypothesis contradicts null-hypothesis• Statistical tests of significance• If that probability is sufficiently low, the null
hypothesis can be rejected - provides evidence for conlcuding (with a specified risk of error) that there are no real differences between conditions in the population
32
Variables
• Define variables• Measure variables. Can convert interval
scale to nominal scale eg. high-low • Use t-test for groups of 2 & one-way
ANOVA for gps of >2.• Refer theories and research work• Do descriptive study – don’t explore
concepts yet unless you are ready!

17
33
Forecasting
• Moving average provides a more prominent trend than the raw data
• Trend line eg. Y= a+bT, alone not accurate
• Forecast = T x C x S (multiply the different index)
• Use data from 1st, 2nd, 3rd season etc
34
Validity/Data collection/ Pre test
• To ensure that measures are adequate and representative and actually taps the concept, criteria and construct are evaluated for validity.
• Face validity of instrument used – done by experts
• Goodness of measure• Method of data collection• Pretest

18
35
Regression Pest/Surveillance Models
• University and research bodies produce unlimited regression models on many pests, surveillance
• Test it out !• Can’t adopt for other pests
36
Challenges –Operationalize Statistics
• Constrains- physical & logistical. Eg.small farms, low edulevel of farmers cf. to Australia
• Process data at nearest office/center - Insists on localized data process and recommendations
• Feed-back to farmers on survey summary• Make available statistical tools and com. Tools• National electronic repository on survey data• ISPM standards, protocol, standardize systematic
sampling by crop, stratified random sampling• Experiment with Hypothesis testing to make
recommendations

INSECTS AND OTHER ARTHROPODS SPECIMEN COLLECTION 1.0 Introduction 1.1 The class Arthropoda includes insects, spiders, mites and their relatives is the most successful group of organisms on the planet. Insects alone accounted for about 55% of all known species (Barrowlough, 1992). There is a great significant in the study of arthropods. It inhabits every terrestrial habitat on the planet and plays a major role in the evolution and maintenance of biotic communities. They are primary beneficial organisms such as pollinators, predators, parasites, consumers and recyclers of decaying organic matter and integral components of the food webs of vertebrates and others invertebrates. However, a small numbers of arthropods are responsible for enormous economic losses annually attacking crops and ornamental plants, cause damage to our food and clothing and vectoring diseases, that effect cultivated plants, pests, livestock and ourselves.
1.2 The purpose of colleting arthropods is to preserve the diagnostic features for identification and for display in museum or exhibition. However, the collection records are significant important to assess or measure biodiversity and provide reliable evidence of the plant health status of a country. These records are the foundation for developing conservation strategies, policies for domestic and international quarantine and for developing pest management strategies at farm level. A country that cannot provide an adequate description of their pest species status of its agricultural industries is at disadvantage when negotiating access to foreign markets. Extensive biological collections and records are the key for developing countries to negotiate the developed countries on a level playing field.
1.3 This paper provides a summary of the methods and techniques used to collect and preserve insects and other arthropods specimen for study. Many of the methods covered have not change for the last hundred years except specialized techniques that became available in the last few years or decades. Most of the specimen collection techniques were extract from the manuals written by Steyskal et al. (1986), Martin (1977) and Upton (1991). 2.0 What Insects and other arthropods to be collected 2.1 Because of their incredible diversity, insects, mites and other related groups vary widely in their habitat, collecting requirement and methods. The species and amount of specimens to collect depend on the purpose for which the materials are intended. When starting a collection, every specimen they can find should be collected. However, for preparing pest lists and plant health status determination only specimens that are related to the commodity are collected. 2.2 The minimum number of specimens per species should be 20 specimens but larger numbers are required if there are variation on the color, shape or biotype. If adults and immixtures are present, specimen should collect of all life stages. Excess specimens can be discarded or exchanged but it is not always possible to collect additional specimens when needed. Frequently insects and mites cannot be identified accurately from immature stages and it is necessary to rear them to adult stage to obtained precise identification.

2
3.0 Collecting Methods and Equipment 3.1 Collecting methods may be divided into two broad categories. In the first, the collector actively searches out the insects and mites using nets, aspirators or beating sheet. In the second, the collector participates passively and permits traps to do the works. Both approaches may be used simultaneously. The use of variety of collecting methods will help in maximize the number of specimen taken especially when briefly visiting is schedule to the selected areas. 3.2 The equipment used to assemble a general collection need not be elaborate or expensive. In many instances, an insect sweeping net and several killing jars will suffice. However, for more effective sampling of a particular fauna, a more complete set of tools should be prepared and place in collection bag or vest. The following items are usually include in the general collection’s bag:
1) Forceps 2) Vials containing alcohol or preservative 3) Killing jars of various size 4) Small boxes or containers for storing specimens 5) Small enveloped for temporary storage of delicate specimens 6) Gel caps for tiny specimens 7) Aspirators 8) Absorbents tissues 9) Notebook and writing equipment 10) Strong knife for opening gall, seed pods 11) A pair of scissors for cutting labels 12) A small fine brush (camel’s hairs) to pickup minute specimens 13) Bags for storing plant material, rearing material or Berlese samples. 14) Hand lens
3.3 The items may be modified or added accordingly base on the type of insects or mites to be collected. A small digging tool or trowel may be useful for the collection of soil insects or pruning saw for collection insect trunk borer.
3.4 In addition to the items in the collection bag, tools such as insect sweeping net, traps of various types, insect cages and berlese funnel are needed to assist in the effective collection of arthropods.
4.0 Temporary storage of arthropod specimens 4.1 After specimens have been collected, often time is not immediately available to prepare them for permanent storage. There are several ways to keep them in good condition until they can be prepared properly. The method used depends largely on the length of time that the specimens may have to be store temporarily:
i) Refrigeration and freezing
4.2 Medium to large specimens can be left in tightly closed bottles for several days in a refrigerator and remain in good condition for pinning. Avoid condensation of the water vapor by placing absorbance paper in the bottle.

3
ii) Dry Preservation
4.3 Hard-bodied specimens can be place in small boxes, paper tubes, triangles or envelopes for an indefinite period, allowing them to become dry. When they are ready to be pinned, place the specimens in a relaxing box so that their body parts may be rearranged or repositioned.
iii) Papering
4.4 Papering method is the placing of large adult specimens of Lepidoptera, Trichoptera, Neuroptera and Odonata with their wings folded together in folded triangles or small rectangular envelopes make of glassine paper. The specimens can be kept for weeks, when they are dry. The specimens should allow to relax before pinning.
iv) Liquid preservation
4.5 Preserving arthropod specimens in alcohol is a complex subject. The technique varies from one group to another. For example, spiders preserve well in ethanol but tend to become too flaccid in isopropyl. The opposite is true for many myriapods. In general, 70 percent ethyl alcohol is used to preserve soft-body insects such as aphids, springtails, thrips, mayflies or silverfish and many immature insects such as caterpillars, beetle and wasp larvae. If placed on pins, most soft-bodied insects will shrivel or decompose. Prior to preserving soft-bodied specimens for the long term, their color must be “fixed” or they may fade or blacken. The “fixing” process prevents, reduces or delays color change.
iv) Preservation for molecular studies
4.6 In general, specimens for molecular study should be collected in 95 percent or absolute ethanol to preserve the DNA and other molecules. For longer storage, the specimens should be thoroughly dehydrated by changing the alcohol a couple of times.
5.0 Mounting insects and Mites 5.1 Specimens are mounted so that they may be handled and examine with the greatest convenience and with least possible damage. Well-mounted specimens enhance the value of a collection and its research value depends on how well they are prepared. Although the style and technique of mounting vary from one to another, the method discuss below are currently accepted practices.
i) Direct Pinning 5.2 Direct pinning refers to the insertion of a standard insect pin directly through the body of an insect. This standard pin is a specialized pin made of stainless steel and come in several sizes from 00 to 7. 5.3 The proper way to pin an insect depends on the type of insect that you have collected. The pin is position just slightly to the right of the midline of the insect. Specimens should also be level and squarely mounted on the pin. The use of a pinning block will help in obtaining proper height and positioning.

4
5.4 Very small insects (less than 3/16 inch) should either be pinned with tiny needles or glued on their right sides to tiny triangles paper. The latter procedure is called pointing. When pointing, first push a regular insect pin (No. 2 or 3) through the butt end of the triangle. Level the triangle by pushing the pin through the hole in the highest step of your pinning block. Bend the tip of the paper triangle slightly downward with a forceps and touch it to a tiny drop of glue or clear fingernail polish. Pick up the small insect carefully with forceps and mount it by touching it on its thorax (right side) to the drop of glue. Adjust the insect so that it remains squarely in position, and then allow the glue to dry. 5.5 When pinning butterfly, moth dragonfly or grasshopper, the wings had to be spread. Spreading is done on a spreading board. Before you begin to work, cut several thin strips of paper about 1/4" wide and 8"-10" long. Once these are ready, pick up the insect by the thorax and carefully push a pin through the middle of the thorax. Adjust the position of the specimen on the pin and make sure that it is level for both on the sides and in both front and back using the pinning block. When ready transfer the specimen to the spreading board and adjust the width of the groove in the spreading board to be just slightly wider than the body of the specimen and the bases of the wings are just level with the top of the two side pieces. Slip a paper strip between the wings and use it to force the wings on one side down into position. Pin the ends of the paper down to hold the wings loosely in place. Do the same with the wings on the other side and both hindwing. 5.6 Note carefully that the rear edge of the two forewings should make a perfectly straight line across the back. The hindwings should be pinned so that the rear edge is held just slightly away from the abdomen. Position antennae with pins and if the abdomen has drooped, prop it up with pins so that it dries in a natural position. ii) Mounting specimens for microscope study 5.7 Small size mites, thrips, whiteflies, aphids, scale insects, fleas, parasitic wasps and many other insects, as well as the necessity to clearly seeing minute details of larger insects, requires examination under a compound microscope at high magnification. Such specimens or parts of specimens must therefore be specially prepared and place temporarily or permanently on microscope slides. 5.8 Generally, the specimens go through a clearing process in making them more transparent. In certain cases, staining is necessary to make colorless or transparent tissue visible. The sample is later mount in lactic acid for temporary mounting or canada balsam for permanent mount. However, there are also specialized mounting media for certain insects and mites such as hoyer mounting media. 6.0 Labeling Insects 6.1 A collection has little value unless each insect is label accurately and properly. Labeling must be done as soon as possible after collecting, pinning and mounting to avoid loss of vital information. Their precise collection locations, habitats, and data on plants on which they were found are important documentation. 6.2 Label can be written with the computer and print them off or hand written with fine point pen. Trim labels with a sharp paper cutter so the edges are nice, clean, and flat rectangles.

5
Two labels should be placed on the pin below each insect specimen. Both labels should be of the same size and lined up parallel to the length of the body of the insect. The insect head should be at the left and the label should read from left to right. However, in the case of "pointed" specimens, the labels should be parallel to the length of the point. The top label should have the name of host, plant part, district and state in which the insect was collected, the collection date and the name of the collector. The lower label should show the order, family and insect scientific name. 7.0 References Barrowlough, G.F. 1992. Systematics biodiversity and conservation biology pp. 121-143. In, N
Eldredge ed. Systematics, ecology and the biodiversity crisis. Columbia University Press. New York 220pp.
Martin, J.E.H. 1977. The insect collecting in the tropics 66 pp. Cent. For Oversees Pest Res.,
London. Steyskal, G.C., W.L. Murphy, and E.M. Hoover eds 1986. Insects and mites: Techniques for
collection and preservation. U.S. Dept. of Agric.. Misc. Pubs. No 1443, 103pp. Upton, M.S. 1991. Methods for collecting, preserving and studying insects and allied forms.
Australian Entomological Society Misc. Pub. 3 4th ed. Brisbane 86pp

1
PLANT PATHOGEN PLANT PATHOGEN COLLECTIONSCOLLECTIONS
Plant disease herbaria are dual Plant disease herbaria are dual collections, containing specimens collections, containing specimens of both the host and pathogen of both the host and pathogen ––
•• Dried or preserved specimensDried or preserved specimens
•• Culture collectionsCulture collections

2
Collecting plant disease specimens Collecting plant disease specimens ––
•• Symptoms to look out forSymptoms to look out for
•• Samples for isolation of pathogenSamples for isolation of pathogen
•• Collect specimens with full range of Collect specimens with full range of symptomssymptoms
•• Record relevant informationRecord relevant information•• Handling & transport from fieldHandling & transport from field•• Speed of deliverySpeed of delivery
Populating a disease herbarium -

3
Processing for plant pathogen Processing for plant pathogen collections collections --
Sample collectionSample collectionIsolationIsolationIdentificationIdentificationPreservationPreservation
PLASTIC SCREW CAP LID
LEAF SECTIONS
COTTON WOOL
CALCIUM CHLORIDE

4
Identification MethodsIdentification Methods
•• Light and other microscopyLight and other microscopy•• PhenotypicalPhenotypical MethodsMethods•• Indicator & Selective Media Indicator & Selective Media •• Serological Methods Serological Methods •• Molecular methodsMolecular methods•• Identification Kits & SystemsIdentification Kits & Systems
BiochemicalBiochemicalteststests

5
PCRPCR
Fatty AcidAcid Profiling

6
Metabolic ProfilingMetabolic Profiling
Metabolic Profiling for fungiMetabolic Profiling for fungi--

7
Recording specimen details Recording specimen details ––• Date & place of collection• Name of collector & contact details• Name of host plant (incl. variety, plant age, etc)• Symptoms • Plant parts affected• Number or percentage plants affected• Distribution of affected plants (single, grouped,
scattered, etc)• Other relevant information (soil type, weather,
agrochemical applications, etc)• Sample reference number
What constitutes a pest record,What constitutes a pest record,from ISPM 8 from ISPM 8 ––
• Scientific name• Life stage or state• Taxonomic group• Identification method• Collector & collection date• Collection location details• Host scientific name• Host damage• Prevalence• Bibliographical references

8
Managing plant disease records Managing plant disease records --
• Common standards• Distributed network ? • Compatible with heterogeneous systems• Funding

1
SURVEILLANCE:CONSIDERATIONS IN THE FIELD
Soetikno S. Sastroutomo
What are the benefits of surveillance?
• Enhance prospects for early detection
• Minimise costs of eradication• Necessary requirement for the country to meet the treaty obligations of the WTO and SPS Agreement (ISPM 6)

2
Types of surveillance systems
• SPECIFIC SURVEYS: important for establishing whether particular pests are present in each state/region over a defined period of time, and if so, where these occur
• GENERAL NON-TARGETED: are based on recognising normal versus suspect plant material or based on several information sources, wherever it is available
SPECIFIC SURVEYS● Includes detection, delimiting and monitoring
surveys● These are official surveys and should follow a
plan which is approved by the NPPO: a. definition of the purposeb. identification of the target pest(s)c. identification of scoped. identification of timinge. target commodity (in the case of
commodity pest lists)f. survey methodology and statistical basis

3
Types of surveillance programs
• NATIONAL SURVEILLANCE • STATE AND REGIONAL SURVEILLANCE
• FARM SURVEILLANCE
SURVEY SITESThere are 6 levels involved in site selection:
● Area● District● Places● Field Sites● Survey Sites, and● Sampling Places

4
Field Site - orchard
Place = farm
South Eastern District
Eastern DistrictMiddle
District
North-Western District
Area = Main Island of X
Example map to illustrate the concepts of Area, District, Place and Field Site
AREA: Officially defined country, part of a country, or all or parts of several countries (ISPM 5)
Several countries
A country
Part of a country

5
DISTRICT: Regions of the AREA that fall into rough groups
Figure F1. Distribution map of Oriental Fly (B. tryoni) and Medfly (C. capitata)
PLACES: farms, forests, communities, villages, ports, markets
Farms
Markets
Forests
Ports

6
FIELD SITES: fields, plantation lots, market stalls, gardens
Garden
StallPlantation lot
SAMPLING SITES: quadrats, individual plants, trees or produce, transects, trees for trap, crop rows
Individual plant
Crop rows
Tree for traps

7
Information to be recorded from the sampling sites
• Record the Area….details of climate, topography, location coordinates
• Record the District….identify and provide coordinates or define
• Record characteristics of Places, Field Sites and Sampling Sites
Choosing Survey SitesWhen the Survey Sites are known
● There is no need to decide which sites to survey
● For example, survey targeted to particular Places, Field Sites or Sampling Sites, i.e.:a. delimiting surveysb. high risk site surveillance c. some market access negotiations

8
When the Survey Sites are not known
● You need to decide which sites to survey● Your decision will depend on:
a. Logistical constraints (Time & Money)b. Physical constraints (Geography, weather) c. Likely pattern of pest spread/dispersal
● If the information cannot be determined a pilot study made be required before conducting the survey proper
Logistical and physical constraints
● You need to work backwards and identify how many Sample Points and Sampling Sites can be achieved with limitations you have:a. Staff numbersb. Time and money c. Available expertised. geography, weather and other factors

9
Pattern of spread of the pest
● Understanding how pest spreads across a crop or other sites will affect how specific surveys are planned
● Pests such as flying locusts will spread randomly throughout a crop, while others, e.g. nematodes or weeds, tend to clump in small areas of the field
Selecting Survey Sites● Rarely possible, or necessary, to survey all sites● When surveying a selection of sites a number
of sampling techniques can be used: a. random samplingb. systematic sampling c. stratified random samplingd. targeted site selection

10
Random Sampling● Involves assigning all sites a number or symbol
and then using a random number generation method, the sites are selected and recorded
●●
●●●
●●●●●●
●●●●
●●●
●●
Systematic Sampling● Involves mapping out a site and surveying at
regular intervals: i.e., surveying every 10th row of trees, every 2nd farm, setting insect lures in a grid pattern, 2 apples from every tree
●●●●●
●●●●●
●●●●●
●●●●●

11
Stratified Random Sampling● Involves dividing the sites into logical
categories and then systematically or randomly choosing sites from within categories
●●
●●●
●●●●●●
●●●●
●●●
●●
Targeted Site Selection● Sites are chosen based on where the pest is
most likely to be, thereby deliberately biasing the selection process in favour of finding the pest

12
Other sampling methods ● Convenience sampling● Haphazard sampling● Drive/walk through surveys● Worker observations● Full sampling● Remote sensing● Species accumulation curve
Timing of the survey Ideally when the pest is most likely to be present and in an identifiable state ……and may be determined by:
● the life cycle of the pest● the phenology of the pest and its host● when the pest is most active● accessibility and availability of vehicle● time of sowing, seedling emergence, etc. ● time of obvious symptoms

13
Good surveillance practice● Personnel involved should be adequately trained
in appropriate fields of plant protection and data management
● Personnel involved should be adequately trained and where appropriate audited, in sampling methods, preservation and transportation of samples for ID and record keeping associated with samples
● Appropriate equipment should be available and maintained adequately
● The methodology used should be technically and statistically valid
What is the practice in your country??What are the constraints??● in terms of personnel (e.g. numbers,
capacity and capability, etc.)● in terms of facilities (e.g. equipment,
available information/methodology, manuals, annual budget, etc.)
FOR DISCUSSION

APEC Workshop on Surveillance Capacity
The Guidelines in Practice in Thailand
Dr Paul Pheloung
Office of the Chief Plant Protection Officer, Australian Government Department of Agriculture, Fisheries and Forestry
As a collaboration between the Australian Government Department of Agriculture, Fisheries and Forestry and the Thailand Department of Agriculture, a workshop was conducted in Pak Chong Thailand, 6-11 June 2005. The purpose of the workshop was to discuss the Guidelines for Plant Pest Surveillance and employ some of the methodology in practical sessions. Workshop attendees included senior and technical staff with management, entomology, plant pathology and weed ecology background and skills. The workshop reviewed the reasons for undertaking plant pest surveillance, in the context of the international trade environment. The workshop combined formal presentations and breakout discussions with practical sessions in the field and laboratory. The practical sessions involved: 1 A mango pest list survey.
• A preliminary pest list was prepared based on current knowledge (general survey).
• Planning the activities included forming teams, assigning tasks, preparing forms for field recording and deciding on the sampling regime including the methodology for developing a pest list. Fruit fly traps (using cue and ME lures) were installed 2 weeks prior to the exercise.
• A mango orchard was visited by 4 teams of about 8 people where trees were inspected and specimens were collected.
• The teams returned to a laboratory to examine and identify the specimens and prepare a species accumulation curve.
2 A mango monitoring survey. • Two insect and two plant pathogen pests were nominated as targets. • Activities were planned as above including planning the sampling regime
based on statistical principles. • A mango orchard was visited by 4 teams of about 8 people where trees
were inspected and specimens were collected. • The teams returned to a laboratory to examine and identify the specimens
and use statistical principles to estimate pest prevalence. Random and systematic sampling methods were tried by different teams. A number of issues became clear during the workshop:
• the need for a clear division of labour within teams; • the need for illustrated identification guides

• the importance of comfort factors in determining the effectiveness of a survey– eg food, shelter, fatigue, boredom;
• the small scale of the pest list survey resulted in a accumulation curve that did not flatten properly, demonstrating the importance of sample size;
• for the monitoring survey, the target pests were rare, possibility because of confounding effect of a recent chemical treatment;
• the statistical principles and analysis were unfamiliar to the majority of participants;
• terminology was also unfamiliar; • good record keeping important; • planning takes time but is worth it.

1
APEC Workshop on Surveillance CapacityCurrent market Access Issues for Australia
D E P A R T M E N T O F A G R I C U L T U R E , F I S H E R I E S A N D F O R E S T R Y
Dr Paul PheloungOffice of the Chief Plant Protection Officer,
Australian Government Department of Agriculture, Fisheries and Forestry
Surveillance and SPS
Surveillance for plant pests in Australia has been necessary to show that a pest of concern is not present in an area in order to justify SPS requirements to a trading partner:
– to provide assurance that commodities exported from that area will not provide a pathway for the introduction of that pest, or
– as a reason for requiring phytosanitary measures on commodities imported into that area, to manage the risk of introduction of that pest.
The paper accompanying this talk contains a table of pests that have been the subject of surveillance in Australia for market access purposes.
I will discuss two recent issues, in relation to citrus canker and karnalbunt.

2
Citrus Canker
• Following the detection of this pest in a small citrus production area of central Qld in 2004 – a pest quarantine area (PQA) was established and an eradication program commenced.
• Comprehensive surveillance delimited the infestation to the PQA and demonstrated freedom from the pest in Australia outside of the PQA.
• The pest is a well known threat in Australia:– it is a Northern Australia Quarantine Strategy (NAQS) target and
consequently has the subject of ongoing surveillance for many years.– it is a categorised pest in the citrus industry biosecurity plan.
Citrus treesdata compiled f rom A BS 2001 agricultural census
1,000,000 to 2,000,000 (1)500,000 to 1,000,000 (8)100,000 to 500,000 (13)
50,000 to 100,000 (30)0 to 50,000 (1207)
PQA(Emerald, Qld)
192,600192,000320320Total
60060011NT
660078001113WA
29400354004959Vic
46200552007792SA
7740093000129155NSW
32400-54-Qld
inc Qldexc Qldinc Qldexc Qld
Number of trees to examineBlocks to surveyState
This surveillance plan provided 95% confidence that if 1% or more of the blocks contained infected trees, they would have been detected.
Citrus canker surveillance

3
Karnal bunt
Trigger:Feb 2004 Claim made by trading partner that a wheat shipment was infected
by Tilletia indica, the fungus responsible for Karnal bunt
Response:March 2004 Diagnostic tests commenced on shipment samples by
independent third partiesDiagnostic tests commenced on port receival samples representing wheat produced throughout Australia
April 2004 Negative results from these tests in combination with a range of activities in Australia that would have revealed the presence of the disease are conveyed to the international community through the IPPC
Outcome:Trading partners continue to recognise that Karnal bunt is not present in
Australia.A key challenge was to definitively distinguish between spores of T. indica
and T. ehrhartae, a related pathogen of no quarantine concern.
Other recent issues
Banana black sigatokaFruit flies
papaya fruit fly, melon fly, Philippine fruit flyQueensland and mediterranean fruit fly
Grape phylloxeraSiam weed and branched broomrapeCurrent-lettuce aphid

4
Conclusion
Australia frequently has to manage ccess to markets for produce and surveillance can play an essential role.
These include both international and interstate (domestic) trade.

1
MINISTRY OF AGRICULTURETHE REPUBLIC OF INDONESIA
Market Access Issue:
Chinese Taipei Imposed an Import Ban on Horticultural Commodities from Indonesia
due to Fruit Fly Infestation
CONTENT:
Ministry of Agriculture ,The Republic of Indonesia
Overview
Actions to Counteract the Ban
Fruit-fly Surveillance
Strategies for Fruit Fly Control

2
OVERVIEW (1)
Ministry of Agriculture ,The Republic of Indonesia
• Chinese Taipei is a prospective export market for Indonesia
• Trend of Indonesian Export Value to Chinese Taipei:
0
0.5
1
1.5
2
2.5
3
3.5
1998 1999 2000 2001 2002
US$ millions
OVERVIEW (2)
Ministry of Agriculture, The Republic of Indonesia
- November 1, 2003, Chinese Taipei BAPHIQ promulgated an import ban on Indonesian horticultural products
- 13 Indonesian horticultural commodities were suspected to contain several species of fruit flies
- Estimated financial losses resulted from the ban: US$ 1.3 millions

3
Actions to Counteract the Ban
Ministry of Agriculture ,The Republic of Indonesia
1. Bilateral approach:- a mission team for negotiation- notification (no scientific basis)
2. Improving surveillance system
3. Improving control strategy
FRUITFLY SURVEILLANCE
1920 First detected to attack mango
1938 Reported to attack other commodities (chilly, banana, guava, coffee, etc.)
Now - Found all over the economy
- 66 species have been identified
- But only a few species whose host have been identified
B. Cucurbitae: cucumber, water melon
B. Umbrosa: jackfruit
B. Caudata: several plants from family of cucurbitaceae
Ministry of Agriculture ,The Republic of Indonesia

4
Strategies for Fruit Fly Control (1)
Ministry of Agriculture ,The Republic of Indonesia
Basis:
- Government regulation No. 6, 1995 about “Plant Protection”- Minister of Agriculture’s decree No.887/Kpts/OT.210/9/97 about “Pest
Control Guidance”
Strategies for Fruit Fly Control (2)
Methods of Fruit Fly Control:
- Prevention of fruit fly infestation (strict quarantine regulation, fruit wrapping, fogging)
- Sanitation of production areas
- Application of trap and attractant
- Biological crop protection
- Sterile insects
- Pesticides
- Eradication
- Post harvest treatment
Ministry of Agriculture ,The Republic of Indonesia

5
Ministry of Agriculture ,The Republic of Indonesia
THANK YOU
FOR
YOUR ATTENTION

1
A Surveillance to Develop the Plant A Surveillance to Develop the Plant Quarantine MeasureQuarantine Measure
~ A Pest of Low Prevalence on Japanese Apples ~ ~ A Pest of Low Prevalence on Japanese Apples ~
TakayasuTakayasu WatanabeWatanabePlant Quarantine Office,Plant Quarantine Office,
Plant Protection Division, MAFF, JAPANPlant Protection Division, MAFF, JAPAN
Background 1Background 1
Major pest for apple fruits :Major pest for apple fruits :Peach fruit borer (Peach fruit borer (CarposinaCarposina sasakiisasakii ))
Quarantine measures for export:Quarantine measures for export:Methyl bromide fumigationMethyl bromide fumigation

2
Background 2Background 2
Manchurian fruit moth (Manchurian fruit moth (GrapholitaGrapholita inopinatainopinata))
・・ The infestation on apples had not been reported The infestation on apples had not been reported since 1950since 1950’’s.s.・・ Pest status on apples was regarded extremely low Pest status on apples was regarded extremely low
according to scientific papers.according to scientific papers.
But there is a case that the import But there is a case that the import economyeconomy where where this species does not occur designates this species this species does not occur designates this species as a quarantine significance to request plant as a quarantine significance to request plant quarantine measures to Japan. quarantine measures to Japan.
About Manchurian fruit mothAbout Manchurian fruit moth1. Scientific name: 1. Scientific name: GrapholitaGrapholita inopinatainopinata (Heinrich)(Heinrich)2. Taxonomic position: Lepidoptera 2. Taxonomic position: Lepidoptera –– TortricidaeTortricidae3. Distribution: CHINA, RUSSIA, JAPAN3. Distribution: CHINA, RUSSIA, JAPAN4. Host plant: mainly 4. Host plant: mainly toringotoringo crab apple (Main host, crab apple (Main host,
MalusMalus toringotoringo),), MalusMalus prunifoliaprunifolia etc. etc. 5. Historical Record in Japan: 5. Historical Record in Japan: ・・ The infestation on The infestation on MalusMalus prunifoliaprunifolia var. var. ringoringo was confirmed was confirmed
in Fukushima prefecture in 1952.in Fukushima prefecture in 1952.・・ No infestation on apple fruit was confirmed at production No infestation on apple fruit was confirmed at production
during survey in1957. during survey in1957. ・・ No infestation on apple fruit has been reported for about 50 No infestation on apple fruit has been reported for about 50
years. years.

3
The survey to confirm the pest status The survey to confirm the pest status
The survey area (prefecture):The survey area (prefecture):・・ Aomori prefecture and Fukushima prefecture (in 2002 and 2003)Aomori prefecture and Fukushima prefecture (in 2002 and 2003)・・ Miyagi prefecture (in 2003)Miyagi prefecture (in 2003)
The survey site:The survey site:・・Apple production orchard under conventional pest control Apple production orchard under conventional pest control
((Controlled orchardControlled orchard).).・・ Apple production orchard not conducted pest control Apple production orchard not conducted pest control
((NonNon--controlled orchardcontrolled orchard).).・・ The growing sites of wild host plants such as wild The growing sites of wild host plants such as wild toringotoringo crab crab
apple, the growing sites of apple, the growing sites of MalusMalus prunifoliaprunifolia, and forest , and forest ((Wild host plants areaWild host plants area).).
And trap and fruit surveys were conducted in the same survey.And trap and fruit surveys were conducted in the same survey.
1.Method (1/3)1.Method (1/3)
(1) Trap survey(1) Trap survey
a. Nona. Non--controlled orchard and Wild host plants areacontrolled orchard and Wild host plants area・・Term : form June to October (the season of the occurrenceTerm : form June to October (the season of the occurrence
of adult of this species) of adult of this species) ・・Attractant : Z8Attractant : Z8--12Ac ((Z)12Ac ((Z)--88--dodecenyl acetate) dodecenyl acetate) ・・Trap type : The Funnel trap Trap type : The Funnel trap
b. Controlled orchardb. Controlled orchardThe terms of survey and the types of trap were in the sameThe terms of survey and the types of trap were in the sameway as above.way as above.
1.Method (2/3)1.Method (2/3)

4
(2)Fruit survey(2)Fruit survey
a. Nona. Non--controlled orchard and Wild host plants areacontrolled orchard and Wild host plants area・・ Field : Visual inspection Field : Visual inspection ・・ Laboratory : Randomly collected fruits were stored forLaboratory : Randomly collected fruits were stored for
examination.examination.・・ Term : The middle to the end of June, August to October Term : The middle to the end of June, August to October
b. Controlled orchardb. Controlled orchard・・ The inspection and examination were in the same way as The inspection and examination were in the same way as
above. above. ・・ Targeted on : The immature and mature apple fruits cultivatedTargeted on : The immature and mature apple fruits cultivated
in Controlled orchard.in Controlled orchard.・・ Term : The middle to end of June, the middle of SeptemberTerm : The middle to end of June, the middle of September
1.Method (3/3)1.Method (3/3)
2. Results (1/2)2. Results (1/2)
(1) Trap survey(1) Trap survey
a. Nona. Non--controlled orchard and Wild host plants area controlled orchard and Wild host plants area Male adults of 54 of this species were trapped.Male adults of 54 of this species were trapped.Specimens of 3 were trapped at NonSpecimens of 3 were trapped at Non--controlled orchard.controlled orchard.Specimens of 51 were trapped at Wild host plants area.Specimens of 51 were trapped at Wild host plants area.
b. Controlled orchardb. Controlled orchardThis species was not trapped.This species was not trapped.

5
2. Results(2/2)2. Results(2/2)
(2) Fruit survey(2) Fruit survey
a. Nona. Non--controlled orchard and Wild host plants areacontrolled orchard and Wild host plants areaFruits of 9,192 were inspected : Fruits of 9,192 were inspected : Two specimens were totally found.Two specimens were totally found.
One was found in fruit of wild One was found in fruit of wild MalusMalus toringotoringo..One was found in fruit of One was found in fruit of MalusMalus prunifoliaprunifolia..
Not found in apple fruit of NonNot found in apple fruit of Non--controlled orchard.controlled orchard.
b. Controlled orchardb. Controlled orchardFruits of 50,275 were inspected :Fruits of 50,275 were inspected :No infestation by this species was found.No infestation by this species was found.
3. Conclusion3. Conclusion
(1) Manchurian fruit moth does not occur in (1) Manchurian fruit moth does not occur in Controlled orchard.Controlled orchard.
(2) It was found that Controlled orchard could be (2) It was found that Controlled orchard could be regarded as a pest free production.regarded as a pest free production.

6
Feasible plant quarantine measures to Feasible plant quarantine measures to export export
Proposed quarantine measures to confirm no infestation Proposed quarantine measures to confirm no infestation on apple fruits by Manchurian fruit moth is as follows:on apple fruits by Manchurian fruit moth is as follows:
(1) Designation of the production orchard(1) Designation of the production orchard(2) Convention pest control at the orchard(2) Convention pest control at the orchard(3) Trap survey at production orchard(3) Trap survey at production orchard(4) Fruit survey at production orchard(4) Fruit survey at production orchard(5) Sorting and culling fruits and packing fruits in boxes(5) Sorting and culling fruits and packing fruits in boxes(6) Export inspection(6) Export inspection
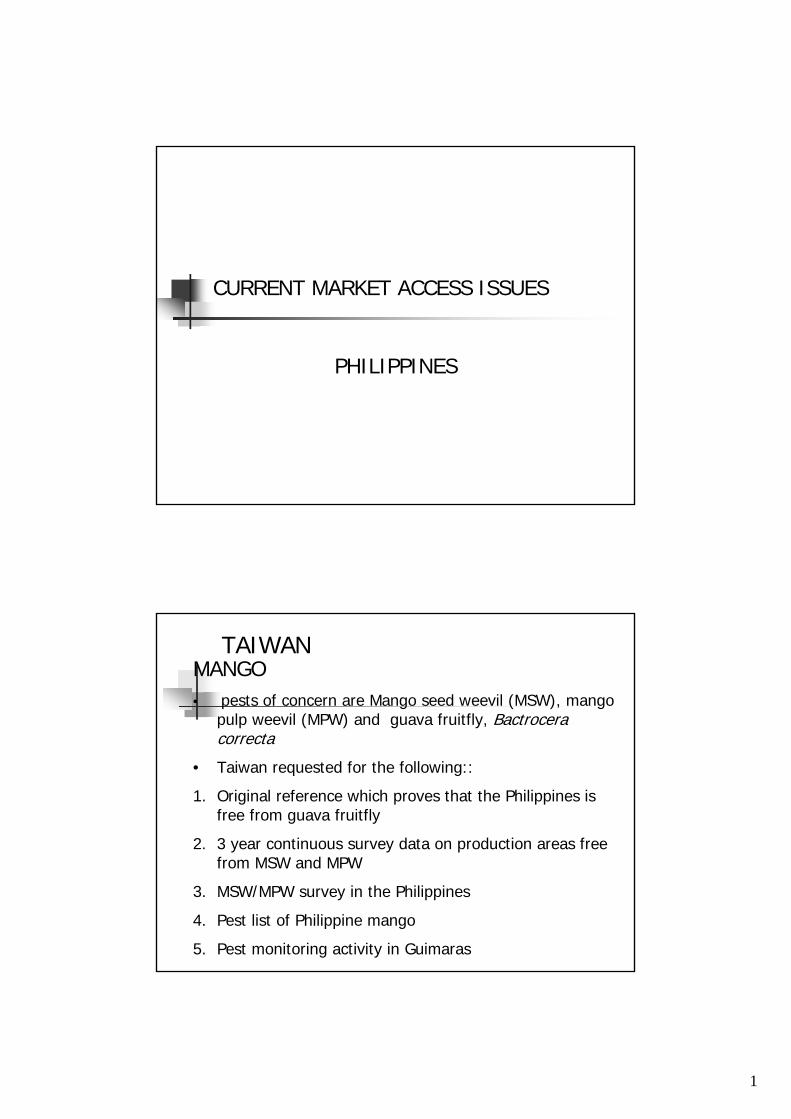
1
CURRENT MARKET ACCESS ISSUES
PHILIPPINES
TAIWANMANGO• pests of concern are Mango seed weevil (MSW), mango
pulp weevil (MPW) and guava fruitfly, Bactrocera correcta
• Taiwan requested for the following::
1. Original reference which proves that the Philippines is free from guava fruitfly
2. 3 year continuous survey data on production areas free from MSW and MPW
3. MSW/MPW survey in the Philippines
4. Pest list of Philippine mango
5. Pest monitoring activity in Guimaras

2
MANGO• Taiwan required for “pest free are” for MSW and MPW
as the only phytosanitary measure to achieve the ALOP
• The Phils offered other measures such as systems approach, quarantine inspection. Appropriate treatment and others to achieve the ALOP
• The following facts were also presented:
1. Japan, Korea and New Zealand accepts mangoes from the whole Phils axcept Palawan (where MPW is present) with VHT
2. Australia and US accepts mangoes from Guimaras Island with VHT
MANGO
• In the next round of negotiation the Philippines will offer sourcing mangoes from Guimaras Island pending the conduct of a nationwide survey

3
BANANA
• Taiwan required the following information:
1. Last 2 year continuous survey data on production areas free from banana bract mosaic virus and banana streak badnavirus
2. Last 5 year continuous survey data on production areas free from Moko disease race 2 and Panama disease race 2 and 3
3. Quarantine measures used to maintain pest free area including regulatory actions, routine monitoring, intercepted records, etc
BANANA
• the Philippines submitted the infrastructure and cultural methods of managing pests, diseases and weeds of banana plantations practiced by PBGEA
• the Bureau of Plant Industry will resubmit data for crop protection and quarantine measures

4
COCONUT
• The pest of concern is Cadang-cadang disease
• Taiwan required:
1. Last 2 year continuous survey data on production areas free from Cadang-cadang disease
2. Quarantine measures used to maintain status of pest free areas, including regulatory actions, routine monitoring, interception records, etc
• The Philippines has already submitted survey data for recognition by Taiwan on cadang-cadang pest free area
USA
Mango Export
• Scientific evidence that MSW and MPW do not exist in Guimaras Island
• survey was conducted
• Certification that the area is free from the pests
• Isolation (imposed quarantine)
• Regular monitoring – monthly survey (representative tree)
• All mango export to the US mainland is sourced only from Guimaras

5
USA
• In 2003 the Philippines requested US to allow sourcing of mangoes from other places except Palawan going to Guam and Hawaii
• US is now in the process of revising the Federal Rule which will take 18 months
• Proposal for a nationwide survey to determine presence/absence of MPW and MSW in the Philippines
• the aim is to increase the area (except Palawan) to source mangoes for export to the US
AUSTRALIA
BANANA
• Formal PRA started in June 28, 2000
• June 2002, Draft PRA was released
• Feb. 2004, Revised Draft PRA was released
• June 16, 2004, Addendum to the Revised Draft released
• Aug. 2004, Australia informed that they will release a Further Revised Draft
• Stringent measures for the importation of bananas in relation to Moko, banana bract mosaic virus and mealybugs

6
AUSTRALIA
BANANA
• In all the Draft IRA releases, the Philippines opposes the findings of Australia and gave its own scientific justifications
• If the Australian recommended mitigating quarantine measures will be followed, at least 2-year survey data is needed and to be sustained on a weekly basis once the PFA/ ALPP (areas of low pest prevalence) is established for Moko, Freckle and banana bract mosaic virus
• Philippines still waiting for the further revised draft

1
MARKET ACCESS MARKET ACCESS ““THAILANDTHAILAND””
Orchid (Flower, Plants) Orchid (Flower, Plants) USA, France, Netherlands, USA, France, Netherlands,
Italy, GermanyItaly, Germany
The Document Performing The Document Performing
20022002

2
Orchids Orchids –– Japan, Republic Japan, Republic of Korea of Korea
LonganLongan -- ChinaChina
2003 2003
200420046 Fruit 6 Fruit –– USAUSA4 Fruit 4 Fruit –– Australia, New Australia, New
ZealandZealand2 Fruit 2 Fruit -- JapanJapan

3
Pest List & Pest AnalysisPest List & Pest Analysis
ManggoManggoMangosteenMangosteenRambutanRambutanPineaplePineapleLycheeLycheeLonganLongan
–– Submitted completed Pest List Submitted completed Pest List
APHISAPHIS
Dr. Ralf Ross (Expertise )
+Entomologist Pathologist Crop Science
+ Herbarium Curator
Insects
Disease
Submitted
Completed PRA draft(3 Correction)

4
To Meet requirementsTo Meet requirementsInformation of Crop / PlantInformation of Crop / Plant
--TaxonomyTaxonomy --DistributionDistribution--Botanical description Botanical description --Produce areaProduce area--Harvesting seasonHarvesting season --Fruit standardFruit standard--Packaging Packaging --etcetc
Information of PathogensInformation of Pathogens--Taxonomy Taxonomy --Hosts rangesHosts ranges--Distribution Distribution --Biology + Ecology Biology + Ecology --etcetc
Treatment Procedures Treatment Procedures –– registration + registration + auditing by DOAauditing by DOA
Types of treatmentsTypes of treatmentsEquipment certificationEquipment certificationMonitoring procedureMonitoring procedureFruit cutting (Prior to treatment)Fruit cutting (Prior to treatment)

5
InspectionInspection-- Sampling rateSampling rate-- Location inspectionLocation inspection-- GAPGAP-- Pre harvest Pre harvest –– FieldField-- Post harvest Post harvest –– Packing areas Packing areas
USA => APHIS => FinalizedUSA => APHIS => FinalizedQuarantine Pests (USA)Quarantine Pests (USA)
111010PineaplePineaple
2288LycheeLychee
--55LonganLongan
1 (1 (PhomopsisPhomopsissp.)sp.)
44MangoMango
--77MangosteenMangosteen
PathogenPathogenInsectInsectCropsCrops
Quarantine Pests ?Quarantine Pests ?

6
Australia + New ZealandAustralia + New Zealand
2/12/128/31 28/31 8 ff8 ff--VHTVHT
LycheeLychee--55LonganLongan--77MangosteenMangosteen
1 1 FusariumFusariumsubglutinanssubglutinans
17/217/2PineaplePineaplePathogenPathogenInsectInsectCropsCrops
JapanJapan
--22MangoMango
--44MangosteenMangosteenPathogenPathogenInsectInsectCropsCrops

7
PINEAPPLEPINEAPPLE2 Species of 2 Species of FruitflyFruitfly4 Species of weevil4 Species of weevil1 Species of beetle1 Species of beetle6 Species of mealy bugs6 Species of mealy bugs1 Species of scale insect1 Species of scale insect1 fly1 fly1 moth1 moth2 butterfly2 butterfly
INSECTSINSECTSMangosteenMangosteen, , LycheeLychee, , LonganLongan, Mango, Mango-- BactroceraBactrocera caramboraecaramborae –– CaramboraCarambora fruitflyfruitfly-- B. B. dorsalisdorsalis -- Oriental Oriental fruitflyfruitfly-- B. B. papayaepapayae –– papaya papaya fruitflyfruitfly-- B. B. cucurbitaecucurbitae –– melon melon fruitflyfruitfly-- B. B. pyrifoliaepyrifoliae-- DolichoderusDolichoderus sp.sp. (Black ant)(Black ant)-- TechonomyrmexTechonomyrmex buttelibutteli (Black ant)(Black ant)-- DysmicoccusDysmicoccus neobrevipesneobrevipes (mealy bug)(mealy bug)-- PseudococcusPseudococcus cryptuscryptus (mealy bug) (mealy bug) -- etcetc

8
PATHOGENPATHOGEN
-- PhytophthoraPhytophthora sp.sp.-- PhomopsisPhomopsis sp.sp.-- FusariumFusarium subglutinanssubglutinans
Treatment Required Australia, Treatment Required Australia, New Zealand New Zealand
Vapor heat treatment => Vapor heat treatment => ProtocolProtocolApproved by Oxford Plant Protection Approved by Oxford Plant Protection Laboratory, USDALaboratory, USDA-- APHISAPHIS--PPQ, NC, PPQ, NC,
USA USA
-- 464600C above 58 min C above 58 min ((lycheelychee, , LonganLongan, , mangosteenmangosteen))
-- 474700C above 20 min C above 20 min (mango)(mango)

9
JAPAN JAPAN (Mango + (Mango + MangosteenMangosteen))
-- Packing House Packing House --Japanese PQI + Thai (5%) Japanese PQI + Thai (5%) 464600C above 58 min C above 58 min ((lycheelychee, , LonganLongan, , mangosteenmangosteen))474700C above 20 min C above 20 min (mango)(mango)
-- Air/ Ship cargo Air/ Ship cargo -- InspectionInspection

1
CURRENT MARKET ACCESS ISSUES :
MALAYSIA
Why Malaysia Needs To Look For New Markets
• High Import Bills on Food Items – RM 12 Billions / Year
• Government Policy: Balance of Trade (B.O.T.)
• Increased Agricultural Production

2
TECHNICAL MARKET ACCESS
• New Market Access Submission
• Market Access Maintenance
• Market Access Improvements
TECHNICAL MARKET ACCESS
• New Market Access Submission
• Market Access Maintenance
• Market Access Improvements

3
Process of opening up markets• Export country NPPO applies to export
– Malaysia identifies Commodities/Products for Export Based on Market Potential in the Importing Countries
– Prioritize Commodities/Products– Submit official applications to Importer NPPOs
1. Bilateral Cooperation – Australia, China, Japan, 2. Unilateral – Korea, Iran
Bilateral dialogue
• Country to country discussions on import/export conditions– Transparency– Technical validity– Operational capability
Import conditions and TRADE

4
AUSTRALIA (Bilateral)
Submission of Technical Documents:
Orchids, Chrysanthemum, Anthurium, Durians, Pineapples, Carambola, Papaya, Mangosteen and Aquatic Plants.
Elements of Technical Document
• Crop – species/varieties• Production areas/volumes/seasons• Cultivation methods – pest management,
surveillance, harvesting• Pest list/datasheet – taxonomy, common names,
hosts, plant part affected, biology, control

5
Elements of Technical Document
• Packing house – post harvest handling and treatment, storage, packaging
• Export program – destination markets, phytosanitary import conditions
• References and copies of key papers
Importer NPPO• Importer NPPO undertakes a Pest Risk Analysis
– Australia spent AUD 60,000 on Orchids andChrysanthemum and AUD 40,000 on Pineapples
• Importer NPPO identifies pests of concern– Australia Proposed Risk Options – Devitalization of Cut
Chrysanthemum and Aster flowers, Decrowning & Mandatory Fumigation of Pineapples on Arrival, Frozen Durian
• Both NPPOs agree on risk management procedures• Trade begins

6
Our Preparations:• Preparation of Farms/Packing House• Setting up of Malaysian Phytosanitary Certification
Assurance Scheme (MPCA Scheme) - Voluntary Scheme- Register growers/packers - Provide Training to growers/packers to meet specific International Standards for all components
- Systems for productions and marketing will be audited by Importer NPPO
– Individual growers will be identifiable – for product integrity, tracebilityand security
OUTCOMEAustralia:
• Market access gained1. Cut Flowers- Orchids and Anthurium2. Chrysanthemum, Asters,and Foliages (devitalization) 3. Frozen Durian (-180C for 7 days before Shipment)
- Only certified growers/packers have access - Systems for productions and marketing will be audited - Individual growers will be identifiable for traceability,
integrity and security

7
OUTCOMEAustralia:
• Pending
1. Pineapples – Biosecurity Australia agreed in principle, however, final approval is in the handthe Prescribed Agency/Stakeholder
(Decrowned and mandatory fumigation)
OUTCOMEAustralia:
• Under Review
1. Chilled Durian (20-130 C) – considered as a review under existing policy
2. Mangosteen – Reviewing import conditions for Thai mangosteen, Malaysian request will be considered as a review under extension of existing policy

8
OUTCOMEAustralia:• Keep In View
1. Papaya – concerns with fruit fly and papaya ringspot virus risks
2. Carambola – Australia has no existing policy for the importation, more over it is used as a garnish and market is not big enough
3. Aquatic Plants – Australia informed that it has had bad experiences with aquatic plants becoming weeds
JAPAN (Bilateral)
Submission of Technical Documents:
Mangosteen, Rambutan, Papaya, Carambola, Watermelons, Bell Pepper, Mango, Durians and Jackfruit.
However, due to our constraints we decided to prioritize the crops i.e. Papaya, Mango, Mangosteen and Bell Pepper

9
JAPAN (Bilateral)
We have to propose a plan for each commodity which suits the 13 procedures for lifting the ban on importation
Papaya,Mangosteen and Bell Pepper
Mango – Started 7 years ago, but fulfilled only 6 of the 13 procedures.
1.Request for lifting the ban of importationfrom exporting country
2.Submission the plan of research by exporting country
3.Examination the plan by Japanese experts
4. Development of disinfestation method or research for pest free area
6. Examination the plan by Japanese experts
10. Submission the plan of verification by exporting country
8. Examination the plan by Japanese experts
9.Conducting the verification testing by Japanese experts
5. Submission the data of experiment or research by exporting country
(Explanation meetings for domestic producer if necessary)
11. Examination the data by Japanese experts
12. Gathering the public comments and conducting the public hearing
13. Amendment the regulation (lifting the ban of importation)7. Submission the plan of verification
testing or research by exporting country
Procedures for Lifting the Ban on Importation (JAPAN)

10
OUTCOME
- Japan: • Market access gainedDurian – All Forms, i.e. Frozen,
Chilled and Fresh
TECHNICAL MARKET ACCESS
• New Market Access Submission
• Market Access Maintenance
• Market Access Improvements

11
TECHNICAL MARKET ACCESS
Market Access Maintenance
• Maintain the existing markets
TECHNICAL MARKET ACCESS
• New Market Access Submission
• Market Access Maintenance
• Market Access Improvements

12
TECHNICAL MARKET ACCESS
• Market Access Improvements- Some countries amend/revise their
Quarantine Regulations, and therefore import requirements changed
e.g. China and Singapore
TECHNICAL MARKET ACCESS• Market Access Improvements
- China has imposed a new requirement on importation of Papaya, i.e. Papaya fruits must undergo Hot Water Treatment to disinfest Fruit Flies (Bactrocera papayae) effective July 1, 2005. As a result, we have to hold the export which is about 20 metric tons a day.
- a very short notice was served, i.e. a one month notice
- Singapore only allows export of Plants from certified farms/packers (MPCA Scheme) without PCs. Plants from other Farms/Packing Houses must be accompanied by PCs.

Opportunities for Regional Collaboration — A Surveillance Network? In 2001/02, the Australian Agency for International Development (AusAID) supported an initiative to review and assess the arthropod pest collections and plant disease herbaria in ASEAN countries. The authors of these studies observed that, to a greater or lesser extent, none of the countries of the region could provide an adequate description of the health (pest) status of its agricultural industries. The problem was attributed, in large part, to the small number of specimens held in plant disease herbaria. The arthropod pest collections were generally much better populated than the plant disease herbaria, but all needed additional resources and assistance to bring these up to contemporary international standards. Some arthropod pest collections contained many specimens that were unidentified. Many collections of arthropod pests and plant diseases are the product of work dating back a century or more. The early curators of those collections sourced specimens from practicing plant health scientists, farmers and from their own collecting trips. While specimens submitted by plant health scientists and farmers are still valuable, the collecting of specimens has become more purposeful than in the past, driven by the need to expand knowledge about biodiversity, concern about the need to recognise alien pests in new environments and a desire to expand trade in agricultural commodities. However, the capacity of individual countries to undertake surveillance for plant pests and diseases in constrained by factors such as: Lack of experience in designing and carrying out surveillance programs; Lack of understanding of the definitions applying to different types of surveys as set
out in various International Standards for Phytosanitary Measures (ISPMs) developed under the aegis of the International Plant Protection Convention (IPPC);
Little understanding, at least in some agencies / institutions, of the importance of pest collections in the global trading environment;
Limited in-country capacity to identify pests and pathogens. Diagnostic capacity is a problem globally as many agencies downgrade the importance of taxonomy and plant health generally. Given the problems listed above, sharing expertise through regional, in-country and international networks seems an obvious approach to overcome the shortage of specialists. If networks of international collaborators working together to build specimen-based pest lists is to succeed, there needs to be a strong desire to work together. Increasingly much can be done on the internet, including using new diagnostic tools, but providing the resources for such networks will remain a problem for some countries. On the other hand, many developed members of the World Trade Organization and donor agencies are giving a high priority to assisting developing countries to expand trade in agricultural commodities by building capacity to address phytosanitary issues. Accessing the resources provided by developing countries is competitive, but can be made easier when senior managers are aware of the importance of pest collection in trade. Senior administrators and politicians cannot be expected to know about the importance of

building specimen-based pest lists and they need to be told in terms that they understand – that is trade and national development. Within the Asia Pacific region there are some examples of surveillance networks. These include the collaborative efforts of Malaysia and Griffith University in Australia under the aegis of the International Center for the Management of Pest Fruit Flies and the forest pathologists in Australia who work with counterparts in Pacific island countries. Funding for collaborative work can be sourced through the Australian Center for International Agricultural Research (ACIAR) and various bilateral and regional programs funded by the Australian Agency for International Development (AusAID). Doubtless other donor agencies would also respond to well-presented applications for support. APEC also has funds to support collaborative efforts that meet the objectives of its members, that is to liberalise and expand trade between its members. A national plant health surveillance network in Australia The Australian government, five state governments, two territory governments and industry groups in Australia all undertake various types of surveillance for the presence of plant pests. The purpose of this surveillance includes early detection surveys for the presence of new plant pests, surveys to demonstrate absence of pests that could affect trade, delimiting surveys to determine and then monitor the extent of a pest infestation during an eradication program, and monitoring surveys to determine the prevalence of established pests. Also relevant are awareness raising activities. Comprehensive knowledge of all of these activities is difficult and time consuming to obtain. We are in the process of developing a network of surveillance coordinators from all jurisdictions and sectors who can report on what surveillance is being done. This information will be stored in a central repository that will include such things as the pest(s) that are targeted, the hosts involved, where, when and why the surveillance is being done and who is involved. This information should help in the rapid generation and analysis of information that may be needed, for example, to demonstrate the absence or distribution limits of a particular pest and the level of confidence that can be attributed to those claims. As a shared resource, the network will provide a forum for collaboratively sharing information in relation to plant pest surveillance.

DRAFT RECOMMENDATIONS:
1. That the ATCWG and the Plant and Animal Quarantine and Pest Management sub-group take stock of APEC-wide expertise in plant pest diagnostics and taxonomy, and support regional initiatives to harness these resources in a coordinated manner to support pest surveillance and biosecurity preparedness.
2. That member economies co-operate to share plant health and biosecurity data through an appropriate communication forum to facilitate easy access to such information needed for biosecurity planning and market access negotiations.
3. That the ATCWG brings the attention of the APEC Forum the need to support efforts to identify regional commonalities in pest threats, priorities in pest surveillance, and raise the awareness of member economies of the need to address biosecurity concerns with respect to these threats, on a national and regional basis.
4. That the ATCWG recognizes the need for capacity-building activities to be organized on a regular basis to raise skill levels of plant health professionals in developing APEC economies to meet WTO/SPS requirements. It is proposed that hands-on training, using relevant case studies, be conducted to reinforce the knowledge and skills acquired from the current activity.