Building and calibrating an open circuit wind tunnel … · visualization and measuring turbulent...
6
Building and calibrating an open circuit wind tunnel with visualization and measuring turbulent characteristic of flow and their dependence on screens and honey comb KAMYAR MANSOUR, ALI KARGAR Department of aerospace engineering Amirkabir University of Technology (Tehran polytechnic) Tehran , Iran, 15875-4413 [email protected], [email protected] Abstract: -This paper is focus on design, building and calibrating a small open circuit wind tunnel and measuring turbulent characteristic of flow such as kurtosis, skewness , standard deviation, turbulence intensity and variance of flow by hot wire anemometer and dependence of them on velocity and screen meshes and honey comb in the wind tunnel. This wind tunnel specially built for stability and transition studying around rotating bodies, so we built a smoke generator in order to show the transition region on the boundary layer of models. This paper includes some pictures that were made by flow visualization on rotating bodies. In this paper we also measure pressure coefficient around a cylinder and drag coefficient around a sphere and compare our result by some another same experiments, also we visualize flow around sphere in Reynolds 11500. Key-Words: - open circuit wind tunnel, turbulent characteristics, flow visualization, calibrating, pressure coefficient, drag coefficient, cylinder, sphere, turbulence intensity. 1 Introduction When the first real scientific investigations into the fledgling field of aeronautics, scientists hoping to achieve heavier than air flight soon realized that they would need to understand airflow dynamics about an airfoil in order to design a practical wing. In order to do this, they would need to reliably measure forces acting on a body passing quickly through the air. Until the early 1700s, natural wind sources such as high ridges and the mouths of caves were used for early testing, but these proved to be inadequate, and so a mechanical means of creating airflow was invented, the so-called whirling arm apparatus. An English mathematician named Benjamin Robins is credited as being the first to use a whirling arm for aeronautical study. The apparatus was driven by falling weights attached via a system of ropes and pulleys to a long arm, which rotated horizontally about a spindle. Test bodies were attached to the tip of the arm and could be positioned so as to obtain varying angles of attack. Robins’ first whirling arm was four feet in length, and the tip reached speeds of only a few feet per second, but longer arms could obtain speeds of up to 20 feet per second.in designing we use Bradshaw&Mehta “design rules for small low speed wind tunnels”[ref. 1],Anatol roshko in his paper [ref.3] has a good and certain figure about pressure coeff. Around cylinder, Giancarlo Bruschi &Tomoko Nishioka&Kevin Recent Researches in Mechanical Engineering ISBN: 978-1-61804-153-1 138
Transcript of Building and calibrating an open circuit wind tunnel … · visualization and measuring turbulent...
Building and calibrating an open circuit wind tunnel with
visualization and measuring turbulent characteristic of flow and
their dependence on screens and honey comb
KAMYAR MANSOUR, ALI KARGAR
Department of aerospace engineering
Amirkabir University of Technology (Tehran polytechnic)
Tehran , Iran, 15875-4413
[email protected], [email protected]
Abstract: -This paper is focus on design, building and calibrating a small open circuit wind tunnel and
measuring turbulent characteristic of flow such as kurtosis, skewness , standard deviation, turbulence
intensity and variance of flow by hot wire anemometer and dependence of them on velocity and screen
meshes and honey comb in the wind tunnel. This wind tunnel specially built for stability and transition
studying around rotating bodies, so we built a smoke generator in order to show the transition region on
the boundary layer of models. This paper includes some pictures that were made by flow visualization on
rotating bodies. In this paper we also measure pressure coefficient around a cylinder and drag coefficient
around a sphere and compare our result by some another same experiments, also we visualize flow around
sphere in Reynolds 11500.
Key-Words: - open circuit wind tunnel, turbulent characteristics, flow visualization, calibrating, pressure
coefficient, drag coefficient, cylinder, sphere, turbulence intensity.
1 Introduction
When the first real scientific investigations
into the fledgling field of aeronautics,
scientists hoping to achieve heavier than air
flight soon realized that they would need to
understand airflow dynamics about an airfoil
in order to design a practical wing. In order to
do this, they would need to reliably measure
forces acting on a body passing quickly
through the air. Until the early 1700s, natural
wind sources such as high ridges and the
mouths of caves were used for early testing,
but these proved to be inadequate, and so a
mechanical means of creating airflow was
invented, the so-called whirling arm
apparatus. An English mathematician named
Benjamin Robins is credited as being the first
to use a whirling arm for aeronautical study.
The apparatus was driven by falling weights
attached via a system of ropes and pulleys to a
long arm, which rotated horizontally about a
spindle. Test bodies were attached to the tip of
the arm and could be positioned so as to
obtain varying angles of attack. Robins’ first
whirling arm was four feet in length, and the
tip reached speeds of only a few feet per
second, but longer arms could obtain speeds of
up to 20 feet per second.in designing we use
Bradshaw&Mehta “design rules for small low
speed wind tunnels”[ref. 1],Anatol roshko in
his paper [ref.3] has a good and certain figure
about pressure coeff. Around cylinder,
Giancarlo Bruschi &Tomoko Nishioka&Kevin
Recent Researches in Mechanical Engineering
ISBN: 978-1-61804-153-1 138
Tsang&Rick Wang in their paer [ref.4] are
measured pressure coeff. Around cylinder and
we validate our result by them,also we validate
our drag measurement around sphere by
Frederick W. Roos & William W. Willmarth,s
paper[ref.2].
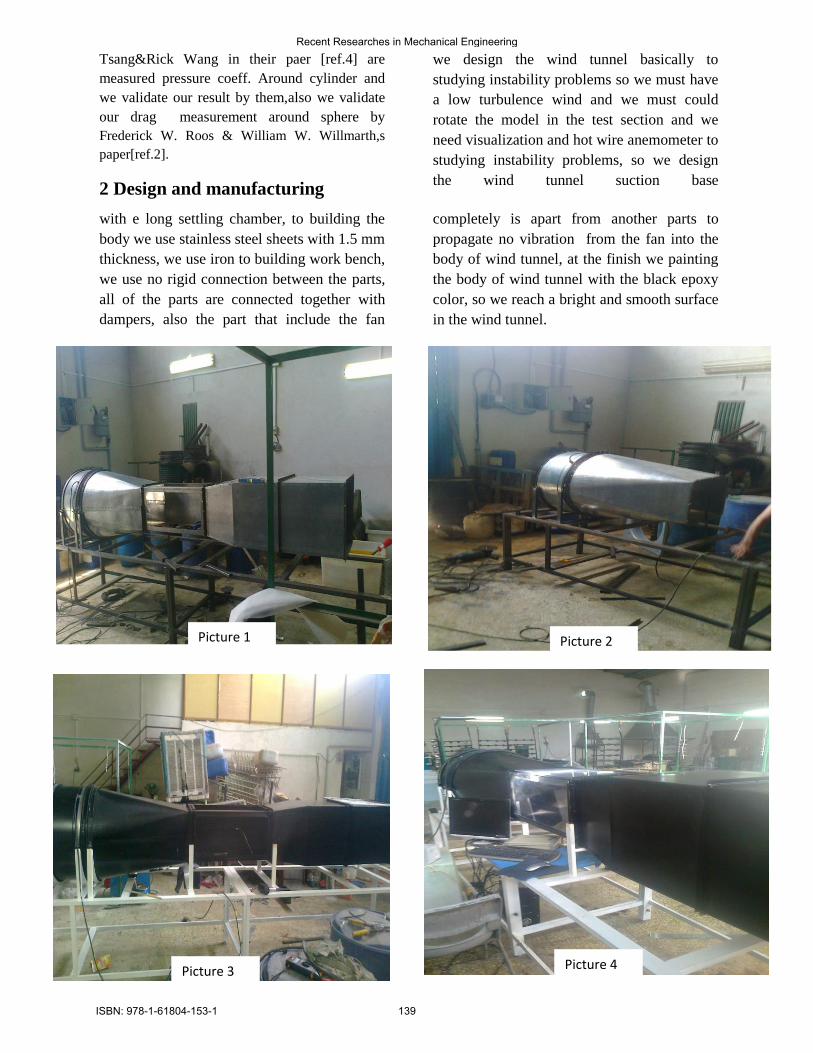
2 Design and manufacturing
we design the wind tunnel basically to
studying instability problems so we must have
a low turbulence wind and we must could
rotate the model in the test section and we
need visualization and hot wire anemometer to
studying instability problems, so we design
the wind tunnel suction base
with e long settling chamber, to building the
body we use stainless steel sheets with 1.5 mm
thickness, we use iron to building work bench,
we use no rigid connection between the parts,
all of the parts are connected together with
dampers, also the part that include the fan
completely is apart from another parts to
propagate no vibration from the fan into the
body of wind tunnel, at the finish we painting
the body of wind tunnel with the black epoxy
color, so we reach a bright and smooth surface
in the wind tunnel.
Picture 4 Picture 3
Picture 2 Picture 1
Recent Researches in Mechanical Engineering
ISBN: 978-1-61804-153-1 139

Screens are typically located just downstream
of the honeycomb and sometime at the inlet of
the test section. Screens create a static
pressure drop and serve to reduce boundary
layer size and increase flow uniformity. At
least one screen in the settling chamber
(ideally the last) should have an open-area
ratio of β<0.57, as screens with lower ratios
are known to produced nonuniformities in the
flow. This is presumable due to the formation
of small vortices created by the random
coalescence of tiny jets emitted from the
screen. The pressure drop across a screen
depends upon the open-area ratio of the screen
and the density, kinematic viscosity, and mean
velocity of the fluid.in this paper we use 5
conditions (2 screen with β=0.32 and honey
comb and 2 screens with β=2.5 , 1 screen with
β=0.37 and honey comb and 2 screens with
β=2.5 , 2 screen with β=2.5 and honey comb ,
honey comb only , nothing in settling
chamber) and we measure some turbulent
characteristics of flow and compare them with
together, design of this is suction base and the
dimensions are :
Overall length = 4 m
Test section length = 80 cm
Test section area = 40 * 40 cm
Settling chamber area = 50*50 cm
Honey comb : 6*6 mm cells ,40 mm depth
Fan : variable speed 70 cm diameters and 1.5
kw power
3 Measurements and results : we
measure the skewness, kurtosis and turbulence
intensity for 5 different stages, first for nothing
in settling chamber, stage 2 is only using honey
comb in settling chamber, stage 3 is 1 honey
comb with 2 screens with β=2.5,stage 4 is honey
comb with 1 screen with β=0.38 and 2 screens
with β=2.5 and the stage 5 is honey comb with 2
screens with β=0.38 and 2 screens with β=2.5,
measurement with hotwire anemometer are
shown that the energy loss of screens with
β=0.38 is very high ,because the maximum
speed when we have nothing in settling chamber
is about 19 m/s and this value when we use 1
screen with β=0.38 is 6.5 m/s, and their effect on
turbulence intensity is negligible, so using very
low open area ratio screens in our wind tunnel is
not economic.
4.1 Visualization and measuring drag : For visualization of flow a metal tank with
electric heating elements are used. Outlet of
the tank using a hose, into the hose we implanted two screens, Smoke flow regulator tuned such that the exhaust flow wind speed got equal the mean wind speed in the test re 7
Turb
ule
nce
inte
nsi
ty (
%)
Turbulence intensity-
velocity diagram
Figure 1: Turbulence intensity-velocity diagram
Recent Researches in Mechanical Engineering
ISBN: 978-1-61804-153-1 140
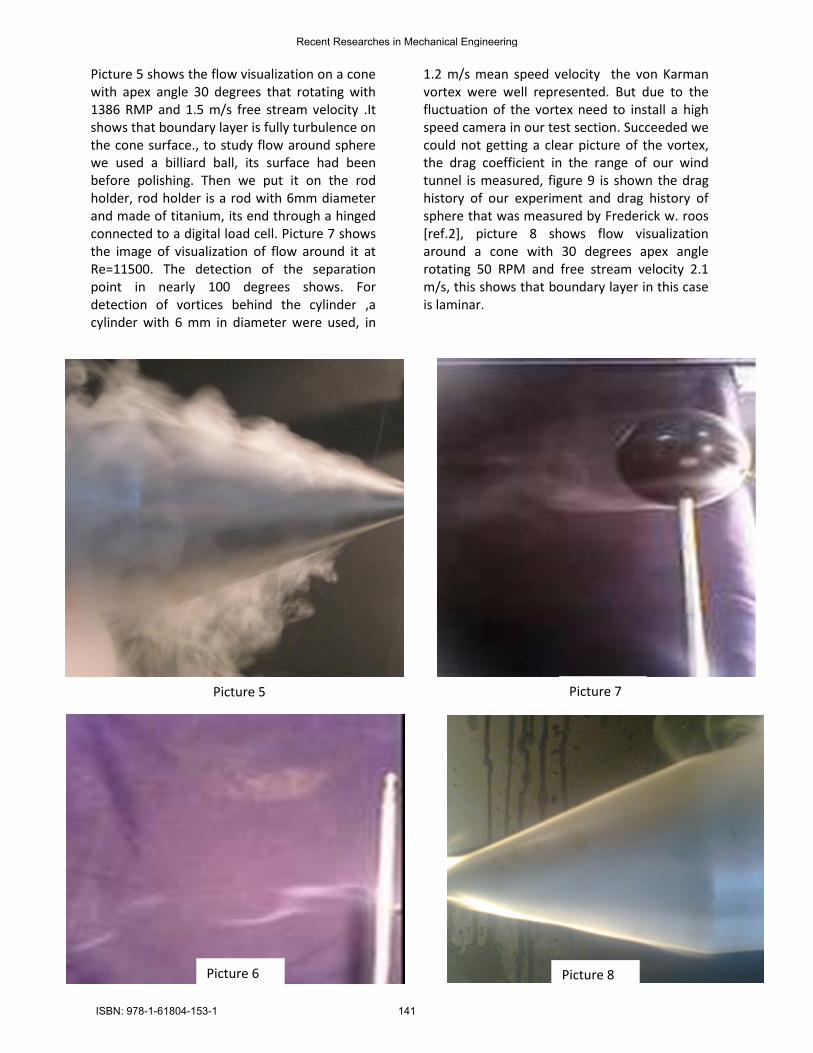
Picture 5 shows the flow visualization on a cone with apex angle 30 degrees that rotating with 1386 RMP and 1.5 m/s free stream velocity .It shows that boundary layer is fully turbulence on the cone surface., to study flow around sphere we used a billiard ball, its surface had been before polishing. Then we put it on the rod holder, rod holder is a rod with 6mm diameter and made of titanium, its end through a hinged connected to a digital load cell. Picture 7 shows the image of visualization of flow around it at Re=11500. The detection of the separation point in nearly 100 degrees shows. For detection of vortices behind the cylinder ,a cylinder with 6 mm in diameter were used, in
1.2 m/s mean speed velocity the von Karman vortex were well represented. But due to the fluctuation of the vortex need to install a high speed camera in our test section. Succeeded we could not getting a clear picture of the vortex, the drag coefficient in the range of our wind tunnel is measured, figure 9 is shown the drag history of our experiment and drag history of sphere that was measured by Frederick w. roos [ref.2], picture 8 shows flow visualization around a cone with 30 degrees apex angle rotating 50 RPM and free stream velocity 2.1 m/s, this shows that boundary layer in this case is laminar.
Picture 5
Picture 6
Picture 7
Picture 8
Recent Researches in Mechanical Engineering
ISBN: 978-1-61804-153-1 141
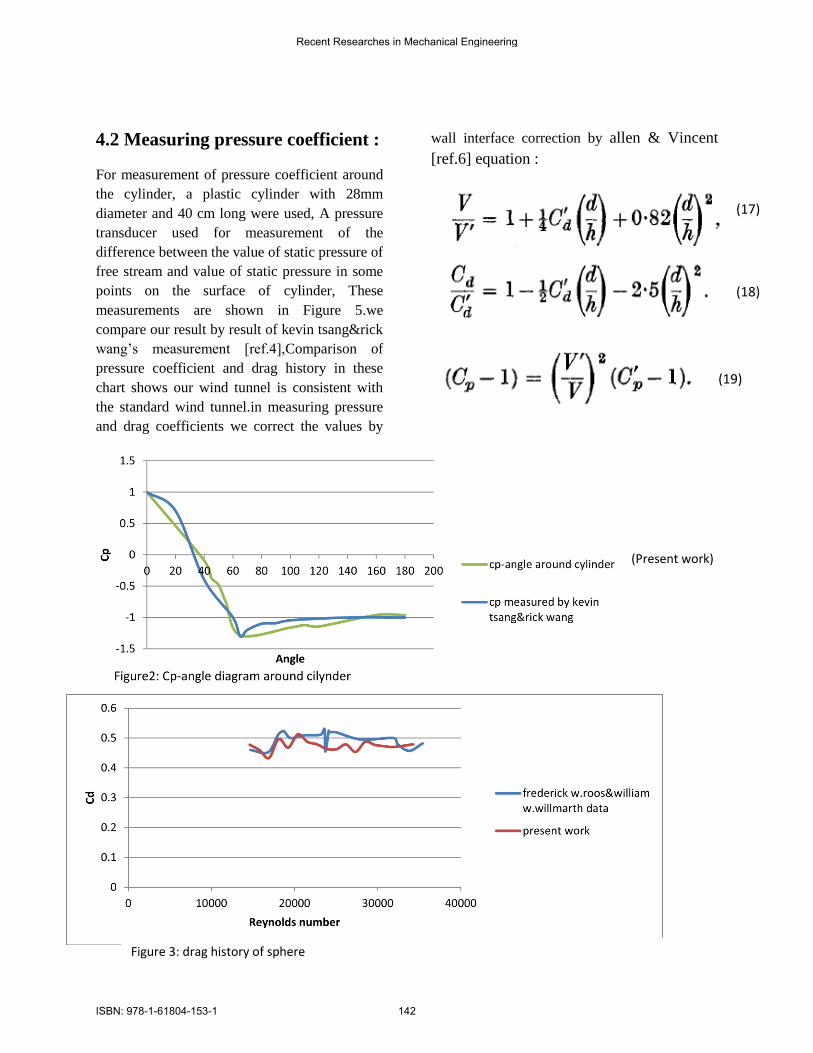
4.2 Measuring pressure coefficient :
For measurement of pressure coefficient around
the cylinder, a plastic cylinder with 28mm
diameter and 40 cm long were used, A pressure
transducer used for measurement of the
difference between the value of static pressure of
free stream and value of static pressure in some
points on the surface of cylinder, These
measurements are shown in Figure 5.we
compare our result by result of kevin tsang&rick
wang’s measurement [ref.4],Comparison of
pressure coefficient and drag history in these
chart shows our wind tunnel is consistent with
the standard wind tunnel.in measuring pressure
and drag coefficients we correct the values by
wall interface correction by allen & Vincent
[ref.6] equation :
(17)
(18)
Figure 3: drag history of sphere
(19)
(Present work)
Recent Researches in Mechanical Engineering
ISBN: 978-1-61804-153-1 142

To varying Wind speed, an inverter device used
to continuously change the input frequency of
motor ,Figure 4 shows the test section velocity
versus frequency.
5 Conclusion: our goal in this paper was
to measure the turbulent characteristics and their
dependence to honey combs and screens, also
we did build a wind tunnel and in order to show
that how is its performance. We did some
experiments in our own wind tunnel and validate
them with other experiments which were
previously published. We did also visualize the
flow around sphere and cone in empty settling
chamber. Some of calibrating and visualizing
figures are shown in this paper.
References:
[1] R.D.MEHTA & P.BRADSHAW, designe
rules for small low speed wind tunnels,
Aeronautical journal of the royal aeronautical
society, November 1979.
[2] FREDERICK W. Roos & WILLIAM W.
WILLMARTH , Some Experimental Results on
Sphere and Disk Drag, AIAA journal, VOL. 9,
NO. 2, FEBRUARY 1971
[3] ANATOL ROSHKO , Experiments on the
flow past a circular cylinder at very high
Reynolds number,J.fluid mechanics, 15
November 1960
[4] Giancarlo Bruschi &Tomoko
Nishioka&Kevin Tsang&Rick Wang, ,A
comparison of analytical methods drag
coefficient of a cylinder, march 21, 2003
[5] Nathan Tatman, Wind Tunnel Design and
Operation, thesis ,his mentor : Dr,Rhett.Herman
[6] ALLENH, . J. & VINCENT, Wall interference in
a two-dimensional-flow wind tunnel, with
consideration of the effect of compressibility,
Nut. Adv. Comm. Aero,1944
0
1
2
3
4
5
6
7
8
9
10
0 20 40 60 80
Figure 4: velocity versus frequency input of motor
Recent Researches in Mechanical Engineering
ISBN: 978-1-61804-153-1 143