Building a Safety Culture - ABC a... · 2017-04-29 · BUILDING A SAFETY CULTURE: IMPROVING SAFETY...
56
SmartMarket Report Building a Safety Culture: Improving Safety and Health Management in the Construction Industry Premier Partners Supporting Research Partners Contributing Partners Association Partners
Transcript of Building a Safety Culture - ABC a... · 2017-04-29 · BUILDING A SAFETY CULTURE: IMPROVING SAFETY...

SmartMarket Report
Building a Safety Culture: Improving Safety and Health Management in the Construction Industry
Premier Partners
Supporting Research Partners
Contributing Partners
Association Partners

■ Design and Construction Intelligence
SmartMarket Report
Dodge Data & Analytics
Chief Executive OfficerMichael Petrullo
Dodge Data & Analytics Research & Analytics/ Industry Insights
Senior Director, Research & AnalyticsBurleigh Morton
Senior Director, Industry Insights Research Stephen A. Jones
Director, Industry Insights Research Donna Laquidara-Carr, Ph.D., LEED AP
Reproduction or dissemination of any information contained herein is granted only by contract or prior written permission from Dodge Data & Analytics.
Copyright © 2016, Dodge Data & Analytics, ALL RIGHTS RESERVED
Building a Safety Culture: Improving Safety and Health Management in the Construction Industry SmartMarket Report
Executive EditorStephen A. Jones
Managing EditorDonna Laquidara-Carr, Ph.D., LEED AP
Vice President, MarketingEd Walloga
Contributing Art DirectorAlison Lorenz
Contributing Art DirectorAD-BOUTIQUE, INC.Terumasa Yamada
ContributorsBruce BuckleyKatharine Logan
Research Project ManagerSusan Barnett, MRA, PRC
For further information on this SmartMarket Report or for any in the series, please contact:
Dodge Data & Analytics Research & Analytics 34 Crosby Drive, Suite 201 Bedford, MA 01730
1-800-591-4462
■ Design and Construction Intelligence
SmartMarket Report
About Dodge Data & AnalyticsDodge Data & Analytics is the leading provider of data, analytics, news and intelligence serving the North American commercial construction industry. The company’s information enables building product manufacturers, general contractors and subcontractors, architects, and engineers to size markets, prioritize prospects, target and build relationships, strengthen market positions, and optimize sales strategies. The company’s brands include Dodge, Dodge MarketShare™, Dodge BuildShare®, Dodge SpecShare®, Dodge DocuPro and Sweets.
To learn more, visit www.construction.com.
McGraw Hill Construction is now
New name. Same smart people, products and
services, committed to helping your business grow.
We have a new email address.
Deliveries that you have been receiving from MHC Analytics,
(mhc _ [email protected]) will now come to you from
Dodge Analytics, ([email protected]).
Please add [email protected] to your
list of approved senders to ensure your deliveries are
directed to your inbox and not your junk mail folder.

Introduction
Stephen A. JonesSenior DirectorIndustry Insights ResearchDodge Data & Analytics
Stephen A. Jones leads DD&A’s Industry Insights Research division. He is active in numerous industry organizations and frequently speaks at industry events around the world. Before DD&A, Jones was vice president with Primavera Systems (now part of Oracle), a global leader in project management software. Prior to that, he was principal and a Board of Directors member with Burt Hill, a major A/E firm (now merged with Stantec).
Donna Laquidara-Carr, Ph.D., LEED AP Industry Insights Research DirectorDodge Data & Analytics
Donna Laquidara-Carr currently provides editorial direction, analysis and content to DD&A’s SmartMarket Reports. Prior to this position, she worked for nearly 20 years with DD&A’s Dodge division, where she gained detailed insight into the construction industry.
BU
ILD
ING
A S
AF
ET
Y C
ULT
UR
E: I
MP
RO
VIN
G S
AF
ET
Y A
ND
HE
ALT
H M
AN
AG
EM
EN
T IN
TH
E C
ON
ST
RU
CT
ION
IND
US
TR
YSmartMarket Report
Dodge Data & Analytics 1 www.construction.com SmartMarket Report
Safety and health considerations need to permeate all levels of a construction company’s culture, informing decisions, planning,
activities and behaviors. It is not enough to simply have safety rules, training and protocols in effect. Leading companies nurture a comprehensive safety culture throughout their organizations, both from the top down and the bottom up.
In this report, our latest study on safety management in the construction industry, we take a close look at 33 indicators of a safety culture, including:
• Measures of Management Commitment to Safety and Health
• Worker Involvement in Jobsite Safety• Company Communications on Safety • The Degree to Which Safety is Treated
as a Fundamental Company Value
The �ndings provide a fascinating view across a safety culture spectrum, with nearly equal numbers of companies currently showing high, moderate and low levels of engagement with these indicators. While this reveals that we still have work to do as an industry before safety cultures are prevalent at most companies, it also shows that enough companies now have a strong safety culture in place to begin to identify best practices and inspire improvements that will bene�t the entire industry.
In addition to exploring the elements of a safety culture, the study also provides new data on many of the topics covered in the 2013 Safety Management in the Construction Industry SmartMarket Report, enabling comparisons that suggest some interesting changes.■ Increasing Industry Recognition of the
Importance of the Jobsite Worker to Enhance Safety: Consistently, more respondents in the current study than in the previous one report the important role of jobsite workers in encouraging safety. One of the most telling �ndings is that 85% of respondents now consider jobsite worker involvement to be a critical aspect of a world-class safety program, a
huge jump up from the 66% who selected it previously, which caused it to shift from sixth place to �rst place in the percentage selecting it.
■ Higher Number of Respondents Now Experiencing Bene�ts From Safety Investments: A signi�cantly higher percentage of contractors report:• Decreased Reportable Injuries,
up 10 percentage points in the current study to 81%
• Increased Ability to Contract New Work, up 10 percentage points to 76%
• Increased Ability to Retain Staff, up 18 percentage points to 64%
• Increased Ability to Attract New Staff, up 8 percentage points to 46%
While the business bene�ts of reducing injuries and increasingly being able to contract new work are clear, the ability to retain and attract staff is becoming more important to remain competitive as the construction market grows and the availability of skilled workers tightens.
Strikingly, all of the 10 positive impacts of safety were also experienced by a much higher percentage of those at the high end of the safety culture spectrum, demonstrating its undeniable value to companies seeking to be more competitive.
The �ndings also suggest that we may be on the cusp of a strong increase in the use of online training, potentially spurred by continual advances in mobile devices and better software. This will be an interesting trend to track in our future research.
We would like to thank our premier partners, CPWR and United Rentals, and all of our supporting, contributing and association partners, for helping us to bring this information to the industry.
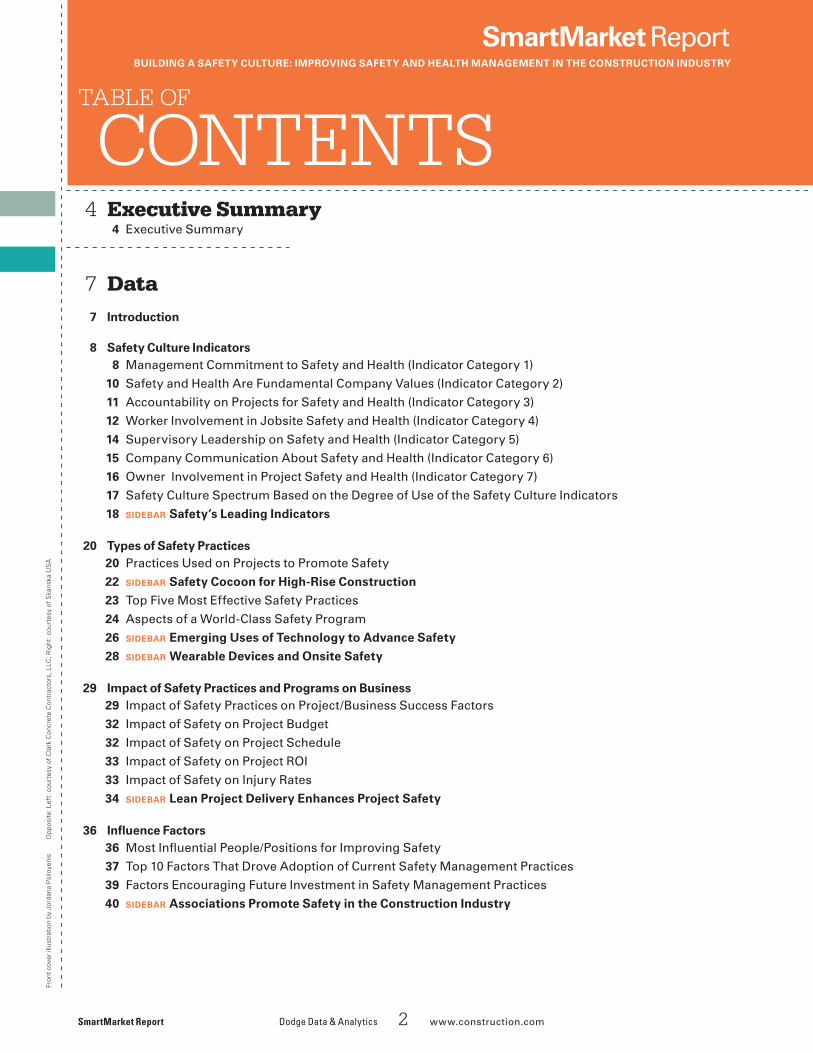
4 Executive Summary 4 Executive Summary
7 Data 7 Introduction
8 Safety Culture Indicators 8 Management Commitment to Safety and Health (Indicator Category 1)
10 Safety and Health Are Fundamental Company Values (Indicator Category 2)
11 Accountability on Projects for Safety and Health (Indicator Category 3)
12 Worker Involvement in Jobsite Safety and Health (Indicator Category 4)
14 Supervisory Leadership on Safety and Health (Indicator Category 5)
15 Company Communication About Safety and Health (Indicator Category 6)
16 Owner Involvement in Project Safety and Health (Indicator Category 7)
17 Safety Culture Spectrum Based on the Degree of Use of the Safety Culture Indicators
18 SIDEBAR Safety’s Leading Indicators
20 Types of Safety Practices 20 Practices Used on Projects to Promote Safety
22 SIDEBAR Safety Cocoon for High-Rise Construction
23 Top Five Most Effective Safety Practices
24 Aspects of a World-Class Safety Program
26 SIDEBAR Emerging Uses of Technology to Advance Safety
28 SIDEBAR Wearable Devices and Onsite Safety
29 Impact of Safety Practices and Programs on Business 29 Impact of Safety Practices on Project/Business Success Factors
32 Impact of Safety on Project Budget
32 Impact of Safety on Project Schedule
33 Impact of Safety on Project ROI
33 Impact of Safety on Injury Rates
34 SIDEBAR Lean Project Delivery Enhances Project Safety
36 In�uence Factors 36 Most In�uential People/Positions for Improving Safety
37 Top 10 Factors That Drove Adoption of Current Safety Management Practices
39 Factors Encouraging Future Investment in Safety Management Practices
40 SIDEBAR Associations Promote Safety in the Construction Industry
TABLE OF
CONTENTS
SmartMarket ReportBUILDING A SAFETY CULTURE: IMPROVING SAFETY AND HEALTH MANAGEMENT IN THE CONSTRUCTION INDUSTRY
SmartMarket Report Dodge Data & Analytics 2 www.construction.com
Fron
t cov
er il
lust
ratio
n by
Jor
dana
Psi
loye
nis
Opp
osite
: Lef
t: c
ourt
esy
of C
lark
Con
cret
e C
ontr
acto
rs, L
LC; R
ight
: cou
rtes
y of
Ska
nska
US
A

42 Training Practices and Communication 42 Safety Training Availability and Requirements
44 Frequency of Safety Training Conducted Online
45 Impact of Safety Training by Role
46 Value of Different Modes of Safety Training by Role
47 Jobsite Worker Safety and Health Training Trends
50 Leadership Training for Supervisors
51 SIDEBAR Best Practices in Safety Training
52 Methodology
53 Resources
Dodge Data & Analytics 3 www.construction.com SmartMarket Report
Left: Clark Construction workers engage in mandatory stretching exercises before starting work.
Below: Skanska is creating a library of simulated safety incidents that are inspired by real events. These simulations help to highlight the root cause of incidents, as well as showcase how to plan for or avoid similar incidents from happening.
CO
NT
EN
TS

BU
ILD
ING
A S
AF
ET
Y C
ULT
UR
E: I
MP
RO
VIN
G S
AF
ET
Y A
ND
HE
ALT
H M
AN
AG
EM
EN
T IN
TH
E C
ON
ST
RU
CT
ION
IND
US
TR
Y A safety culture helps to ensure wider adoption of safety practices and allows companies to better reap the bene�ts of their safety investments. The new �ndings on the in�uence of a safety culture at a construction company, along with striking differences from the �ndings in 2012, demonstrate that encouraging a safety culture is critical, that safety investments in the industry are clearly paying off and that jobsite workers are increasingly recognized as playing a critical role in ensuring high safety performance at construction companies.
Indicators of a Safety CultureA safety culture at a construction company goes beyond adopting speci�c safety practices and policies. Companies with a strong safety culture have a commitment to safety both from the company leadership down and from the jobsite worker up where safety is a fundamental consideration in all planning and activities in the organization.
In order to gauge the degree to which construction companies have adopted a strong safety culture, respondents were asked about the use of leading indicators of a safety culture in their organizations and, where applicable, their level of use at their companies. The respondents are divided almost evenly into three groups, high, moderate and low: a high level of use of these indicators suggests the likelihood that these companies have a strong safety culture.
This safety culture spectrum, especially a comparison of those at the high and low end, was then applied to the rest of the data gathered in the study. The �ndings clearly indicate that companies at the high end of the safety culture spectrum have in place more safety practices, are in�uenced by more factors to invest in safety, and see much stronger impacts from their safety investments than those at the low end of the safety spectrum.
As the chart at right indicates, large companies are more likely to be further along the safety culture spectrum than smaller companies. This may suggest the need for more outreach to smaller companies to help provide the information and resources needed to encourage growth of a safety culture within their organizations.
USE OF SAFETY CULTURE INDICATORSThere is wide recognition of less tangible indicators that focus on the attitudes of companies toward supervisors and jobsite workers, and low levels of use of indicators involving owners and speci�c, procedural approaches.
Executive Summary
SmartMarket Report Dodge Data & Analytics 4 www.construction.com
Degree of Use of Safety Culture Indicators(All Respondents)
4_01_Safety_Management_Batch4_REV_SafetyCultureSpectrum_#02
Dodge Data & Analytics, 2016
Moderate (12 to 19 Indicators)High (20 or More Indicators)
Low (11 Indicators or Less)
General Contractors
33%
Specialty Trade Contractors
30%
All Respondents
35%
33%
37%
30%
33%
37%
32%
Fewer Than 100 Employees
22%
100 to 499 Employees
32%
500 or More Employees
57%32%
46%
50%
18%
32%
11%

BU
ILD
ING
A S
AF
ET
Y C
ULT
UR
E: I
MP
RO
VIN
G S
AF
ET
Y A
ND
HE
ALT
H M
AN
AG
EM
EN
T IN
TH
E C
ON
ST
RU
CT
ION
IND
US
TR
Y ■ Most Widely Used: The most widely used indicators of a safety culture are encouraging workers to report unsafe conditions, holding everyone accountable for safety and having supervisors lead by example.
■ Least Used: Indicators with the lowest levels of use are joint worker/management safety and health committees, recognition and reward for safety and health participation, owners providing incentives for safety and health performance and owners requiring safety and health precerti�cation of all bidders.
The low use of incentives, from rewarding safety and health participation at construction companies to owner incentives for safety, may re�ect growing awareness of the challenge of using direct incentives that may inadvertently discourage workers from reporting potentially unsafe incidents.
Bene�ts of Safety
GROWTH IN THOSE EXPERIENCING BENEFITS FROM 2012More respondents in 2015 reported that they were seeing positive impacts from their safety practices than in 2012, in several key categories. ■ Reportable Injuries: Reducing injuries is the most
immediate goal of safety, and the contractors who reported a positive impact on this goal increased by 10 percentage points between 2012 and 2015.
■ Business Bene�ts: Not only did many more contractors in 2015 than in 2012 note that their safety investments helped them to contract new work, but more also saw improvements in their project ROI in 2015.
■ Staf�ng Bene�ts: With work increasing, workforce shortages are becoming a serious factor for many companies, making the ability to retain existing staff and attract new staff of growing importance. More contractors in 2015 reported that safety had a positive impact on each of these bene�ts than in 2012.
POSITIVE IMPACT OF A STRONG SAFETY CULTUREMore contractors at the high end of the safety culture spectrum consistently report experiencing bene�ts from safety than those at the low end of the spectrum, which demonstrates the powerful payback that can be achieved from committing to developing a strong safety culture at a construction company. The greatest differential between those at the high and low ends of the spectrum include critical success factors for contractors such as
Executive Summary CONTINUED
Dodge Data & Analytics 5 www.construction.com SmartMarket Report
Impact of Safety on Contractor Success Factors (Percentage of Respondents Reporting Positive Impact by Year)
Positive Impact of Safety on Contractor Success Factors (Factors With the Greatest Difference in Percentage Reporting Positive Impact Across the Safety Culture Spectrum)
2012 2015
Reportable Injuries 71% 81%
Ability to Contract New Work 66% 76%
Staff Retention 46% 64%
Project ROI 51% 58%
Ability to Attract New Staff 37% 46%
5_01_Safety_Management_Batch5_ES_Benefits_Matrix_#01
Willingness of Jobsite Workers to Report Unsafe Conditions
Project Quality
Dodge Data & Analytics, 2016
Low Use of Safety Culture IndicatorsHigh Use of Safety Culture Indicators
Staff Retention
Project ROI
Ability to Attract New Staff
95%
60%
88%
56%
79%
45%
75%
38%
67%
27%

BU
ILD
ING
A S
AF
ET
Y C
ULT
UR
E: I
MP
RO
VIN
G S
AF
ET
Y A
ND
HE
ALT
H M
AN
AG
EM
EN
T IN
TH
E C
ON
ST
RU
CT
ION
IND
US
TR
Y improved project quality, the ability to attract and retain staff and improved project ROI. The willingness of jobsite workers to report unsafe conditions is a direct result of a strong safety culture and one of its indicators.
Wider Recognition of the Role of Jobsite Workers for Increased SafetyOne of the most striking differences between the �ndings in 2012 and those in the 2015 study is the increased recognition of the important role of jobsite workers for increased project safety.■ Jobsite workers’ involvement is selected by 85% as an
essential aspect of a world-class safety program, a leap of 19 percentage points above the 2012 �ndings, and now ranking as the top aspect.
■ The highest percentage (64%) rank jobsite workers as one of the top three most in�uential roles for improving safety, demonstrating the importance of investing in worker training.
■ The highest percentage of respondents in 2015 �nd that the jobsite worker is the role most impacted by safety training, a shift from second place in 2012.
■ The six indicators for worker involvement in jobsite safety and health are among the most widely adopted in the industry. In particular, most respondents report that workers are encouraged to report unsafe conditions and near-misses on most of their projects.
Most Effective Safety PracticesThe most effective safety practices are indicated in the chart at right, with providing personal protective equipment (PPE) and especially enforcing its use of primary importance. Most of these are also among the most widely used safety practices, except for conducting a job hazard or safety analysis before construction begins. The relatively low level of use of this practice and the high value attributed to it by those who use it indicate that this is an opportunity for many companies to improve their safety measures.
Drivers for Greater Safety AdoptionThe top factors encouraging companies to adopt safety practices remained consistent with the �ndings from 2012, including concerns about worker health and safety, liability concerns and insurance costs. Reduced insurance rates are also by far the most important driver for future investment in safety management practices and have gained in importance compared with other factors since 2012.
Executive Summary CONTINUED
SmartMarket Report Dodge Data & Analytics 6 www.construction.com
Most Effective Safety Practices(All Respondents)
45%
30%
26%
31%
26%
2_2_Safety_Management_Batch2_Practices_Most Important
Dodge Data & Analytics, 2016
21% 24%
17% 13%
15% 11%
21% 10%
17% 9%
Ranked Second or ThirdRanked First
Enforce Use of PPE
Conduct Job Hazard Analysis/Job Safety Analysis Before Construction Begins
Provide Functional PPE
Include Jobsite Workers in Safety Process
Establish Site-Speci�c Training Programs for Supervisors, Workers, Specialty Contractors
Safety TrainingA few key trends are evident in safety training:■ Online Training: While growth in use has been modest
in the past two years, its use is expected to grow dramatically in the next two years. Far more contractors consider it valuable for supervisors (42%) than for jobsite workers (24%) currently, but it is possible that constantly improving technologies on the jobsite could change that.
■ In�uence of Safety Training: Safety training is considered highly in�uential by a much higher percentage of respondents in 2015 for company leadership (74%) and estimators (41%) than it was in 2012 (63% and 31%, respectively).
■ Most Effective Means of Communicating Safety Messages to Jobsite Workers: Toolbox talks continue to grow in in�uence, with 48% ranking them �rst among the means of communication in 2015 compared with 41% in 2012. That change, and a decline in those selecting training, has resulted in an 18 percentage point difference between those ranking toolbox talks �rst compared with training, a striking increase.

IntroductionData:
Dodge Data & Analytics 7 www.construction.com SmartMarket Report
BU
ILD
ING
A S
AF
ET
Y C
ULT
UR
E: I
MP
RO
VIN
G S
AF
ET
Y A
ND
HE
ALT
H M
AN
AG
EM
EN
T IN
TH
E C
ON
ST
RU
CT
ION
IND
US
TR
Y D
ATA Dodge Data & Analytics (DD&A) �rst conducted
research on safety in 2012 and published the �ndings of that study in the Safety Management in the Construction Industry
SmartMarket Report in 2013. That study established the safety management practices used and most valued in the industry, the bene�ts resulting from investment in safety, the factors that in�uence companies making those investments and trends in training.
This new study builds upon that research by looking at how these critical topics have evolved in the construction industry since 2012. The timing is critically important because, as the amount of work has begun to increase, so have fatalities. DD&A reports a 55% increase in the value of construction starts between 2011 and 2014, and the Bureau of Labor Statistics reports a 16% increase in the number of fatalities in the construction industry in that same period. The recovery of the construction industry has led to more work and the need for more workers, and in turn, this made focusing on safety a necessary priority.
In order to offer deeper insight into how to increase safety, this study, in addition to looking at the evolution of the topics described above over the last three years, also explores the prevalence of a safety culture in the organizations of the survey respondents. It does so by examining 33 indicators of a safety culture. These fall in seven groups:
• Management Commitment to Safety and Health• Recognition of Safety and Health as Fundamental
Company Values• Accountability for Safety and Health on Projects• Worker Involvement in Jobsite Safety and Health• Supervisory Safety and Health Leadership• Effectiveness of Company Communications• Owner Involvement in Safety and Health
The �ndings reveal that the industry falls nearly evenly into three levels along a safety culture spectrum: low, moderate and high (see page 17 for more information). Contrasting the responses from companies at the high end of the range with those at the low end, the �ndings make clear that companies with the elements of a strong safety culture engage in many more safety practices and reap the bene�ts of them. The 33 indicators also offer a way for readers from the construction industry to determine how strong their safety culture is compared with industry norms.
Notes About the DataThe data and analysis in this report are based on an online survey conducted with responses from 254 general contractors, specialty contractors, design-build firms, construction managers and engineering firms. For the purpose of analysis, the category of general contractors used in the report includes design-build firms and construction managers, and the category of specialty contractors includes engineering firms. The online survey was conducted in the fall of 2015.
The data includes comparisons with the study conducted by Dodge Data & Analytics (previously known as McGraw Hill Construction) in 2012, published in 2013. Data from the previous study is identified by the year in which the study was conducted (2012) rather than the date it was published, and data from the current study is also identified by the year it was conducted (2015).
Data gathered in the 2015 study on the use of safety culture indicators was used to create a safety culture spectrum of low, moderate and high. A description of that spectrum can be found on page 17. The spectrum was then used as analytic variable to identify trends throughout the rest of the data on the use of safety practices, the impact of safety on business and project success, influences driving investments in safety and training.
Other analytic variables used commonly throughout the data are the type of company (general contractors or specialty contractors) and size of company by number of employees. More information on these variables and on the survey in general can be found in the methodology section on page 52.

the previous two indicators—just under half—report that their companies have a joint worker/management safety and health committee. Size of company has a particularly strong correlation with the use of this practice: It is reported by 72% of those from companies with 500 or more employees, compared with only 14% of those from companies with fewer than 50 employees. It is likely that small companies do not feel the need for formal committees to engage the input of both workers and management on safety. However, only a little over half report adoption of this practice in companies with between 50 and 499 employees, suggesting that this practice should be considered by more midsize �rms.
Level of Use of Five Indicators of Management CommitmentCompared with the previous three indicators, all �ve of the indicators that can be implemented by degrees are in wider use across the industry, with between 83% and
SmartMarket Report Dodge Data & Analytics 8 www.construction.com
BU
ILD
ING
A S
AF
ET
Y C
ULT
UR
E: I
MP
RO
VIN
G S
AF
ET
Y A
ND
HE
ALT
H M
AN
AG
EM
EN
T IN
TH
E C
ON
ST
RU
CT
ION
IND
US
TR
Y D
ATA The degree of management’s commitment to safety at a
construction company is as critical as the commitment of workers and supervisors to establishing and maintaining a strong safety culture. Management sets the priorities for a company and can profoundly in�uence the behaviors and attitudes of its employees.
Eight indicators reveal the degree to which management is helping to foster a safety culture. For the �rst three, respondents were simply asked whether they used the practice, and the percentage that do are indicated in the pie charts at right. The other �ve, represented in the chart on the next page, include not only whether the respondents adopted these measures, but the level of engagement with each.
Use of Three Indicators of Management Commitment to Safety
FORMAL PROCESS FOR SAFETY-RELATED CORRECTIVE ACTIONNearly three quarters (72%) of respondents report that their companies have a formal process for safety-related corrective action. A formal process demonstrates to workers across the companies that management takes safety concerns seriously.
Medium to large companies (all companies with more than 50 employees) are more likely to have a formal process. This may be due to more formalized procedures in general at larger companies. However, there is no signi�cant difference in the use of a formal process between general and specialty contractors.
SAFETY/HEALTH ARE A KEY PART OF STRATEGIC PLANNINGMaking safety/health a key part of strategic planning is also in use by a majority of companies (69%). Companies that take this approach are proactive rather than reactive to safety concerns.
• Size of Company: While this is a practice reported by nearly all (94%) of the respondents from companies with over 500 employees, it is only used by between half and three quarters of smaller companies.
• Type of Company: This practice is more widely adopted by general contractors (76%) than specialty contractors (60%).
JOINT WORKER/MANAGEMENT SAFETY AND HEALTH COMMITTEEA smaller proportion of respondents than those using
Management Commitment to Safety and Health (Indicator Category 1)
Safety Culture IndicatorsData:
Use of Practices That Indicate Management Commitment to Safety and Health (All Respondents)Dodge Data & Analytics, 2016
Formal Process for Safety-Related Corrective Action
72%
1_05_Safety_Management_Batch1_Indicators_Mangement_Pie_#02
Safety/Health Is a Key Part of Strategic Planning
69%
Company Has Joint Worker/Management Safety and Health Committee
48%

BU
ILD
ING
A S
AF
ET
Y C
ULT
UR
E: I
MP
RO
VIN
G S
AF
ET
Y A
ND
HE
ALT
H M
AN
AG
EM
EN
T IN
TH
E C
ON
ST
RU
CT
ION
IND
US
TR
Y D
ATA
Safety Culture IndicatorsManagement Commitment to Safety and Health (Indicator Category1) CONTINUED
95% of respondents reporting these practices in place at their companies. However, the degree to which they are adopted varies.
JOBSITE MEETINGSBoth of the practices involving meetings—safety/health is a top agenda item at meetings and management participates in all safety and health meetings on the jobsite—are used by nearly all (95% and 90%, respectively) respondents. Over three quarters using these practices are also using them at a high or moderate level. Clearly, meetings are widely used as an opportunity to reinforce safety messages.
• Size of Company: Respondents from very large companies (500 employees or more) are most likely to report a high level of use of both of these indicators.
• Type of Company: 54% of general contractors report that their companies make safety and health as a top agenda item at 70% or more of their meetings, compared with 35% of specialty contractors. However, there is no significant difference in the percentage of general and specialty contractors who report that management participates in safety and health meetings on a high percentage of their project jobsites.
CLEARLY DEFINED SAFETY AND HEALTH EXPECTATIONSMost respondents (93%) report that their companies have clearly de�ned safety and health expectations, and over half of those respondents (57%) believe that this occurs at a high level. There is no signi�cant variation by company size or type, which is not surprising since this practice is so widely adopted across the industry. It is notable, though, that this indicator is more subjective than many of the others.
OTHER PRACTICESMost of the respondents report that their companies practice prevention through design (84%) and use safety and health data for improvement (83%), but they are adopted on a much lower percentage of projects than the practices involving meetings. In both cases, those who report that these practices are used at a moderate level (37% and 40%, respectively) exceeds those who report it at a high level (34% and 33%). More research is needed to discover why these practices, which the data demonstrate are widely known in the industry, are not more widely used.
While there are no signi�cant variations by size or type of �rm for the level of use of practicing prevention
Dodge Data & Analytics 9 www.construction.com SmartMarket Report
Dodge Data & Analytics, 2016
1_04_Safety_Management_Batch1_Indicators_Management_PieBars_#03
Management Participation in All Safety and Health Meetings on Jobsite
90%
High: More Than 70%Moderate: 25% to 70%
Low: Less Than 25% 19%39%42%
Percentage of Projects
Practice Prevention Through Design
84%
High: More Than 70%Moderate: 25% to 70%
Low: Less Than 25% 29%37%34%
Percentage of Projects
Safety/Health Data Used for Improvement
83%
High: More Than 70%Moderate: 25% to 70%
Low: Less Than 25% 27%40%
33%Percentage of Projects
Clearly De�ned Health and Safety Expectations
93%High: More Than 70%
Moderate: 25% to 70%Low: Less Than 25% 12%
31%57%
Percentage of Expectations That Are Well De�ned
Safety/Health Is a Top Agenda Item at Meetings
95%High: More Than 70%
Moderate: 25% to 70%Low: Less Than 25% 17%
35%48%
Percentage of Meetings With Safety/Health a Top Agenda Item
through design, there is a tendency for general contractors (33%) and very large companies of 500 employees or more (51%) to use data for improvement on more than 70% of their projects, compared with specialty contractors (21%) or smaller companies (24%). This may suggest that resource constraints could be a factor in the lower adoption of this practice.
Level of Use of Practices That Indicate Management Commitment to Safety and Health (All Respondents)

BU
ILD
ING
A S
AF
ET
Y C
ULT
UR
E: I
MP
RO
VIN
G S
AF
ET
Y A
ND
HE
ALT
H M
AN
AG
EM
EN
T IN
TH
E C
ON
ST
RU
CT
ION
IND
US
TR
Y D
ATA A safety culture depends on recognition across the
company, from management to workers, that the company has adopted safety and health as fundamental company values.
There is still a lingering perception that safety and productivity are at odds, even though many studies, including this one, demonstrate the positive impact of safety on factors such as project schedule that are tied directly to productivity (see page 29). However, 81% of respondents report that their company values safety and health at least as much as productivity. This is critical if workers are to feel suf�ciently empowered to stop work or ask for changes that may have a brief impact on the productivity of a project.
On the other hand, a much lower percentage (57%) report that their company recognizes/rewards safety and health participation. This is one of the lowest scoring indicators of a safety culture in the study, but that may be due in part to the challenge of rewarding safety without inadvertently incentivizing workers to fail to report safety infractions. It is more commonly reported by general contractors (65%) than specialty contractors (47%).
A relatively high percentage (89%) report that their companies encourage safety and health mentoring. Also notable is that the highest percentage believe that the majority of their company leadership (more than 70%) encourage mentoring, which, again, supports the perception that safety is valued at their company.
The degree to which companies factor safety and health into planning and bidding is very similar to their encouragement of mentoring, with 90% reporting this occurs at some level, and the highest percentage (39%) who say it occurs on more than 70% of their projects. However, a higher percentage of general contractors (43%) factors safety and health into planning and bidding than specialty contractors (26%), but there were no signi�cant differences by company type for mentoring.
Variation by Size of CompanyAll of the indicators that safety and health are fundamental company values are more widely reported by respondents at large companies, especially those with 500 or more employees, than at smaller companies. This suggests that the industry needs to �nd ways to encourage smaller companies to adopt these approaches. Concerns about the time involved may prevent companies from adopting such key indicators as encouraging mentoring or making sure safety is factored into planning and bidding.
Safety Culture Indicators CONTINUED
SmartMarket Report Dodge Data & Analytics 10 www.construction.com
Safety and Health Are Fundamental Company Values(Indicator Category 2)
Dodge Data & Analytics, 2016
Encourage Safety and Health Mentoring
89%High: More Than 70%
Moderate: 25% to 70%Low: Less Than 25%
1_02_Safety_Management_Batch1_Indicators_CompanyValue_PieBars_#02
22%34%
44%
Percentage of Leadship That Encourages Safety and Health Monitoring
Factor Safety and Health Into Planning and Bidding
90%High: More Than 70%
Moderate: 25% to 70%Low: Less Than 25% 27%
34%39%
Percentage of Jobs on Which Safety and Health Are Factored in
Dodge Data & Analytics, 2016
Value Safety and Health at Least as Much as Productivity
81%
1_03_Safety_Management_Batch1_Indicators_CompanyValue_Pie_#02
Recognize/Reward Safety and Health Participation
57%
Use of Practices That Indicate That Safety and Health Are Fundamental Company Values (All Respondents)
Level of Use of Practices That Indicate That Safety and Health Are Fundamental Company Values (All Respondents)

BU
ILD
ING
A S
AF
ET
Y C
ULT
UR
E: I
MP
RO
VIN
G S
AF
ET
Y A
ND
HE
ALT
H M
AN
AG
EM
EN
T IN
TH
E C
ON
ST
RU
CT
ION
IND
US
TR
Y D
ATA A key part of a safety culture is universal recognition
within a company that all employees are accountable for safety on projects, not just designated safety personnel. Three indicators measure the degree to which a company fosters widespread accountability for safety and health on projects.
Accountability The �rst indicator reveals the wide recognition of safety accountability in the construction industry. Nearly all (97%) of respondents feel that everyone is held accountable for safety on at least some of their projects and a very high percentage (73%) see this happening on more than 70% of their projects. Given how widespread this perception is, it is not surprising that there are no signi�cant differences by company type or size on this issue.
Near-MissesThe �ndings also demonstrate that near misses are being taken seriously and investigated, with most (95%) reporting that this takes place on at least some of their projects. 60% report that this occurs on more than 70% of their projects, still a very high percentage, though a little short of those seeing widespread accountability in general. Use of this practice is most common at a high level among companies with 100 or more employees (78%), but it drops off sharply among smaller companies (42%). This may be due to larger companies having better established procedures and resources for investigation, but it is a disparity that the industry may bene�t from addressing.
External Safety and Health AuditsUse of external safety and health audits are far less commonly reported by respondents, with only 74% reporting this occurring on any of their projects. Less than half (41%) of them report the use of audits on 70% or more of their projects, and nearly one third (31%) report it on less than one quarter of their projects.
As with near-misses, there is no signi�cant difference between general and specialty contractors in their degree of use of this practice, but there is a notable difference by size of �rm. Nearly half of the respondents from companies with over 500 employees (49%) report a high level of use, but less than one quarter from companies with fewer than 50 employees report the same. It is possible that the cost of external audits as a share of
Safety Culture Indicators CONTINUED
Dodge Data & Analytics 11 www.construction.com SmartMarket Report
Accountability on Projects for Safety and Health (Indicator Category 3)
Use of Practices That Create Accountability on Projects for Safety and Health (All Respondents)Dodge Data & Analytics, 2016
Hold Everyone Accountable for Safety
97%
High: More Than 70%Moderate: 25% to 70%
Low: Less Than 25%
1_06_Safety_Management_Batch1_Indicators_Accountable_PieBars_#02
7%20%
73%Percentage of Projects
Near-Misses Taken Seriously and Investigated
95%
High: More Than 70%Moderate: 25% to 70%
Low: Less Than 25% 18%22%
60%Percentage of Near-Misses
Use External Safety and Health Audits
74%
High: More Than 70%Moderate: 25% to 70%
Low: Less Than 25% 31%28%
41%Percentage of Projects
overall expenses is much lower on very large projects than on the smaller ones, so it may be harder for smaller �rms to justify the ROI for these expenses for many of their projects.

BU
ILD
ING
A S
AF
ET
Y C
ULT
UR
E: I
MP
RO
VIN
G S
AF
ET
Y A
ND
HE
ALT
H M
AN
AG
EM
EN
T IN
TH
E C
ON
ST
RU
CT
ION
IND
US
TR
Y D
ATA While management recognition of the value of safety
is critical to a safety culture (see page 8), it is equally important that the workers themselves are actively engaged in and take full responsibility for safety. In addition, companies need to recognize and encourage worker input on safety at all levels of planning.
The study �ndings demonstrate that generally, workers are highly engaged with safety in the industry. The six indicators of worker involvement in jobsite safety are all reported by more than 90% of respondents, although the degree to which they are used at a high level does vary. These indicators fall into three categories, which will be discussed in the order of frequency of use: communication about problems; stop-work authority; and involvement in planning and analysis.
Communication About ProblemsWorkers are the most likely to be aware of problems onsite that can impact safety or to be aware of ‘near-misses,’ which may indicate a safety issue that should be addressed to prevent further problems. A company with a strong safety culture will actively encourage workers to report these issues.
It is important that nearly all of the respondents (99%) �nd that workers are encouraged to report unsafe conditions, the highest percentage of any safety culture indicator included in the study. In addition, nearly three quarters (71%) �nd that this occurs on more than 70% of their projects. Generally, this is also widely adopted regardless of size of company, although it is particularly common at a high level among respondents from companies with 500 or more employees, reported by 85%. This is a fundamental building block of safety culture, and its wide adoption in the study demonstrates how effective the industry has been in encouraging this practice.
Nearly as high a percentage (97%) of respondents believe that workers are encouraged to report near-misses in their company, and two thirds �nd that this occurs on a high (70% or more) percentage of their projects. Again, this suggests that this behavior has become a standard industry practice, and companies that do not have strong performance in this area are not living up to a general industry standard.
While a high percentage (96%) also report that workers are asked for input on site safety and health conditions, this is less frequently reported on a high percentage of projects, with less than half (48%)
Safety Culture Indicators CONTINUED
SmartMarket Report Dodge Data & Analytics 12 www.construction.com
Worker Involvement in Jobsite Safety and Health(Indicator Category 4)
Indicators of Worker Involvement in Jobsite Safety and Health (All Respondents)Dodge Data & Analytics, 2016
Workers Encouraged to Report Unsafe Conditions
99%
High: More Than 70%Moderate: 25% to 70%
Low: Less Than 25%
1_08_Safety_Management_Batch1_Indicators_Workers_PieBars_#02
Percentage of Projects
Workers Encouraged to Report Near-Misses
97%
High: More Than 70%Moderate: 25% to 70%
Low: Less Than 25% 10%24%
66%
Percentage of Projects
Workers Asked for Input on Site Safety and Health Conditions
96%
High: More Than 70%Moderate: 25% to 70%
Low: Less Than 25% 17%35%
48%Percentage of Projects
Workers Given Stop-Work Authority
94%
High: More Than 70%Moderate: 25% to 70%
Low: Less Than 25% 18%23%
59%
Percentage of Projects
Workers Involved in Safety and Health Planning
92%
High: More Than 70%Moderate: 25% to 70%
Low: Less Than 25% 30%40%
30%Percentage of Projects
Workers Involved in Job-Hazard Analyses
90%
High: More Than 70%Moderate: 25% to 70%
Low: Less Than 25% 25%29%
46%Percentage of Projects
6%23%
71%

BU
ILD
ING
A S
AF
ET
Y C
ULT
UR
E: I
MP
RO
VIN
G S
AF
ET
Y A
ND
HE
ALT
H M
AN
AG
EM
EN
T IN
TH
E C
ON
ST
RU
CT
ION
IND
US
TR
Y D
ATA reporting this occurs on 70% or more of their projects.
Midsize companies, those with between 10 and 49 employees, are less likely to participate in this practice than smaller or larger ones, with only 33% reporting it at a high level. At very small companies, it may be easier to have open lines of communication between workers and leadership, and at large companies, it is more likely that formal communication policies are in place, which may be why these small-to-midsize companies are most at risk of not seeing this practice used on a high percentage of their projects.
Stop-Work AuthorityProviding jobsite workers authority to stop work is a common practice, with 94% reporting that it occurs on at least some of their projects. 59% of those who report it also see it occurring on more than 70% of their companies’ projects.
This practice is more prevalent among large companies, with less than half of the respondents from companies with fewer than 50 employees reporting this occurring at a high level, compared with 81% of respondents from companies with over 500 employees. This may suggest that this particular practice is most likely to be the result of a highly formalized safety procedure, which is more likely to be found at the largest companies.
There is no statistical difference, though, for this practice between general and specialty contractors.
Safety Culture IndicatorsWorker Involvement in Jobsite Safety and Health (Indicator Category 4) CONTINUED
Worker Involvement in Safety Planning and AnalysesWhile still widely adopted on a general basis, these indicators see the lowest overall adoption levels of all the safety culture indicators involving jobsite worker involvement. In each case, the percentage who report at least some activity at their companies is still very high, with 92% reporting that workers are involved with safety and health planning and 90% reporting that workers are involved in job-hazard analysis on at least some of their projects.
However, the degree to which these practices are adopted is far lower than the previous indicators.
• Only 30% report that workers are involved in safety and health planning on more than 70% of projects, and 30% also report that this occurs on less than 25% of their projects.
• Less than half (46%) report that workers are involved with job-hazard analysis on more than 70% of projects, and one quarter report that this occurs on less than 25% of their projects.
In general, these �ndings indicate a broad awareness of each of these measures. It also suggests, though, that there must be fundamental obstacles that the industry needs to investigate to see more widespread adoption of these practices.
Involving workers in jobsite hazard analyses on a high percentage of projects is correlated with company size. 64% of respondents from companies with 500 employees or more see this implemented on a high level of projects, compared with 28% from companies with fewer than 100 employees.
Dodge Data & Analytics 13 www.construction.com SmartMarket Report
BU
ILD
ING
A S
AF
ET
Y C
ULT
UR
E: I
MP
RO
VIN
G S
AF
ET
Y A
ND
HE
ALT
H M
AN
AG
EM
EN
T IN
TH
E C
ON
ST
RU
CT
ION
IND
US
TR
Y D
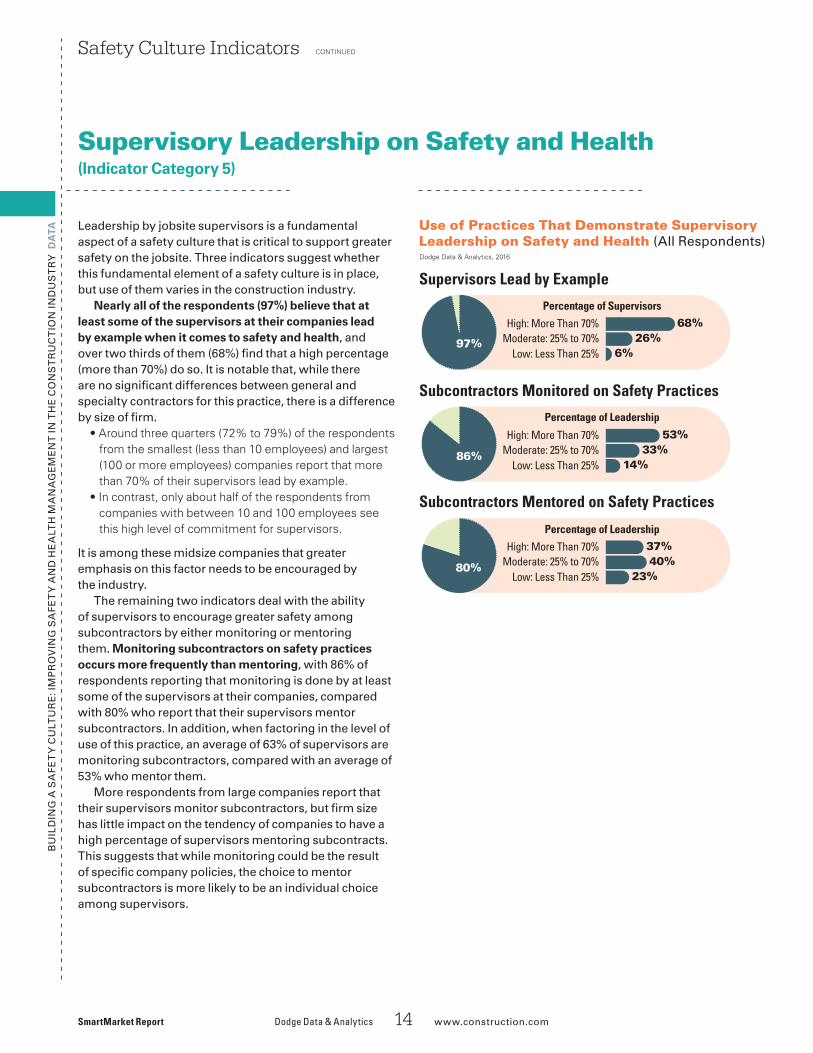
ATA Leadership by jobsite supervisors is a fundamental
aspect of a safety culture that is critical to support greater safety on the jobsite. Three indicators suggest whether this fundamental element of a safety culture is in place, but use of them varies in the construction industry.
Nearly all of the respondents (97%) believe that at least some of the supervisors at their companies lead by example when it comes to safety and health, and over two thirds of them (68%) �nd that a high percentage (more than 70%) do so. It is notable that, while there are no signi�cant differences between general and specialty contractors for this practice, there is a difference by size of �rm.
• Around three quarters (72% to 79%) of the respondents from the smallest (less than 10 employees) and largest (100 or more employees) companies report that more than 70% of their supervisors lead by example.
• In contrast, only about half of the respondents from companies with between 10 and 100 employees see this high level of commitment for supervisors.
It is among these midsize companies that greater emphasis on this factor needs to be encouraged by the industry.
The remaining two indicators deal with the ability of supervisors to encourage greater safety among subcontractors by either monitoring or mentoring them. Monitoring subcontractors on safety practices occurs more frequently than mentoring, with 86% of respondents reporting that monitoring is done by at least some of the supervisors at their companies, compared with 80% who report that their supervisors mentor subcontractors. In addition, when factoring in the level of use of this practice, an average of 63% of supervisors are monitoring subcontractors, compared with an average of 53% who mentor them.
More respondents from large companies report that their supervisors monitor subcontractors, but �rm size has little impact on the tendency of companies to have a high percentage of supervisors mentoring subcontracts. This suggests that while monitoring could be the result of speci�c company policies, the choice to mentor subcontractors is more likely to be an individual choice among supervisors.
Safety Culture Indicators CONTINUED
SmartMarket Report Dodge Data & Analytics 14 www.construction.com
Supervisory Leadership on Safety and Health(Indicator Category 5)
Use of Practices That Demonstrate Supervisory Leadership on Safety and Health (All Respondents)Dodge Data & Analytics, 2016
Supervisors Lead by Example
97%
High: More Than 70%Moderate: 25% to 70%
Low: Less Than 25%
1_07_Safety_Management_Batch1_Indicators_Supervisors_PieBars_#02
Percentage of Supervisors
Subcontractors Monitored on Safety Practices
86%
High: More Than 70%Moderate: 25% to 70%
Low: Less Than 25% 14%33%
53%Percentage of Leadership
Subcontractors Mentored on Safety Practices
80%
High: More Than 70%Moderate: 25% to 70%
Low: Less Than 25% 23%40%37%
Percentage of Leadership
6%26%
68%

BU
ILD
ING
A S
AF
ET
Y C
ULT
UR
E: I
MP
RO
VIN
G S
AF
ET
Y A
ND
HE
ALT
H M
AN
AG
EM
EN
T IN
TH
E C
ON
ST
RU
CT
ION
IND
US
TR
Y D
ATA Good communication across a company is important
to help sustain a good safety culture. Four indicators directly deal with this issue. With the �rst two, which deal directly with the communication of safety and health policies, respondents were asked simply whether these indicators were used by their companies or not. With the latter two, respondents were asked to identify both the use of the indicator and the degree of its use at their companies.
Safety and Health Policy CommunicationMost respondents (92%) believe that safety and health policies are clearly communicated to all employees. A notably lower percentage (83%) believe that the policies are communicated consistently, although this is still a very high percentage overall. These �ndings are relatively consistent by type of �rm and by size of �rms. Therefore, the �ndings as a whole indicate that the industry believes that safety and health policy communications are generally handled effectively.
Other Communication Indicators92% of respondents report that at least some of their managers regularly engage with workers one-on-one.However, less than half (40%) report that most of their managers (more than 70%) engage in this practice, and nearly the same percentage (43%) �nd this engagement occurs at a moderate level for their companies. This suggests that the use of this practice varies based on the manager and is not typically formulated in company policy.
Manager one-on-one engagement with workers is also one of the few practices most commonly done at a high level by small companies, with 59% of respondents from companies with less than 10 employees identifying this at a high level, compared with 34% of respondents from larger companies. It may be easier for managers at small companies to be able to engage with their workers one-on-one, since there are likely to be fewer workers per manager.
85% of respondents report that safety and health policies are coordinated with all subcontractors. 52% report that this occurs at a high level. Unlike the previous communication indicator, this one follows the pattern of most of the others in terms of wider use by larger companies, with 66% who work for companies with 500 or more employees reporting a high level of occurrence,
Safety Culture Indicators CONTINUED
Dodge Data & Analytics 15 www.construction.com SmartMarket Report
Company Communication About Safety and Health(Indicator Category 6)
Type and Degree of Communication About Safety and Health (All Respondents)Dodge Data & Analytics, 2016
Managers Regularly Engage With Workers One-on-One
92%
High: More Than 70%Moderate: 25% to 70%
Low: Less Than 25%
1_09_Safety_Management_Batch1_Indicators_Communicate_PieBars_#02
17%43%40%
Percentage of Managers
Safety and Health Policies Coordinated With All Subcontractors
85%
High: More Than 70%Moderate: 25% to 70%
Low: Less Than 25% 16%32%
52%
Percentage of Policies
Dodge Data & Analytics, 2016
Safety and Health Policies Communicated Clearly to All Employees
92%
1_10_Safety_Management_Batch1_Indicators_Communicate_Pie_#02
Safety and Health Policies Communicated Consistently
83%
Communication Practices That Are Indicators of a Safety Culture (All Respondents)
compared with 34% from companies with less than 100 employees. This makes it more likely that this indicator is more in�uenced by formalized company policy than the previous one.

BU
ILD
ING
A S
AF
ET
Y C
ULT
UR
E: I
MP
RO
VIN
G S
AF
ET
Y A
ND
HE
ALT
H M
AN
AG
EM
EN
T IN
TH
E C
ON
ST
RU
CT
ION
IND
US
TR
Y D
ATA
greater opportunities for safety and health issues that could be captured by audits, and, therefore, owners of those projects may be more attuned to the risks they pose.
While the �ndings indicate that owners are actively engaged in helping to improve safety and health on their projects, there is a relatively low degree of activity compared with many of the other indicators of a safety culture included in the study. This suggests that more owner engagement could help to improve safety culture across the industry.
Three of the six indicators of owner involvement in safety and health are noted by more than 80% of respondents:
■ Owners Monitor Onsite Safety and Health Performance (87%): An unsafe project can hurt the schedule, the budget and the owners’ reputation, and depending on the contract, owners may be exposed to some legal liability as well. Therefore, it is not surprising that the highest percentage of contractors note that owners monitor onsite safety and health performance. • Contractors report that nearly equal numbers of owners
engage in low, moderate and high levels of monitoring activity, suggesting a broad spread of different owner behaviors in the industry.
• 43% of contractors in the South report that owners engage in these activities, nearly double the 23% of contractors from the East and 24% from the Midwest.
■ Owners Participate in Safety and Health Activities (84%): Owner participation is noted by a relatively high percentage of contractors. However, similar to monitoring, the nearly even split among the contractors reporting low, moderate or high levels of owner participation suggest that this varies widely from owner to owner. Also similar to the previous indicator, a signi�cantly higher percentage of contractors from the South (45%) report owner participation, compared with those in the East (21%), Midwest (21%) or West (18%).
■ Owners Support Safety and Health Audits (82%): Owner support of safety and health audits ensures that concerns over productivity or schedule do not interfere with making safety a priority. A relatively high percentage of contractors (82%) report that at least some of their owners support these audits, and use of this at a high level is reported by the highest percentage of contractors (43%) of any of the owner indicators. • 26% of respondents from companies with fewer than
100 employees do not report that any owners provide this support, compared with just 2% of those from larger companies. This may be related to the size of the projects that smaller and larger companies are involved with. Larger projects are often more complex and have
Safety Culture Indicators CONTINUED
SmartMarket Report Dodge Data & Analytics 16 www.construction.com
Owner Involvement in Project Safety and Health (Indicator Category 7)
Indicators of Owner Involvement in Safety and Health Measures on Projects (All Respondents)Dodge Data & Analytics, 2016
Owners Monitor Onsite Safety and Health Performance
87%
High: More Than 70%Moderate: 25% to 70%
Low: Less Than 25%
1_11_Safety_Management_Batch1_Indicators_Ownerss_PieBars_#02
31%33%36%
Percentage of Owners
Owners Participate in Safety and Health Activities
84%
High: More Than 70%Moderate: 25% to 70%
Low: Less Than 25% 34%33%33%
Percentage of Owners
Owners Support Safety and Health Audits
82%
High: More Than 70%Moderate: 25% to 70%
Low: Less Than 25% 26%31%
43%Percentage of Owners
Owners Require Safety and Health Precerti�cation of All Bidders
77%
High: More Than 70%Moderate: 25% to 70%
Low: Less Than 25% 38%35%
27%Percentage of Owners
Owners Provide Incentives for Safety and Health Performance
59%High: More Than 70%
Moderate: 25% to 70%Low: Less Than 25% 43%
29%28%
Percentage of Owners

BU
ILD
ING
A S
AF
ET
Y C
ULT
UR
E: I
MP
RO
VIN
G S
AF
ET
Y A
ND
HE
ALT
H M
AN
AG
EM
EN
T IN
TH
E C
ON
ST
RU
CT
ION
IND
US
TR
Y D
ATA
Safety Culture IndicatorsOwner Involvement in Project Safety and Health (Indicator Category 7) CONTINUED
Dodge Data & Analytics 17 www.construction.com SmartMarket Report
Degree of Use of Safety Culture Indicators(All Respondents)
Dodge Data & Analytics has developed a three-tier safety culture spectrum to rank respondents in terms of the level of their companies’ engagement with the 33 indicators of a safety culture described on pages 8 to 17. ■ High: 20 or more indicators■ Moderate: 12 to 19 indicators■ Low: 11 indicators or less
As the chart at right shows, they fall roughly evenly along these tiers when taken as a whole, but interesting variations occur between general and specialty contractors, and across company size ranges.
These ranking tiers are included in analyses of data �ndings throughout the rest of the report. The analysis shows that companies that rank high on the safety culture spectrum are also more likely to have adopted safety practices at high levels and to reap the bene�ts from these practices.
Safety Culture SpectrumBased on the Degree of Use of the Safety Culture Indicators
Just over three quarters of contractors (77%) report that at least some of the owners they work with require safety and health precerti�cation of all bidders.However, this is just an emerging trend in the industry, and so it is not surprising that the largest share of respondents (38%) report that less than one quarter of their project owners engage in this practice. This �nding suggests a growing recognition in the industry of the importance of including safety and health considerations in the team selection process.
As with safety and health audits, the reported level of use of this indicator is correlated with company size. A much higher percentage of respondents from companies with fewer than 100 employees (35%) report not seeing this implemented at all by owners, compared with
respondents from companies with 500 employees or more (4%). Again, this is currently much more likely to be implemented on large projects than on small ones, but the bene�ts reported may eventually encourage broader adoption on smaller projects.
Only 59% of contractors report that any of the owners they work with provide incentives for safety and health. Notably, the largest group of them (43%) only see this among less than 25% of owners. By being applied at the company rather than the individual employee level, this could be a valuable incentive for prioritizing safety, but it must involve clear metrics that include the indicators of a safety culture rather than just the reported incidents on a project to avoid the possibility of inadvertently discouraging workers from reporting incidents.
4_01_Safety_Management_Batch4_REV_SafetyCultureSpectrum_#02
Dodge Data & Analytics, 2016
Moderate (12 to 19 Indicators)High (20 or More Indicators)
Low (11 Indicators or Less)
General Contractors
33%
Specialty Trade Contractors
30%
All Respondents
35%
33%
37%
30%
33%
37%
32%
Fewer Than 100 Employees
22%
100 to 499 Employees
32%
500 or More Employees
57%32%
46%
50%
18%
32%
11%

BU
ILD
ING
A S
AF
ET
Y C
ULT
UR
E: I
MP
RO
VIN
G S
AF
ET
Y A
ND
HE
ALT
H M
AN
AG
EM
EN
T IN
TH
E C
ON
ST
RU
CT
ION
IND
US
TR
Y
Before Balfour Beatty instituted its Zero Harm program in 2012, the number of high-potential
incidents—near-misses that could have resulted in serious injury—reported annually throughout the company’s global operations was almost none. Suspecting signi�cant underreporting, the �rm changed its response to the high-potential incidents that did get reported. Instead of a fault-focused investigation, the �rm instituted what it calls a 72-Hour Conference,
Safety’s Leading Indicators
The presence of the key leading indicators of construction safety provide insight into the state of a company’s safety culture. A strong safety culture is proactive about safety rather than reactive and helps ensure safer, more productive jobsites by supporting a strong safety climate.
SmartMarket Report Dodge Data & Analytics 18 www.construction.com
Sidebar: Safety Culture and Safety Climate
in which senior staff meet via Skype within days of an incident to generate an understanding of it, and to determine what changes could prevent similar incidents in the future. As a result, the �rm now leads the industry in the number of high-potential incidents reported.
“We turned it completely around,” says Steve Smithgall, senior vice president of safety, health and environment at Balfour Beatty. “Instead of assigning blame, we thank the people onsite who put the report together, and we turn the incident into a lesson learned that we can share around the company.”
This kind of proactive approach is one example of how Balfour Beatty has begun to address some of the leading indicators of a safety culture and a safety climate, such as management commitment and employee empowerment.
Safety Culture and Safety ClimateResearchers organize the forces and factors shaping construction safety into two concepts: safety culture and safety climate.
Safety culture encompasses “the deeply held, but often unspoken, safety-related beliefs, attitudes and values that interact with an organization’s systems, practices, people and leadership to establish norms about how things are done in the organization,” according to a de�nition published by CPWR—The Center for Construction Research
and Training. Balfour Beatty’s Zero Harm program, with its goals of zero fatalities, zero injuries causing long-term disabilities and zero harm to the public as a result of the company’s work, is an example of a company’s attempt to work toward achieving a safety culture.
On the other hand, the safety climate on a construction worksite refers to managements’ and workers’ shared perceptions of how well a company’s stated safety policies & procedures match real conditions on the jobsite. It may be in�uenced by things such as project scheduling and planning methods and norms of the trades working on-site.
From research in consultation with industry stakeholders, CPWR has identi�ed and described eight key leading indicators for a safety culture:
• Demonstrating management commitment
• Aligning and integrating safety as a value
• Ensuring accountability at all levels• Improving supervisory leadership• Empowering and involving
workers• Improving communication• Training at all levels• Encouraging owner/client
involvement
A Two-Way ArrowSafety culture and climate are mutually formative—“a two-way arrow,” says Dr. Linda Goldenhar, CPWR’s director of research and
This young man’s highlighter-green hat announces that he’s new to his job. The hat gives him permission to ask all the questions he needs to, and it tells other workers on the jobsite to watch out for him and help keep him safe.
Pho
tos
cour
tesy
of C
lark
Con
cret
e C
ontr
acto
rs, L
LC

BU
ILD
ING
A S
AF
ET
Y C
ULT
UR
E: I
MP
RO
VIN
G S
AF
ET
Y A
ND
HE
ALT
H M
AN
AG
EM
EN
T IN
TH
E C
ON
ST
RU
CT
ION
IND
US
TR
Y
Dodge Data & Analytics 19 www.construction.com SmartMarket Report
Sidebar: Safety Culture and Safety Climate CONTINUED
evaluation—so that a change in either one can yield results in the other. Balfour Beatty’s change in attitude toward high-potential incidents, for example, enabled it to learn more about them, and to identify falling objects from elevated work as the most common type. In response, the �rm focused education efforts on roping off areas below elevated work—adding the issue to a phone app that prompts safety of�cers on site tours, for example—thereby translating an improvement in safety culture into an improvement in safety climate.
Conversely, the achievement of an exceptional safety climate over the course of a project can reinforce a company’s safety culture. On the U.S. Navy’s Camp Pendleton Replacement Hospital, a Clark/McCarthy joint venture delivered a four-year construction project comprising over 2.6 million work hours with zero DART (days away, restricted or transferred) or lost-time incidents. The project built its exemplary safety climate with strong support from the client, initial orientations to safety as part of a larger mission for a place of healing, weekly site walks by a joint government-contractor safety team looking for ways to improve, monthly meetings to review and recognize safety-based behaviors, and celebrations to acknowledge major safety milestones.
When the project director for Camp Pendleton, Carlos Gonzalez, a vice president with Clark, moved East to take on the leadership of the �rm’s self-perform concrete business unit in the Mid-Atlantic region, he brought all of the lessons from the Camp Pendleton safety
climate with him. As measured by the severity of workplace injuries across all sites over a three-year period, importing those lessons into the concrete business unit’s safety culture has improved it by an order of magnitude: the company’s expenditures on injury treatment and rehabilitation (to which Clark continues to be committed, Gonzalez emphasizes) have dropped from two dollars per person-hour to 20 cents. In another measure of the business unit’s boosted safety culture, the American Subcontractors Association of Metro Washington has recognized Clark as General Contractor of the Year in overall jobsite safety for the last two years running.
Targeting ChangeThe academic de�nitions of safety culture and safety climate may not correspond to the way construction
safety practitioners use the terms. But that’s okay: “Which term someone uses is probably less important than knowing where to target needed change to improve overall safety performance,” Dr. Goldenhar says in a recent interview with Professional Safety, the journal of the American Society of Safety Engineers. “Do corporate safety policies need to be improved (culture) or is it a matter of how good policies are implemented on the jobsite (climate)?”
The point is to work from the leading indicators of a safety culture, not react—or underreact—to problems as they arise. For companies wanting to check their own policies and practices against these key leading indicators, a questionnaire and workbook are available from CPWR (whose website can be found on page 53). n
These workers’ paid and mandatory 15 minutes of warm-ups and stretching at the start of each day reduce injuries directly by helping to ready workers’ bodies for the exertions of the day, and indirectly by strengthening the site’s safety climate, and reinforcing the firm’s safety culture.
Pho
tos
cour
tesy
of C
lark
Con
cret
e C
ontr
acto
rs, L
LC

SmartMarket Report Dodge Data & Analytics 20 www.construction.com
BU
ILD
ING
A S
AF
ET
Y C
ULT
UR
E: I
MP
RO
VIN
G S
AF
ET
Y A
ND
HE
ALT
H M
AN
AG
EM
EN
T IN
TH
E C
ON
ST
RU
CT
ION
IND
US
TR
Y D
ATA The study looked at 16 practices used to promote safety
by contractors. The practices fall into four major groups: organizational safety practices, those involving personal protective equipment (PPE), those involving equipment, and general safety policies.
• At least one practice in each category (and a total of 7 of the 16) are used by 80% or more of the respondents, suggesting that a broad approach to safety is widely adopted in the construction industry.
• However, at least two of the categories, organizational safety practices and safety policies, include practices that are adopted by fewer than two thirds of the respondents. This suggests that these categories may offer the greatest opportunity for improvement in the industry.
Organizational Safety Practices
OVERALL USE OF PRACTICES Nearly all contractors who participated in the study (93%) maintain an open-door policy for workers to report hazards, incidents and concerns. Clearly the construction industry widely recognizes the importance of encouraging jobsite workers to report what they see. Though reactive, this worker engagement is an important element of a strong safety culture.
Two additional organizational practices are used by over 80% of respondents:■ Include Jobsite Workers in Safety Process: With 85%
using this, it ranks as a common practice in the industry. It is also more proactive than having an open-door policy to report safety concerns.
■ Designate Competent Project Safety Personnel: While a strong safety culture does encourage all employees to be responsible for safety (see page 11), having personnel with appropriate safety training designated on a project basis is a good practice that could still be more widely adopted than by the 81% who report using it.
Two out of three of the least frequently adopted safety practices are also the most proactive approaches to safety. Wider use would offer companies a notable opportunity to improve their overall safety performance.
■ Conduct Job Hazard Analysis/Job Safety Analysis Before Construction Begins: Over two thirds of respondents (69%) conduct a formal analysis, which can eliminate the possibility of many problems, and thus improve schedule and reduce cost.
Practices Used on Projects to Promote Safety
Types of Safety PracticesData:
Use of Safety Practices
2_1_Safety_Management_Batch2_Practices_Used_#02
Dodge Data & Analytics, 2016
93%
Maintain Open-Door Policy for Workers to Report Hazards, Incidents, Concerns
Organizational Safety Practices
85%Include Jobsite Workers in Safety Process
81%Designate Competent Project Safety Personnel
93%
Enforce Use of PPE
Safety Practices Involving Personal Protective Equipment (PPE)
87%Provide Functional PPE
73%Inspect PPE for Functionality Prior to Use
69%
Conduct Job Hazard Analysis/Job Safety Analysis Before Construction Begins
68%Do Prompt/Thorough Near-Miss and Incident Investigations
80%Develop Site-Speci�c Safety and Health Plans
Safety Policies
78%
Establish Site-Speci�c Training Programs for Supervisors, Workers, Specialty Contractors
55%Use Prequali�ed Subcontractors Based on Performance
41%
Prevention Through Design: Integrate Safety Mitigation Into Engineering and Design Processes
89%Inspect Equipment for Functionality Prior to Use
Safety Practices Involving Equipment and Protection
79%Install Safety Protection (e.g., guardrails, safety nets, alarms)
43%Offer Safety Incentives
64%Have Measurable Safety Goals and Objectives

BU
ILD
ING
A S
AF
ET
Y C
ULT
UR
E: I
MP
RO
VIN
G S
AF
ET
Y A
ND
HE
ALT
H M
AN
AG
EM
EN
T IN
TH
E C
ON
ST
RU
CT
ION
IND
US
TR
Y D
ATA
■ Prevention Through Design: Integrate Safety Mitigation Into Engineering and Design Processes: Active consideration of project safety during engineering and design can have a big impact on making projects safer without a big cost investment. However, less than half (41%) of contractors report engaging in this practice. The ongoing prevalence of contracting methods that only engage contractors toward the end of the design process are likely to be preventing wider use. General contractors (50%) also report wider use than specialty contractors (29%), which also underscores the need to engage specialty contractors earlier in the construction process to promote the strongest safety outcomes.
There is also an opportunity for more contractors to engage in prompt/thorough near-miss and incident investigations, which are currently only conducted by 68% of respondents.
VARIATION BY SIZE OF COMPANYLarge �rms, those with 100 or more employees, are widely using all the organizational practices included in the study except Prevention Through Design, with over 80% (and in many cases over 90%) of respondents from these companies reporting use of the other �ve practices.
Smaller companies, on the other hand, are far more likely to include jobsite workers and designate personnel than they are to have formalized safety processes. More formalized processes such as job hazard/job safety analyses and prompt/thorough near-miss and incident investigations are used by less than three quarters of respondents whose �rms have between 50 and 99 employees and by less than half of those from even smaller companies.
VARIATION BY SAFETY CULTURE SPECTRUMA signi�cantly higher percentage of respondents from companies at the high end of the safety culture spectrum (see page 17) designate competent safety personnel, conduct job hazard/job safety analyses and carry out prompt and thorough near-miss and incident investigations than those whose companies fall lower on the safety culture spectrum.
Safety Practices Involving PPENearly all respondents (93%) enforce use of PPE, although general contractors (96%) are more likely to do so than specialty contractors (89%). Size of �rm is also
Types of Safety PracticesPractices Used on Projects to Promote Safety CONTINUED
correlated to this, with only 76% of respondents from companies with fewer than 10 employees reporting this practice, compared with 99% of those from companies with 100 or more employees.
Providing functional PPE (87%) is also widely used,with no difference in use by size of company or type of contractors.
However, there is an opportunity for the industry to improve when it comes to inspecting PPE for functionality prior to use, a practice that is not expensive to adopt, but one that is only used by 73% of respondents and by less than two thirds of respondents from small companies.
Safety Practices Involving Equipment and ProtectionMost respondents (89%) report that they inspect equipment for functionality prior to use. The risk of faulty equipment is particularly high on a construction site, so it is not surprising that this result is consistent across small and large companies and across general and specialty contractors.
However, the �ndings differ when it comes to installing safety protection, such as guard rails, safety nets and alarms. While 79% of �rms overall report installing this equipment, a much higher percentage of general contractors (93%) do so than specialty contractors. This is important because general contractors are more likely to set up the site initially, so their high level of use of this practice may be a better indicator of its overall prevalence on jobsites.
Safety PoliciesAll the safety policies included in the study are adopted by a higher percentage of general contractors and companies with over 100 employees than they are by specialty contractors or smaller companies. In fact, differences in adoption of safety policies by companies with 500 or more employees compared with those with fewer than 10 can vary by as much as 40 to 50 percentage points. This is consistent with other �ndings in this study, in which more programmatic safety activities are done more frequently by larger companies.
A relatively high percentage of respondents report developing site-speci�c safety and health plans (80%) and establishing site-speci�c training programs (78%). The fact that these are the most widely adopted of the safety policies included in the study is likely due to OSHA
Dodge Data & Analytics 21 www.construction.com SmartMarket Report

BU
ILD
ING
A S
AF
ET
Y C
ULT
UR
E: I
MP
RO
VIN
G S
AF
ET
Y A
ND
HE
ALT
H M
AN
AG
EM
EN
T IN
TH
E C
ON
ST
RU
CT
ION
IND
US
TR
Y D
ATA regulations as well as additional state requirements for
site-speci�c safety plans.Less than two thirds (64%) report that they have
measurable safety goals and objectives. Goals can help companies to manage safety more proactively by providing measurable results about successes rather than just the reduction of injuries and incidents. There is a particularly wide difference between respondents from companies with over 100 employees, 86% of whom report having these kinds of goals, and those from companies with fewer than 50 employees, with only 40% reporting the same.
While it is not surprising that the overall percentage of respondents is relatively low for the
Types of Safety PracticesPractices Used on Projects to Promote Safety CONTINUED
use of prequali�ed subcontractors based on safety performance, the higher percentage reported by general contractors (70%) suggests that this practice may be becoming more common in the industry. Wider use could have strong implications for safety in the long run, as the ability to obtain contracts directly hinges on a subcontractor’s safety record.
The use of safety incentives is the least adopted policy. This may be due in part to growing awareness of concerns of unintended impacts of this measure, where workers refrain from reporting safety concerns or near-misses, or even minor injuries, in order to get the incentive. Contractors using these incentives need to make sure they avoid encouraging behaviors that mask safety problems.
SmartMarket Report Dodge Data & Analytics 22 www.construction.com
High-rise construction presents significant risks, especially in dense urban areas. In recent years, some projects have utilized a safety “cocoon” system to provide greater protection against falls and dropped materials. The system was utilized for the first time on a hybrid and concrete building at One World Trade Center in New York City.
A netting system surrounds the top floors under construction to protect the initial trades such as steel, concrete and spray fireproofing. At One World Trade Center, steel-framed netting surrounded the top four floors—where work was under way—with trailing nets that extend up to 20 floors below.
The system can be raised to follow work as it advances up a tower. On One World Trade Center, a crane was used, but on subsequent projects, a hydraulic system was developed to automate that process.
Workers were also able to set up continuous walkways
around the exterior of the building to help crews reach work areas safely and efficiently.
A driving factor behind the use of the system was its ability to catch falling materials such as bolts and washers, says Mike Mennella, executive vice president at AECOM, which was the program manager on One World Trade Center. “If a bolt comes off, work stops for days or, even worse, it causes an injury,” he says.
The cocoon material is also fire resistant so welding can take place nearby without
risk of damage to the netting. Mennella says crews conduct inspections of the cocoon every day and make repairs, as necessary.
The system was designed to withstand wind in excess of 100 miles per hour. “When you have to batten down the hatches during a storm, that gives you a tremendous amount of confidence,” says Tom Leo, senior vice president at AECOM.
The majority of components in the cocoon system are reusable, so they can be moved and installed on numerous projects.
Safety Cocoon for High-Rise Construction
Pho
togr
aph
by J
oe W
oolh
ead

BU
ILD
ING
A S
AF
ET
Y C
ULT
UR
E: I
MP
RO
VIN
G S
AF
ET
Y A
ND
HE
ALT
H M
AN
AG
EM
EN
T IN
TH
E C
ON
ST
RU
CT
ION
IND
US
TR
Y D
ATA Respondents were asked to rank the safety practices they
employ by their effectiveness. The most effective safety practice selected by respondents is to enforce use of personal protection equipment (PPE). Not only was this ranked �rst by the highest percentage of respondents (24%) , but it was also selected among the top three choices by the highest percentage (45%). Clearly, there is a strong call for enforcement of PPE use onsite to ensure a safer jobsite.
Including jobsite workers in the safety process was ranked among the top three by the second highest percentage of respondents (31%). However, it is only ranked �rst by the fourth highest percentage of respondents (10%). This suggests that there is a general consensus that this is very important, but that many respondents �nd other issues more critical.
Conducting job hazard/job safety analyses was ranked by 30% among the top three practices and by 13% as the most effective practice. This factor is also considered most effective by 54% of respondents from companies with 500 or more employees, and over three quarters of them rank it �rst, making it clear how valuable they perceive it to be. It is possible that respondents from the largest companies are more likely to have been involved in job hazard and job safety analyses, so this high percentage is strong evidence for the value of this practice.
However, it is notable that, despite the high degree of effectiveness attributed to conducting job hazard/job safety analyses, this practice is still in relatively limited use (see page 20), especially compared with the other �ve practices identi�ed as most effective in the study. The �nding suggests that contractors have an opportunity to improve site safety by adopting this practice more widely.
Types of Safety Practices CONTINUED
Dodge Data & Analytics 23 www.construction.com SmartMarket Report
Top Five Most Effective Safety Practices
Most Effective Safety Practices(All Respondents)
45%
30%
26%
31%
26%
2_2_Safety_Management_Batch2_Practices_Most Important
Dodge Data & Analytics, 2016
21% 24%
17% 13%
15% 11%
21% 10%
17% 9%
Ranked Second or ThirdRanked First
Enforce Use of PPE
Conduct Job Hazard Analysis/Job Safety Analysis Before Construction Begins
Provide Functional PPE
Include Jobsite Workers in Safety Process
Establish Site-Speci�c Training Programs for Supervisors, Workers, Specialty Contractors

BU
ILD
ING
A S
AF
ET
Y C
ULT
UR
E: I
MP
RO
VIN
G S
AF
ET
Y A
ND
HE
ALT
H M
AN
AG
EM
EN
T IN
TH
E C
ON
ST
RU
CT
ION
IND
US
TR
Y D
ATA
the wide and growing recognition of the importance of the jobsite worker in the industry.
The priorities of larger companies versus smaller companies, however, are more apparent when looking at the next lower size, companies with 100 to 499 employees. 70% or more of respondents from these large companies regard the following four factors as essential, but the percentage of respondents from companies with fewer than 50 employees lag 12 to 30 percentage points behind them in these same factors.■ Strong Safety Leadership Abilities in Supervisors■ Ongoing Access to Safety Training for All Supervisors
and Jobsite Workers■ Prompt and Thorough Incidence and
Near-Miss Investigations■ Staff Positions Dedicated to Safety
In the 2012 study (published in the 2013 Safety Management in the Construction Industry SmartMarket Report), contractors were asked to identify the essential aspects of a world-class safety program. Asking that question again in the current 2015 study allows for the analysis of shifting priorities in contractors’ perspectives on various safety practices.
By far, the most striking difference between 2012 and 2015 is the importance placed on jobsite workers’ involvement in a world-class safety program. In 2012, this was considered essential by 66% of respondents and ranked sixth compared with other factors. In 2015, 85% of the contractors now consider it essential, and it ranks �rst. This �nding is consistent with others throughout the 2015 study that show increasing industry recognition of the importance of engaging jobsite workers directly in safety.
It is notable that the only other signi�cant difference between 2012 and 2015 in the top aspects of a world-class safety program is an increase in the percentage who consider ongoing access to safety training for supervisors and jobsite workers essential. While the leap is less dramatic than the one for worker involvement (an eight percentage point increase in 2015 versus a 19 point gain), it does further reinforce the general trend that more emphasis is now being placed on jobsite workers in safety programs.
For the most part, the other aspects of a world-class safety program were selected by a similar percentage of respondents between 2012 and 2015. This consistency reinforces the widespread recognition in the industry of the importance of such program elements as leadership ability in supervisors, regular safety meetings with jobsite workers and supervisors, hazard assessments and safety plans at each new jobsite, and a strong emphasis on communication.
Variation by Size of FirmFor the most part, a signi�cantly higher percentage of respondents from companies with 500 or more employees consider each of the aspects of a world-class safety program included in the study to be essential. Clearly, the largest companies take a broadly encompassing approach to safety and recognize that a successful program needs to include many factors.
The one exception to this trend is jobsite worker involvement, which was widely recognized as essential by respondents from �rms of all sizes, again reinforcing
Types of Safety Practices CONTINUED
SmartMarket Report Dodge Data & Analytics 24 www.construction.com
Aspects of a World-Class Safety Program
Essential Aspects of a World-Class Safety Program(By Year)
2_3_Safety_Management_Batch2_Practices_WorldClass_Year_#02
Jobsite Workers’ Involvement
Strong Safety Leadership Abilities in Supervisors
Dodge Data & Analytics, 2016
85%
66%
20122015
Regular Safety Meetings With Jobsite Workers and Supervisors
Ongoing Access to Safety Training for Supervisors and Jobsite Workers
77%
Hazard Assessments and Safety Plans at Each New Jobsite
Strong Emphasis on Communication for Company and Project
Prompt and Thorough Incidence and Near-Miss Investigations
82%
81%
80%
81%
69%
76%
70%
71%
68%
63%
61%

BU
ILD
ING
A S
AF
ET
Y C
ULT
UR
E: I
MP
RO
VIN
G S
AF
ET
Y A
ND
HE
ALT
H M
AN
AG
EM
EN
T IN
TH
E C
ON
ST
RU
CT
ION
IND
US
TR
Y D
ATA
Types of Safety PracticesAspects of a World-Class Safety Program CONTINUED
Dodge Data & Analytics 25 www.construction.com SmartMarket Report
2_4_Safety_Management_Batch2_Practices_WorldClass_Matrix_03
Jobsite Workers’ Involvement
Strong Safety Leadership Abilities in Supervisors
Dodge Data & Analytics, 2016
Ongoing Access to Safety Training for Supervisors and Jobsite Workers
Hazard Assessments and Safety Plans at Each New Jobsite
Regular Safety Meetings With Jobsite Workers and Supervisors
93%
Low Use of Safety Culture IndicatorsHigh Use of Safety Culture Indicators
94%
73%
68%
93%
58%
93%
60%
90%
63%
Prompt and Thorough Incidence and Near-Miss Investigations
80%
40%
Strong Emphasis on Communication for Company and Project
84%
56%
Essential Aspects of a World-Class Safety Program (By Companies at the Low and High Ends of the Safety Culture Spectrum)
It is notable that three of these four factors include direct investments or resources needed, from access to ongoing training to dedicated staff. It may be easier for large companies to dedicate resources to these initiatives. However, emphasis on strong leadership abilities in supervisors seems equally attainable in a company of fewer than 10 employees and in a company with more than 100, and more education in smaller companies on the importance of this aspect of a safety program could yield immediate bene�ts.
Variation by Safety Culture SpectrumAs the chart at right demonstrates, respondents from companies at the high end of the safety culture spectrum (see page 17) are far more likely to consider each aspect of a world-class safety program essential, compared with respondents from companies at the low end of the spectrum. This strong degree of difference about the top aspects of a safety culture suggests that those with a strong safety culture in place are more likely to recognize the need for a broad range of safety practices than those without that strong foundation.
Variation by Type of FirmA signi�cantly higher percentage of general contractors than specialty contractors consider the following essential to a world-class safety program: ■ Jobsite Workers’ Involvement: This �nding is
surprising, given that most jobsite workers are employed by specialty contractors.
■ Hazard Assessments and Safety Plans at New Jobsites: The role of the general contractor at the beginning of the project likely contributes to this strong �nding among them.
■ Regular Safety Audits: The need to monitor safety across the life of the project and concerns about liability issues may drive the greater emphasis on this factor among general contractors than specialty contractors.
■ Safety Incentives/Recognition. General contractors may consider incentives to their own employees as well as specialty contractors, thus increasing the value they see in this practice.
Variation by Primary Type of Construction (New or Renovation)The only signi�cant difference in 2015 based on the amount of renovation work conducted is that a higher percentage of those doing more than 50% renovation
projects (90%) regard strong safety leadership abilities in supervisors as important, compared with those doing more new construction (79%).
One factor that may contribute to this �nding is the need during renovation projects to react to unexpected developments onsite more frequently than during new construction projects. Unexpected workarounds may be needed on an ongoing basis for a renovation project that can be avoided in a well-designed and carefully executed new project. In these circumstances, supervisory leadership on safety may be even more important to react to unexpected work and conditions.

BU
ILD
ING
A S
AF
ET
Y C
ULT
UR
E: I
MP
RO
VIN
G S
AF
ET
Y A
ND
HE
ALT
H M
AN
AG
EM
EN
T IN
TH
E C
ON
ST
RU
CT
ION
IND
US
TR
Y
To date, the use of BIM for safety applications is limited, but emerging. Recent Dodge Data &
Analytics data, published in theMeasuring the Impact of BIM on Complex Buildings SmartMarket Report, shows that 18% of owners and 13% of contractors say BIM has a high impact on reducing reportable safety incidents, re�ecting the emerging nature of this BIM metric.
Jonathan Widney, president of technology company Solibri, says he sees untapped potential in the application of BIM for safety. Solibri’s suite of software includes a model checker, which can be applied to safety planning. A company’s ability to leverage data for safety depends largely on its commitment to detailed and updated modeling throughout design and construction of a project, he says.
For example, he says gaps in �oors could be modeled. “If you have an opening of more than a half inch and you need netting below that, you can have that applied as part of a rule set,” he adds. “We’ve seen people modeling to that detail, so it can be done and it can be checked. It takes people who really understand the value of modeling and being able to visualize.”
Code CheckingIn recent years, Turner Construction has developed safety applications of BIM data ranging from simple pre-planning visualization to full BIM-based safety logistics plans.
Emerging Uses of Technology to Advance Safety
With continued adoption of digital tools such as building information modeling, some construction �rms are now exploring the potential uses of these tools for safety planning and training.
SmartMarket Report Dodge Data & Analytics 26 www.construction.com
Sidebar: Safety and Technology
The company began its code checking efforts in 2010, �rst looking at building codes. “That evolved into the idea that you could go beyond building codes to things that apply to us like site safety,” says Jennifer Downey, national BIM manager at Turner Construction. “Anything that’s rules based, we wanted to see if we could check that.”
The company can set up rules in its models to check them against OSHA and local requirements. Downey notes that because codes can vary signi�cantly in different locals, collecting those codes can be daunting. “We set up a matrix of all the different regulations and realized just how complicated it could be,” she adds. “So we started to identify areas that were straightforward to
check in a model, but dif�cult to keep track of as a person.”
Downey says that even simple model checking can be a time-saver. “If you can automate the low-level work, it leaves more time for the complex work,” she says. “You’re really taking advantage of the skills of the person, so they aren’t spending time checking really manual laborious things.”
Site Safety Plans In a parallel effort, Turner is developing BIM-based safety logistics plans. The initiative was launched in 2012 as a means of submitting 3D site safety plans to the New York City Dept. of Buildings. “It gives us a more comprehensive plan that we can submit to the city,”
All
imag
es c
ourt
esy
of S
kans
ka U
SA
Skanska is creating a library of simulated safety incidents that are inspired by real events. These simulations help to highlight the root cause of incidents, as well as showcase how to plan for or avoid similar incidents from happening.

BU
ILD
ING
A S
AF
ET
Y C
ULT
UR
E: I
MP
RO
VIN
G S
AF
ET
Y A
ND
HE
ALT
H M
AN
AG
EM
EN
T IN
TH
E C
ON
ST
RU
CT
ION
IND
US
TR
Y
Dodge Data & Analytics 27 www.construction.com SmartMarket Report
Sidebar: Safety and Technology CONTINUED
Downey says. “We are thinking through in more detail, and we can understand the plan better.”
Although Turner doesn’t submit these same logistics plans for projects in other cities, the initiative has created a useful template for safety planning on any project. “They don’t have the regulations for submitting the drawings, but they are still going through the process and �nd it bene�cial from a modeling standpoint. Simply using the model to preplan in detail has been helpful.”
Charlie Whitney, a project executive at Turner, says these BIM-based site safety plans help Turner “engineer safety into projects earlier, instead of leaving it to the project team as an ‘add-on’ later.”
Other observed bene�ts include:• Better visualization of risk results
in a better plan, and a better plan results in a safer project.
• The tool allows them to convey the plan to the client better (especially valuable in campus or institutional settings).
• More accurate de�nition of scope results in a tighter buy and better execution in �eld.
• It is easier to implement and administer safety.
Safety Planning, Training and EvaluationSkanska is developing multiple digital tools for safety planning, training and evaluation. The company’s initial step is automating the corporate manuals for environmental health and safety that it uses to develop risk pro�les for projects and the controls for mitigating those risks. Skanska is deploying a new system, called PlanIt, which allows users to click
on a potential risk area with a selector tool. “You click on the PlanIt tool, and it automatically downloads a prepopulated and preapproved corporate control program that would mitigate that speci�c risk,” says Paul Haining, chief environmental, health and safety of�cer at Skanska.
PlanIt is part of a larger initiative by Skanska to collect, analyze and leverage data relevant to safety. Haining says that through collection of both lagging and leading indicators, Skanska aims to develop more effective predictability models on projects. “We’re creating a virtual environment where we can predict outcomes relative to BIM models, relative to client processes, relative to movement of people, relative to machinery and other factors,” he says. “We want to be able to identify that risk way ahead of time, using data we’ve collected, before we expose our employees to any potential risk.”
One future step that the �rm is exploring is the use of virtual reality to help better inform its employees. In the past, Skanska has created animations of accidents to better analyze and demonstrate the factors that led to those incidents. Haining
envisions that staff and employees could experience incidents more effectively using virtual reality. “Rather than sitting and watching a video, you can develop a virtual model as an experience, not just an education,” he adds.
The company also plans to use virtual reality for safety training and analysis. Albert Zulps, regional director, virtual design & construction at Skanska USA, says the company hopes to make animations of incidents more interactive by using gaming technology. “Gaming engines are all based on physics and gravity,” he says. “A gaming engine enables us to use gravity and create different situations and explore things we didn’t even know about.”
Zulps says that gaming engines could help the company not only train employees, but also better analyze risk. “We can inject situations that haven’t happened and train people in that same manner, therefore preventing future accidents that we don’t know about yet,” he says. “You learn from your mistakes as much as you do from doing it correctly. That’s what makes having BIM and the ability to access this information very powerful.” n
VDC Director Albert Zulps views Skanska’s virtual Global Safety Stand Down, which is a safety incident report along with an interactive simulation that walks through why and how the incident happened.

BU
ILD
ING
A S
AF
ET
Y C
ULT
UR
E: I
MP
RO
VIN
G S
AF
ET
Y A
ND
HE
ALT
H M
AN
AG
EM
EN
T IN
TH
E C
ON
ST
RU
CT
ION
IND
US
TR
Y
To better monitor potential safety issues in the �eld in real time, the construction industry is rapidly moving
toward wearable technology for workers. A broad range of practices and technology exists—from simple identi�cation systems to advanced health and motion monitoring.
Identifying Worker Skills, Training and LocationsBased on studies of best practices, Associated General Contractors of America (AGC) recommended last year that a simple �rst step could be giving all workers badges with scannable QR codes (quick response codes that can be easily read by a cell phone) that identify each worker’s level of training and certi�cation for operating equipment.
“If you tell a worker to go do a task, most workers, especially new ones, want to say ‘yes’ to the boss,” says AGC spokesperson Brian Turmail. “The worker’s badge could be scanned so you don’t send someone to work on a piece of equipment that they don’t know how to use.”
That type of information could also be included in more automated monitoring systems. Redpoint Positioning offers a “real-time location system” that can track worker locations using indoor GPS that reads tags worn by workers on vests or helmets. The system allows users to map out hazardous zones or restricted-access areas
Wearable Devices and Onsite Safety
Technologies that attach to—or are incorporated in—standard safety equipment such as vests and helmets can be part of a system that warns workers and/or supervisors when risks arise and can also provide data for analysis after incidents occur.
SmartMarket Report Dodge Data & Analytics 28 www.construction.com
Sidebar: Wearable Devices
on a construction site. If a worker is not quali�ed to enter an area, the wearable device can give off a visible and audible alert. These zones could be set up to restrict all access to an area or to speci�c individuals based on skills, training, certi�cations or other factors. Tags can also be placed on pieces of equipment to track the proximity of workers to potentially hazardous equipment that is in use.
The system can store data for future analysis, including tracking near-misses or other incidents.
Warning SystemsResearchers at Virginia Tech are developing a wearable warning system that can communicate between workers and the driving public. The InZoneAlert system aims to work with in-vehicle communication technology and mobile devices such as cell phones. Tests are centered on dedicated short-range communication systems (DSRC), which can allow vehicles to communicate with each other. DSRC is being developed in part to aid in operation of autonomous and semi-autonomous vehicles. The DSRC system can also communicate with sensors in a worker’s safety vest. When a collision between a motorist and a worker is imminent, the worker and motorist would both be alerted.
Augmented and Virtual RealityA new “smart” helmet is available that could have an impact on worker
safety. The helmet features a visor that can provide an augmented reality view of a jobsite. Workers are increasingly provided with tablets and other devices that can offer access to 3D models and BIM models. These smart helmets can provide a hands-free view of models, laying the model view over real view via the visor. The helmet is also equipped with 360-degree camera views, allowing workers to see their full surroundings.
Human Condition Safety is in early stage development of a system that combines wearable technology with virtual reality and cloud computing to monitor and analyze worker safety on construction sites. The system, which started piloting projects at Citi Field in New York City last year, aims to provide real-time tracking of worker movement in the hopes of preventing accidents and injuries. The system is being developed to not only monitor when a worker enters an unsafe environment, but also when the worker is in an unsafe condition. This could include detecting when a worker carries too much weight, loses balance or falls, according to the company.
Although the company is an early-stage startup, it already has signi�cant backing. Global insurance �rm AIG announced in January 2016 that it had made a strategic investment in Human Condition Safety. n

Dodge Data & Analytics 29 www.construction.com SmartMarket Report
In the 2012 study published in the 2013 Safety Management in the Construction Industry SmartMarket Report, contractors were asked about the impact of the safety practices they had implemented on 10 different bene�ts in�uencing project and/or business success. The same question was included in the current 2015 study.
The factors fall into two groups: • The chart at right shows the percentage of
respondents who report a positive impact from safety on six benefits.
• The chart below shows the contrast between positive and negative assessments for four benefits. Additionally, the percentage improvement for each of these four benefits can be found on pages 32 to 33.
Variation by YearAs the �ndings in both charts make clear, a higher percentage of contractors report seeing many positive impacts from safety in 2015 than in 2012. The statistically signi�cant differences include the percentage of contractors who �nd that safety investments have:■ Decreased Reportable Injuries (81% report this in 2015,
a 10 percentage point change from 2012)■ Increased Ability to Contract New Work (76% in 2015,
also a 10 percentage point change)■ Increased Ability to Retain Staff (64% in 2015, an 18
percentage point change)■ Increased Ability to Attract New Staff (46% in 2015, an
eight percentage point change)
Impact of Safety Practices on Project/Business Success Factors
Impact of Safety Practicesand Programs on Business
Data:B
UIL
DIN
G A
SA
FE
TY
CU
LTU
RE
: IM
PR
OV
ING
SA
FE
TY
AN
D H
EA
LTH
MA
NA
GE
ME
NT
IN T
HE
CO
NS
TR
UC
TIO
N IN
DU
ST
RY
DA
TA Impact of Safety on Project and/or Business Success Factors (Respondents Who Report a Positive Impact by Year)
3_01_Safety_Management_Batch3_Impact_Benefits_Year_#01
Willingness of Jobsite Workers to Report Unsafe Conditions
Ability to Contract New Work
Dodge Data & Analytics, 2016
20122015
Standing in the Industry
Project Quality
Staff Retention
Ability to Attract New Staff
79%
76%
76%
75%
66%
82%
71%
66%
64%
46%
46%
37%
Positive and Negative Impacts of Safety on Project Budget, Schedule, ROI and Reportable Injuries (By Year)
3_02_Safety_Management_Batch3_Impact_Benefits_PosNeg_#04
Dodge Data & Analytics, 2016
Negative Impact Positive Impact
Reportable Injuries
6%
71%
13%
43%
Project Schedule
Project ROI
5%
51%
Project Budget
15%
39%
2012
Reportable Injuries
2%
81%
10%
47%
Project Schedule
Project ROI
5%
58%
Project Budget
17%
43%
2015

BU
ILD
ING
A S
AF
ET
Y C
ULT
UR
E: I
MP
RO
VIN
G S
AF
ET
Y A
ND
HE
ALT
H M
AN
AG
EM
EN
T IN
TH
E C
ON
ST
RU
CT
ION
IND
US
TR
Y D
ATA The value of reducing reportable injuries and contracting
new work is clear, but it is particularly notable in the current job climate in the construction industry that safety is also increasingly helpful to retain and attract staff. Construction has been an important sector in the recovering U.S. economy, and concerns about having suf�cient skilled employees have increased in the industry. Talent may be key to competitiveness in the coming years, and there is increasing industry recognition of the impact of safety on this critical area.
In addition to the statistically signi�cant differences, the general trend is for a higher percentage to experience the bene�ts in 2015 than in 2012, including positive impacts on project quality, budget, schedule and ROI. In fact, the only bene�t reported by fewer contractors in 2015 than 2012 is the impact of safety on their standing in the industry. This is probably due to higher expectations around safety in the last few years.
Variation by Type of FirmSigni�cantly more general contractors report a high level of bene�ts from their safety investments than specialty contractors. The chart at right shows the greatest differences.
There is a notable gap between the percentage of general (84%) and specialty contractors (65%) who believe that safety improves their standing in the industry. If the industry continues to shift away from low-bid selection, and subcontractors are increasingly prequali�ed based on performance, then industry standing may become more important to specialty contractors in the future.
In addition, the feeling that their safety investments do not impact their standing in the industry may also be re�ected in the low percentage of specialty contractors who believe their safety investments increase their ability to attract new staff (35%). Again, as worker shortages increase, this may become an increasingly important driver for safety investments.
Many of the tangible, measurable bene�ts, including project ROI, schedule and budget, are more frequently experienced by general contractors. More general contractors are using safety practices than specialty contractors (see pages 20 to 22), so it is not surprising that they are also experiencing greater bene�ts resulting from those practices. However, until more specialty contractors can attribute these business bene�ts to a more robust safety program, they are less likely to invest in safety.
Impact of Safety Practices and Programs on BusinessImpact of Safety Practices on Project/Business Success Factors CONTINUED
SmartMarket Report Dodge Data & Analytics 30 www.construction.com
Impact of Safety on Project and/or Business Success Factors (Respondents Reporting a Positive Impact by Type of Company)
3_03_Safety_Management_Batch3_Impact_Benefits_FirmType_#01
Reportable Injuries
Standing in the Industry
Dodge Data & Analytics, 2016
Specialty ContractorsGeneral Contractors
Ability to Contract New Work
Staff Retention
Project ROI
Project Schedule
Ability to Attract New Staff
Project Budget
86%
75%
84%
65%
81%
71%
69%
48%
56%
35%
56%
35%
52%
33%
58%
66%

BU
ILD
ING
A S
AF
ET
Y C
ULT
UR
E: I
MP
RO
VIN
G S
AF
ET
Y A
ND
HE
ALT
H M
AN
AG
EM
EN
T IN
TH
E C
ON
ST
RU
CT
ION
IND
US
TR
Y D
ATA
Impact of Safety Practices and Programs on BusinessImpact of Safety Practices on Project/Business Success Factors CONTINUED
Dodge Data & Analytics 31 www.construction.com SmartMarket Report
Positive Impact of Safety on Project and/or Business Success Factors (Percentage at the High and Low End of the Safety Culture Spectrum Reporting Positive Impact From Safety)
3_04_Safety_Management_Batch3_Impact_Benefits_Matrix_#01
Willingness of Jobsite Workers to Report Unsafe Conditions
Reportable Injuries
Dodge Data & Analytics, 2016
Low Use of Safety Culture IndicatorsHigh Use of Safety Culture Indicators
Standing in the Industry
Ability to Contract New Work
Project Quality
Staff Retention
Project ROI
Ability to Attract New Staff
Project Schedule
Project Budget
95%
60%
90%
64%
89%
58%
89%
63%
88%
56%
79%
45%
75%
38%
67%
27%
61%
31%
32%
59%
Variation by Firm SizeThe size of a company affects the reported impact that safety has on most bene�ts, likely due to their greater investment in safety practices. This includes a notably greater percentage of respondents from large companies reporting improvements in project ROI and reportable injury rates. ■ Improved Project ROI: 75% of respondents from
companies with 100 or more employees report improved project ROI, compared with 45% of smaller companies.
■ Reportable Injury Rates: Most respondents from large companies and medium-size companies experienced reduced reportable injury rates due to their safety investments, including 90% from those with more than 100 employees and 93% from companies with 50 to 99 employees. However, there is a notable drop-off among smaller companies. In fact, only 59% of those with fewer than 10 employees report a reduction in injury rates due to their safety practices.
However, large companies with 100 or more employees see a high degree of impact on less tangible measures dealing with staf�ng and industry standing.
• 92% of respondents from large companies report that their standing in the industry is improved.
• 89% report improved ability to contract new work.• 76% report that they see improved staff retention.• 59% report improved ability to attract new staff.
Large companies may be able to capitalize on better measures of these impacts, as well as more formal safety processes. However, smaller companies will be competing against them for a limited pool of skilled workers, and they will need to be able to demonstrate through safety that they are attractive employers.
Variation by Safety Culture SpectrumA strong safety culture is the most in�uential factor in generating high levels of bene�ts. Unlike variations by �rm type or size, every bene�t included in the study is more widely reported by companies at the high end of the safety culture spectrum than by companies at the low end (see page 17). Also the differences between these two groups exceed any other differences reported in the study. In fact, three quarters or more of respondents from companies at the high end of the safety culture spectrum report that they experience seven out of 10 of the bene�ts measured.
These �ndings demonstrate that investment, not just in safety practices but in an overall safety culture, are critical to experience the full bene�ts of safety.

BU
ILD
ING
A S
AF
ET
Y C
ULT
UR
E: I
MP
RO
VIN
G S
AF
ET
Y A
ND
HE
ALT
H M
AN
AG
EM
EN
T IN
TH
E C
ON
ST
RU
CT
ION
IND
US
TR
Y D
ATA One third of the respondents who report a positive
impact from their safety practices on the project budget (see page 29) report decreases of 1% to 5%, with an average decrease of 4.7%. With pro�t margins on construction projects often below 10%, savings of 4% to 5% can in�uence whether a project is successful. These �ndings are consistent with the 2012 study.
It is notable, though, that 30% of the respondents who report a positive impact on their project budget due to safety cannot quantify that impact. It may be easier to justify safety investments if these bene�ts can be quanti�ed. Surprisingly, the largest companies �nd it the most dif�cult to quantify project budget savings, with 52% of the respondents from companies with 500 or more employees noting that they do not know.
There are no other signi�cant variations by company type, size or level of use of safety culture indicators.
Impact of Safety Practices and Programs on Business CONTINUED
SmartMarket Report Dodge Data & Analytics 32 www.construction.com
Impact of Safety on Project Budget
Impact of Safety on Project Budget (According to Respondents Who Report a Positive Impact)
29% of respondents who said that they experience a positive impact on project schedule due to their safety practices report decreases of 1% to 5%, with an average response of 4.9%. It is notable that 23% see decreases of 6% or more, a relatively high percentage for such a strong degree of impact
Project schedule also has the highest percentage of respondents who report that they do not know the exact impact, at 32%. This may be in part due to the measure provided in the study. It may be more common in the industry to consider schedule savings in units of time, like days or weeks, rather than by percentage of overall schedule. However, units of time do not allow for accurate comparisons between small and large projects. The measurement by percentage also precludes comparisons to the 2012 �ndings, which were measured in units of time.
There are no signi�cant variations by company type, size or level of use of safety culture indicators among those reporting shorter project schedules.
Impact of Safety on Project Schedule
Impact of Safety on Project Schedule (According to Respondents Who Report a Positive Impact)
3_05_Safety_Management_Batch3_Impact_Benefits_Budget_#01
Dodge Data & Analytics, 2016
10%
Decreased by 6% to 10%
30%
Don’t Know Percentage
Decreased by 1% to 5%
33%
Decreased by More Than 10%
6%
Decreased by Less Than 1%
21%
3_06_Safety_Management_Batch3_Impact_Benefits_Schedule_#01
Dodge Data & Analytics, 2016
17%
Decreased by 6% to 10%
32%
Don’t Know Percentage
Decreased by 1% to 5%
29%
Decreased by More Than 10%
6%
Decreased by Less Than 1%
16%
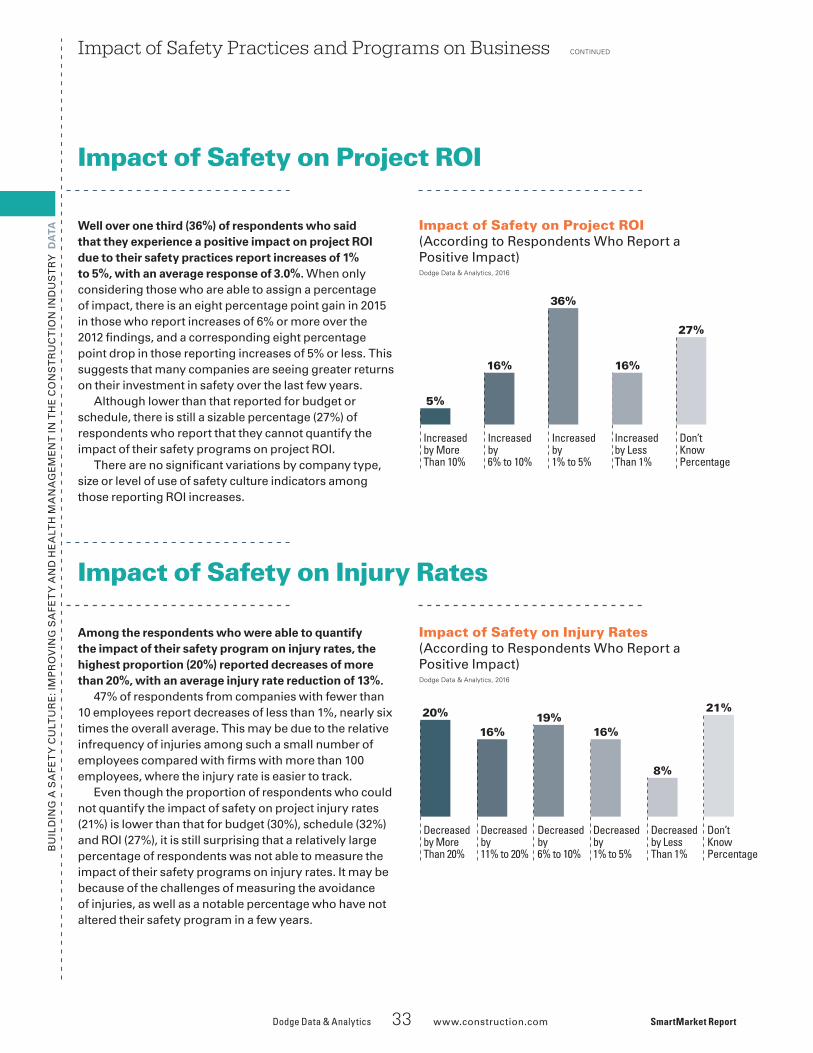
BU
ILD
ING
A S
AF
ET
Y C
ULT
UR
E: I
MP
RO
VIN
G S
AF
ET
Y A
ND
HE
ALT
H M
AN
AG
EM
EN
T IN
TH
E C
ON
ST
RU
CT
ION
IND
US
TR
Y D
ATA Well over one third (36%) of respondents who said
that they experience a positive impact on project ROI due to their safety practices report increases of 1% to 5%, with an average response of 3.0%. When only considering those who are able to assign a percentage of impact, there is an eight percentage point gain in 2015 in those who report increases of 6% or more over the 2012 �ndings, and a corresponding eight percentage point drop in those reporting increases of 5% or less. This suggests that many companies are seeing greater returns on their investment in safety over the last few years.
Although lower than that reported for budget or schedule, there is still a sizable percentage (27%) of respondents who report that they cannot quantify the impact of their safety programs on project ROI.
There are no signi�cant variations by company type, size or level of use of safety culture indicators among those reporting ROI increases.
Impact of Safety Practices and Programs on Business CONTINUED
Dodge Data & Analytics 33 www.construction.com SmartMarket Report
Impact of Safety on Project ROI
Impact of Safety on Project ROI (According to Respondents Who Report a Positive Impact)
Among the respondents who were able to quantify the impact of their safety program on injury rates, the highest proportion (20%) reported decreases of more than 20%, with an average injury rate reduction of 13%.
47% of respondents from companies with fewer than 10 employees report decreases of less than 1%, nearly six times the overall average. This may be due to the relative infrequency of injuries among such a small number of employees compared with �rms with more than 100 employees, where the injury rate is easier to track.
Even though the proportion of respondents who could not quantify the impact of safety on project injury rates (21%) is lower than that for budget (30%), schedule (32%) and ROI (27%), it is still surprising that a relatively large percentage of respondents was not able to measure the impact of their safety programs on injury rates. It may be because of the challenges of measuring the avoidance of injuries, as well as a notable percentage who have not altered their safety program in a few years.
Impact of Safety on Injury Rates
Impact of Safety on Injury Rates (According to Respondents Who Report a Positive Impact)
3_08_Safety_Management_Batch3_Impact_Benefits_Injury Rates_#01
Dodge Data & Analytics, 2016
16%
Decreased by 11% to 20%
8%
Decreased by Less Than 1%
21%
Don’t Know Percentage
Decreased by 6% to 10%
19%
Decreased by More Than 20%
20%
Decreased by 1% to 5%
16%
3_07_Safety_Management_Batch3_Impact_Benefits_ROI_#02
Dodge Data & Analytics, 2016
16%
Increased by 6% to 10%
27%
Don’t Know Percentage
Increased by 1% to 5%
36%
Increased by More Than 10%
5%
Increased by Less Than 1%
16%

BU
ILD
ING
A S
AF
ET
Y C
ULT
UR
E: I
MP
RO
VIN
G S
AF
ET
Y A
ND
HE
ALT
H M
AN
AG
EM
EN
T IN
TH
E C
ON
ST
RU
CT
ION
IND
US
TR
Y
A lthough the direct correlation between lean and safety isn’t always apparent,
research continues to show how lean can reduce risk. In fact, Dan Heinemeier, executive director of Lean Construction Institute (LCI), says safety improvements were realized early on, even though the primary initial goals of lean construction aimed at being more ef�cient, better serving owner needs and removing waste.
Lean Project Delivery Enhances Project Safety
Through the adoption of lean construction, many companies have reported improved safety performance among its bene�ts. Planning and collaboration around safety, as well as encouraging increased worker engagement, help enhance the safety climate of lean projects.
SmartMarket Report Dodge Data & Analytics 34 www.construction.com
Sidebar: Lean and Safety
“Improved safety is a natural by-product of lean tools and techniques,” says Heinemeier. “The more you remove waste from project sites and better organize the �ow of a project, the less scope there is for accidents.”
Greg Howell, a co-founder of LCI, says companies often report a 30% to 50% reduction in accidents on lean projects compared with non-lean projects. “That’s the good news—the bad news is we don’t know exactly why it happens,” he says.
Howell is part of a study with the Project Production System Laboratory at UC Berkeley that is researching how lean construction improves safety performance.
Some lean techniques have shown obvious bene�ts for both productivity and safety, Heinemeier says. For example, modular construction and prefabrication can be performed offsite in a controlled environment—out of the elements and at ground level—before being shipped to project sites to be installed.
Planning, Collaboration and SafetySouthland Industries has employed lean thinking on safety planning for installation. On a recent project that used multi-trade modular racks in corridors, the initial concept called for skating the racks into the building and using chain falls. With safety professionals engaged in the planning process, the team instead chose to use a side-load forklift. This technique meant the operator and other workers were not under the rack during installation; exposure to sprain and strain injuries was eliminated; and productivity increased by eliminating the need for chain falls.
Henry Nutt, general sheet metal superintendent at Southland Industries, says that collaborative planning efforts provide the “biggest bang for the buck” on lean. By working together, different �rms can
Pho
to c
ourt
esy
of B
alfo
ur B
eatt
y C
onst
ruct
ion
Image of a weekly work plan using the Last Planner system. The yellow dots represent a phase change that requires a safety discussion. An onsite safety professional brings the safety committee through and they discuss the phase change as well. The blue dot is a quality control hold—meaning significant coordination is required or an inspection is needed before work can proceed or be considered complete.

BU
ILD
ING
A S
AF
ET
Y C
ULT
UR
E: I
MP
RO
VIN
G S
AF
ET
Y A
ND
HE
ALT
H M
AN
AG
EM
EN
T IN
TH
E C
ON
ST
RU
CT
ION
IND
US
TR
Y
Dodge Data & Analytics 35 www.construction.com SmartMarket Report
Sidebar: Lean and Safety CONTINUED
streamline their efforts and �nd ways to reduce manpower deployed in speci�c work areas, using crews more ef�ciently. “You avoid congesting an area that you’re working in,” he says. “That’s a big factor we’ve found in improving safety.”
Nutt also says that safety personnel from multiple companies can work together to streamline their planning and processes, and not duplicate efforts. “It’s a more seamless effort, so we don’t have injuries,” he says. “All of that collaborative front-end work prevents stuff from happening down the line.”
On a recent Southland IPD project with a collaborative safety approach, the team realized signi�cant budget savings while maintaining a clean safety record. The team’s lean process saved $300,000 in one work area, while mechanical trade partners and tiered subs worked more than 800,000 hours without injury.
Balfour Beatty Construction incorporates safety planning into its pull planning sessions on projects. The technique allows the company to adjust safety plans to address changes in plans for daily tasks. For example, when mapping out tasks on a timeline, the company uses yellow safety stickers to denote major changes that could affect safety such as logistics, environmental conditions, staging or access.
“As a mind-set, for us, lean is a philosophy of continuous improvement built on a respect for people working smarter,” says Bevan Mace, vice president of operations/lean at Balfour Beatty. “Respect for people and safety are intertwined.”
Predictability and SafetyWill Lichtig, construction executive at The Boldt Company, says lean tools like Last Planner help improve safety by providing better controls. “When people do work when they plan to do it and with materials that are delivered and ready for them to use, the likelihood that you’ll have things out of place is greatly reduced,” he says.
Lichtig says that, historically, construction �rms have used a “compliance mentality” in regard to safety—establishing rules and punishing workers who violate those rules. Under the “continuous improvement” philosophy of lean, Lichtig says factors other than worker error need to be considered. “We’re not saying that the rules don’t matter, but the reason people end up not following the rules isn’t because they set out in the morning to not follow the rules—it’s because we have con�icting priorities and we haven’t done enough to enable them to approach their work safely.”
Lichtig cites the example of someone working above the ceiling on a 6-foot ladder, when the task requires an 8-foot ladder. “The typical response is to write up the person on the ladder, send him home and punish him for using the ladder,” he says. “What we want to know is, why he had the wrong size ladder. Why didn’t he have an 8-foot ladder? Why didn’t he have access to the right ladder and only that ladder? We look at that as a planning failure, rather than a personal failure.”
Worker InvolvementSimilarly, Boldt tries to enable workers to be part of the process under its Continuous Safety
Improvement program. The program calls on workers to identify potentially hazardous conditions in the workplace and submit any concerns to management. “When we began the program, people thought it was a snitch card,” Lichtig says. “It took a while for people to realize it wasn’t there to rat people out. It was an honest and legitimate look at the opportunities for improvement at the jobsite. How it is organized or maintained. What tools could make the job safer.”
Lichtig says that the program not only helps the company improve its planning and practices, it also engages workers to think more about site safety. He even believes that it serves as an audit of its site-speci�c safety plan and job hazard analysis. “Even though we are planning at those levels, conditions will arise at the site that are unsafe,” he says. “The CSI program is a way for workers to say that, despite all of the work [Boldt has] done, we’re still experiencing conditions that expose us to risk.”
Lichtig says that the company’s safety record improved signi�cantly with its adoption of lean techniques nearly 15 years ago, but it eventually plateaued. Following introduction of the CSI program, he says that as the number of CSI cards delivered on a project and across the company increased, Boldt’s safety incident rate improved.
“On a big job in San Francisco right now, we’ll get close to 100 CSI per week,” he says. “That’s from a job force of a few hundred �eld workers. It provides a feedback mechanism, and it keeps them more mindful of the environment they are working in. There’s tremendous value in that.” n

SmartMarket Report Dodge Data & Analytics 36 www.construction.com
BU
ILD
ING
A S
AF
ET
Y C
ULT
UR
E: I
MP
RO
VIN
G S
AF
ET
Y A
ND
HE
ALT
H M
AN
AG
EM
EN
T IN
TH
E C
ON
ST
RU
CT
ION
IND
US
TR
Y D
ATA Respondents were asked to rank the three most
in�uential people or positions within their company for improving safety. Please note that, for this question only, the term “owner” refers to the owner of the construction company and not the owner of the construction project, as it does in the rest of the study.
The chart at right shows the people or positions ranked �rst, second or third by most respondents. The differences in how they were ranked are revealing.■ Owners and Company Leadership: Owners and
company leadership are ranked �rst by the highest percentage (31% and 29%, respectively) as the most in�uential for improving safety. Company leaders are also widely recognized in the top three rankings, but owners are selected by only 9% more as among the top two or three in�uencers, compared with 34% of respondents who rank company leadership second or third. This �nding demonstrates that when owners engage in promoting safety, they are quite in�uential, but when they are not, other roles predominate. Therefore, encouraging more owner engagement with safety may be a very effective strategy, but it is not as essential as engagement by company leadership.
■ Jobsite Workers: The highest percentage of respondents (64%) rank jobsite workers among their top three most in�uential positions for improving safety. However, workers rank a distant third to owners and company leadership in terms of being ranked �rst. This �nding corresponds to an overall tendency by respondents to place great importance on the role jobsite workers can play to increase safety, but it also suggests that leadership support is essential for jobsite worker in�uence to be effective.
■ Project Management Team: The high percentage who rank project management teams in the top three (57%), in combination with the low percentage who ranks them �rst (9%), suggests that this role falls into a second tier in terms of improving safety, but that they still are quite in�uential. They are particularly in�uential at small to medium-size �rms, those with between 10 and 49 employees, where 19% rank them �rst, second only to owners at 39% and above both company leadership and jobsite workers at 18% each.
Most In�uential People/Positions for Improving Safety
Influence FactorsData:
Most In�uential People/Positions for Improving Safety (Based on Rankings by All Respondents)
40%
63%
3_09_Safety_Management_Batch3_Influences_Influential Position_#01
Dodge Data & Analytics, 2016
9% 31%
34% 29%
Ranked Second or ThirdRanked First
Construction Company Owners
Company Leadership
64%46% 18%
Jobsite Workers
57%48% 9%
Project Management Team
41%35% 6%
Safety Personnel

BU
ILD
ING
A S
AF
ET
Y C
ULT
UR
E: I
MP
RO
VIN
G S
AF
ET
Y A
ND
HE
ALT
H M
AN
AG
EM
EN
T IN
TH
E C
ON
ST
RU
CT
ION
IND
US
TR
Y D
ATA Most In�uential Factors
The top factor that in�uenced companies to adopt their current safety management practices is concern about worker health and safety, consistent with the �ndings in 2012. Concern about workers’ welfare is an important motivator and continues to exceed the strong business reasons for investing in a safety program.
• Size of Company: 94% of respondents from companies with 100 or more employees regard this as highly influential, compared with just 66% of those from companies with fewer than 10 employees.
• Safety Culture Spectrum: 96% of respondents from companies at the high end of the safety culture spectrum (see page 17 and the chart on page 38) also consider this highly influential, compared with 69% of those at the low end of the safety culture spectrum.
Concerns about liability and insurance costs also continue to be among the top drivers for adoption of current safety management practices, again consistent with the �ndings from 2012. Liability carries high �nancial risk, and containing insurance costs is important when pro�t margins are often quite slender on projects.
• Size of Company: Both of these factors are less influential for companies with less than 10 employees than they are for larger ones.
• Safety Culture Spectrum: Both factors are also considered influential by 85% of respondents from companies at the high end of the safety culture spectrum.
Additional In�uential FactorsAs in the 2012 study, there is a moderate percentage who consider several factors in�uential in their adoption of safety practices. ■ Avoiding Potential Business Disruptions: The size of
a �rm does not make a difference when it comes to the in�uence of this factor. However, 24% of specialty contractors consider it to have little to no in�uence, compared with 13% of general contractors. This �nding is logical because, while a specialty contractor may only be involved with a project for a few weeks, a safety incident could cause delays and disruptions for a general contractor that cascade down through the life of the project.
■ Past Incidents Involving Worker Health and Safety: Unlike concerns about business disruptions, the size of companies and their position on the safety culture index make a notable difference in terms of how in�uential this factor is, but type of company does not.
Influence Factors CONTINUED
Dodge Data & Analytics 37 www.construction.com SmartMarket Report
Top 10 Factors That Drove Adoption of Current Safety Management Practices
Factors That In�uenced Companies to Adopt Current Safety Management Practices(By Year)
3_10_Safety_Management_Batch3_Influences_CurrentDrivers_#01
Concern About Worker Health and Safety**
Liability Concerns
Dodge Data & Analytics, 2016
20122015
Insurance Costs
Avoiding Potential Business Disruptions
Past Incidents Involving Worker Health and Safety**
Industry Leadership in Overall Safety Culture
Regulatory Requirements
Owner/Client Demand
Competitive Advantage
Desire to Improve Productivity
** In 2012, the phrase "Health and Well-Being" was used rather than "Health and Safety."
84%
79%
74%
77%
74%
78%
61%
65%
55%
52%
54%
51%
52%
63%
52%
64%
49%
50%
47%
54%

BU
ILD
ING
A S
AF
ET
Y C
ULT
UR
E: I
MP
RO
VIN
G S
AF
ET
Y A
ND
HE
ALT
H M
AN
AG
EM
EN
T IN
TH
E C
ON
ST
RU
CT
ION
IND
US
TR
Y D
ATA • Size of Company: 70% of respondents from
companies with over 100 employees consider this very influential, but only 46% of those from companies with fewer than 50 employees agree.
• Safety Culture Spectrum: The percentage of respondents from companies that fall high on the safety culture matrix (75%) who consider this highly influential is more than double that of respondents from companies at the low end of that matrix (32%).
■ Industry Leadership in Overall Safety Culture: In this case, the size of the company, the type of company and where it falls on the safety culture spectrum are all indicative of the level of in�uence of this factor. • Size of Company: 78% of respondents from
companies with 100 employees or more consider this influential, compared with 33% of those from companies with fewer than 50 employees.
• Type of Company: 65% of general contractors consider this influential compared with 41% of specialty contractors.
• Safety Culture Spectrum: 83% of respondents from companies that are at the high end of the safety culture spectrum consider this influential, compared with 20% who are at the low end of the spectrum.
Factors Declining in In�uenceAll of the three statistically signi�cant differences between the 2015 and 2012 �ndings involve a decline in the percentage considering the factors important. This suggests that fewer respondents are selecting as wide of a range of factors as highly in�uential and are more focused on a few key items.
Regulatory requirements and owner/client demands both declined from nearly two thirds of the respondents in 2012 who thought they were highly in�uential to just over half in 2015. The declines in these two elements suggest that fewer companies are �nding a “push” to adopt safety from outside factors and are more focused on improving their workers’ health and safety and on creating a more positive (or less negative) impact on their business.
The percentage who consider the desire to improve productivity highly in�uential also declined signi�cantly in 2015 compared with 2012. Recent attention to productivity in the construction industry has demonstrated that this is a particularly challenging metric to capture. Greater awareness of the challenge of demonstrating improvements may contribute to this decline.
Influence FactorsTop 10 Factors That Drove Adoption of Current Safety Management Practices CONTINUED
SmartMarket Report Dodge Data & Analytics 38 www.construction.com
Factors That In�uenced Companies to Adopt Current Safety Management Practices (By Position on the Safety Culture Spectrum)
4_02_Safety_Management_Batch4_Influences_CurrentDr_Matrix_#01
Concern About Worker Health and Safety
Liability Concerns
Dodge Data & Analytics, 2016
Low Use of Safety Culture IndicatorsHigh Use of Safety Culture Indicators
Insurance Costs
Industry Leadership in Overall Safety Culture
Past Incidents Involving Worker Health and Safety
Avoiding Potential Business Disruptions
Competitive Advantage
Regulatory Requirements
Owner/Client Demand
Desire to Improve Productivity
96%
69%
85%
66%
85%
62%
83%
20%
75%
32%
74%
45%
70%
24%
67%
35%
65%
36%
64%64%
30%

BU
ILD
ING
A S
AF
ET
Y C
ULT
UR
E: I
MP
RO
VIN
G S
AF
ET
Y A
ND
HE
ALT
H M
AN
AG
EM
EN
T IN
TH
E C
ON
ST
RU
CT
ION
IND
US
TR
Y D
ATA Reduced insurance rates are the most in�uential factor
encouraging future investments in more extensive safety practices. This is consistent with the 2012 �ndings, and it demonstrates the ongoing importance the insurance industry has on encouraging wide adoption of safety practices in the construction industry.
There is a notable decline in the percentage who consider most of the other factors to be important as drivers for future increased safety investments. While only one decline is steep enough to be considered statistically signi�cant—increased owner/client requirements—the general trend is quite evident, and it is also consistent with a tendency for small declines in importance in the factors that encouraged the adoption of current safety measures.
One commonality among most of the factors that have suffered declines is that they tend to be requirements rather than encouragements for greater safety adoption. Owner requirements and regulations are declining in in�uence, while factors that have business impacts like reduced insurance rates and more data on the �nancial impacts of improving safety remain steady.
The other factor in decline is wider adoption of risk analysis. Over half (52%) of respondents from companies with over 100 respondents consider this a positive in�uence, but only 33% of those from companies with 10 to 49 employees and only 10% of those from companies with fewer than 10 employees see this factor as in�uential. Clearly, smaller companies are not seeing wider adoption of risk analysis in the industry. However, this type of proactive approach is essential to see safety improve across the industry.
Companies at the high end of the safety culture spectrum (see page 17) place a much greater importance on a few factors indicated in the chart at right than those at the low end of the spectrum do. ■ Increased Owner/Client Requirements:
The companies at the high end of the spectrum buck the general decline in the importance of owner requirements, suggesting that those with a strong safety culture recognize the need for owners to be part of a collaborative approach to safety.
■ Data on Safety: Not only do the respondents from companies at the high end of the safety culture spectrum place greater importance on data on �nancial impacts, but they also see strong in�uence in the data drawn from risk analysis to help encourage safety investments.
Influence Factors CONTINUED
Dodge Data & Analytics 39 www.construction.com SmartMarket Report
Factors Encouraging Future Investment in Safety Management Practices
Factors Encouraging Future Safety Investments (By Year)
3_11_Safety_Management_Batch3_Influences_FutureDrivers_#01
Reduced Insurance Rates
Increased Owner/Client Requirements
Dodge Data & Analytics, 2016
20122015
More Data on Positive Financial Impact of Improving Safety
Greater Enforcement of Regulations
Stronger Regulations
Wider Adoption of Risk Analysis
79%
78%
57%
68%
53%
54%
42%
50%
42%
50%
38%
43%
4_03_Safety_Management_Batch4_Influences_Future_Matrix_#01
Increased Owner/Client Requirements
More Data on Positive Financial Impact of Improving Safety
Dodge Data & Analytics, 2016
Low Use of Safety Culture IndicatorsHigh Use of Safety Culture Indicators
Wider Adoption of Risk Analysis
74%
38%
58%
43%
56%
24%
Factors Encouraging Future Safety Investments (Greatest Difference Based on Position on the Safety Culture Spectrum)

BU
ILD
ING
A S
AF
ET
Y C
ULT
UR
E: I
MP
RO
VIN
G S
AF
ET
Y A
ND
HE
ALT
H M
AN
AG
EM
EN
T IN
TH
E C
ON
ST
RU
CT
ION
IND
US
TR
Y
Developing Best Practices to Make New Workers SaferNew workers can present some of the greatest safety challenges. Brian Turmail, spokesperson for Associated General Contractors of America (AGC), says, “Those are the workers who are most likely to get hurt. We surveyed members and 15% of �rms say they have already seen an increase in accident rates because of inexperienced workers.”
To help reverse that trend, AGC analyzed the safety practices of its recent safety award winners, focusing particularly on ones that address training of new workers. From that, AGC released 13 tips to improve workplace safety. “We send that out regularly to members and encourage them to act on it,” says Turmail.
Safety Standards and BenchmarksIn 1989, Associated Builders and Contractors (ABC) created its Safety Training Evaluation Process (STEP) program to analyze and develop their safety and loss prevention programs, including a 20-point guide to start, update or audit safety programs.
The program establishes goals for members, offering STEP recognition at Participant, Bronze, Silver, Gold, Platinum and Diamond levels. Safety rates are part of the designation process. “We have established a level of commitment to safety by
Associations Promote Safety in the Construction Industry
With an ability to interact with thousands of members of the construction industry, associations have proven to be powerful agents for promoting safety culture in the United States. Many national associations in the construction industry use their broad reach to gather and analyze data, share best practices and recognize excellence in safety.
SmartMarket Report Dodge Data & Analytics 40 www.construction.com
Sidebar: Associations
putting a program out there that tries to establish standard language across the industry that people can productively use,” says Michael Bellaman, president and CEO of ABC.
ABC has amassed decades of STEP program data and in 2015, launched its annual Safety Performance Report, leveraging STEP program data to determine the correlation between leading indicator implementation and lagging indicator safety performance.
In one example, ABC compared “world-class” on-boarding of new hires with average on-boarding practices to determine impact on safety performance. Firms with “world-class” on-boarding averaged 203 minutes of training with participation by a leader in the organization, compared with the average safety orientation of less than 50 minutes and covering basic safety information. Firms with “world-class” on-boarding practices performed 1,500% safer than the average �rms. “If someone wants to improve their [safety] rates, that’s a best practice,” Bellaman says.
As part of these efforts, Bellaman says ABC aims to quantify how “safety pays.” We’re working on return on investment,” he says. “What’s the cost of deployment of a safety management system and what are the savings in terms of bene�ts? We’re working on a correlation between safety and productivity.”
Small Businesses and SafetyLike much of the construction industry, most of the members of the Sheet Metal and Air Conditioning Contractors’ National Association (SMACNA) are small companies. Therefore, when the leadership at that organization considers how to improve the safety of their members, they make sure their materials are designed to help small companies.
Mike McCullion, ARM, CSP, Director of Market Sectors and Safety at SMACNA, tries to address the unique challenges for small companies in the construction industry in SMACNA’s safety program. “It’s tough for a small company because they often don’t have the resources that larger companies may have. So they often prioritize their efforts and resources in developing, implementing and managing their safety and health programs.”
One challenge noted by McCullion is the ability of small companies to keep up with regulatory requirements while prioritizing those resources. Another challenge is the increasing client requirements around safety. McCullion notes, in particular, the challenge created by “the use of third-party evaluation contractors, who provide a set of criteria for safety programs that often go beyond typical contractor programs.”
To help members deal with these challenges, SMACNA has created
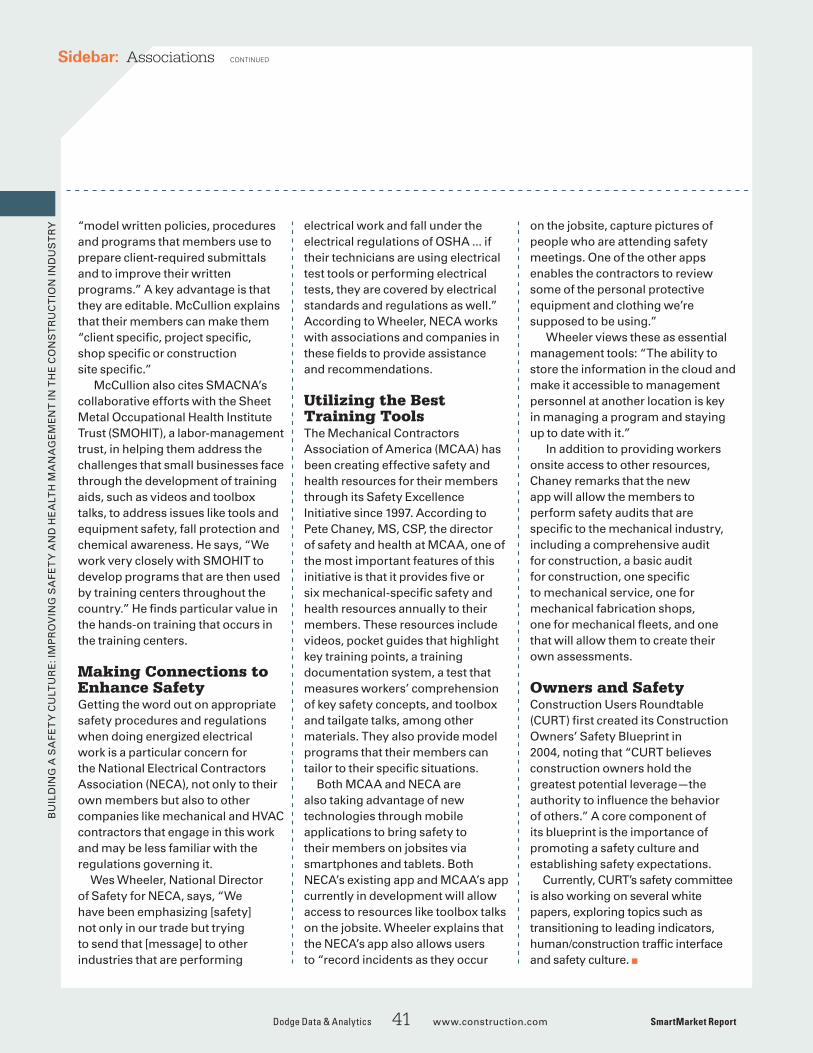
BU
ILD
ING
A S
AF
ET
Y C
ULT
UR
E: I
MP
RO
VIN
G S
AF
ET
Y A
ND
HE
ALT
H M
AN
AG
EM
EN
T IN
TH
E C
ON
ST
RU
CT
ION
IND
US
TR
Y
Dodge Data & Analytics 41 www.construction.com SmartMarket Report
Sidebar: Associations CONTINUED
“model written policies, procedures and programs that members use to prepare client-required submittals and to improve their written programs.” A key advantage is that they are editable. McCullion explains that their members can make them “client speci�c, project speci�c, shop speci�c or construction site speci�c.”
McCullion also cites SMACNA’s collaborative efforts with the Sheet Metal Occupational Health Institute Trust (SMOHIT), a labor-management trust, in helping them address the challenges that small businesses face through the development of training aids, such as videos and toolbox talks, to address issues like tools and equipment safety, fall protection and chemical awareness. He says, “We work very closely with SMOHIT to develop programs that are then used by training centers throughout the country.” He �nds particular value in the hands-on training that occurs in the training centers.
Making Connections to Enhance SafetyGetting the word out on appropriate safety procedures and regulations when doing energized electrical work is a particular concern for the National Electrical Contractors Association (NECA), not only to their own members but also to other companies like mechanical and HVAC contractors that engage in this work and may be less familiar with the regulations governing it.
Wes Wheeler, National Director of Safety for NECA, says, “We have been emphasizing [safety] not only in our trade but trying to send that [message] to other industries that are performing
electrical work and fall under the electrical regulations of OSHA ... if their technicians are using electrical test tools or performing electrical tests, they are covered by electrical standards and regulations as well.” According to Wheeler, NECA works with associations and companies in these �elds to provide assistance and recommendations.
Utilizing the Best Training ToolsThe Mechanical Contractors Association of America (MCAA) has been creating effective safety and health resources for their members through its Safety Excellence Initiative since 1997. According to Pete Chaney, MS, CSP, the director of safety and health at MCAA, one of the most important features of this initiative is that it provides �ve or six mechanical-speci�c safety and health resources annually to their members. These resources include videos, pocket guides that highlight key training points, a training documentation system, a test that measures workers’ comprehension of key safety concepts, and toolbox and tailgate talks, among other materials. They also provide model programs that their members can tailor to their speci�c situations.
Both MCAA and NECA are also taking advantage of new technologies through mobile applications to bring safety to their members on jobsites via smartphones and tablets. Both NECA’s existing app and MCAA’s app currently in development will allow access to resources like toolbox talks on the jobsite. Wheeler explains that the NECA’s app also allows users to “record incidents as they occur
on the jobsite, capture pictures of people who are attending safety meetings. One of the other apps enables the contractors to review some of the personal protective equipment and clothing we’re supposed to be using.”
Wheeler views these as essential management tools: “The ability to store the information in the cloud and make it accessible to management personnel at another location is key in managing a program and staying up to date with it.”
In addition to providing workers onsite access to other resources, Chaney remarks that the new app will allow the members to perform safety audits that are speci�c to the mechanical industry, including a comprehensive audit for construction, a basic audit for construction, one speci�c to mechanical service, one for mechanical fabrication shops, one for mechanical �eets, and one that will allow them to create their own assessments.
Owners and SafetyConstruction Users Roundtable (CURT) �rst created its Construction Owners’ Safety Blueprint in 2004, noting that “CURT believes construction owners hold the greatest potential leverage—the authority to in�uence the behavior of others.” A core component of its blueprint is the importance of promoting a safety culture and establishing safety expectations.
Currently, CURT’s safety committee is also working on several white papers, exploring topics such as transitioning to leading indicators, human/construction traf�c interface and safety culture. n

SmartMarket Report Dodge Data & Analytics 42 www.construction.com
BU
ILD
ING
A S
AF
ET
Y C
ULT
UR
E: I
MP
RO
VIN
G S
AF
ET
Y A
ND
HE
ALT
H M
AN
AG
EM
EN
T IN
TH
E C
ON
ST
RU
CT
ION
IND
US
TR
Y D
ATA Nearly all the contractors participating in the study report
that their companies have basic safety training available and fundamental requirements in place, although many do not implement them on all their projects. It is likely that this high level of adoption is in�uenced by the fact that offering or requiring safety training may reduce liability and insurance rates for contractors.
Offering Versus Requiring TrainingOne notable difference is that while nearly all (97%) respondents report that their companies provide safety and health training for supervisors and jobsite workers, fewer (87%) report that they require all of their jobsite workers to have basic safety and health training. Among the 97% whose companies offer safety training, two thirds offer it on more than 70% of their projects, but among the companies that require all jobsite workers to have basic safety and health training, only 53% require it at that same high level. While workers do need to be active partners in ensuring safety, simply offering training does not make the clear, direct statement about how a company values safety that requiring basic safety training does. The requirements for jobsite workers demonstrate that the company considers safety to be fundamentally important, as important as other factors like productivity.
In addition, the �ndings demonstrate that basic safety and health training is more likely to be required of supervisors than it is of jobsite workers. Not only do 91% report these requirements for supervisor safety training at some level, compared with the 87% requiring it of jobsite workers, but 69% also report that this is widely implemented in their company, a requirement on more than 70% of their projects. Thus, even though the overall survey �ndings throughout this report demonstrate a shift in the industry to wider recognition of the need to actively engage jobsite workers in the process of increasing safety, the requirements around safety training do not appear to have kept pace with that shift, and reliance on supervisory leadership is more prevalent.
In fact, most companies are actively supporting leadership by their supervisors on safety and health issues. 89% report that supervisors are required to have safety and health leadership training on at least some of their projects, and nearly two thirds (65%) of those that offer this training offer it on more than 70% of their projects. This relatively high level of required leadership training demonstrates wide industry recognition of how
Safety Training Availability and Requirements
Training Practices and Communication
Data:
Safety Training Availability and RequirementsDodge Data & Analytics, 2016
Safety and Health Training Provided for Supervisors and Jobsite Workers
97%
High: More Than 70%Moderate: 25% to 70%
Low: Less Than 25%
3_12_Safety_Management_Batch3_Training_Practices_PieBars_#02
8%24%
68%Percentage of Projects
All Employees Receive Orientation Training When Starting Work on a New Site
93%
High: More Than 70%Moderate: 25% to 70%
Low: Less Than 25% 11%20%
69%
Percentage of Projects
Supervisors Required to Have Basic Safety and Health Training
91%
High: More Than 70%Moderate: 25% to 70%
Low: Less Than 25% 12%19%
69%
Percentage of Projects
Supervisors Required to Have Safety and Health Leadership Training
89%
High: More Than 70%Moderate: 25% to 70%
Low: Less Than 25% 13%22%
65%
Percentage of Projects
All Jobsite Workers Required to Have Basic Safety and Health Training
87%
High: More Than 70%Moderate: 25% to 70%
Low: Less Than 25% 21%26%
53%
Percentage of Projects

BU
ILD
ING
A S
AF
ET
Y C
ULT
UR
E: I
MP
RO
VIN
G S
AF
ET
Y A
ND
HE
ALT
H M
AN
AG
EM
EN
T IN
TH
E C
ON
ST
RU
CT
ION
IND
US
TR
Y D
ATA
Training Practices and CommunicationSafety Training Availability and Requirements CONTINUED
Dodge Data & Analytics 43 www.construction.com SmartMarket Report
leadership by supervisors can be critical to improving safety at the jobsite.
One factor made clear by the �ndings is the relatively wide recognition of the need to tackle safety on a jobsite-by-jobsite basis. 93% of contractors report that their employees receive orientation training when starting work on a new site, and well over two thirds (69%) of those that have adopted that practice do so on more than 70% of their projects. Each jobsite may pose a unique set of hazards, and increasing supervisor and worker awareness of the unique hazards posed by speci�c jobsites can be critical to helping mitigate those risks.
Variation by Size of CompanyConsistently, for all of these practices and requirements, a higher percentage of respondents from large companies, those with 100 or more employees, report that they are more widely implemented than those from companies with fewer than 50 employees. However, the difference between small and large companies is only evident in the degree of implementation, not in whether they use any of these requirements and practices. This demonstrates that small companies are as familiar with these training practices and requirements as large companies, and the difference appears to lie in their ability to consistently implement them across the company.
The most notable gap in the level of implementation is in the use of orientation training when starting work on a new site. 84% of respondents from companies with more than 100 employees report that this occurs on more than 70% of their projects, but less than half (46%) of respondents from companies with fewer than 50 employees report the same. It is possible that larger companies have clear-cut policies in place regarding this, while smaller companies may have more variation depending on the project leadership, a factor that could also contribute to the other, less dramatic, statistically signi�cant differences in the degree of implementation between small and large companies.
Variation by Type of CompanyGeneral and specialty trade contractors report different levels of implementation for two of these requirements and practices, both of which involve the training requirements for supervisors.■ Supervisors Are Required to Have Basic Safety &
Health Training: 69% of general contractors report that supervisors are required to have basic training on more than 70% of their projects, compared with 56% of specialty contractors.
■ Supervisors Are Required to Have Safety & Health Leadership Training: 64% of general contractors report that supervisors are required to receive safety and health leadership training on more than 70% of their projects, compared with 51% of specialty contractors.
Since project supervisors at general contractors hold responsibility for the safety of the entire project, it is perhaps not surprising that supervisory training is of particular importance for them as a safety requirement.
Variation by Safety Culture SpectrumPerhaps not surprisingly, companies at the low end of the safety culture spectrum (see page 17) are less likely than those higher on the spectrum to use or have requirements in place for safety and health training.That was true for each of the �ve factors studied, and, in fact, around one quarter of companies at the low end of the safety culture spectrum report that they have not implemented:
• Requirements that supervisors have basic safety and health training (24%)
• Requirements that supervisors have safety and health leadership training (25%)
• Requirements that jobsite workers have basic safety and health training (26%)
These �ndings again reinforce the importance of a safety culture to encourage widespread adoption and use of basic sound safety practices, including training.

BU
ILD
ING
A S
AF
ET
Y C
ULT
UR
E: I
MP
RO
VIN
G S
AF
ET
Y A
ND
HE
ALT
H M
AN
AG
EM
EN
T IN
TH
E C
ON
ST
RU
CT
ION
IND
US
TR
Y D
ATA Respondents were asked about the frequency with which
they have conducted or expect to conduct safety training online in three time frames: 2013, 2015 and expected in 2017. The chart at right re�ects their responses.
The �ndings reveal a higher expectation for increased use in safety training online over the next two years than the increase that has occurred over the last two years.
• From 2013 to 2015, the percentage using online safety training has only increased by one percentage point. However, there has been a shift to more use of online safety training among those who are already using it, with a six percentage point increase among those conducting 25% or more of their safety training online.
• Between 2015 and 2017, though, there is a 10 percentage point increase in those who expect to use online safety training. In addition, there is an expected 12 percentage point increase in those who expect to use it for 25% of their safety training or more.
These �ndings are likely affected by contractor expectations regarding improvements of devices used onsite and better availability of safety training software and apps. A 2015 study on information mobility improvements in the construction industry, published in the �rst edition of the SmartMarket Brief: BIM Advancements series of reports, reveals that 95% of contractors report that they’ve experienced at least some improvement in their information mobility in the last two years, with the majority (43%) reporting a very high level of improvement. These improvements, though, have only set the stage for greater expectations about technology advancements, with 76% still reporting the need for improved devices at the jobsite.
General contractors are also signi�cantly more likely than specialty trade contractors to be using online safety training currently, with 75% of general contractors reporting at least some safety training occurring online compared with 57% of specialty contractors. However, by 2017, the difference drops from 18 to 9 percentage points, which now places it within the margin of error. This suggests that specialty contractors have been slower to embrace online training thus far, but that improved, less costly equipment may eventually eliminate that gap.
Training Practices and Communication CONTINUED
SmartMarket Report Dodge Data & Analytics 44 www.construction.com
Frequency of Safety Training Conducted Online
Safety Training Conducted Online
2015
67%9%
23%
35%
2013
34%
66%7%
19%
40%
2017 (expected)
77%
15%
29%
33%
33%
23%
3_13_Safety_Management_Batch3_Training_Online_#01
Dodge Data & Analytics, 2016
More Than 70% of Safety Training Conducted Online
Less Than 25% of Safety Training Conducted OnlineNo Safety Training Conducted Online
25% to 70% of Safety Training Conducted Online

BU
ILD
ING
A S
AF
ET
Y C
ULT
UR
E: I
MP
RO
VIN
G S
AF
ET
Y A
ND
HE
ALT
H M
AN
AG
EM
EN
T IN
TH
E C
ON
ST
RU
CT
ION
IND
US
TR
Y D
ATA In both the 2012 and 2015 studies, respondents were
asked to rate the level of in�uence of safety training for different roles within their companies, from jobsite workers to company leadership. The chart at right represents the percentage of those from each study who believed that safety training had a highly positive in�uence on each of these different roles.
Taken together, the �ndings suggest growing recognition that safety needs to be implemented both top-down and bottom-up.
■ Jobsite Workers: In 2015, jobsite workers have the highest percentage (87%) who believe that safety training has an impact on them, a switch from 2012, when supervisors ranked �rst. Even though the increase in the percentage who consider safety training a highly positive in�uence is not statistically signi�cant, it is consistent with the other �ndings in the study that demonstrate increased attention in the construction industry to the importance of having jobsite workers actively involved in safety.• There are no statistically significant differences
between large and small companies or between general and specialty contractors in those who find safety training has a highly positive influence on jobsite workers.
• However, 94% of respondents from companies at the moderate to high end of the safety culture spectrum (see page 17) report this strong positive influence compared with 73% from those at the low end of the spectrum, which may suggest that a safety culture helps reinforce the recognition of the importance of jobsite workers to improve safety.
■ Supervisors and Project Management Team: The �ndings between 2012 and 2015 are very consistent in terms of the positive in�uence of safety training for supervisors and project management teams on implementing a good safety program. • 91% of general contractors consider safety training
influential for supervisors, compared with 81% of specialty contractors. However, there are no significant differences by company size for this factor.
• There are no statistically significant differences of note by company type or size for the influence of safety training on project management teams.
• As with jobsite workers, there is much wider recognition of the influence of safety training for both of these roles among respondents in the middle and at the high end of the safety culture spectrum.
Training Practices and Communication CONTINUED
■ Company Leadership: Safety training is recognized as a highly positive in�uence by more respondents in 2015 (74%) than in 2012 (63%). As with the other roles, those in the middle and at the high end of the safety culture spectrum are much more likely to recognize a high degree of in�uence than those at the low end, but no other signi�cant differences by company size or type are evident.
Dodge Data & Analytics 45 www.construction.com SmartMarket Report
Impact of Safety Training by Role
Impact of Safety Training by Role(Percentage Selecting Highly Positive In�uence in 2012 and 2015)
3_14_Safety_Management_Batch3_Training_InfluencebyFunction_#02
Jobsite Workers
Supervisors
Dodge Data & Analytics, 2016
20122015
Project Management Team
Company Leadership
Estimators
81%
86%
87%
85%
78%
74%
63%
41%
31%
77%

BU
ILD
ING
A S
AF
ET
Y C
ULT
UR
E: I
MP
RO
VIN
G S
AF
ET
Y A
ND
HE
ALT
H M
AN
AG
EM
EN
T IN
TH
E C
ON
ST
RU
CT
ION
IND
US
TR
Y D
ATA In the current study, respondents were asked to rate the
value of different modes of training for jobsite workers and for supervisors. The chart at right represents the percentage of those who �nd the different modes of training to be of great value for these two positions.
For both jobsite workers and supervisors, training on the jobsite is by far considered to be the most valuable, with the percentage who consider it valuable for jobsite workers slightly higher than those who consider it valuable for supervisors. There are no signi�cant differences between the 2015 �ndings and the �ndings for each role in 2012, although in 2012, the �ndings for both were the same (82%), suggesting a slight shift in the current �ndings toward considering on-the-jobsite training particularly important for jobsite workers. This is consistent with a shift toward understanding the importance of the role jobsite workers can play in making projects safer.
However, a much higher percentage of respondents consider all other modes of training, including training by an authorized OSHA outreach trainer, training in a classroom and online/eLearning training, to be of value for supervisors than for jobsite workers. This may be in part because other training may help with supervisory leadership on safety and health on the jobsite, a key role for that position.
• A signi�cantly higher percentage of respondents in 2015 (42%) than 2012 (26%) consider online training important for supervisors, but the �ndings about the value of online training for jobsite workers is notably consistent between 2012 and 2015. Many factors may impact this, including an emphasis on making jobsite worker training more focused on the needs of specific projects and the challenges of online safety training via small mobile devices compared with functionality on a computer, which more supervisors may have access to.
• There is a notable decline in the percentage who consider classroom training of value for jobsite workers, from 52% in 2012 to 33% in 2015. There is no significant difference for this factor for supervisors. Again, this may reflect a tendency to prefer jobsite worker safety training to be more focused on the needs of the specific projects on which they are engaged.
• Larger �rms are more likely to �nd value in classroom training for both jobsite workers and supervisors. 93% of those who work for companies with 100 or more employees consider this training
Training Practices and Communication CONTINUED
of moderate to great value for jobsite workers, and 97% of them consider it of value for supervisors. However, among firms with fewer than 50 employees, only 76% consider it of value for jobsite workers and 83% consider it of value for supervisors. This may be due to the ability of larger companies to capitalize on more extensive training resources when they provide classroom training.
SmartMarket Report Dodge Data & Analytics 46 www.construction.com
Value of Different Modes of Safety Training by Role
Value of Different Modes of Safety Training by Role (Percentage Who Consider Safety Training to be of Great Value)
3_15_Safety_Management_Batch3_Training_ValuebyType_#02
On the Jobsite
Authorized OSHA Outreach Trainer
Dodge Data & Analytics, 2016
SupervisorsJobsite Workers
Classroom
Online/eLearning
85%
77%
44%
54%
33%
51%
24%
42%

BU
ILD
ING
A S
AF
ET
Y C
ULT
UR
E: I
MP
RO
VIN
G S
AF
ET
Y A
ND
HE
ALT
H M
AN
AG
EM
EN
T IN
TH
E C
ON
ST
RU
CT
ION
IND
US
TR
Y D
ATA
Keeping jobsite workers well trained about safety is widely recognized as important in the construction industry (see page 42), but it also presents several critical challenges. Depending on the company and the type of construction, jobsite workers may experience higher turnover than other functions in the industry. Their productivity also directly impacts factors like project schedule and budget. They may be the least likely to have access to computers and other means of delivering training. These and other factors may in�uence the frequency with which these workers are trained.
Industry best practices about who trains these workers and how safety messages are communicated to them most effectively can help contracting companies determine the best approach to safety training and communication with jobsite workers.
Frequency of TrainingIn both the 2012 study, published in the 2013 Safety Management in the Construction Industry SmartMarket Report, and in the current study, contractors were asked how frequently they offer formal safety training to jobsite workers. As the �ndings indicate, larger companies
Training Practices and Communication CONTINUED
Dodge Data & Analytics 47 www.construction.com SmartMarket Report
Jobsite Worker Safety and Health Training Trends
Frequency of Safety and Health Training (By Size of Company)
4_04_Safety_Management_Batch4_Training_Workers_Frequency_#02
Dodge Data & Analytics, 2016
Twice a YearOnce a Quarter or More
Annually
Only When First HiredOnly When Required
2012
15%
24%
9%
27%
18%
2012
28%
4%11%
23%
32%
2012
22%
8%
10%
6%
51%
2015
14%
24%
14%
21%
21%
2015
18%
8%
19%
23%
25%
2015
15%
6%8%
13%
53%
Less Than 10 Employees 10 to 499 Employees 500 or More Employees
** Respondents could also select an “Other” response, which is not re�ected in the data listed.
continue to offer training more frequently than smaller companies. However, there are also some distinctions year over year that suggest trends in how frequently safety training is offered across the industry.
LARGEST COMPANIES (THOSE WITH 500 OR MORE EMPLOYEES)Over half (53%) of respondents from companies with 500 or more employees offer their jobsite workers safety training at least once a quarter, a �nding consistent with the percentage of very large companies that offered training at that frequency in 2012. This is in contrast to the smaller companies. In fact, in the current study, the percentage of respondents from the largest companies is more than double any other category.
There is also a notable increase in the percentage of respondents from the largest contracting companies who report that they deliver training twice a year, from 6% in 2012 to 13% in 2015, and a corresponding decrease in training delivered less frequently. This suggests that the largest companies are increasingly recognizing the value of frequent training of jobsite workers and continue to increase their investments to provide that training.

BU
ILD
ING
A S
AF
ET
Y C
ULT
UR
E: I
MP
RO
VIN
G S
AF
ET
Y A
ND
HE
ALT
H M
AN
AG
EM
EN
T IN
TH
E C
ON
ST
RU
CT
ION
IND
US
TR
Y D
ATA MIDSIZE TO LARGE COMPANIES (THOSE WITH
BETWEEN 10 AND 499 EMPLOYEES)Midsize to large companies follow the opposite trend of the largest companies. The respondents from the midsize to large companies are trending overall toward less frequent training for jobsite workers now than they offered in 2012.
• That trend is most evident in the category of delivering training once a quarter or more, where the percentage of respondents from midsize to large companies drops from 32% in 2012 to 25% in 2015.
• It is also evident in the categories in which training is offered least frequently. The current percentage in 2015 (8%) who offer training only when workers are first hired is double the previous finding from 2012 (4%), and the increase in those who provide training only when required is almost double (from 11% in 2012 to 19%in 2015).
These �ndings demonstrate that the industry needs to engage �rms of this size more actively in the importance of frequently training jobsite workers.
SMALL COMPANIES (THOSE WITH LESS THAN 10 EMPLOYEES) There is less of a distinct trend among the respondents from the small companies between the two studies. While there is a slight increase of three percentage points in those providing training once a quarter or more from 18% in 2012 to 21% in 2015, there is also a decline of six percentage points in those who provide annual training and an increase of �ve percentage points in those who only provide training when the worker is �rst hired.
However, in general, respondents from this group still tend to report the least frequency of training for jobsite workers. They are the highest percentage of any category who only train workers when they are �rst hired or only train when required. While not trending notably worse, these data still suggest that providing these companies with better training resources could be valuable to improve safety in the construction industry.
VARIATION BY SAFETY CULTURE SPECTRUM46% of respondents from companies at the high end of the safety culture spectrum (see page 17 for more information about the spectrum) report that they offer safety training once a quarter or more, compared with 19% at the low end of the spectrum, and the percentage of respondents from companies at the low end of the
spectrum (24%) who report their companies only offer safety training when needed is more than threefold that of respondents of companies at the high end of the spectrum (7%). This �nding again demonstrates that those who are actively engaged in building a safety culture have better safety management practices.
Person/Role Who Conducts Safety Training for Jobsite WorkersRespondents were also asked who conducts safety training for their jobsite workers. Consistent with the �ndings of the 2012 study, training for jobsite workers is most commonly conducted by their company’s in-house training expert, reported by over two thirds (68%). An in-house training expert is also more frequently used by companies with 100 or more employees (86%) than by companies with fewer than 50 employees (50%) and by general contractors (75%) more than specialty contractors (60%). No doubt, having access to more in-house training resources is an essential factor in these �ndings.
However, there is clearly a shift occurring in the industry in terms of the popularity of other roles for delivering training. There is a signi�cant decline in the percentage of respondents who report that their company uses third-party trainers from 38% in 2012 to 28% in 2015. Since there are no signi�cant variations by �rm type or size, it is not
Training Practices and CommunicationJobsite Worker Safety and Health Training Trends CONTINUED
SmartMarket Report Dodge Data & Analytics 48 www.construction.com
Person/Role Who Conducts Safety Training for Jobsite Workers (By Year)
3_16_Safety_Management_Batch3_Training_Workers_WhoConducts_#02
Company In-House Training Expert
Third-Party Trainer
Dodge Data & Analytics, 2016
20122015
Joint Labor Management Training Fund
Online/eLearning Site
68%
63%
28%
38%
17%
7%
9%
15%

BU
ILD
ING
A S
AF
ET
Y C
ULT
UR
E: I
MP
RO
VIN
G S
AF
ET
Y A
ND
HE
ALT
H M
AN
AG
EM
EN
T IN
TH
E C
ON
ST
RU
CT
ION
IND
US
TR
Y D
ATA
Training Practices and CommunicationJobsite Worker Safety and Health Training Trends CONTINUED
Dodge Data & Analytics 49 www.construction.com SmartMarket Report
Most Effective Means of Communicating Safety Messages to Jobsite Workers(Ranked First By Year)
3_18_Safety_Management_Batch3_Training_Workers_Communication_#02
Toolbox Talks
Training
Dodge Data & Analytics, 2016
20122015
Chain of Command
Email Alerts
Text Alerts
Flyers With Paychecks
2%
48%
41%
30%
38%
16%
13%
4%
2%
2%
2%
1%
clear what is driving this decline. Perhaps it is in part due to the lingering effects of the 2007 to 2010 recession and the sluggish recovery, which may have impacted the funds available to use third-party sources for training.
On the other hand, there is a signi�cant increase in the use of joint labor-management training funds, from 7% in 2012 to 17% in 2015. While the overall percentage is still low, it is clear that this is an emerging practice, and one that will be interesting to track over time.
The most surprising �nding on its surface is a signi�cant decrease in the use of online/eLearning sites for jobsite workers, from 15% to 9%. In fact, this �nding is consistent with the much lower level of use of online/eLearning resources for jobsite workers than for supervisors (see page 46). However, as mobile devices on the jobsite continue to improve, it is surprising that their use as a delivery method for safety training is in decline. It is possible that the increase expected in the next two years in safety training conducted online in general (see page 44) could be due in part to expectations that mobile devices will be suf�ciently enhanced to allow better delivery of online learning to jobsite workers.
Most Effective Means of Communicating Safety Messages to Jobsite WorkersIn both 2012 and the current study, respondents were asked to rank the top three most effective means of communicating safety messages to jobsite workers. The chart at right represents the communication means that they ranked �rst.
While there are no statistically signi�cant differences in any one item, the small shifts do make a difference when looking at the degree of preference for toolbox talks. In both 2012 and 2015, they are selected by the highest percentage as the most effective means of communication, and training comes in second. However, in 2012, there was only a small three percentage point difference between these top means of communication. In 2015, there is a substantial 18 percentage point difference, demonstrating a clear industry preference for toolbox talks over training.
Other than chain of command, all of the other means mentioned, including email alerts, text alerts and paycheck �yers, are all considered effective only by a small percentage of respondents. These �ndings are quite consistent with the previous study and demonstrate that a company’s efforts should include toolbox talks, supplemented by training and chain-of-command messages.

BU
ILD
ING
A S
AF
ET
Y C
ULT
UR
E: I
MP
RO
VIN
G S
AF
ET
Y A
ND
HE
ALT
H M
AN
AG
EM
EN
T IN
TH
E C
ON
ST
RU
CT
ION
IND
US
TR
Y D
ATA Safety and health leadership by supervisors is an
essential part of a strong safety culture at a company. The �ndings in this study show that the need for that leadership is widely recognized across the industry, with 97% of respondents reporting that at least some of their supervisors lead by example, and the vast majority reporting that most of their supervisors do (see page 14). However, a lower percentage (89%) report that their company requires leadership training on health and safety to their supervisors (see page 42), which suggests a gap that needs to be �lled.
Part of the challenge may be the availability of leadership training for construction supervisors with a focus on health and safety. Therefore, the study asked respondents whether they would encourage their supervisors to take leadership training if it were added to the OSHA 30-Hour training for supervisors as an elective. A high percentage of respondents (84%) agree that they would encourage their supervisors to request that leadership training.
As the chart at right reveals, the larger the company that the respondents work for, the more likely they are to believe that they would encourage their supervisors to undertake leadership training. This corresponds with the greater emphasis on training opportunities and requirements from larger companies throughout the data.
In addition, 94% of respondents at the high end of the safety culture spectrum (see page 17) report that they would encourage their supervisors to undertake the training, compared with 69% at the low end, reinforcing the recognition of supervisors as important contributors to a safety culture.
However, it is notable that there are no signi�cant differences on this point between general and specialty contractors. That �nding is somewhat surprising since a much higher percentage of general contractors than specialty contractors require their supervisors to have basic safety and health training, and safety and health leadership training (see page 43). Clearly specialty contractors place enough emphasis on this issue to at least encourage their supervisors to take advantage of available training, even if many are not willing to actually require it at this point.
Training Practices and Communication CONTINUED
SmartMarket Report Dodge Data & Analytics 50 www.construction.com
Leadership Training for Supervisors
Would Have Supervisors Request Leadership Training as an Elective for OSHA 30-Hour Training (By Size of Company)
3_19_Safety_Management_Batch3_Training_LeadershipTraining_#02
Dodge Data & Analytics, 2016
94%
100 or More Employees
88%
50 to 99 Employees
72%
Fewer Than 50 Employees

BU
ILD
ING
A S
AF
ET
Y C
ULT
UR
E: I
MP
RO
VIN
G S
AF
ET
Y A
ND
HE
ALT
H M
AN
AG
EM
EN
T IN
TH
E C
ON
ST
RU
CT
ION
IND
US
TR
Y
Best Practices in Safety Training
Organizations are �nding that making safety training personal, delivering it to as young of an audience as possible and keeping interest engaged in safety beyond the training classes themselves are helping them to bring their safety message more effectively to workers.
Dodge Data & Analytics 51 www.construction.com SmartMarket Report
Sidebar: Best Practices in Safety Training
When Balfour Beatty Construction launched its Zero Harm program in 2012, it required
new employees to sit through a video that parsed jobsite safety rules and regulations. “It was 27 minutes of pain,” says Steve Smithgall, senior vice president of safety, health and environment at Balfour Beatty. So in 2015, the company replaced that initial effort with a new video exemplifying a more progressive approach to safety training: one that aims to get project teams “to truly embrace a safety culture focused on positive, proactively safe behaviors,” says Smithgall.
This Time, It’s PersonalMandatory viewing for all workers joining a Balfour Beatty jobsite, the new �lm introduces nine safety principles that address construction’s most common safety challenges, and it does so in a way that makes them personal. First, the �lm makes explicit the link between working safely during the day, and going home safe at the end of it: “Thinking about the family the worker has to support hopefully makes him ask whether taking a risk is really worth it,” says Smithgall. Second, the �lm extends the nine safety principles to personal contexts—a man stops his child from climbing a ladder at home, for example, and puts up a guard to keep himself safe on scaffolding at work—so that, rather than a compartmentalized behavior that
workers switch on when they arrive at the jobsite, safety becomes a full-time attitude.
Catch Them YoungThe earlier that attitude begins, the better: That’s the idea behind a new program that integrates safety skills into masonry apprenticeship. Musculoskeletal disorders (MSDs) are the scourge of the masonry sector, and of the construction industry in general. The best way to avoid them is through ergonomics; but beyond—perhaps—“proper” lifting, many construction trade workers, and especially young apprentices, have no training in ergonomics.
The Safety Voice for Ergonomics (SAVE) program, a national program developed by a team of researchers in collaboration with the International Masonry Institute and the Masonry r2p Partnership, integrates evidence-based health and safety training strategies into masonry apprenticeship. And, because apprenticeship programs often lack soft-skills training in how to respond appropriately to unsafe environments and practices, the program combines training in ergonomics with problem-solving, self-management and leadership skills to help young masons develop their safety voice.
“We’re trying to introduce these ideas during their apprenticeship, and not when they’re 30 and already injured,” says Daniel
Anton, an associate professor in the department of physical therapy at Eastern Washington University. “We want them to have long careers.”
Keep It FreshWith any safety training, the constant challenge is to keep it fresh. SAVE, for example, uses text messages and emails to deliver refresher training four times a month over a one-year period to maximize retention. An increasing number of phone apps offer safety reminders, and futuristic equipment with augmented-reality (AR) safety training is coming down the pipe. “The future of safety is going to be wearables [such as helmets and vests] that tell you how to do a task correctly and in a safe manner,” Peter Grant, CEO of Safesite, an Australia-based app provider, predicted at a recent BuiltWorlds event. And wearables may turn out to be only a bridge technology until construction tools themselves train workers in safe use, predicts Mark Barry, chief technology of�cer at Capital Construction Solutions.
A more timeless approach to keeping safety training fresh is the growing practice of onsite morning warm-ups, in which the entire crew limbers up together. This simple practice works on multiple levels—individual and collective, immediate and long-term—delivering the safety message to the body directly, where hopefully it will become second nature. n

BU
ILD
ING
A S
AF
ET
Y C
ULT
UR
E: I
MP
RO
VIN
G S
AF
ET
Y A
ND
HE
ALT
H M
AN
AG
EM
EN
T IN
TH
E C
ON
ST
RU
CT
ION
IND
US
TR
Y
SmartMarket Report Dodge Data & Analytics 52 www.construction.com
Study GoalsDodge Data & Analytics conducted the 2015 Safety Management in the Construction Industry Study with two purposes in mind:■ Longitudinal Comparison to Study
Conducted in 2012: The study sought to assess trends in the industry for the following topics by including comparisons with the benchmark Safety Study completed in 2012.• The use of specific
safety practices• The impact of a safety
management program on project safety and outcomes, including productivity benefits
• Influence factors • Training practices
■ Indicators of a Safety Culture: In addition, new data was gathered on 33 indicators of a safety culture in seven categories. These 33 indicators were used to formulate a safety culture spectrum. The �ndings from the rest of the study were then analyzed in regard to this safety culture spectrum to demonstrate the effectiveness of working toward creating a safety culture on the use of safety practices and the bene�ts accrued from that use.
Safety in Construction Study Research
Methodology:
Study ApproachThe survey data was collected using an online survey of industry professionals between October 27th and November 4th, 2015. The Dodge Data & Analytics Contractor Panel was used to reach general and specialty contractors throughout the U.S. This panel contains a representative sample of construction contractors across the U.S. The panelists are identi�ed by many categories, including size, region, types of projects undertaken and specialty. To gain an industry-wide perspective, no speci�c contractor group was excluded from the study.
Survey Respondents The survey had 254 complete responses. The use of a sample to represent a true population is based on the �rm foundation of statistics. The sampling size and technique used in this study conform to accepted industry standards expected to produce results with a high degree of con�dence and low margin of error.
The total sample size (n=254) benchmarks at a 95% con�dence interval with a margin of error of 6.1% for dichotomous inquiries.
Three analytical variables were used for the majority of this analysis:■ Position on the Safety Culture
Spectrum■ Company Type■ Company Size
POSITION ON THE SAFETY CULTURE SPECTRUMSee page 17 for more information on how this analytical variable was derived and the percentage of respondents that fall into each category.
COMPANY TYPEThe survey respondents identi�ed themselves as follows:■ 111 general contractors (44%)■ 115 specialty contractors (45%)■ 8 design-build contractors (3%)■ 19 construction management
�rms (8%)■ 1 engineering �rm (.4%)
For the analysis in this report, the category general contractor includes the design-build and construction management �rms, and the engineering �rm was included in the specialty contractor category.
Respondents were working on projects across the commercial, institutional and manufacturing sectors.
SIZE OF COMPANYRespondents were asked to identify the size of their companies by the number of employees in the following categories:■ Less Than 10 (11%)■ 10 to 49 (32%)■ 50 to 99 (16%)■ 100 to 499 (20%)■ 500 or More (21%)
These categories are combined in different ways throughout the analysis, depending on which larger category has signi�cant differences that clarify the different priorities and approaches of large, medium and small companies in regard to safety. n

SmartMarket Report
Produced with support from
ResourcesOrganizations,websites and publications to help you get smarter about improving the safety performance of the construction industry.
ACKNOWLEDGEMENTS:
The authors wish to thank our premier partners, the Center for Construction Research and Training (CPWR) and United Rentals, for helping us bring this information to the market. Specifically, we would like to acknowledge Pete Stafford and Patricia Quinn at CPWR, along with the CPWR staff, and Jim Dorris and Jeremy Fountain at United Rentals for their support.
Additional thanks to the supporting sponsors as well, including Autodesk, ClickSafety and Procore. We also thank our contributing partners, the National Institute of Building Sciences and PCL Construction, and our association partners, Associated Builders and Contractors, Associated General Contractors of America, Construction Users Roundtable, Lean Construction Institute, Mechanical Contractors Association of America, National Electrical Contractors Association, and Sheet Metal and Air Conditioning Contractors’ National Association.
We would also like to thank all of the experts who shared their insights and photos with in the articles in this report.
Supporting PartnersAutodesk: www.autodesk.com/bimClickSafety: www.clicksafety.comProcore: www.procore.com
Contributing PartnersNational Institute of Building Sciences: www.nibs.orgPCL Construction: www.pcl.com
Association PartnersAssociated Builders and Contractors: www.abc.orgAssociated General Contractors of
America: www.agc.org Construction Users Roundtable: www.curt.orgLean Construction Institute: www.leanconstruction.org/lci-safetyMechanical Contractors Association
of America: www.mcaa.org/National Electrical Contractors
Association: www.necanet.org Sheet Metal and Air Conditioning Contractors’
National Association: www.smacna.org
Federal Government Agencies and ProgramsNational Institute of Occupational Safety
and Health: www.cdc.gov/nioshNational Institute of Standards and
Technology: www.nist.govOccupational Safety and Health
Administration: www.osha.govOSHA Data Initiative: www.osha.gov/pls/odi/establishment_search.htmlU.S. Bureau of Labor Statistics: www.bls.gov
Other Resources:American Subcontractors Association: www.asaonline.com/eweb/BIMForum: bimforum.orgThe Association of Union Contractors: www.tauc.orgConstruction Industry Institute: www.construction-institute.orgConstruction Managers Association of
America: http://cmaanet.org Construction Safety Council: www.buildsafe.orgInternational Code Council: www.iccsafe.org
www.cpwr.comwww.elcosh.org
www.cpwrconstructionsolutions.orghttp://stopconstructionfalls.com
United Rentals
www.unitedrentals.com
Dodge Data & Analytics
Main Website: construction.comDodge: construction.com/dodgeResearch & Analytics: construction.com/dodge/dodge-market-research.aspSweets: sweets.comSmartMarket Reports: analyticsstore.construction.com
This publication was supported by CPWR through NIOSH cooperative agreement OH009762. Its contents are solely the responsibility of the authors and do not necessarily represent the official views of CPWR or NIOSH. CPWR does not endorse any of the other partners associated with this project.

Dodge Data & Analytics SmartMarket Reports™
Get smart about the latest industry trends.For more information on these reports and others, visit
analyticsstore.construction.com
www.construction.com
■ Design and Construction Intelligence
SmartMarket Report