Building a Real-Time Event-Driven Enterprise Infrastructure · Agenda • PI for Enterprise...
39
Building a Real-Time Event-Driven Enterprise Infrastructure Ann Moore Ann Moore – – Business Development Executive Business Development Executive
Transcript of Building a Real-Time Event-Driven Enterprise Infrastructure · Agenda • PI for Enterprise...

Building aReal-Time Event-DrivenEnterprise Infrastructure
Ann Moore Ann Moore –– Business Development ExecutiveBusiness Development Executive
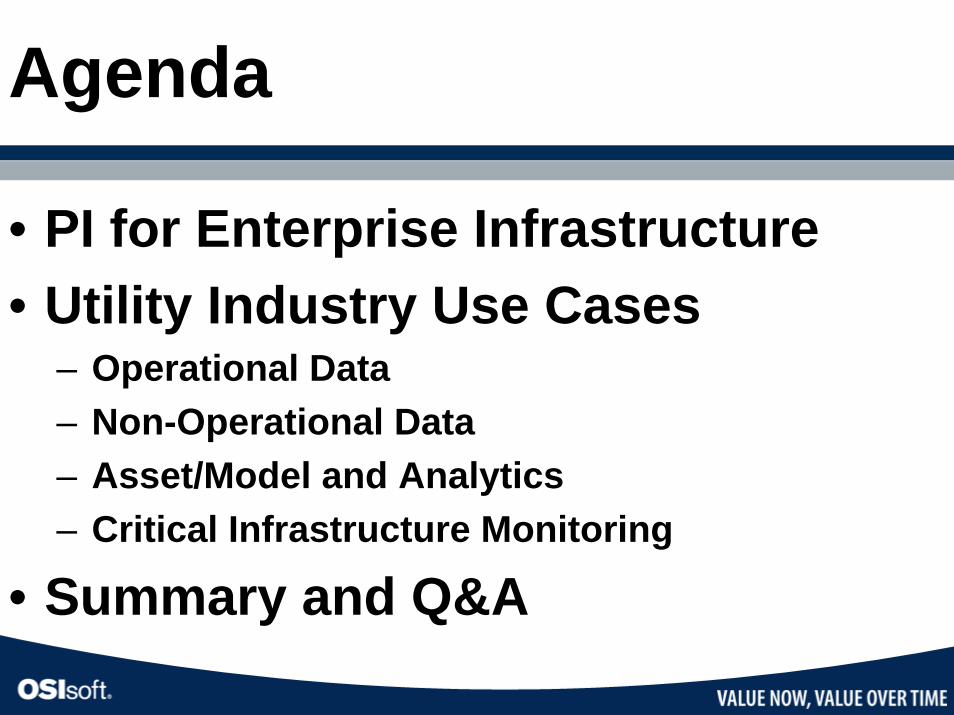
Agenda
• PI for Enterprise Infrastructure• Utility Industry Use Cases
– Operational Data– Non-Operational Data– Asset/Model and Analytics– Critical Infrastructure Monitoring
• Summary and Q&A

ENTERPRISE
UnstaffedAsset
(100’s of sites)
Smart Connectors
StaffedAsset
(10’s of sites)
Division HQ’s
BusinessSystems
PortalServers
ApplicationServers
PI Analytics
Smart Connectors
PI Analytics
Smart Connectors
Joint VenturesEmployeesRegulatory Agencies
PI Analytics
Smart Connectors
Data Access
Enterprise PI System
Enterprise Deployment Example
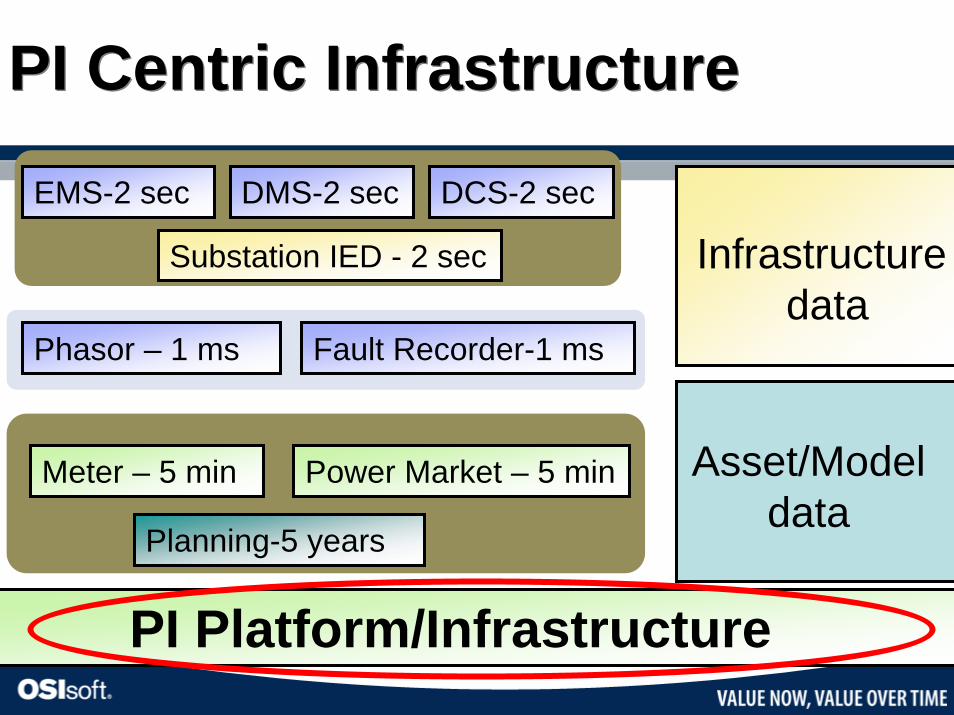
PI Centric InfrastructurePI Centric Infrastructure
PI Platform/Infrastructure
Planning-5 years
Power Market – 5 min
Fault Recorder-1 ms
EMS-2 sec
Phasor – 1 ms
Meter – 5 min
Substation IED - 2 sec Infrastructuredata
DMS-2 sec DCS-2 sec
Asset/Modeldata
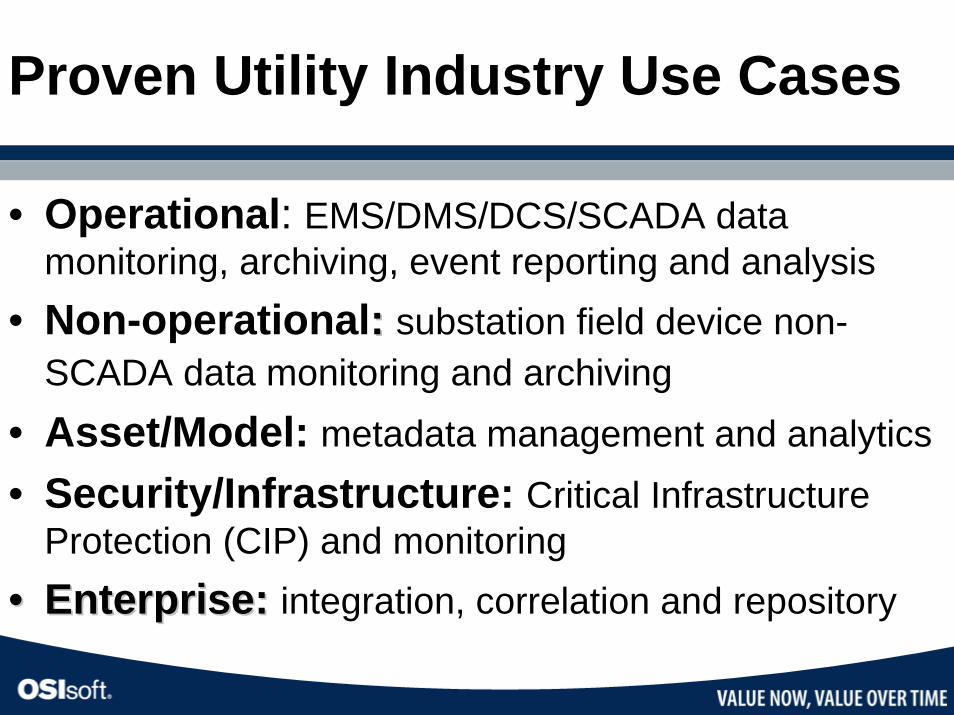
Proven Utility Industry Use Cases
• Operational: EMS/DMS/DCS/SCADA data monitoring, archiving, event reporting and analysis
• Non-operational:: substation field device non-SCADA data monitoring and archiving
• Asset/Model: metadata management and analytics • Security/Infrastructure: Critical Infrastructure
Protection (CIP) and monitoring•• Enterprise: Enterprise: integration, correlation and repository

Utility Use CasesUtility Use Cases

PI for Operational Data

Enhancing and Complementing
• Real-time data analysis• Real-time decision making• Real-time visualization• Long-term data archiving/retrieval• Interfacing multiple external data sources• Centralized data repository and user interface • What-if case studies• Easy of use and accessibility for everyone• Off load from real-time control and operations

CAISO
California Independent System Operator

Western States Path Flow Monitoring

Western States
Transfer Paths

Substation Hierarchical Point-n-Click Trending

Load Comparison Trending
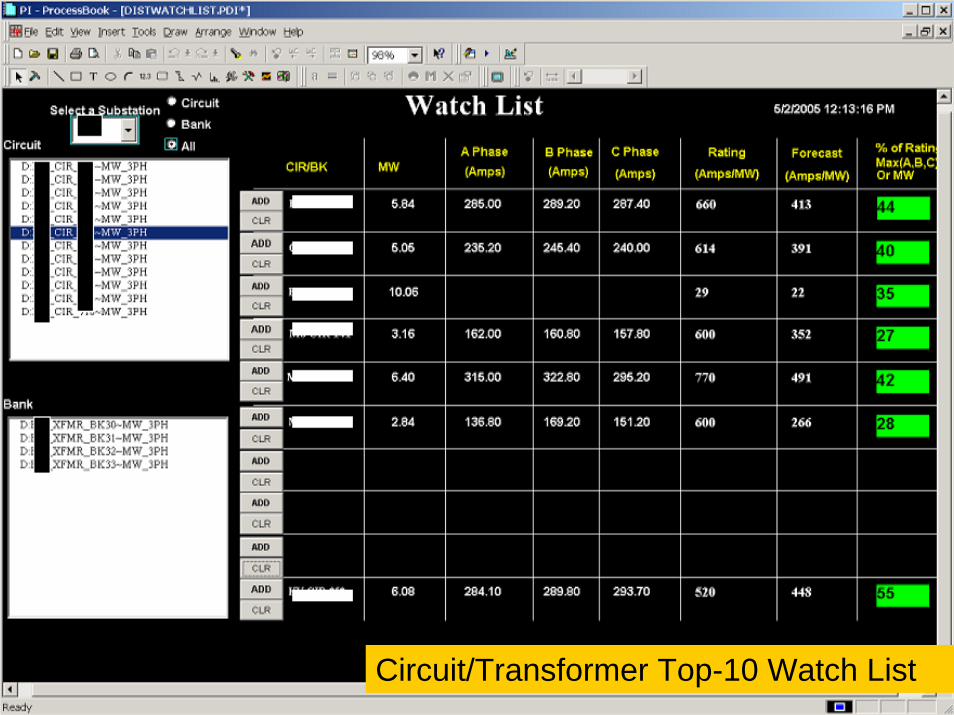
Circuit/Transformer Top-10 Watch List

Web Portal Enterprise
Data Repository
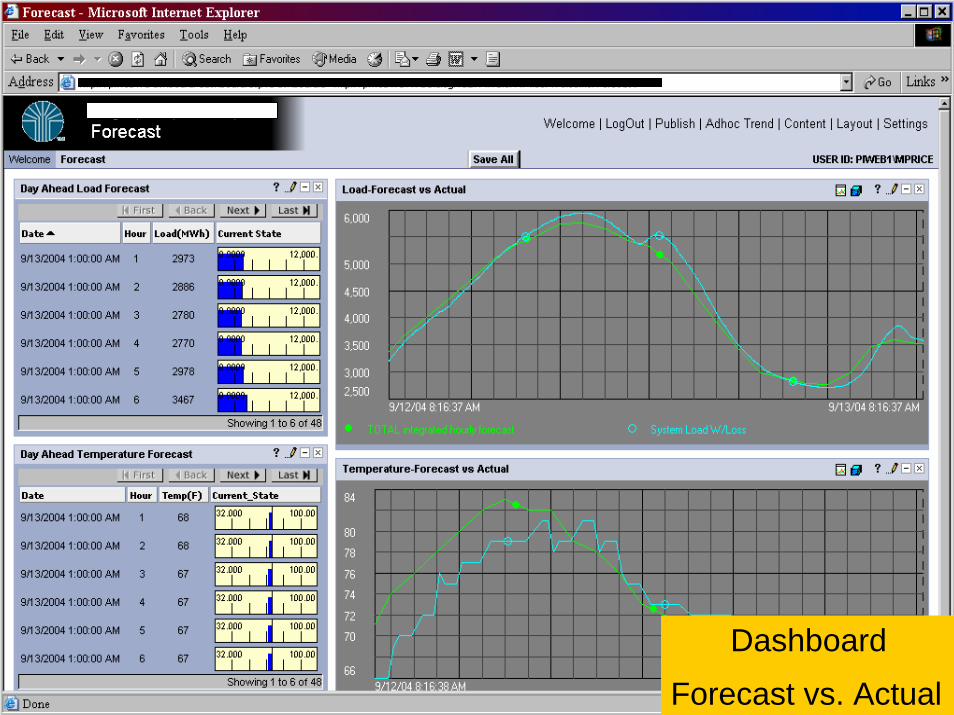
Dashboard
Forecast vs. Actual

PI for NonPI for Non--OperationalOperationalDataData

PI T&D Trends
• Distributed Generation• Power Quality/Transient/Disturbance Data• Fast Sampling PMU Phasor data• Condition Based Maintenance/Monitoring• Asset Management• AMR• Substation/Distribution Automation• Smart Grid/Intelligent Grid

PI T&D Substation Interfaces
PI Standard Real-time Interfaces
PI Arbiter1133a
PI C37.118 and
PI FFT
PI DNP3 PI CybectecSMP
PI Modbus
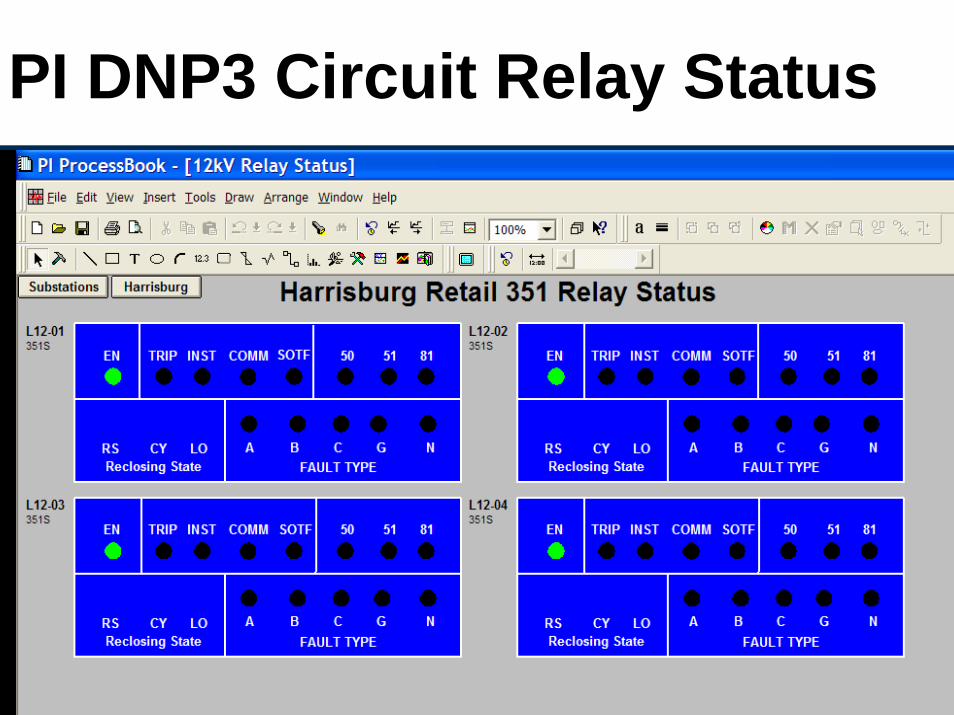
PI DNP3 Circuit Relay Status

Line Capacitor Status
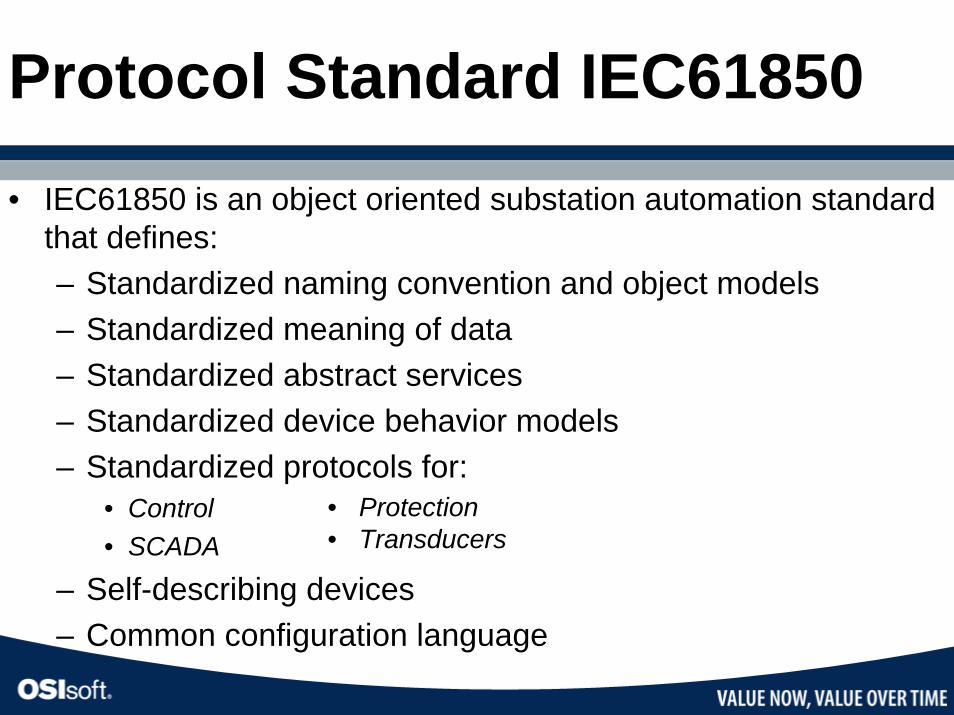
Protocol Standard IEC61850
• IEC61850 is an object oriented substation automation standard that defines:– Standardized naming convention and object models– Standardized meaning of data– Standardized abstract services– Standardized device behavior models– Standardized protocols for:
• Control • SCADA
– Self-describing devices– Common configuration language
• Protection• Transducers

PI-based WAMSWide Area Measurement Systems
• Streaming Server– Very fast synchronized sampling with standard PI IEEE
C37.118 Interface
• Real-time Analytics– Fast and synchronized real-time calculations (phase
angle difference, FFT, etc.)
• Visualization/Alerts– Enhance operations and early warning to prevent grid
instability and cascade collapse
Goslin - Metro A Voltage Gos lin - Metro B Vo ltage Goslin - Metro C Voltage
\\cctapets t005\ENT_GSLN-MTRO:ARBVA
Volts\\cctapets t005\ENT_GSLN-MTRO:ARBVB
Volts\\cctapets t005\ENT_GSLN-MTRO:ARBVC
Volts
Goslin-Metro 138 KV Vol tage Profile During Ju ne 15, 2005 Sto rm
6/15/2005 6:54:12 PM 6/15/2005 7:11:27 PM17.25 minutes
60000
80000
100000
120000
140000
40000
160000
52983.879
53522.652
49407.059
El Dorado - Mt Olive FrequencyEl Dorado - Sheridan FrequencyFancy Pt FrequencyGrand Gulf - Baxter Wilson FrequencyGoslin - Metro FrequencyMablevale - Mayflower FrequencyMablevale - Sheridan FrequencyPaterson FrequencyRay Braswell - Franklin FrequencyWaterford - Ninemile FrequencyWaterford - Willow Glen Frequency
\\cctapetst005\ENT_EDRD-MTOV:ARBF
\\cctapetst005\ENT_EDRD-SHDN:ARBF
\\cctapetst005\ENT_FYPT:ARBF
\\cctapetst005\ENT_GDGF-BXWN:ARBF
\\cctapetst005\ENT_GSLN-MTRO:ARBF
\\cctapetst005\ENT_MBLE-MFLR:ARBF
\\cctapetst005\ENT_MBLE-SHDN:ARBF
\\cctapetst005\ENT_PTSN:ARBF
\\cctapetst005\ENT_RBSL-FRKN:ARBF
\\cctapetst005\ENT_WTFD-NMLE:ARBF
\\cctapetst005\ENT_WTFD-WLGN:ARBF
June 15, 2005 Storm - System Frequency
6/15/2005 6:54:12 PM 6/15/2005 7:11:27 PM17.25 minutes
59
59.2
59.4
59.6
59.8
60
60.2
60.4
58.8
60.6
60.004
60.004
60.004
60.004
60.005
60.005
60.005
60.004
60.004
60.005
60.005
ENT_GSLN -C VLD:AR BVA
VoltsENT_GSLN -C VLD:AR BVB
VoltsENT_GSLN -C VLD:AR BVC
VoltsENT_GSLN -MTRO:ARB VA
VoltsENT_GSLN -MTRO:ARB VB
VoltsENT_GSLN -MTRO:ARB VC
Volts
Goslin Metro an d Go slin -C le veland A,B ,C Voltage
6/8/2007 7:16:03.621 AM 6/8 /20 07 8:16 :03.621 AM60.00 minutes
121.6
121.8
122
122.2
122.4
122.6
122.8
123
123.2
121.4
123.4
121.5
124
122.5
125
1 3700 0
1 3950 0
137500
140500
1385 00
1415 00
140646.047
139271.515
138653.859
124.104
122.962
122.631
Entergy System Frequency
7/27/2007 12:58:21 PM 7/27/2007 1:58:21 PM60.00 minutes
59.96
59.98
60
60.02
60.04
59.94
60.06
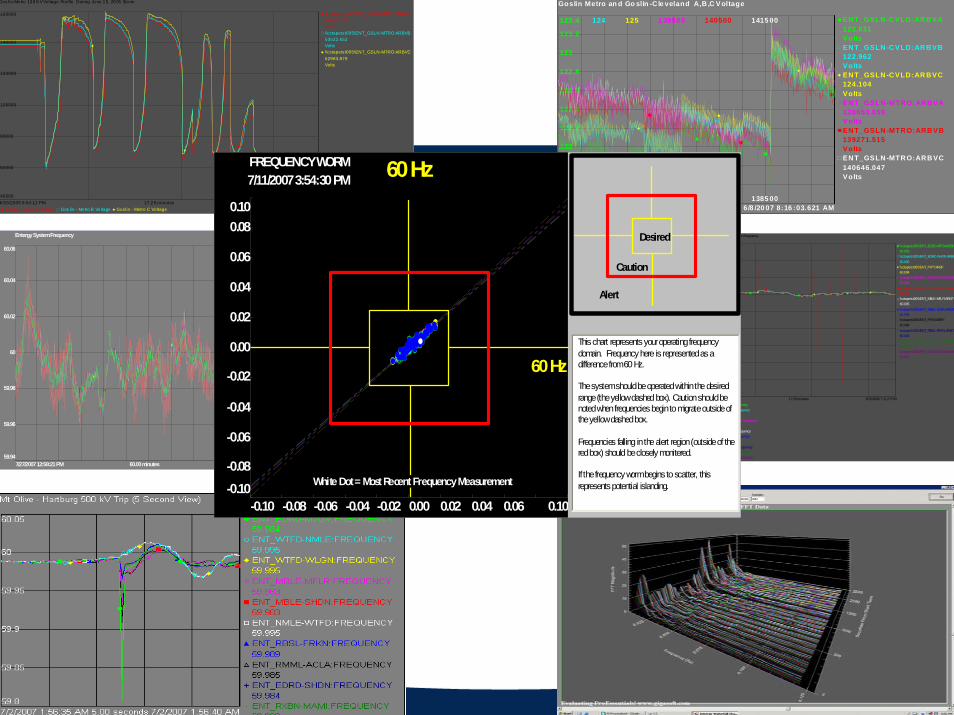
FREQUENCY WORM
-0.08 -0.06 -0.04 -0.02 0.00 0.02 0.04 0.06 0.10-0.10
-0.08
-0.06
-0.04
-0.02
0.00
0.02
0.04
0.06
0.08
-0.10
0.10
Desired
Caution
Alert
This chart represents your operating frequency domain. Frequency here is represented as a difference from 60 Hz.
The system should be operated within the desired range (the yellow dashed box). Caution should be noted when frequencies begin to migrate outside of the yellow dashed box.
Frequencies falling in the alert region (outside of the red box) should be closely monitered.
If the frequency worm begins to scatter, this represents potential islanding.
7/11/2007 3:54:30 PM
60 Hz
60 Hz
White Dot = Most Recent Frequency Measurement
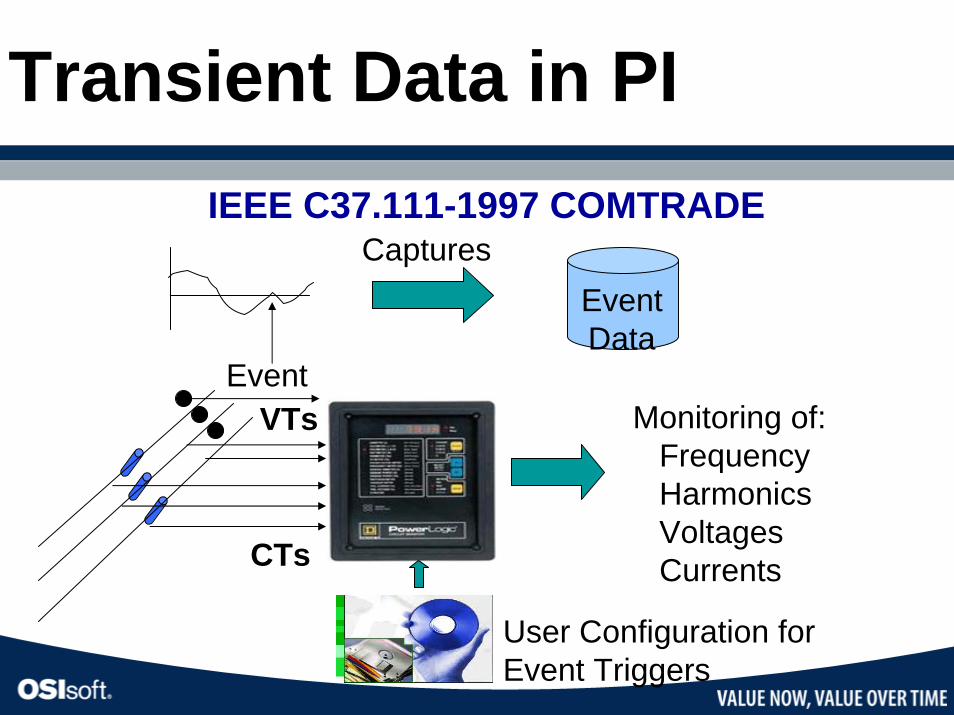
Transient Data in PI
Captures
VTs
CTs
Monitoring of:FrequencyHarmonicsVoltagesCurrents
Event
User Configuration forEvent Triggers
EventData
IEEE C37.111-1997 COMTRADE

Process Information Integration
What really
happened?

Waveforms in PI
12:00:26:91139 12:00:26:92418 12:00:26:938782.5 seconds
hundredth of second

PI for Asset Models and Analytics

Common Information Model (CIM)(NO)
NetworkOperation
(AM)Records &
Asset Mgmt.
(OP)OperationalPlanning & Optimization
(MC)Maintenance
&Construction
(ACT)CustomerAccount
Management
(RET)
Retail
(SC)Supply Chainand Logistics
(NE)Network
ExtensionPlanning
(CS)CustomerSupport
(MR)Meter
Reading &Control
(EMS)Energy
Management &Energy Trading
(FIN)
Financial
(PRM)
Premises
(HR)Human
Resources
IEC TC57 Standards Emphasis IEC TC57 and OAG Standards Emphasis
IEC 61968-3& IEC 61970 IEC 61968-4 IEC 61968-5
& IEC 61970 IEC 61968-6
IEC 61968-7 IEC 61968-8 IEC 61968-9 IEC 61968-10& IEC 61970
IEC 61968-10 & OAG
IEC 61968-10 & OAG
IEC 61968-10 & OAG
IEC 61968-10 & OAG
IEC 61968-10 & OAG
IEC 61968-10 & OAG
Utility Electric Network Planning, Constructing, Maintaining, & Operating
Customer Care, Enterprise Resource Planning, Supply Chain, & General
Corporate Services

Why CIM Matters to PI Analysis Framework (AF)• Both about modeling the business
– PI brings history to the model– CIM brings deep definition to the model
• PI is moving from “tag-centric” to “asset-centric”• The industry has moved along in parallel
– T&D has always been a real-time, no-inventory business –measurements matter
– A smart grid without standards is a dumb grid– AF + CIM makes sense
• AF is a “Measurement Model Manager”

CIM Model in Analysis Framework
• Models can be built manually, using the downloading, or programmatically
• Building the template for elements (i.e. line)• Elements have attributes
– Another measurements, line rating, power factor, graphic symbols
• Elements have connections • Building analysis rules (calculations, schedules)• Values back into any other sources

Data References ease Analysis
Data References are a lot like advanced calculations, butA Data Reference can be:
PI PointsA calculationA reference to data in other systemsXML Web ServicesRelational Databases (IEEE specs, line ratings, etc.)A reference to a CIM model

Other Possible Analysis
• Telemetry Analysis• Peak Load• Peak Circuit Load• Dynamic Line Ratings• Load Distribution• Transformer Gas/Oil Analysis• Harmonics• VAR Calculations

PI for Control System and
Critical Infrastructure

The Solution – IT Monitor• No requirement for additional Agents to be installed• A proactive and preventive way to monitor resource
health to ensure system reliability and performance• Monitoring all infrastructure attributes for disk, file,
paging, CPU, swap and memory usage, …etc. • Monitoring the processes and applications• Establishing performance baseline standards• Helping avoid finger pointing during trouble shooting• Root cause analysis and problem solving• Automatic notification
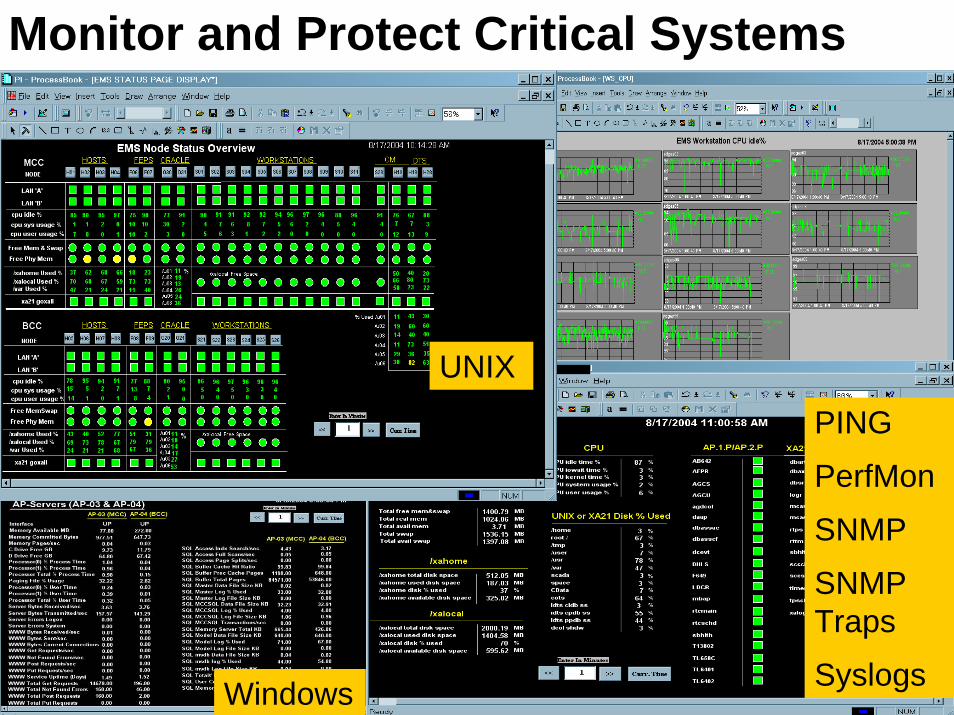
Monitor and Protect Critical Systems
UNIX
Windows
PING
PerfMon
SNMP
SNMP Traps
Syslogs

Monitor and Protect Networks
Cisco Devices NetFlow
TCPResponse
SNMP

Monitor and Protect Facility Equipment
UPS, Emergency Generator, Air Conditioner, Humidifier
• Building a real-time event-driven infrastructure by utilizing The PI System
• Expanding the value from Operations, Engineering, Planning, Protection, Asset Management, Maintenance to Enterprise
Summary
THANK YOU!!