Building a Legacy for the Next Generation
32
B u i l d i n g a L e g a c y f o r t h e N e x t G e n e r a t i o n 1 Building a Legacy for the Next Generation
Transcript of Building a Legacy for the Next Generation
B u i l d i n g a L e g a c y f o r t h e N e x t G e n e r a t i o n1
Building a
Legacy for
the Next
Generation

C a l i f o r n i a B u s i n e s s R o u n d t a b l e2
California Business Roundtable
The California Business Roundtable is a non-profit, nonpartisan organization
composed of the chief executive officers of California’s leading corporations. For
more than twenty years the Roundtable has worked closely with the governor
and the legislature to provide leadership on high priority public policy issues.
M e m b e r O r g a n i z a t i o n s
Air Touch Communications
ARCO
AT&T
Auto Club of Southern California
Autodesk
Avery Dennison Corporation
Bain and Company
Bank of America Corporation
Basic American, Inc.
Bechtel Group, Inc.
Blue Cross of California
Blue Shield of California
Boeing Co.
C.J. Segerstrom and Sons
Catellus Development Corporation
Charles Schwab Corporation
Chevron Corporation
CNF Transportation, Inc.
DHL Airways, Inc.
Edison International
Experian
Farmers Group, Inc.
Fluor Corporation
Foundation Health Systems/HealthNet
GTE Network Services
The Gap, Inc.
Guy F. Atkinson Company
Hewlett-Packard
Hughes Electronics Corporation
IBM Corporation
The Irvine Company
J.G. Boswell Company
Jacobs Engineering Group, Inc.
Kaiser Foundation Health Plan, Inc.
Kaufman and Broad Home Corporation
La Opinion
Levi Strauss and Company
Lockheed Martin Corporation
McClatchy Newspapers, Inc.
Mervyn’s
Metropolitan Life Insurance
MGM, Inc.
Nestle USA, Inc.
The Newhall Land and Farming Co.
Occidental Petroleum Corporation
Pacific Enterprises
PG&E Corporation
Pacific Life Insurance Company
Raychem Corporation
Rockwell International
Safeway Inc.
SBC Communications
Sempra Energy
State Farm Insurance Companies
Sun America Inc.
Sutter Health
Texaco Refining and Marketing Inc.
Ticor Title Insurance Company
The Times Mirror Company
Transamerica Corporation
TRW, Inc.
Union Bank of California
United HealthCare
Washington Mutual
Wells Fargo Bank

B u i l d i n g a L e g a c y f o r t h e N e x t G e n e r a t i o n3
Building a Legacy forthe Next Generation
1201 K Street, Suite 1980
Sacramento, CA 95814
916-553-4093
www.cbrt.org
O f f i c e r s
Phil Quigley – Chairman
Mike Bowlin – Vice Chairman
Gary Hunt – Chairman, Infrastructure Task Force
S t a f f
R. William Hauck – President
Kirk M. Clark – Program Director
Allison Otto – Executive Assistant

C a l i f o r n i a B u s i n e s s R o u n d t a b l e4

B u i l d i n g a L e g a c y f o r t h e N e x t G e n e r a t i o n5
■ The buildings at McNair Elementary School in the Compton Unified School District are so
dangerous that the NAACP urged parents to keep their children from attending classes. Toxic
levels of peeling lead paint were detected in rooms utilized by students in kindergarten through
third grade. In addition, the school’s crumbling walls have provided easy entry for rats, and
health inspectors have turned up rodent feces in the storage areas for the school’s cafeteria. The
Compton Unified School District is plagued with so many problems that the state took control
of the district out of local hands in 1993.
■ Lacking funds for renovation or maintenance of its roads, Kings County has begun converting
some paved highways back into gravel. Although officials initially hoped to limit this program
to low-traffic rural routes, the county has recently been forced to extend the resurfacing to six
miles of roadways serving residential areas. School bus drivers and mail carriers have already
complained of difficulty completing their routes.
■ The main physics lab at the University of California at Santa Barbara has to be evacuated
periodically to keep the students from suffocating. Broida Hall has been used as the primary
instruction and research facility for the Physics Department on the Santa Barbara campus since
1966. The building’s utility systems, essential in support of the classroom and laboratory
activities, have worn down and become obsolete over time. The capacity of the air supply and
ventilation systems has deteriorated significantly and cannot keep pace with the increased
demands of the modern processes and hazardous chemicals used in today’s laboratories.
California’s need for new capital investments in public works adds up to billions of dollars.
But the reality of what those huge numbers mean in the everyday lives of our citizens is
measured in thousands of examples like these all over the state.
We owe our modern prosperity in large part to the legacy of the last generation of Califor-
nians — the schools, highways, and institutions of higher learning that they paid to build.
With this report, the Business Roundtable is issuing a challenge to a New California to make
a similar commitment to the future.
This is a new California in at least three respects. Politically, a new governor and a new
legislature will soon be taking office in Sacramento. Economically, we are in the midst of a
renewal that has restored the vitality of our expanding and constantly diversifying economic
base. And socially, this report addresses the aspirations of the millions of new Californians
who have grown up here or chosen to make the state their home in the last decade.
Challenge for a New California
E x e c u t i v e S u m m a r y
We owe our
modern prosperity
in large part to
the legacy of the
last generation
of Californians.
C a l i f o r n i a B u s i n e s s R o u n d t a b l e6
Facts of Life
There is little disagreement that we need better, safer, less-crowded schools, highways, and
universities. The Eighth Annual Business Climate Survey, sponsored by the California
Business Roundtable and the California Chamber of Commerce, found that 71 percent of
the state’s business leaders and a slightly larger share of the voting public are concerned about
the need for increased public investment.
Their concerns are rooted in a common recognition of three basic facts of life in the Golden
State today:
■ Investments in the quality of our public facilities are a key determinant of the state’s economicgrowth.
Although capital spending for public works is not, in and of itself, sufficient to ensure
California’s economic future, it certainly is an ingredient necessary to that success.
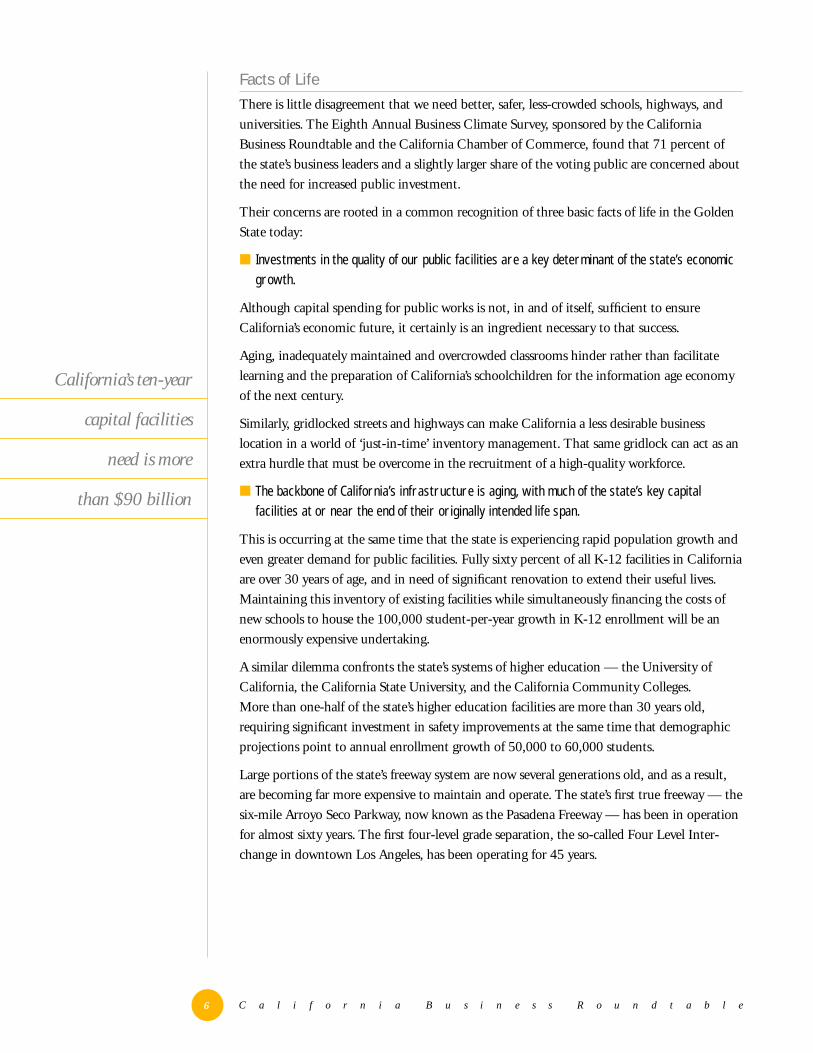
Aging, inadequately maintained and overcrowded classrooms hinder rather than facilitate
learning and the preparation of California’s schoolchildren for the information age economy
of the next century.
Similarly, gridlocked streets and highways can make California a less desirable business
location in a world of ‘just-in-time’ inventory management. That same gridlock can act as an
extra hurdle that must be overcome in the recruitment of a high-quality workforce.
■ The backbone of California’s infrastructure is aging, with much of the state’s key capitalfacilities at or near the end of their originally intended life span.
This is occurring at the same time that the state is experiencing rapid population growth and
even greater demand for public facilities. Fully sixty percent of all K-12 facilities in California
are over 30 years of age, and in need of significant renovation to extend their useful lives.
Maintaining this inventory of existing facilities while simultaneously financing the costs of
new schools to house the 100,000 student-per-year growth in K-12 enrollment will be an
enormously expensive undertaking.
A similar dilemma confronts the state’s systems of higher education — the University of
California, the California State University, and the California Community Colleges.
More than one-half of the state’s higher education facilities are more than 30 years old,
requiring significant investment in safety improvements at the same time that demographic
projections point to annual enrollment growth of 50,000 to 60,000 students.
Large portions of the state’s freeway system are now several generations old, and as a result,
are becoming far more expensive to maintain and operate. The state’s first true freeway — the
six-mile Arroyo Seco Parkway, now known as the Pasadena Freeway — has been in operation
for almost sixty years. The first four-level grade separation, the so-called Four Level Inter-
change in downtown Los Angeles, has been operating for 45 years.
California’s ten-year
capital facilities
need is more
than $90 billion

B u i l d i n g a L e g a c y f o r t h e N e x t G e n e r a t i o n7
■ The measurement of these needs is not merely important in terms of economics. Clean water,safe schools, and efficient transportation are all essential elements in the quality of life as well.
It is difficult to convince high school students of the importance of education when their
computer labs must be closed whenever it rains because the roofs leak.
California’s highway capacity has increased by only seven percent — only 3,250 lane miles —
over the past 20 years. In the same period, the state’s population has increased by 50 percent
and the average annual number of miles driven has increased as well. Given these factors, the
result is inevitable, and is visible all around us: the number of hours spent in congestion on
urban highways has increased by 70 percent between 1987 and 1995, to over 300,000 hours
per day.
Measuring the Need
A large part of this report was built upon the work of the Department of Finance in its 1997
Capital Outlay and Infrastructure Report. The Department found that the state’s infrastruc-
ture needs from 1997-98 through 2006-07 totaled $80.9 billion. After adding up all existing
funding sources, the Department further found that California would still be facing almost
$29 billion in unmet infrastructure demand over the ten-year period.
The California Business Roundtable took a second look at those estimates. And in the
process of updating the Department’s work, we made a number of findings:
■ California’s ten-year capital facilities need is more than $90 billion, about $10 billion
more than reported by the Department of Finance in 1997. The major components of the
increased estimate are K-12 and higher education facilities.
■ This $90 billion in identified infrastructure needs does not include many billions of
dollars of new transportation infrastructure needed to maintain existing levels of mobility.
We conservatively estimate the costs of needed transportation capital improvements
exceed those projected by the Department of Finance by $15 billion to $25 billion over
the ten years.
■ An improved General Fund condition and a more favorable revenue outlook enable
California to authorize and issue at least $25.3 billion in new General Fund-supported
debt over the next ten years, $5.1 billion more than originally estimated by the Depart-
ment of Finance.
■ The unmet demand — the shortfall in the state’s ability to finance its capital needs,
exclusive of the costs of needed improvements to the transportation system — is almost
$33 billion, about $4 billion higher than the Department of Finance’s earlier estimate of
$29 billion.
■ Adoption of a 50 percent local match for K-12 school facilities would reduce the state’s
funding imbalance by more than $14 billion.
■ Recent improvements in the state’s economy and the state budget provide the opportunity
for California to increase direct appropriations — or pay-as-you-go financing — for
new facilities.
California’s highway
capacity has increased
by only seven percent —
only 3,250 lane miles —
over the past 20 years.
In the same period,
the state’s population
has increased by
50 percent.
C a l i f o r n i a B u s i n e s s R o u n d t a b l e8
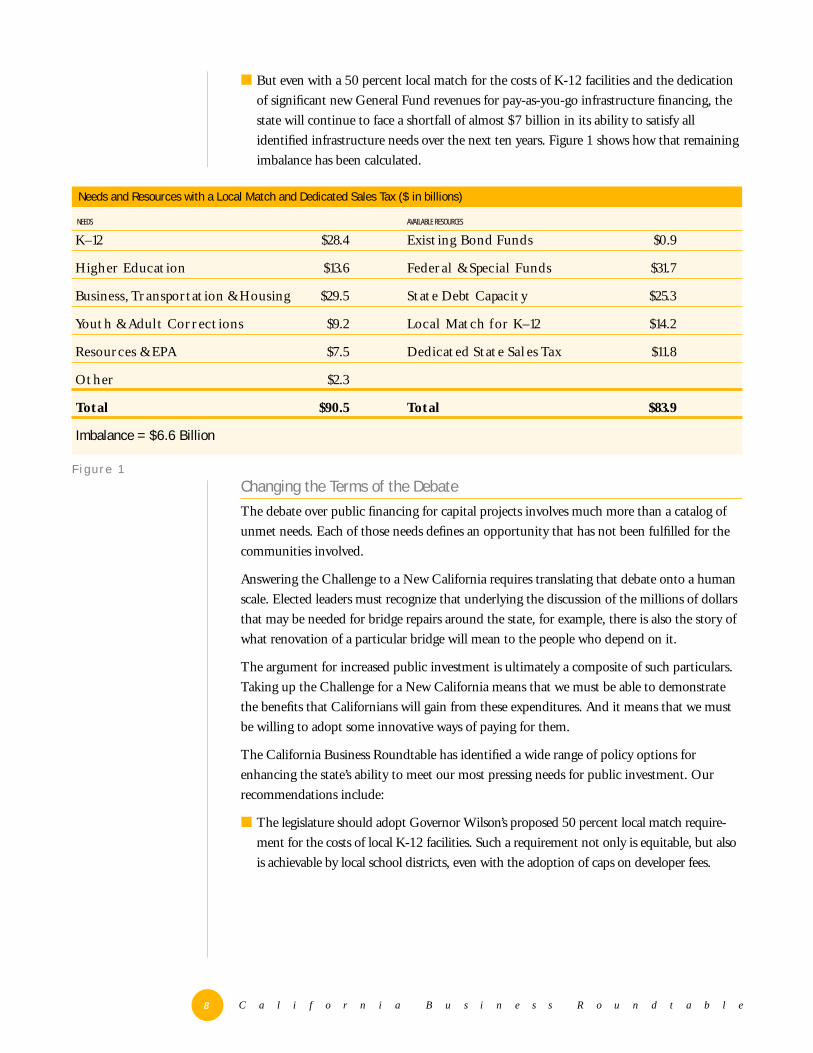
■ But even with a 50 percent local match for the costs of K-12 facilities and the dedication
of significant new General Fund revenues for pay-as-you-go infrastructure financing, the
state will continue to face a shortfall of almost $7 billion in its ability to satisfy all
identified infrastructure needs over the next ten years. Figure 1 shows how that remaining
imbalance has been calculated.
Changing the Terms of the Debate
The debate over public financing for capital projects involves much more than a catalog of
unmet needs. Each of those needs defines an opportunity that has not been fulfilled for the
communities involved.
Answering the Challenge to a New California requires translating that debate onto a human
scale. Elected leaders must recognize that underlying the discussion of the millions of dollars
that may be needed for bridge repairs around the state, for example, there is also the story of
what renovation of a particular bridge will mean to the people who depend on it.
The argument for increased public investment is ultimately a composite of such particulars.
Taking up the Challenge for a New California means that we must be able to demonstrate
the benefits that Californians will gain from these expenditures. And it means that we must
be willing to adopt some innovative ways of paying for them.
The California Business Roundtable has identified a wide range of policy options for
enhancing the state’s ability to meet our most pressing needs for public investment. Our
recommendations include:
■ The legislature should adopt Governor Wilson’s proposed 50 percent local match require-
ment for the costs of local K-12 facilities. Such a requirement not only is equitable, but also
is achievable by local school districts, even with the adoption of caps on developer fees.
Needs and Resources with a Local Match and Dedicated Sales Tax ($ in billions)
NEEDS AVAILABLE RESOURCES
K–12 $28.4 Existing Bond Funds $0.9
Higher Education $13.6 Federal & Special Funds $31.7
Business, Transportation & Housing $29.5 State Debt Capacity $25.3
Youth & Adult Corrections $9.2 Local Match for K–12 $14.2
Resources & EPA $7.5 Dedicated State Sales Tax $11.8
Other $2.3
Total $90.5 Total $83.9
Imbalance = $6.6 Billion
F i g u r e 1

B u i l d i n g a L e g a c y f o r t h e N e x t G e n e r a t i o n9
■ California should dedicate one-quarter cent of the state sales tax for pay-as-you-go
infrastructure financing. This could be accomplished by passage of a state constitutional
amendment that would remain in effect for a fixed period — say ten years — so that the
public could review its effects before deciding whether to continue it. Such a dedication of
revenues would generate $11.8 billion for infrastructure projects while reducing total
General Fund resources over the ten years only marginally, by 1.63 percent.
■ The state should encourage innovations such as developer design, build and transfer
agreements as a means of meeting the school construction demands of the next ten years.
The state allowable school costs should be reduced to reflect the ability to provide ad-
equate new school facilities at lower cost.
■ The state should capitalize the California Infrastructure and Economic Development
Bank and should explore all available options for using the Bank to leverage public and
private investment in public infrastructure.
■ Greater authority should be provided to state and local agencies to pursue entrepreneurial
partnerships for the development of public capital facilities, particularly in the transporta-
tion sector.
California presently has no formal process for considering capital investment within a larger
fiscal and policy framework. As a result, decisions on capital expenditures are made on an ad
hoc basis, with little or no knowledge of how they might affect the state’s ability to meet its
most pressing need for public works.
This report defines the opportunities for immediate action. But over the long term, state
policy makers should undertake a comprehensive review of California’s capital facilities
needs, establish a clear set of priorities, and adopt an annual plan for financing those priori-
ties over the next decade.
California
should dedicate
one-quarter cent
of the state
sales tax for
pay-as-you-go
infrastructure
financing.

C a l i f o r n i a B u s i n e s s R o u n d t a b l e10
Defining the Public’s Priorities
If California has been neglecting its most important capital facilities for too long, where have
we been spending our public dollars instead? Figure 2 compares California’s ranking among
the 50 states in several areas of public
investment in infrastructure. By this mea-
sure, we rank near the bottom of the nation
in terms of our capital spending on schools,
highways, and universities.
This comparative approach provides a
snapshot of the state’s standing relative to its
domestic economic competitors. This form
of assessment can provide an accurate
barometer of the state’s ability — or determi-
nation — to compete with other states by
providing the kinds of capital facilities that
are critical for the industries and jobs which
fuel dynamic economic expansion.
One drawback to this type of analysis is that
it does not take into account local or regional factors that often exert differential pressures on
various categories of public expenditure. For example, comparative analysis, by itself, does
not account for differences in the projected rate of growth in the school-age population,
or geological factors that can dictate the need for significant seismic upgrading of bridges
and highways.
Another method of measuring the need for capital facilities is to focus on department-
identified needs, or the resources required to accommodate the demand for infrastructure at
existing levels of service. This type of assessment is sensitive to and focuses on those factors
and growth pressures within the state that drive the demand for new investment in capital
facilities. This demand-based approach is the one employed by the Department of Finance in
its Capital Outlay and Infrastructure Report, and it is the focus of this report.
Re-Sizing the Need for Capital Facilities
In June 1997, the Department of Finance released the 1997 edition of its annual Capital
Outlay and Infrastructure Report (CO&I Report), which examines the state’s infrastructure
needs for the next ten years and sources of funding available to finance those infrastructure
California’s Public Investment Priorities in a National Context
C A L I F O R N I A ’ S 5 0 - S T A T E R A N K
PER CAPITA BASIS PERSONAL INCOME BASIS
Highways 48th 48th
Higher Education 37th 41st
Public Schools 31st 38th
Solid Waste Management 14th 19th
Corrections 8th 8th
Sewerage 3rd 3rd
Overall Infrastructure Investment 26th 40th Source: State and Local Government Finance Estimates, U.S. Bureau of the Census
Pa r t I
Needs Not Met, Opportunities Unfulfilled
F i g u r e 2
B u i l d i n g a L e g a c y f o r t h e N e x t G e n e r a t i o n11
needs. That report cataloged total infrastructure needs of $80.9 billion over the ten-year
period, from 1997-98 through 2006-07.
We examined the significant components of this demand, and project that the state’s ten-year
capital outlay needs will total $90.5 billion. This higher forecast is attributable largely to our
assessment that the demand for K-12 and higher education facilities over the ten-year period
will exceed that estimated by the Department of Finance in the CO&I Report. Over and
above this $90.5 billion, we have concluded that the need for transportation capital improve-
ments over the ten years will exceed the projected revenues that will be available by tens of
billions of dollars.
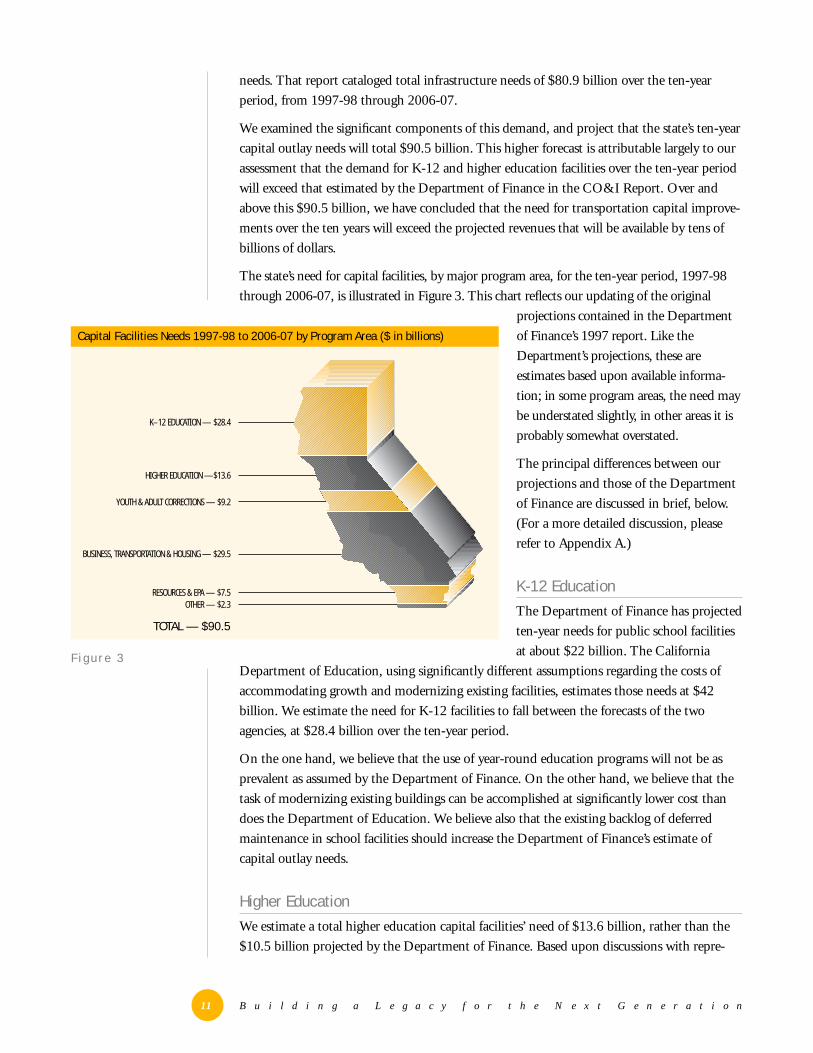
The state’s need for capital facilities, by major program area, for the ten-year period, 1997-98
through 2006-07, is illustrated in Figure 3. This chart reflects our updating of the original
projections contained in the Department
of Finance’s 1997 report. Like the
Department’s projections, these are
estimates based upon available informa-
tion; in some program areas, the need may
be understated slightly, in other areas it is
probably somewhat overstated.
The principal differences between our
projections and those of the Department
of Finance are discussed in brief, below.
(For a more detailed discussion, please
refer to Appendix A.)
K-12 Education
The Department of Finance has projected
ten-year needs for public school facilities
at about $22 billion. The California
Department of Education, using significantly different assumptions regarding the costs of
accommodating growth and modernizing existing facilities, estimates those needs at $42
billion. We estimate the need for K-12 facilities to fall between the forecasts of the two
agencies, at $28.4 billion over the ten-year period.
On the one hand, we believe that the use of year-round education programs will not be as
prevalent as assumed by the Department of Finance. On the other hand, we believe that the
task of modernizing existing buildings can be accomplished at significantly lower cost than
does the Department of Education. We believe also that the existing backlog of deferred
maintenance in school facilities should increase the Department of Finance’s estimate of
capital outlay needs.
Higher Education
We estimate a total higher education capital facilities’ need of $13.6 billion, rather than the
$10.5 billion projected by the Department of Finance. Based upon discussions with repre-
Capital Facilities Needs 1997-98 to 2006-07 by Program Area ($ in billions)
F i g u r e 3
K–12 EDUCATION — $28.4
HIGHER EDUCATION —$13.6
YOUTH & ADULT CORRECTIONS — $9.2
BUSINESS, TRANSPORTATION & HOUSING — $29.5
RESOURCES & EPA — $7.5OTHER — $2.3
TOTAL — $90.5
C a l i f o r n i a B u s i n e s s R o u n d t a b l e12
sentatives of each of the segments of the higher education system, we have concluded that
both the University of California and California State University restricted their projections
to what they believed the state could provide, rather than the level necessary to fund all state-
supportable projects.
Transportation
In its 1997 report, the Department of Finance indicated that there is no accepted methodol-
ogy for making objective judgments about transportation needs without reference to funding
availability. While we concur in that assessment, the lack of a credible projection of funding
necessary to address transportation infrastructure needs remains a significant gap in the
determination of capital investment requirements.
The $27.8 billion that the Department estimated as available for transportation does not
include $850–900 million to be generated by a surcharge on Bay Area bridge tolls that was
enacted in 1997. The addition of these revenues would increase the transportation total to
more than $28.6 billion. But this is only an estimate of the current resources available for
investment in transportation. It is not a strict measure of the capital investment necessary to
accommodate growth in the demand for transportation facilities and maintain existing
facilities over the ten-year period. In short, it is an estimate of the potential supply of capital,
rather than actual demand for investment.
The Department of Finance further noted that anticipated federal and state funding for
transportation capital improvements over the ten-year period will not end current traffic
congestion or prevent it from increasing in the future. Moreover, in 1996, the Commission
on Transportation Investment found that, even if all the projects on the then-current
Regional Transportation Plans were to be constructed, near-gridlock conditions on urban
state highways would double — from 22
percent to 45 percent — by the year 2012.
We concur in these assessments as well. In
fact, we believe the $27.8 billion figure cited
by the Department of Finance may under-
state the amount needed to meet the
demand for transportation capital improve-
ments over the ten-year period by conserva-
tively, $15 billion to $25 billion. (A more-
detailed discussion of transportation needs can be found in Appendix B.)
Substantial new federal transportation funds will become available to fill a portion of this
funding gap. Legislation enacted this spring and known as the Transportation Equity Act for
the 21st Century (TEA 21), will provide California with substantially more federal aid —
possibly as much as $750 million to $850 million annually during the next six years.
This new infusion of federal funds will be substantial and welcome. In addition, for the first
time in several decades, California’s share of nationwide highway spending will stop eroding.
Our 9.2 percent of highway spending nationally will be maintained, although it should be
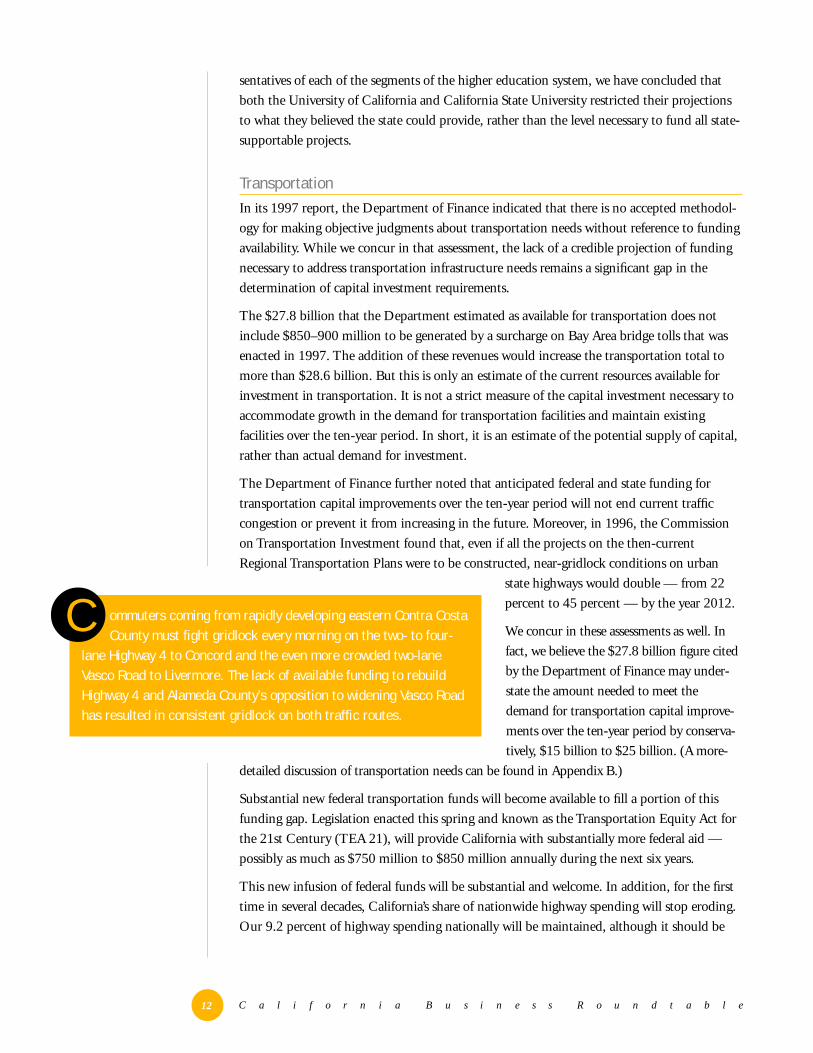
ommuters coming from rapidly developing eastern Contra CostaCounty must fight gridlock every morning on the two- to four-
lane Highway 4 to Concord and the even more crowded two-laneVasco Road to Livermore. The lack of available funding to rebuildHighway 4 and Alameda County’s opposition to widening Vasco Roadhas resulted in consistent gridlock on both traffic routes.
C
B u i l d i n g a L e g a c y f o r t h e N e x t G e n e r a t i o n13
noted that California motorists currently contribute 10.1 percent of all payments to the
federal Highway Trust Fund.
Therefore, while the long-term funding outlook for transportation finance is troubling, the
availability of cash in the near term is likely to be very good. Unfortunately, the inability of
state highway officials to contract out for highway design and engineering services means that
this available cash will accumulate while communities wait for the state to prepare new
projects for delivery. It is anticipated that by the end of 1999, as much as $3 billion will have
accumulated in CalTrans reserve accounts because of the inability to move projects from the
design stage to the field.
The primary cause for this bottleneck is the ongoing, successful litigation by the union
representing professional engineers. They have found protection in the state Constitution
from efforts by the Administration to implement a state law that authorizes the contracting
out of design and engineering services. Fortunately, local governments and transportation
agencies are not constrained by this constitutional provision, and Proposition 224, which was
sponsored by the same union with the intent of subjecting local agencies to this constraint,
was overwhelmingly defeated by the voters.
Even with adequate highway construction funding available in the short-term, the state will
be unable to deliver projects promptly if it is limited to using state-employed highway design
and engineering staff. Over the long term, that means that the cost of highway construction
will increase as long as design and engineering delays are endemic to the system.
The Magnitude of the Imbalance
The magnitude of the funding imbalance becomes apparent when the $90.5 billion in
identified needs is weighed against the revenues available to cover them. The Department’s
projection of funding sources included approximately $900 million for projects supported by
existing bond funds. The Department further identified $30.8 billion in potential financing
from federal and special sources that are not part of the General Fund. These included:
■ federal transportation funds ($10.5 billion);
■ state gas tax and toll bridge revenues ($15.7 billion);
■ special funds for resources and the environment ($2.8 billion); and
■ federal funds for housing, corrections, veterans homes, and other miscellaneous programs
($1.8 billion).
Following the release of the Department’s 1997 CO&I Report, legislation was enacted to
institute a one dollar toll surcharge on the seven state-owned toll bridges in the Bay Area. That
will generate $850–900 million over the next seven years for seismic retrofits of the toll bridges.
The addition of these surcharge revenues brings the total of identified funding available to
finance the state’s needs for capital projects over the next ten years to $32.6 billion.
Reliance upon all of these sources, however, would still leave the state with a net balance of
unmet demand over the ten-year period amounting to $57.9 billion. This projection illus-
trates the dimensions of the challenge facing the state; it is a Herculean task to balance a need
of this magnitude.
The state
cannot bond its
way out of this
imbalance in
a prudent
manner.
C a l i f o r n i a B u s i n e s s R o u n d t a b l e14
If the state attempted to finance the entire $57.9 billion on a pay-as-you-go basis, it would
require nearly $6 billion per year in new General Fund spending. Even with the most
optimistic projections of revenue growth, such a feat could be accomplished only with a
combination of massive tax increases and reductions in existing operating budgets.
By the same token, if the state were to issue some combination of general obligation (GO)
and lease revenue bonds to redress all of this imbalance, the share of the State’s General Fund
devoted to debt service would be unacceptably high — in the range of eight percent. This
volume of debt would seriously erode California’s credit-rating, and adversely affect our
access to the financial markets. Clearly, the state cannot bond its way out of this imbalance in
a prudent manner.
In the current fiscal year, the state’s debt service on G.O. bonds and lease revenue bonds
supported by General Fund appropriations is approximately $2.25 billion, or about 4.1
percent of General Fund revenues for the year. This 4.1 percent debt service ratio represents a
substantial decline from debt service levels of the mid-1990s, primarily due to significantly
stronger General Fund revenue growth and relatively stable debt service payments.
While there is no universally accepted measure of the right level of state debt service, most
credit analysts consider state debt ratios up to six percent to be acceptable, provided the state
is addressing its most critical needs in a prudent manner. California’s current 4.1 percent debt
ratio places it in the moderate range of long-term debt financing among the fifty states.
The 1997 Department of Finance report estimated that up to $20.2 billion of new, General
Fund-supported debt could be issued over the
ten-year period to finance needed infrastruc-
ture without exceeding a debt ratio of six
percent. This estimate was based upon the
Department’s then-current General Fund
revenue forecast. Using the Department’s
updated — and more robust — revenue
growth forecast for fiscal years 1997-98 and
1998-99, we project that the state could
authorize and issue at least $25.3 billion in
new debt over the ten-year period without
exceeding a six percent debt service ratio.
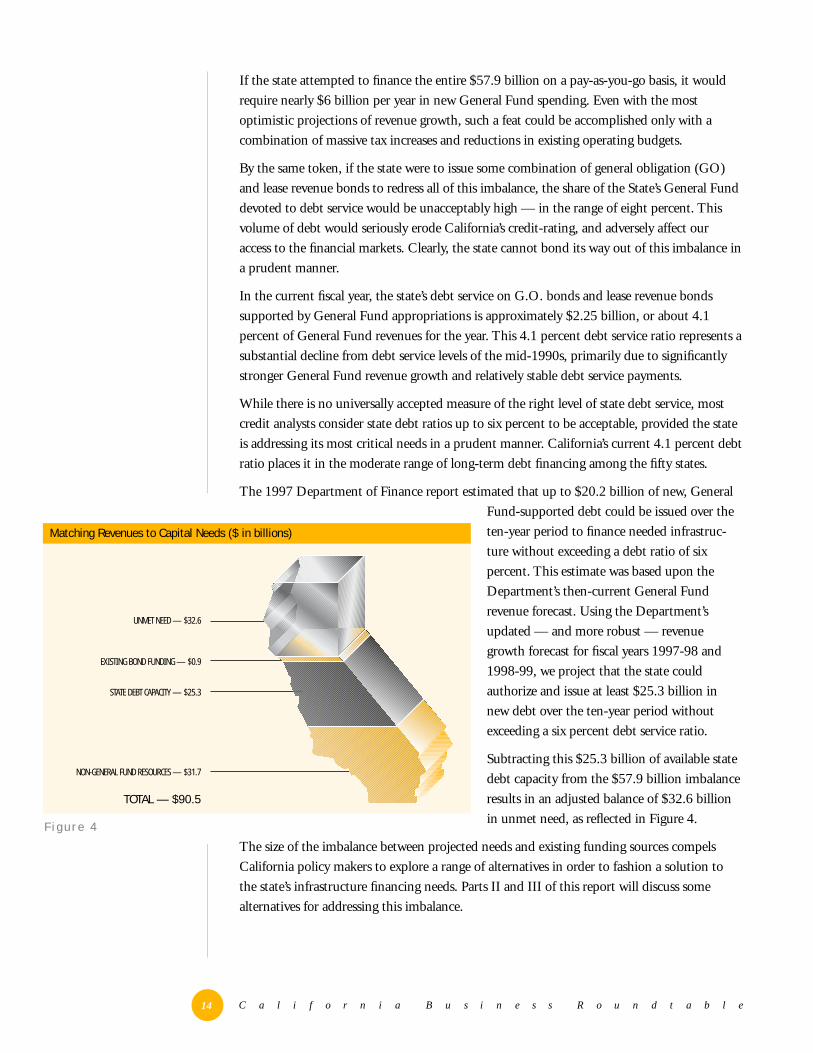
Subtracting this $25.3 billion of available state
debt capacity from the $57.9 billion imbalance
results in an adjusted balance of $32.6 billion
in unmet need, as reflected in Figure 4.
The size of the imbalance between projected needs and existing funding sources compels
California policy makers to explore a range of alternatives in order to fashion a solution to
the state’s infrastructure financing needs. Parts II and III of this report will discuss some
alternatives for addressing this imbalance.
Matching Revenues to Capital Needs ($ in billions)
F i g u r e 4
UNMET NEED — $32.6
EXISTING BOND FUNDING — $0.9
STATE DEBT CAPACITY — $25.3
NON-GENERAL FUND RESOURCES — $31.7
TOTAL — $90.5

B u i l d i n g a L e g a c y f o r t h e N e x t G e n e r a t i o n15
As illustrated in Part I of this report, in the absence of any fiscal or policy changes, the state
will face a persistent and significant imbalance in its ability to meet pressing infrastructure
needs over the next ten years. Part II will examine two options available to the state which
would demonstrably improve the state’s ability to finance essential capital facilities.
Splitting the Costs for K-12
Over the past ten years, just under one-half of the funding for local K-12 school district
facilities has come from local sources, primarily in the form of local general obligation bonds,
developer fees, and special taxes levied pursuant to the Mello-Roos Community Facilities Act
of 1982. School districts’ decisions to implement a year-round calendar in order to use their
facilities in a more efficient manner also have contributed to the mix of local funding
options.
Under the terms of the school facilities financing reform package proposed by Governor
Wilson as part of his 1998-99 Budget, local school districts would assume a full 50 percent
share of the costs of new school construction and modernization. In order to assist districts in
meeting this requirement, Governor Wilson also proposed amending the state Constitution
to reduce the vote required for approval of local K-12 general obligation bonds from the
current two-thirds threshold.
If all of the projected $28.4 billion in ten-year K-12 facilities costs were to be financed on the
basis of a 50 percent local match, the state’s share of the costs for such facilities would drop
to $14.2 billion.
We estimate that local general obligation bonds could reasonably provide roughly one-third
of total state and local funding for K-12 needs over the ten-year period, given the 50-50
state-local cost sharing formula under consideration by policy makers. This one-third share
compares with approximately 28 percent of total state and local K-12 facilities funding which
has come from local G.O. bonds over the past ten years at the two-thirds approval threshold
required at present.
The recent trend toward higher approval rates for local G.O. bonds for schools, even with
the current two-thirds vote requirement, bodes well for local districts’ ability to achieve this
level of funding. Obviously, if the vote requirement for approval of local general obligation
Pa r t I I
Expanding Our Resources
If all of the
projected $28.4
billion in ten-year
K-12 facilities costs
were to be financed
on the basis of a
50 percent local
match, the state’s
share of the costs
for such facilities
would drop to
$14.2 billion.

C a l i f o r n i a B u s i n e s s R o u n d t a b l e16
bonds were reduced, as proposed by
Governor Wilson and a number of
other policy makers and supported by
the California Business Roundtable,
this level of local G.O. bond funding
would be easier to generate.
Figure 5 shows the local revenue
sources which K-12 school districts
relied upon over the past ten years,
and a hypothetical mix of local
financing sources which districts
could use over the next ten years to
meet a full 50 percent local match on
facilities construction, modernization
and deferred maintenance costs.
Recommendation: The legislatureshould adopt Governor Wilson’sproposed 50 percent local matchrequirement for the costs of K-12facilities. Such a requirement notonly is equitable, but also is achiev-able by local school districts, evenwith the adoption of caps ondeveloper fees.
Pay-As-You-Go Financing
Over the past ten years, the State
General Fund has been used only
sparingly as a source of pay-as-you-go
financing for new projects. Because of
the large initial outlay required for
pay-as-you-go financing, it can
displace funding for other critical
programs, particularly in periods of severely constrained budgets, such as were experienced in
the first half of this decade. Consequently, direct appropriations from the General Fund,
along with funding from the Special Account for Capital Outlay which has been merged into
the General Fund, over the prior ten years averaged less than $50 million per year.
The dramatic improvements in the state of the economy and state government’s fiscal
condition, however, provide an opportunity to increase significantly direct General Fund
appropriations for infrastructure. Committing increased General Fund resources for pay-as-
you-go financing would permit the state to undertake time-sensitive capital projects in the
most expeditious manner and at the lowest overall cost.
F i g u r e 5
Local Revenue Sources for K-12 Facilities ($ in billions)
DEVELOPER FEES — $2.5
LOCAL G.O. BONDS — $5.9
SPECIAL TAX/MELLO ROOS — $0.8
MULTI-TRACKYEAR-ROUND SAVINGS — $1.2
PAST 10 YEARS
DEVELOPER FEES — $3
LOCAL G.O. BONDS — $9.2
SPECIAL TAX/MELLO ROOS — $0.8
MULTI-TRACKYEAR-ROUND SAVINGS— $1.2
HYPOTHETICALNEXT10 YEARS

B u i l d i n g a L e g a c y f o r t h e N e x t G e n e r a t i o n17
1997-98 1998-99 1999-00 2000-01 2001-02 2002-03 2003-04 2004-05 2005-06 2006-07 2007-08
If State General Fund revenues were to grow at a modest five percent annual rate over the
ten-year period, California’s General Fund budget would increase from $54.6 billion in
1997-98 to $89 billion in 2007-08. This growth would generate cumulative new resources,
above base 1997-98 revenues, of more than $175 billion.
Dedicated Revenue Source
The most obvious means of increasing the amount of funding available for pay-as-you-go
financing is to develop a new revenue stream dedicated to capital facilities financing. This
could be accomplished either by increasing the stream of state revenues — i.e., a tax increase
— or by earmarking a portion of the existing stream of state revenues for infrastructure
financing.
The former option is of questionable economic soundness. The latter option is achievable.
The legislature could dedicate a specific amount of existing General Fund revenues, such as a
flat $1 billion per year for ten years; or a specific portion of the existing revenue stream, such
as a fixed percentage of the state’s share of the sales tax, could be set aside for pay-as-you-go
financing.
For example, if one-quarter cent of the existing state sales tax were to be earmarked within
the General Fund revenue stream, it would generate $11.8 billion — out of cumulative
General Fund revenues of $722 billion over the ten years — that could be dedicated for pay-
as-you-go financing.
Figure 6 shows General Fund revenues over the ten-year period, based upon a five percent
annual rate of growth, adjusted for the effects of the phase-in of the tax cut enacted in the
first year of the 1997-98 legislative session. Figure 6 also displays the effect on General Fund
revenues if a quarter-cent of the sales tax were taken out of the revenue stream.
Projected General Fund Revenue Growth 1997-98 to 2007-08 ($ in billions)
DEDICATED SALES TAX REVENUE
NET NEW REVENUE ABOVE 97-98 BASE
BASE GENERAL FUND REVENUES
$54.6
$2.3 $4.6 $7.6 $10.7 $14.0 $17.4 $21.0 $24.8 $28.7 $32.9
F i g u r e 6
$0.94 $0.98 $1.03 $1.09 $1.14 $1.20 $1.26 $1.32 $1.39 $1.45

C a l i f o r n i a B u s i n e s s R o u n d t a b l e18
As Figure 6 makes clear, such a dedication of sales tax revenues would reduce overall General
Fund revenues only marginally — by 1.63 percent — over the ten years, while generating a
sizable source of funding for public works. Yet even with a quarter-cent of the state’s sales tax
revenues dedicated for pay-as-you-go capital outlay, California would continue to face an
imbalance in its ability to satisfy all of the estimated demand for new public financing over
the next ten years.
Recommendation: California should dedicate one-quarter cent of the state sales tax forpay-as-you-go infrastructure financing. This could be accomplished by passage of a stateconstitutional amendment that would remain in effect for a fixed period — say ten years— so that the public could review its effects before deciding whether to continue it.Such a dedication of revenues would generate $11.8 billion for infrastructure projectswhile reducing total General Fund resources over the ten years only marginally, by1.63 percent.
If State General Fund
revenues were to grow
at a modest five percent
annual rate over the
ten-year period,
this growth would
generate cumulative
new resources, above
base 1997-98 revenues,
of more than
$175 billion.

B u i l d i n g a L e g a c y f o r t h e N e x t G e n e r a t i o n19
Under even the most optimistic scenarios, California will continue to face an imbalance in its
ability to satisfy all of its identified needs for new capital facilities over the next ten years and
into the foreseeable future. Almost inevitably, the state will be forced to make choices
regarding the relative importance and priority of the competing demands for capital invest-
ment. There are, however, a number of policy options available to the state that would
enhance its ability to provide needed capital facilities in the most cost-efficient manner.
Part III of this report will focus on several of these policy options. This is not intended to be
an exhaustive listing of options, nor
does it presume that, if each were to be
implemented, the state would be able to
undertake and complete every one of its
identified infrastructure projects.
Rather, it is intended to illustrate a
range of options which, along with
other innovative techniques, would
maximize the state’s ability to meet
essential infrastructure needs in the
most timely and cost-efficient manner.
School Construction
The California Business Roundtable has
supported efforts by the Governor and
members of the legislature to fashion a
comprehensive school facilities
financing reform proposal. The key elements of this package include:
■ Placing billions of dollars of state general obligation bonds on the ballot;
■ Capping developer fees and repealing court decisions that permit extra levies. Higher fees
would be permitted only under extraordinary circumstances;
■ Limiting the state contribution to one-half of the total costs of new construction, mod-
ernization and deferred maintenance; and
■ Basing the state contribution for school facilities on the number of students, rather than
cost of construction.
Pa r t III
Innovations Bridge the Gap
Revising the Match of Revenue to Capital Needs ($ in billions)
F i g u r e 7
UNMET NEED — $6.6
LOCAL MATCH FOR K–12 FACILITIES —$14.2
DEDICATED STATE SALES TAX — $11.8
EXISTING BOND FUNDING — $0.9
STATE DEBT CAPACITY — $25.3
NON-GENERAL FUND RESOURCES — $31.7
TOTAL — $90.5

C a l i f o r n i a B u s i n e s s R o u n d t a b l e20
Reducing the vote threshold for passage of local K-12 general obligation bonds, which has
been supported by the California Business Roundtable, has also been under consideration.
While these reform elements focus on the resources available for school construction, new
revenues alone are not the only way to address the demands which will be placed on the system
by the projected 100,000 student-per-year growth in enrollment. In addition, school districts
should look to partnerships with residential
developers to provide high-quality, lower-cost
schools that combine the best elements of
modular construction and economies of scale.
For example, in most cases, relocatable
classrooms can be retrofitted on-site to meet
or exceed the structural and architectural
standards applicable to stick-built facilities.
Such retrofitted classrooms are similar to
traditional classrooms in appearance, durabil-
ity, life span, and aesthetics. This approach also can be applied to such core facilities as laborato-
ries, multi-purpose rooms, restrooms, food service facilities, and gymnasiums.
Cost savings can be substantial. Compared with the state allowable costs for grades K-12, on-
site retrofitting of relocatable structures can produce savings of approximately:
■ $2.3 million, or 35 percent of the non-land costs, for elementary schools;
■ $4 million, or 29 percent of the costs of middle schools; and
■ $8 million, or 28 percent of the costs of high schools.
Most efficiencies are gained in the standardization of the facilities; materials, architectural
fees, and some governmental fees are substantially discounted. In many instances, housing
developers can design, build, and transfer schools to local districts for two-thirds of the cost
of the current state program.
Recommendation: The state should encourage innovations such as developer design,build and transfer agreements. State allowable school costs should be reduced to reflectthe ability to provide adequate new school facilities at lower cost.
State Infrastructure Bank
Another innovative approach to capital facilities financing is the California Infrastructure and
Economic Development Bank. The Infrastructure Bank was created by the legislature in 1994,
and given broad authority to provide financing to public agencies — and in some instances
private developments — for infrastructure that supports economic development projects.
While the California Infrastructure Bank has tremendous potential, it has been underutilized
since its creation because it was not provided with any seed capital. This may change,
however, in the near future: Governor Wilson has proposed a $150 million General Fund
appropriation in his 1998-99 Budget to capitalize the Bank.
n the summer of 1995, the Castro Valley Unified School Districtopened the first privately-built and financed school in California
to be turned over to a school district upon completion. It wasdesigned in partnership with the Castro Valley Unified SchoolDistrict and tailored to the district’s needs. It meets or exceeds allstate guidelines, but costs 22 percent less. The school was builtentirely with private funds by Shappell Industries in lieu of thedeveloper paying school fees.
I

B u i l d i n g a L e g a c y f o r t h e N e x t G e n e r a t i o n21
In order to maximize the assistance that can be offered with its available capital, the Bank
typically will not provide direct funding, but will instead use that capital to leverage addi-
tional public or private investment. Financing methods could include loan guarantees or
insurance, the issuance of pooled bonds, or other techniques which lower the overall costs of
borrowing or enhance the credit-worthiness of local projects.
The Infrastructure Bank has a variety of creative financing tools at its disposal to encourage
economic development:
■ State Revolving Funds. Several states have developed leveraged state revolving funds to
assist local infrastructure projects. Under this financing method, state funds — from an
appropriation or the sale of state bonds — are used as security for local revenue bonds,
either as reserve funds pledged to the bonds or through loans made to borrowers that are
then pooled as security for the bonds. The first method is most efficient when there are a
small number of borrowers; the second works best if there are a larger number of borrow-
ers but none of them dominates the program.
■ Bond Bank. Under the bond bank approach, the Bank would provide capital financing
through the issuance of pooled long-term debt. In this kind of activity, the Bank would
provide credit enhancement or additional security — such as loan guarantees, bond
insurance, or letters of credit — for debt secured by project revenues.
■ Standby Lines of Credit. The Bank could guarantee a project by providing a standby line
of credit to finance shortfalls in project operating revenues. The federal government
provided this type of credit for Orange County’s Foothill-Eastern Transportation Corridor
Toll Road.
■ Loan Guarantees. The virtue of loan guarantees is their simplicity: The Bank places its
funds in a trust and guarantees loans made by a third party, in much the same manner as
the U.S. Small Business Administration guarantees loans to small businesses made by
commercial lenders. The amount of leverage available in a loan guarantee program is
determined by the credit standards applied to potential projects.
■ Rate Reduction Bonds. The Bank already has issued more than $6 billion in bonds to
finance the transition costs of investor-owned utilities in the restructuring of the electric
utility industry.
The determination of which financing tool to employ is based upon the application of sound
financial practices to the particulars of each project.
A number of other states have employed financing mechanisms similar to those available to
California’s Infrastructure Bank to finance public facilities and encourage economic development.
Illinois. The Build Illinois Public Infrastructure Program provides low-interest financing to
local governments for public improvements on behalf of business expansions or relocations.
New York. The Regional Economic Development Partnership Program finances capital projects
that foster business development. Eligible projects include basic drainage and sewer systems,
access roads and sidewalks, docks and wharves, water supply systems, and site preparation.
While the California
Infrastructure Bank
has tremendous
potential, it has been
underutilized since its
creation because it
was not provided with
any seed capital.

C a l i f o r n i a B u s i n e s s R o u n d t a b l e22
Pennsylvania. The Pennsylvania Infrastructure Investment Authority (PENNVEST)
provides low-interest loans and limited grant assistance to local communities for financing
sewage and drinking water facilities.
Washington. The Community Economic Revitalization Board finances local public infra-
structure improvements required for private sector development. Eligible projects include
access roads and sewer and water facilities.
In California, the Federal Highway Administration has given its approval for the Bank to use
$100 million in advance construction credits to leverage private toll road construction. While
no new funds actually will be placed in the Bank, the state can, in effect, pledge up to $100
million in future federal highway subventions to provide credit enhancements for privately
funded transportation projects. Federal officials have approved and extended the authority
for this transportation function of the Infrastructure Bank. However, the national securities
rating agencies will provide the highest credit rating only if state legislation is passed clarify-
ing the enforceability of the agreements entered into by the Bank. The Wilson Administra-
tion has drafted statutory language on this subject and is seeking a legislative vehicle for it.
Recommendation: The state should capitalize the California Infrastructure and EconomicDevelopment Bank and should explore all available options for using the Bank to leveragepublic and private investment in public infrastructure.
Entrepreneurial Partnerships
By far, the largest unaddressed need for public facilities is in the transportation sector. Our
review suggests that it is reasonable to estimate that the true need for new transportation
investment over the next ten years is two to three times the amount noted by the Depart-
ment of Finance in its CO&I Report. Since adequate general tax revenues simply are not
sufficient to support such expenditure levels, and massive new taxes are unlikely to be
approved, alternative approaches must be given serious consideration by state policymakers.
One such approach is increased public-private collaboration — or so-called entrepreneurial
partnerships — to finance and build new capital facilities. Such partnerships could be
particularly effective in the financing and construction of new highways and bridges, and
even port and airport facilities and transit systems.
The key consideration in such partnerships is to identify those projects or mechanisms that
increase the flow of capital to infrastructure needs or deliver such facilities more efficiently.
For example, a highway project that fills an identified need, and that otherwise would not be
financed by public sources in a timely fashion would be a candidate for an entrepreneurial
partnership. On the other hand, a water treatment project financed by user fees would not be
a high priority for this kind of undertaking if those user fees were roughly the same irrespec-
tive of whether the project was owned or operated by the public or private sector.
Clearly, the public policy focus must be on those projects which make public dollars go
further. In that respect, the effort should be to identify opportunities for partnerships that
allow the state to meet a need that it otherwise could not meet or that it could not meet in as
timely a fashion or as inexpensively through public effort alone.
Clearly, the
public policy focus
must be on those
projects which
make public dollars
go further.

B u i l d i n g a L e g a c y f o r t h e N e x t G e n e r a t i o n23
Private sector provision of public infrastructure has been successfully implemented in a
variety of contexts and locations throughout the world. Transportation projects have been the
most frequent subject of these partnerships, although many other public facilities have been
built and operated by private investors. Notable experiences with such enterprises include:
Australia. Prompted by rapid population growth from immigration, and faced with severe
fiscal constraints brought on by the recession of the early 1990s, the Australian state of New
South Wales has successfully worked with private investors to construct a number of capital
facilities. To date, two toll motorways, a tunnel under the Sydney harbor, a rural sewer
system, and even a prison have been built. The government of New South Wales has used a
variety of ownership and financing arrangements to accomplish these projects.
Germany. In Germany, the move toward private financing of public facilities was prompted
in large part by the need to upgrade the decrepit infrastructure in the territory of the former
German Democratic Republic. The situation was exacerbated by the severe budget pressures
that reunification placed on the nation’s economy and public budgets.
While the German constitution places the responsibility for providing infrastructure with the
government, German federal authorities have made a distinction between that responsibility
and the management and financing of these projects. Germany is experimenting with a
variety of leasing arrangements for highways and other critical facilities.
United Kingdom. The United Kingdom has successfully found private capital for the con-
struction of some river and estuarial crossings at almost no cost to the public sector. These
crossings have succeeded in large part
because the free alternatives are lengthy,
time-consuming detours. On the other
hand, privately financed motorway projects
have been less successful, because of the
lengthy permitting typical of new road
construction.
California has limited, but not insignificant
experience with entrepreneurial partner-
ships in the transportation area. Assembly
Bill 680 (Baker, Chapter 107, Statutes of
1989) authorized CalTrans to grant
franchises for the construction and operation of four privately owned toll roads in California:
■ State Route (SR) 91 in Orange County is open and operating.
■ SR 125 in San Diego County near the California-Mexico border is in development and
undergoing environmental review.
■ SR 57, the Santa Ana Viaduct, is in development in Orange County.
tate Route 91, running through Orange County, is one of fourpilot projects for toll roads authorized by the Legislature in
1989. It was financed by California Private Transportation Co., apartnership of United Infrastructure and Cofiroute, a French com-pany. The companies are authorized to collect tolls for 35 years,when the state takes ownership. Law enforcement and road mainte-nance is provided by state agencies but paid for by the company.Early reports show that the variable toll lanes have decreasedcongestion and are enjoying a high approval rating from localcommuters.
S
C a l i f o r n i a B u s i n e s s R o u n d t a b l e24
The fourth franchise, awarded for the construction of a toll road in Northern California, is
inactive, and the project effectively dead due to local opposition and financial infeasibility.
Federal law permits states to use a portion of their federal highway funds to match private
capital on state highway routes, thereby encouraging states to seek the participation of private
capital as a supplement to state, local and federal resources. California statutes, however,
prohibit the use of any state funds for toll facilities, effectively removing any profit opportuni-
ties for private investors.
Recommendation: Impediments in state law to the development of privately funded tollroads, highways and bridges should be removed. State highway funds should be madeavailable to match private funds in the development of privately built and operatedtransportation facilities. In addition, state policy makers should aggressively exploreopportunities to expand the state highway system and other state and local public capitalfacilities through other entrepreneurial partnerships.
Ten-Year Capital Facilities Plan
The principal deficiency in the state’s existing capital planning process is the absence of any
consideration or formal adoption of a capital expenditure plan by the legislature. The
Department of Finance produces an annual Capital Outlay and Infrastructure Report, which
provides a credible ten-year capital facilities needs assessment, and which attempts to match
funding sources to needs. There is, however, no requirement that the legislature give formal
consideration to this or any other assessment.
As a consequence, the legislature continues to consider the state’s capital facility needs in a
long-term fiscal and policy vacuum. With no overall plan to prioritize the state’s most
important infrastructure needs and identify a financing strategy, policymakers are left to
consider capital expenditure proposals on an ad hoc basis, with little or no knowledge of how
those proposals affect the state’s ability to meet its longer-term infrastructure priorities.
Given the enormous infrastructure needs facing the state over the next ten years, and the
inability of the state to satisfy every one of those needs under even the most optimistic of
circumstances, it is essential that the state’s financing efforts be directed to the highest
priority needs.
Recommendation: State policy makers should undertake a comprehensive review ofCalifornia’s capital facilities needs over the next ten years, establish a clear set ofpriorities and adopt an annual plan for financing those priorities over the ten year period.
The legislature
continues to consider
the state’s capital
facility needs in a
long-term fiscal and
policy vacuum.

B u i l d i n g a L e g a c y f o r t h e N e x t G e n e r a t i o n25
Methodology To Update Estimates
Following is a detailed description of the methodology used to update the estimates from the
Department of Finance’s 1997 Capital Outlay and Infrastructure Report.
K-12 Education
The Department of Finance projected ten-year K-12 infrastructure needs of $22 billion. On
the other hand, the California Department of Education estimates total K-12 infrastructure
needs over the ten years at $42 billion.
Our analysis indicates that the total K-12 facilities demand falls somewhere in between these
two estimates. We forecast the need for K-12 facilities will total $28.4 billion over the ten-
year period, $6.4 billion higher than that projected by Finance. The principal factors
contributing to this increased estimate are outlined below:
In its forecast of the demand for new K-12 facilities to accommodate enrollment growth, the
Department assumed that all K-12 growth would occur in districts operating on a multi-
track year-round education (MTYRE) calendar. On the other hand, we started with the
premise that all growth would occur in districts operating on a traditional calendar. This
accounts for $2.3 billion of the total $6.4 billion. We made this adjustment to the
Department’s forecast for two reasons:
■ First, we think it is unreasonable to expect that every district will move to MTYRE to
accommodate all new enrollment growth; and
■ Second, we see MTYRE primarily as a cost avoidance strategy to be employed by local
districts as they deem appropriate. Consistent with this approach, we reflect the estimated
value of MTYRE as a local funding contribution in the sources of funding section.
In its estimate of the costs of modernizing existing, aging K-12 facilities, Finance utilized a
replacement cost standard of 25 percent . Our analysis indicates that, in order to extend the
useful life of existing facilities and to incorporate the improvements necessary to accommo-
date the increased use of educational technology, a 30 percent of replacement cost standard
yields a more accurate reflection of capital needs. This difference — 30 percent of replace-
ment value versus 25 percent — accounts for $2.65 billion of the total $6.4 difference in
projections. It should be noted that the California Department of Education estimates the
cost of modernizing existing school facilities at 50 percent of replacement value.
A p p e n d i x A

C a l i f o r n i a B u s i n e s s R o u n d t a b l e26
The Department of Finance estimates the costs of deferred maintenance at $3.6 billion,
based upon the existing state matching program for deferred maintenance, which is limited
to one-half of one percent of a district’s general fund. Our analysis indicates that, under the
limitations of the existing state matching program, the problem of deferred maintenance is
becoming worse rather than better over time. The Coalition for Adequate School Housing
(CASH), an advocacy group promoting increased funding for public school construction,
estimates K-12 school districts’ deferred maintenance costs over the period at $5 billion, and
the Department of Education estimates these costs at $6 billion. On balance, we believe that
the $5 billion estimate is a reasonable figure, given the existing backlog of deferred mainte-
nance in school facilities.
Higher Education
As is the case with K-12 facilities needs over the ten-year period, our analysis indicates that
the costs of higher education capital outlay will exceed that projected by the Department
in its 1997 CO&I Report. We estimate a total higher education capital facilities need of
$13.6 billion, rather than the $10.5 billion projected by the Department, an increase of
$3.1 billion. Our estimate of these higher costs is based upon discussions with representatives
of each of the segments of the higher education system and reflects the fact that:
As was noted by the Department in the 1997 CO&I Report, in reporting its capital outlay
needs, the University of California restricted its projection to what it believed the state could
provide ($2 billion), rather than the level necessary to fund all state-supportable projects
($3.9 billion);
Similarly, the California State University under-reported its capital outlay needs by restricting
the amount it reported to $3.5 billion, rather than the $4.8 billion required to fund all state-
supportable capital projects over the ten-year period.
Transportation
In its 1997 CO&I Report, the Department of Finance indicated that there is no accepted
methodology for making objective judgments about transportation needs without reference
to funding availability. We concur in that assessment.
Consequently, the $27.8 billion estimate included in the 1997 CO&I Report, as noted by
the Department, is an estimate of the resources available for transportation system invest-
ment. It is not a strict assessment of the capital investment necessary to accommodate growth
in the demand for transportation facilities and maintain existing facilities over the ten-year
period. In short, the $27.8 billion is an estimate of supply rather than demand. The Depart-
ment further noted that anticipated funding for transportation capital improvements over
the ten-year period will not end current traffic congestion or prevent it from increasing in the
future. We concur in this assessment, as well. In fact, we believe this number could be short
of the amount needed to meet the demand for transportation capital improvements over the
ten-year period by tens of billions of dollars. (See Appendix B.)

B u i l d i n g a L e g a c y f o r t h e N e x t G e n e r a t i o n27
Late in the 1997 legislative session, after the release of the Department’s 1997 CO&I Report,
Governor Wilson and the legislature reached agreement on a plan to bring all state-owned
toll bridges up to current seismic standards. The plan contemplates the replacement of the
eastern span of the San Francisco-Oakland Bay Bridge and completion of all necessary
seismic retrofit work on other state-owned toll bridges over a seven-year period, at an
estimated cost of $2.6 billion. This $2.6 billion estimate is $1 billion greater than the
amount estimated for toll bridge seismic retrofit in the 1997 CO&I Report.
The agreement, embodied in Senate Bill 60 (Kopp, Chapter 327, Statutes of 1997), SB 226
(Kopp, Chapter 328), and Assembly Bill 1302 (Wayne, Chapter 777), includes a $1 toll
surcharge on the seven state-owned toll bridges in the Bay Area, beginning January 1, 1998.
This toll increase is expected to generate nearly $850–900 million over the first seven years it
is in place. After this seven-year period, the toll surcharge may be continued for up to an
additional three years to cover Bay Bridge construction cost overruns and design amenities,
such as an overhead cable suspension, bicycle lanes, or improvements to the San Francisco
Transbay Terminal.
The additional revenues generated by this new surcharge for toll bridge seismic retrofit brings
the total resources available to finance transportation infrastructure projects over the ten-year
period to more than $28.6 billion. The remainder of the funding for toll bridge seismic
retrofit will be provided from existing highway and toll bridge funding sources.

C a l i f o r n i a B u s i n e s s R o u n d t a b l e28
Defining Transportation Needs and Local Capacity
The Department of Transportation (CalTrans) does not have a published document outlin-
ing transportation needs beyond the scope of the adopted State Transportation Improvement
Plan (STIP). The STIP is predicated largely on available resources, and forms the basis of the
ten-year, $27.8 billion need described in the Department of Finance’s Capital Outlay &
Infrastructure Report.
Nevertheless, in 1996, the Commission on Transportation Investment, created by the
Secretary of the Business, Transportation and Housing Agency, examined the impact on
levels of congestion of completion of all of the projects on the then-current Regional Trans-
portation Plans. The Commission found that, even if all the projects were to be constructed,
near-gridlock conditions on urban state highways would double — from 22 percent to 45
percent — by the year 2012.
Moreover, CalTrans has conducted an internal exercise that examines the needs of the system
over twenty years. This analysis, known informally as Long Range System Planning to
Achieve Corridor Concepts, is neither constrained by the anticipated availability of revenues
nor is a pie-in-the-sky listing of every interest group’s preferred projects. Because the Long
Range System Planning document looks only at the need, unconstrained by the availability
of resources to accommodate those needs, it provides a useful snapshot of the magnitude of
the need for transportation capital improvements over the long-term.
Demand-Generated Needs
This document estimates a 20-year cost of more than $150 billion to meet the demand-
generated needs for transportation capital improvements. Of this $150 billion amount,
approximately:
■ 80 percent, or $120 billion, would be needed for traditional STIP-type projects, so-called
hard projects such as capacity improvements, safety improvements and congestion
management;
■ ten percent would be needed for non-capital operations, support, and tort liability; and
■ ten percent would cover capitalized operations and maintenance, highway and bridge
rehabilitation, and inter-city rail.
Not included in this figure is some $20 billion estimated to be needed to implement plans
for a high-speed rail system in California.
A p p e n d i x B
B u i l d i n g a L e g a c y f o r t h e N e x t G e n e r a t i o n29
In the view of CalTrans staff, this level of investment would improve overall system reliability
and mobility over time, after taking population and economic growth into account. Im-
provement in urbanized areas, however, could be characterized only as preventing further
deterioration in system performance. The projected improvement in service levels in subur-
ban and rural areas would be somewhat more significant.
On the basis of this analysis, even if one looks only at the hard project numbers, and reduces
them by one-half to cover a ten-year horizon, the resulting capital facilities need is approxi-
mately $60 billion, or more than double that enumerated in the Department of Finance’s
CO&I Report.
Assessing Local Transportation Financing Capacity
In the 1980s, transportation advocates envisioned county sales tax overrides as an integral
component of the long-term infrastructure finance solution. To date, eighteen counties,
representing about three-quarters of the state’s population, have passed half-cent sales tax
overrides for transportation purposes. This revenue source provides more than $1.5 billion in
new funds statewide every year, and has been instrumental in the financing of innumerable
transportation system improvements within these so-called self-help counties.
Looking forward, however, reliance upon local sales tax overrides as a significant source of
funding for transportation capital improvements appears to be significantly more problem-
atic for at least two reasons:
■ Most of the revenues from the existing local sales tax overrides are pledged for debt service
on bonds that financed improvements which have already been constructed or are nearing
completion. These revenues, therefore, are not available at this time to finance future
improvements; and
■ In a 1995 ruling, Santa Clara Transportation Authority v. Guardino, the California Su-
preme Court held that such tax overrides constitute special taxes, and as such, are subject
to Proposition 62’s two-thirds vote requirement for special taxes. Prior to the Guardino
decision, local sales tax overrides for transportation were subject to majority voter ap-
proval. Proposition 218, approved by the voters in November 1996 further clarified the
two-thirds vote requirement.
At first blush, the effects of the Court’s action may not seem so significant on transportation
capital finance since it does not invalidate previously adopted local tax measures. Most of the
existing local measures will expire between 2002 and 2010, however, and reauthorization will
require a two-thirds vote. Of the eighteen override measures adopted for transportation to
date, only seven received more than 60 percent of the vote; and only two were approved by a
two-thirds vote.

C a l i f o r n i a B u s i n e s s R o u n d t a b l e30
A c k n o w l e d g e m e n t s
The California Business Roundtable wishes
to thank the following organizations and
individuals for their efforts in the preparation
of this report and its recommendations.
P r i m a r y D r a f t e r s
Metropolitan West Securities
Russ Gould
Lyle Defenbaugh
Polis Group – Kahl/Pownall Companies
Loren Kaye
G r a p h i c D e s i g n
Marketing by Design
Della Gilleran
Joel Stinghen
E d i t i n g a n d P r e s e n t a t i o n
Burson-Marsteller
Gwyn Bicker
William Kahrl
Sharon Hawkins
Additional copies of this report may
be obtained from:
California Business Roundtable
1201 K Street, Suite 1980
Sacramento, CA 95814
Telephone: 916-553-4093

B u i l d i n g a L e g a c y f o r t h e N e x t G e n e r a t i o n31