BUILDING A BETTER INTERMEDIATE SOCIAL BUSINESS · PDF fileBUILDING A BETTER SOCIAL BUSINESS We...
68
BUILDING A BETTER SOCIAL BUSINESS We will be starting at 2:00 pm ET. Use the Question Pane in GoToWebinar to Ask Questions! Question of the day Use the hashtag #InboundLearning on Twitter 1 2 INTERMEDIATE
Transcript of BUILDING A BETTER INTERMEDIATE SOCIAL BUSINESS · PDF fileBUILDING A BETTER SOCIAL BUSINESS We...
BUILDING A BETTER SOCIAL BUSINESS
We will be starting at 2:00 pm ET.
Use the Question Pane in GoToWebinar to Ask Questions!
Question of the day
Use the hashtag #InboundLearning on Twitter 1 2
INTERMEDIATE

#INBOUNDLEARNING
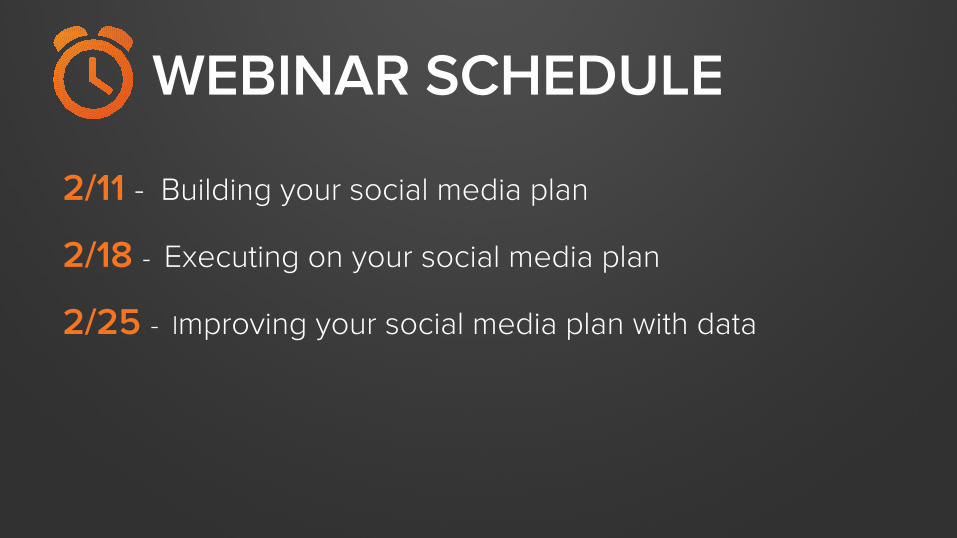
2/11 - Building your social media plan
2/18 - Executing on your social media plan
2/25 - Improving your social media plan with data
WEBINAR SCHEDULE

Mark Kilens @MarkKilens

Amy Ullman @AmyUllman

1 Time management best practices
2 Social media ROI
3 Diving deeper into data
AGENDA

TIME MANAGEMENT BEST PRACTICES. 1
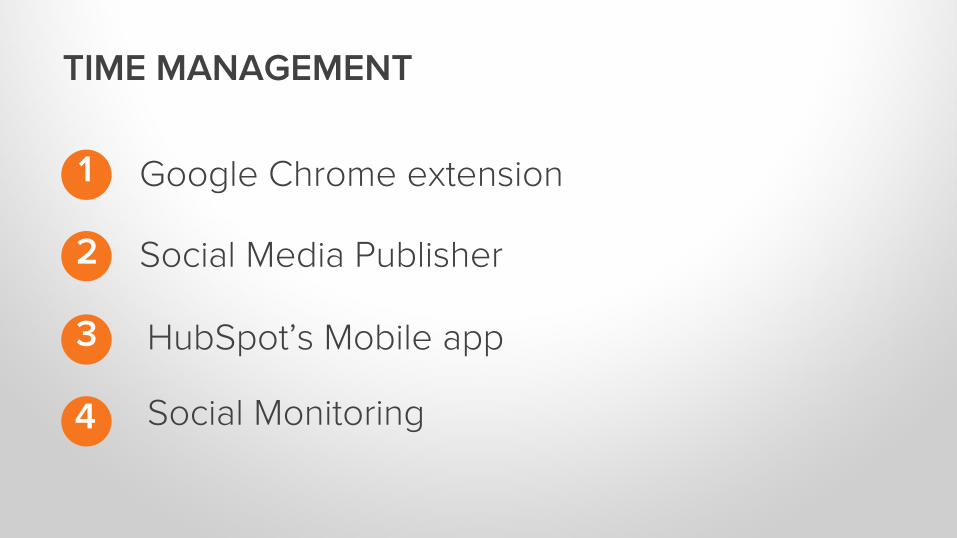
Google Chrome extension
TIME MANAGEMENT
1
2
3
4
Social Media Publisher
HubSpot’s Mobile app
Social Monitoring

GOOGLE CHROME EXTENSION
1
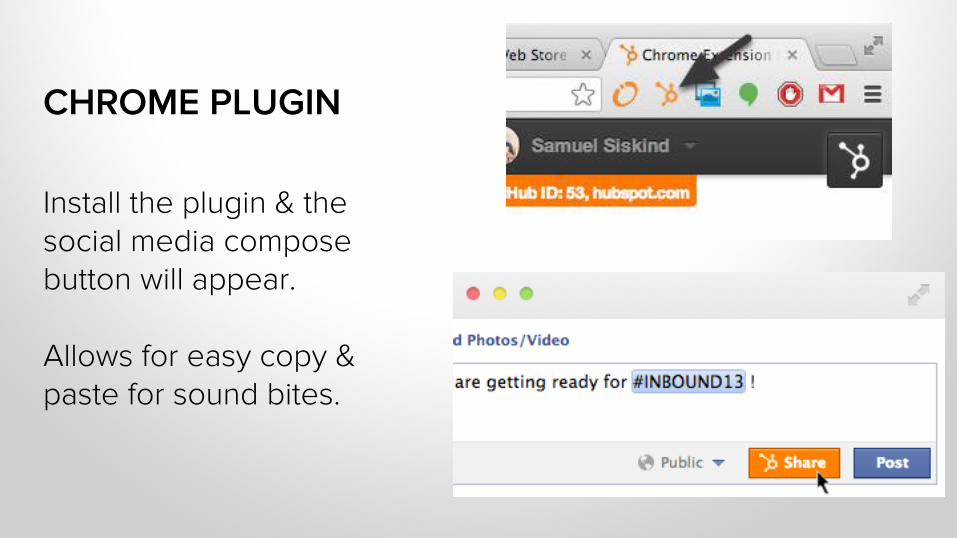
CHROME PLUGIN
Install the plugin & the social media compose button will appear. Allows for easy copy & paste for sound bites.

SOCIAL MEDIA PUBLISHER
2
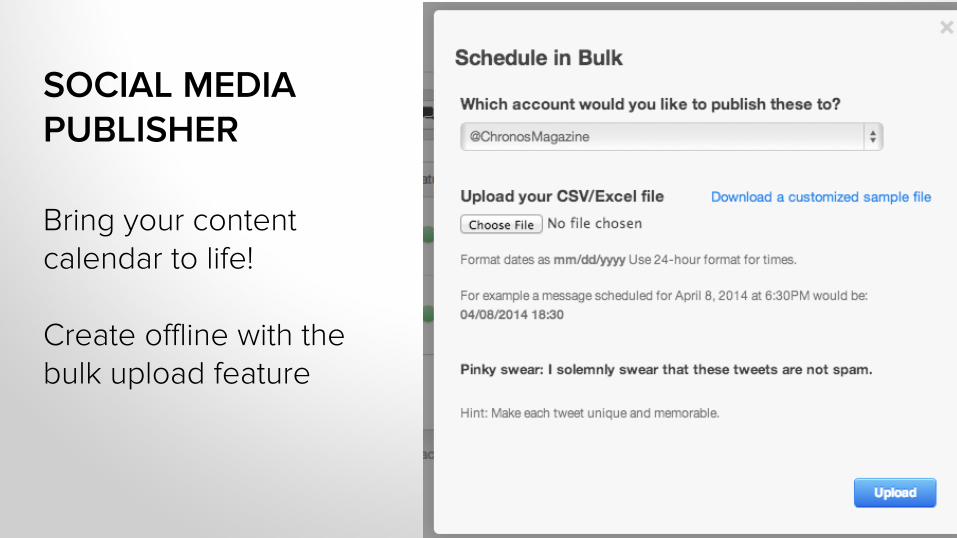
SOCIAL MEDIA PUBLISHER
Bring your content calendar to life! Create offline with the bulk upload feature
HUBSPOT’S MOBILE APP 3

HUBSPOT’S MOBILE APP
No desk – no problem! The mobile app lets you share content on the fly iOS & Android

SOCIAL MONITORING 4
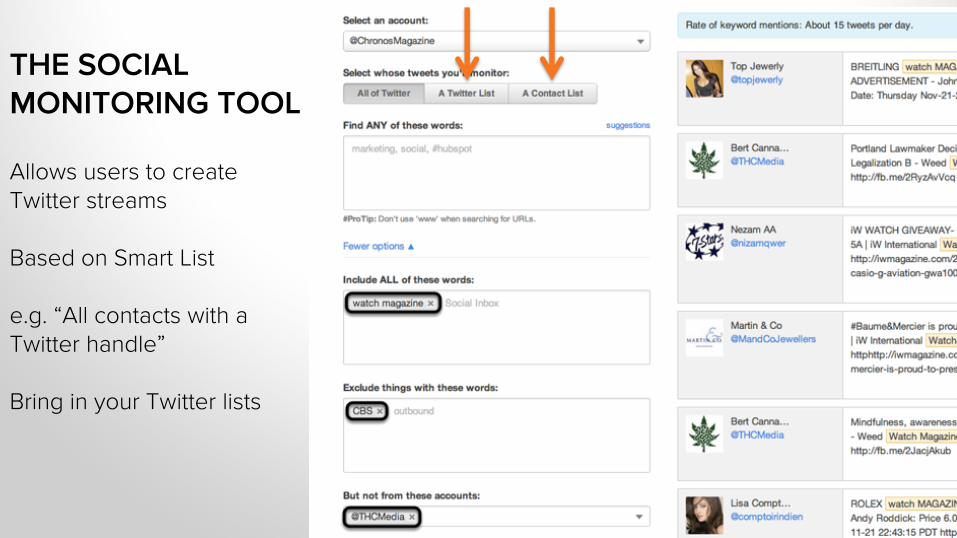
THE SOCIAL MONITORING TOOL
Allows users to create Twitter streams Based on Smart List e.g. “All contacts with a Twitter handle” Bring in your Twitter lists
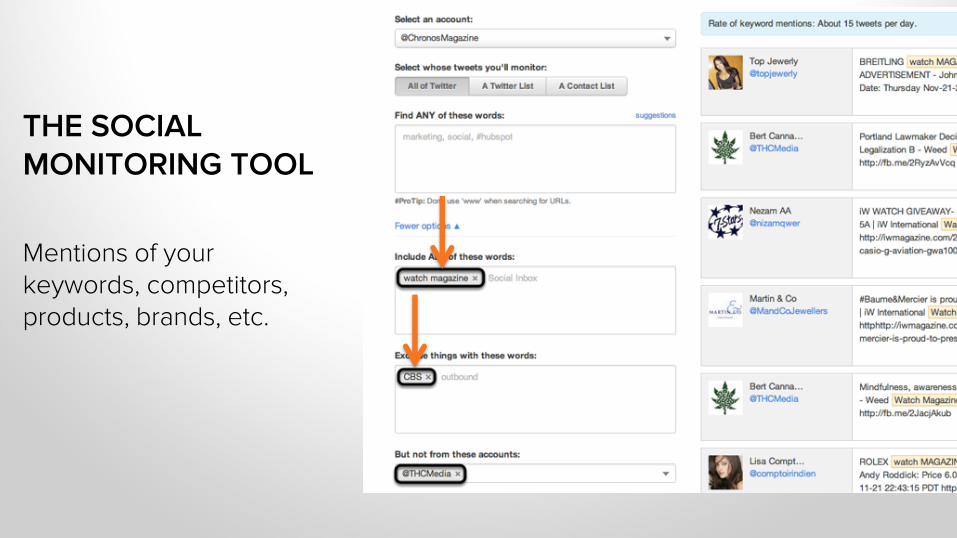
Mentions of your keywords, competitors, products, brands, etc.
THE SOCIAL MONITORING TOOL

SOCIAL MEDIA ROI. 2
WHAT METRICS SHOULD WE TRACK & WHY?
• These can vary from business to business, but…. • We should always start with a goal in mind. • According to HubSpot Social Media Manager, Brittany
Leaning, when she reviews her data, “I am looking to tell a story, to answer a series of questions”
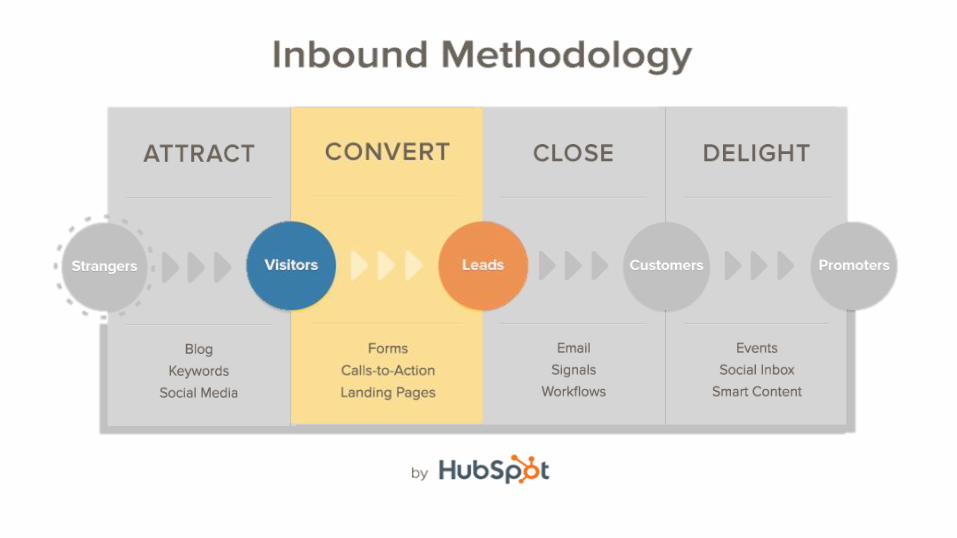
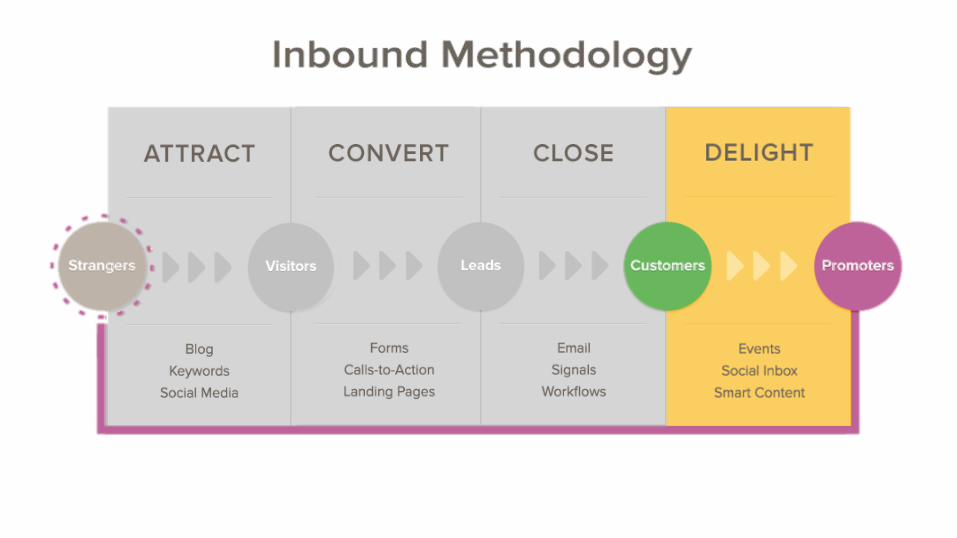
• For each stage in the inbound methodology here are
some great questions to get started when analyzing data.
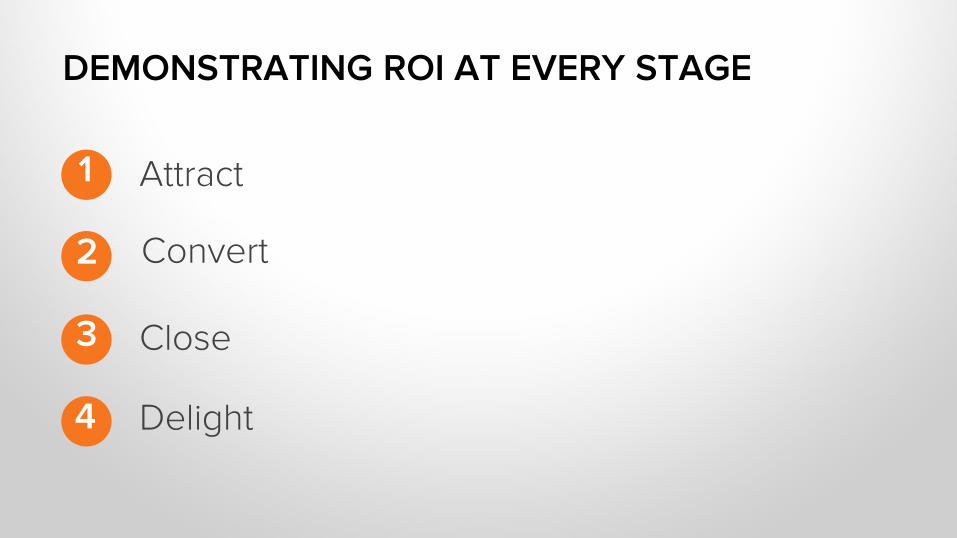
Attract 1
2
3
4
Convert
Close
Delight
DEMONSTRATING ROI AT EVERY STAGE

ATTRACT
1
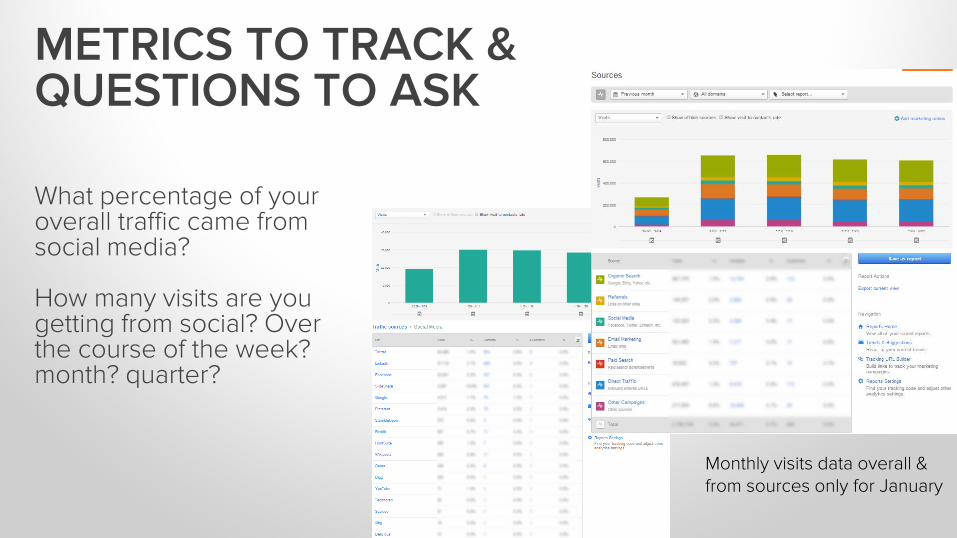
What percentage of your overall traffic came from social media? How many visits are you getting from social? Over the course of the week? month? quarter?
METRICS TO TRACK & QUESTIONS TO ASK
Monthly visits data overall & from sources only for January
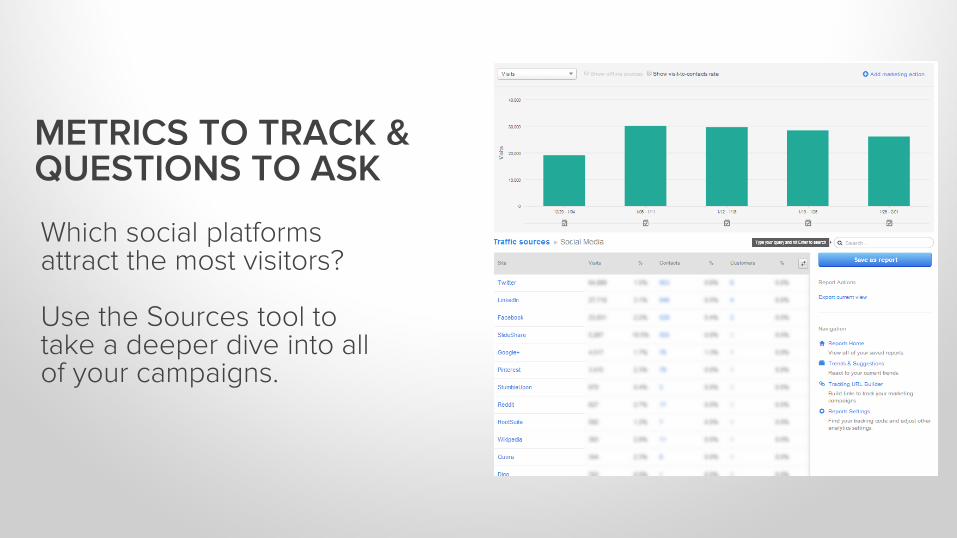
Which social platforms attract the most visitors? Use the Sources tool to take a deeper dive into all of your campaigns.
METRICS TO TRACK & QUESTIONS TO ASK
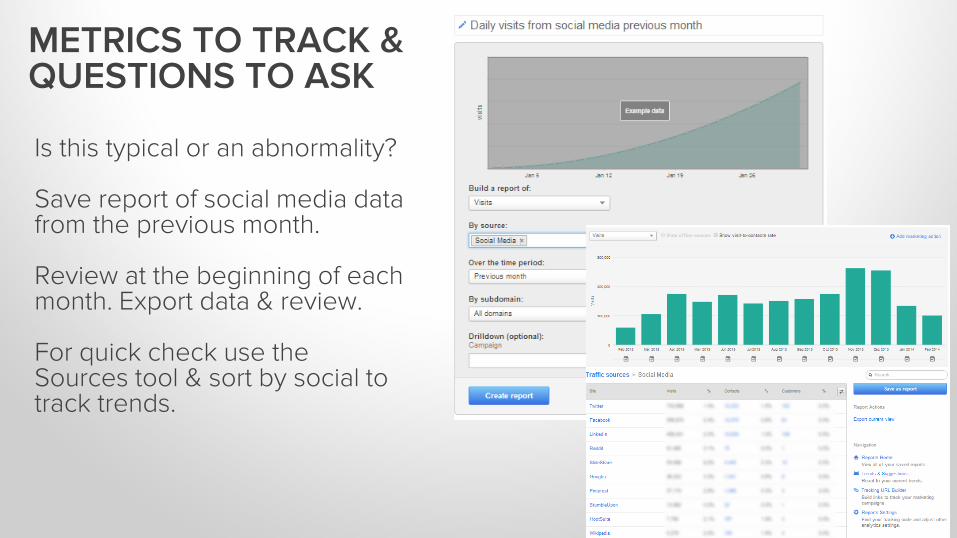
Is this typical or an abnormality? Save report of social media data from the previous month. Review at the beginning of each month. Export data & review. For quick check use the Sources tool & sort by social to track trends.
METRICS TO TRACK & QUESTIONS TO ASK
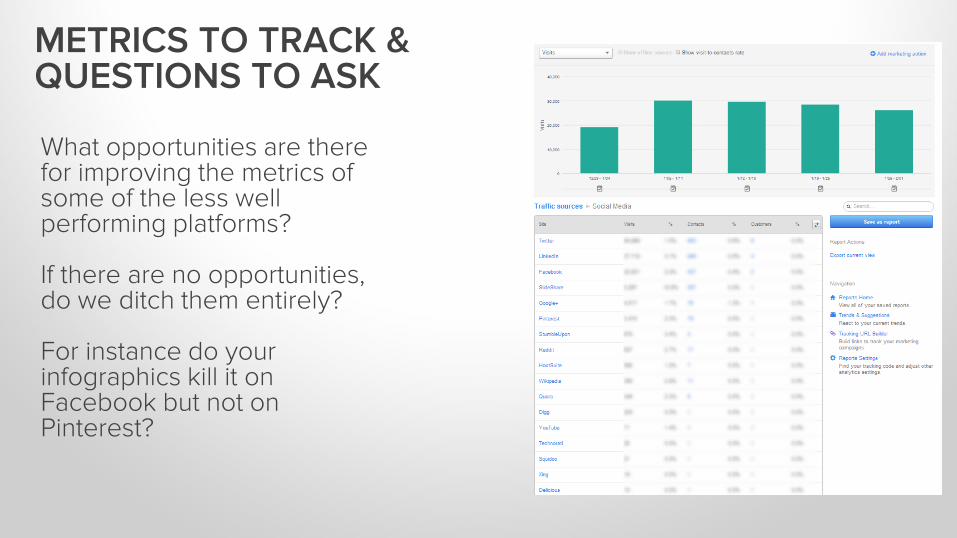
What opportunities are there for improving the metrics of some of the less well performing platforms? If there are no opportunities, do we ditch them entirely? For instance do your infographics kill it on Facebook but not on Pinterest?
METRICS TO TRACK & QUESTIONS TO ASK

CONVERT
2
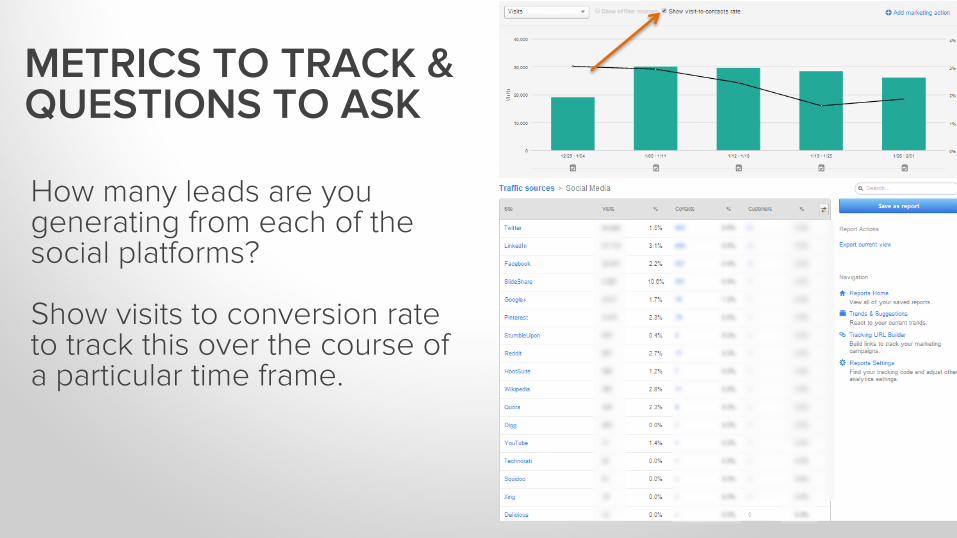
How many leads are you generating from each of the social platforms? Show visits to conversion rate to track this over the course of a particular time frame.
METRICS TO TRACK & QUESTIONS TO ASK
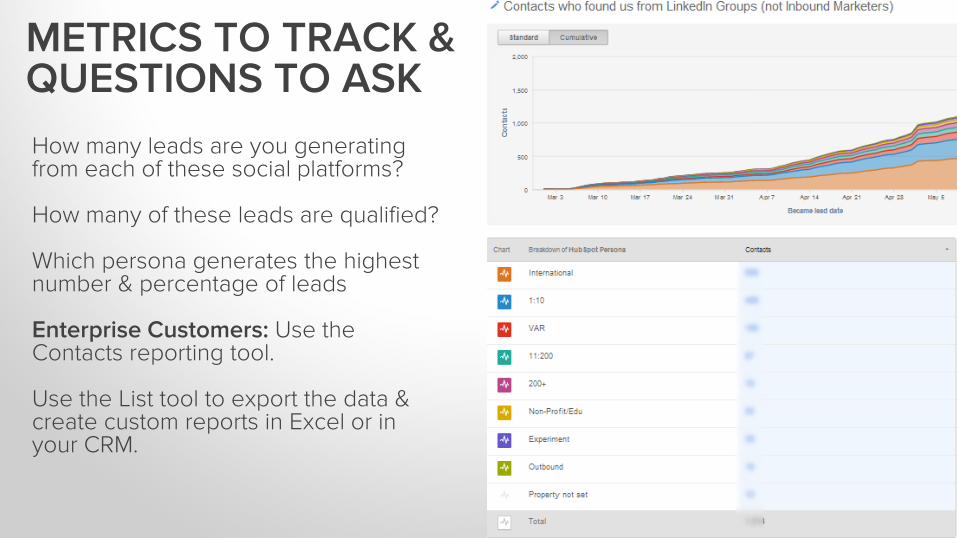
How many leads are you generating from each of these social platforms? How many of these leads are qualified? Which persona generates the highest number & percentage of leads Enterprise Customers: Use the Contacts reporting tool. Use the List tool to export the data & create custom reports in Excel or in your CRM.
METRICS TO TRACK & QUESTIONS TO ASK
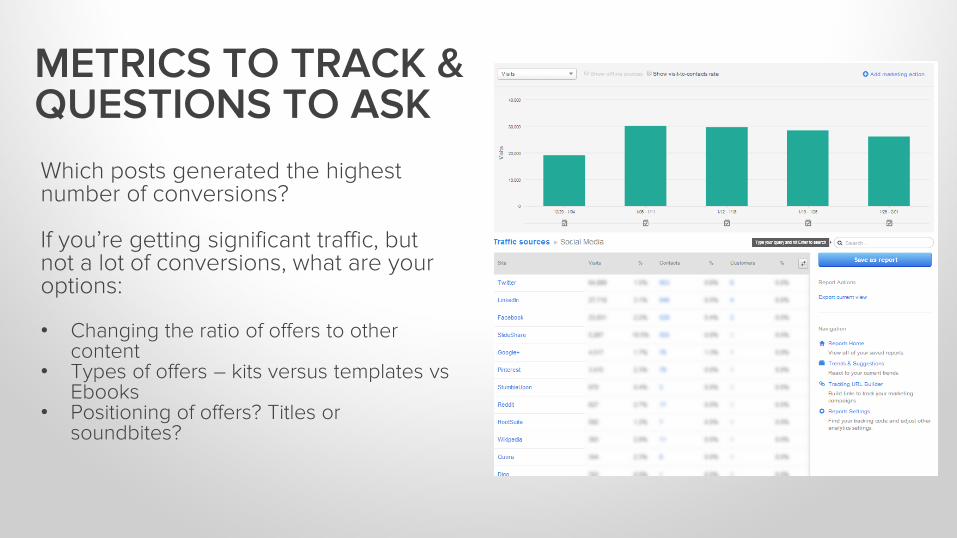
Which posts generated the highest number of conversions? If you’re getting significant traffic, but not a lot of conversions, what are your options: • Changing the ratio of offers to other
content • Types of offers – kits versus templates vs
Ebooks • Positioning of offers? Titles or
soundbites?
METRICS TO TRACK & QUESTIONS TO ASK

CLOSE
3

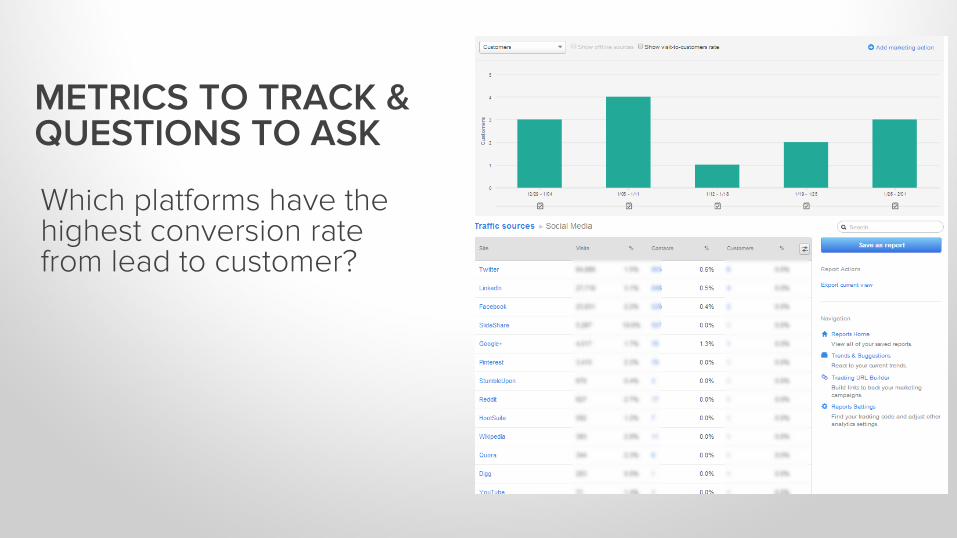
Which platforms have the highest conversion rate from lead to customer?
METRICS TO TRACK & QUESTIONS TO ASK
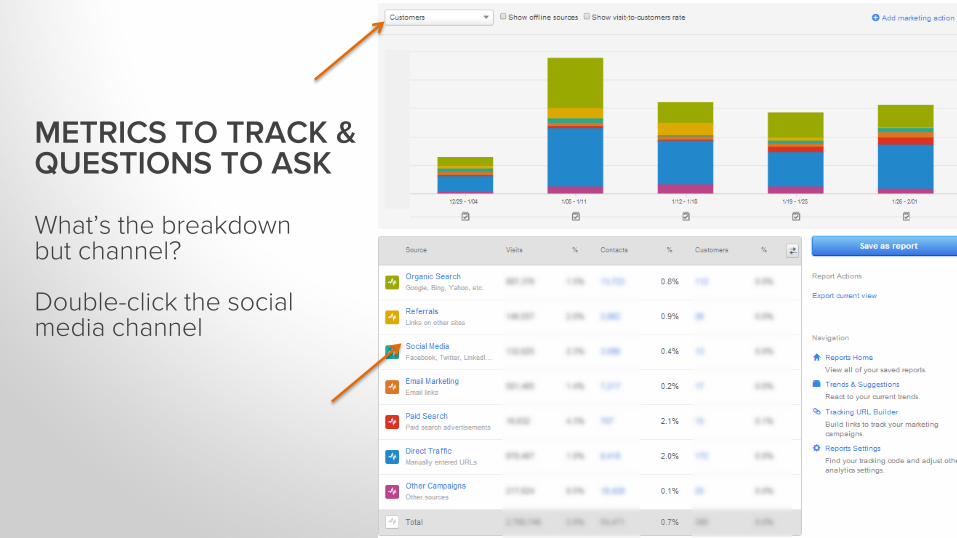
What’s the breakdown but channel? Double-click the social media channel
METRICS TO TRACK & QUESTIONS TO ASK
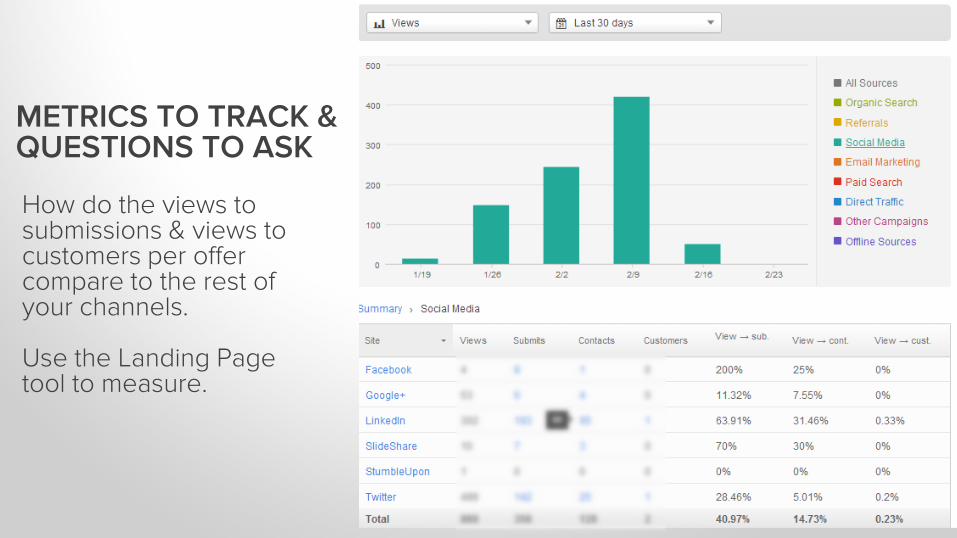
How do the views to submissions & views to customers per offer compare to the rest of your channels. Use the Landing Page tool to measure.
METRICS TO TRACK & QUESTIONS TO ASK

DELIGHT
4
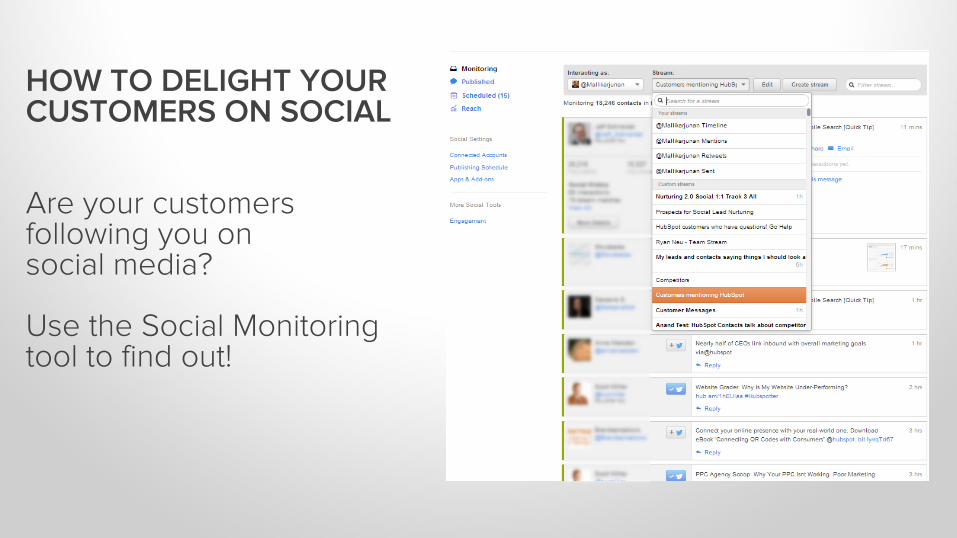
Are your customers following you on social media? Use the Social Monitoring tool to find out!
HOW TO DELIGHT YOUR CUSTOMERS ON SOCIAL
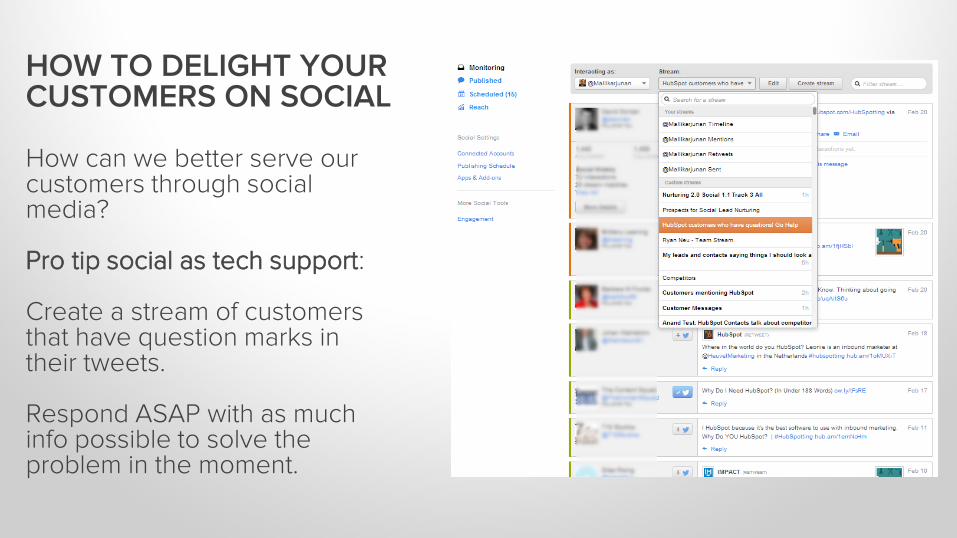
How can we better serve our customers through social media? Pro tip social as tech support: Create a stream of customers that have question marks in their tweets. Respond ASAP with as much info possible to solve the problem in the moment.
HOW TO DELIGHT YOUR CUSTOMERS ON SOCIAL
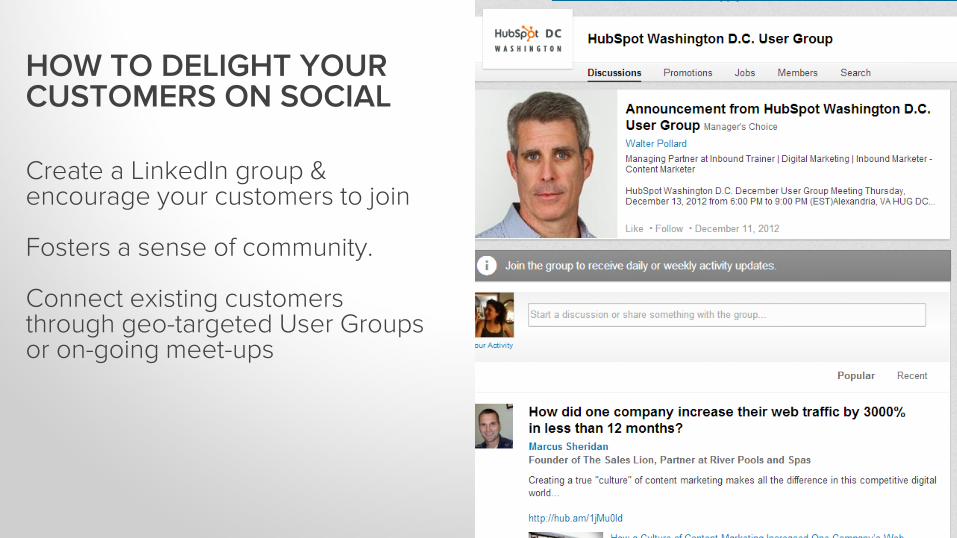
Create a LinkedIn group & encourage your customers to join Fosters a sense of community. Connect existing customers through geo-targeted User Groups or on-going meet-ups
HOW TO DELIGHT YOUR CUSTOMERS ON SOCIAL
DIVING DEEPER INTO DATA. 3

1
2 Social platform data
Data follow-up best practices
3 Overcoming challenges

DATA FOLLOW-UP BEST PRACTICES
1
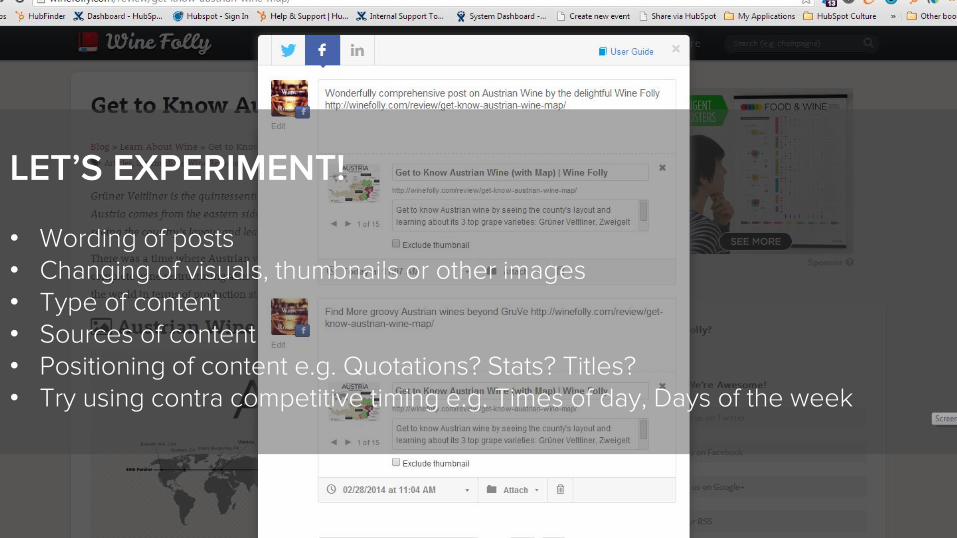
LET’S EXPERIMENT! • Wording of posts • Changing of visuals, thumbnails or other images • Type of content • Sources of content • Positioning of content e.g. Quotations? Stats? Titles? • Try using contra competitive timing e.g. Times of day, Days of the week
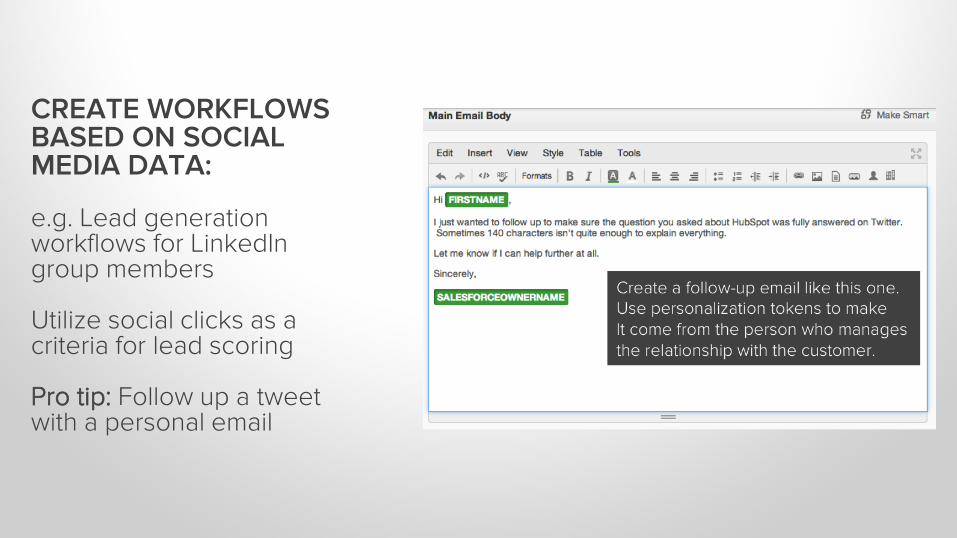
CREATE WORKFLOWS BASED ON SOCIAL MEDIA DATA: e.g. Lead generation workflows for LinkedIn group members Utilize social clicks as a criteria for lead scoring Pro tip: Follow up a tweet with a personal email
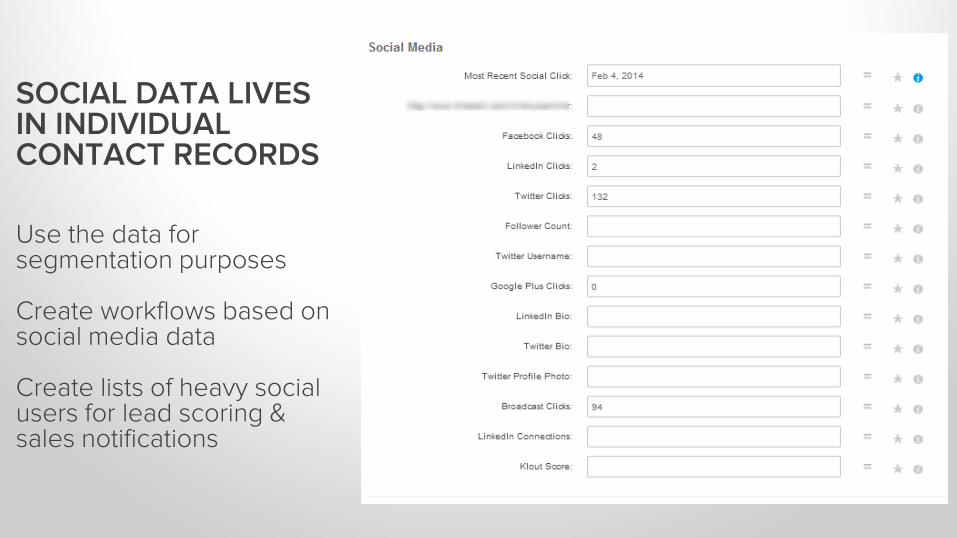
SOCIAL DATA LIVES IN INDIVIDUAL CONTACT RECORDS Use the data for segmentation purposes Create workflows based on social media data Create lists of heavy social users for lead scoring & sales notifications
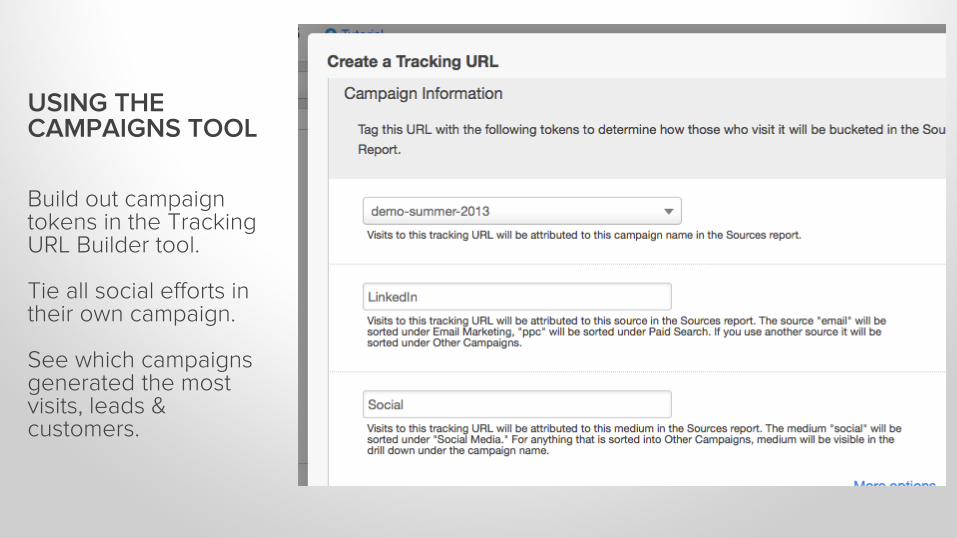
USING THE CAMPAIGNS TOOL Build out campaign tokens in the Tracking URL Builder tool. Tie all social efforts in their own campaign. See which campaigns generated the most visits, leads & customers.

SOCIAL PLATFORM DATA 2
SOCIAL PLATFORM DATA
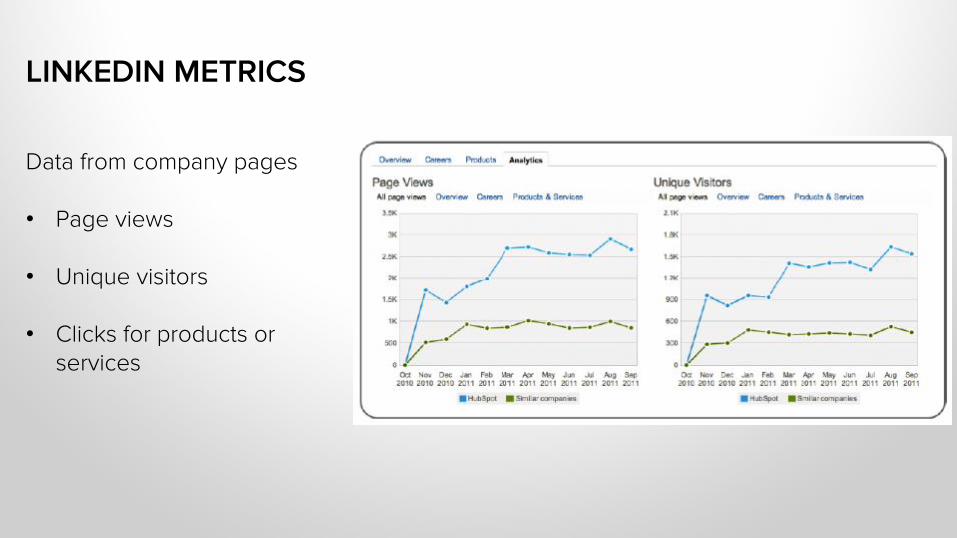
Data from company pages • Page views
• Unique visitors • Clicks for products or
services
LINKEDIN METRICS

Visits to company pages by LinkedIn members Data is split into member visits by the following:
• Industry • Function • Company
LINKEDIN METRICS
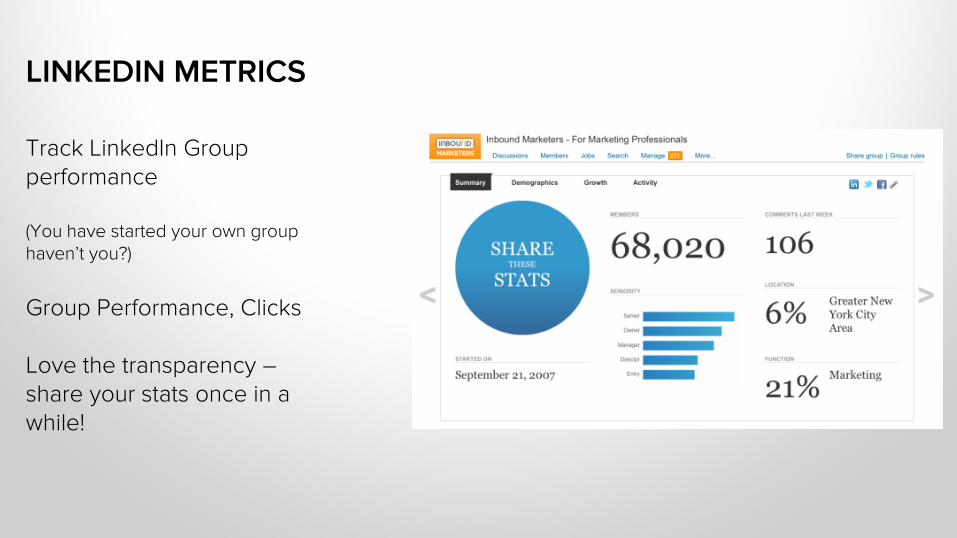
Track LinkedIn Group performance (You have started your own group haven’t you?)
Group Performance, Clicks Love the transparency – share your stats once in a while!
LINKEDIN METRICS
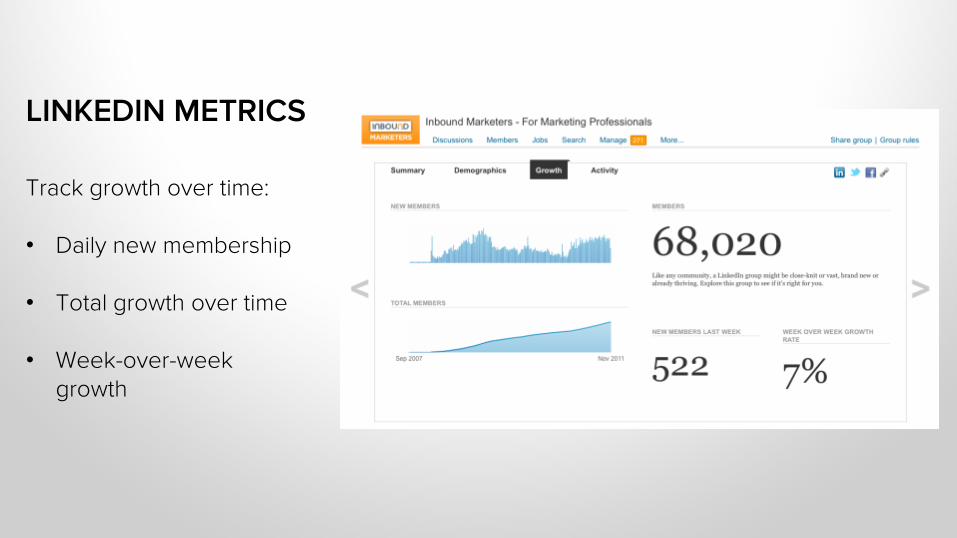
Track growth over time: • Daily new membership • Total growth over time • Week-over-week
growth
LINKEDIN METRICS
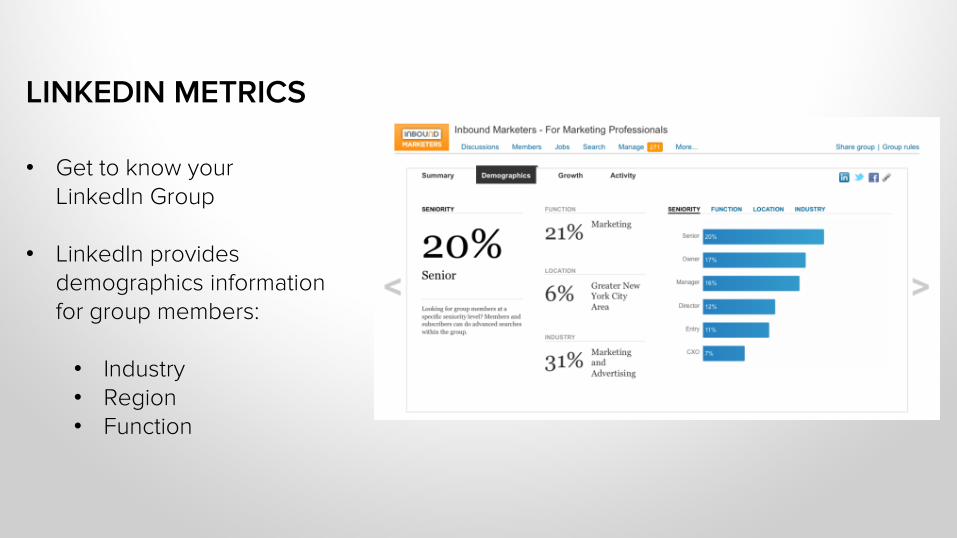
• Get to know your
LinkedIn Group • LinkedIn provides
demographics information for group members:
• Industry • Region • Function
LINKEDIN METRICS

Facebook Insights provides a wealth of data, but sometimes there is too much of a good thing. Our favorites to use? People talking about this
• Page Likes • People Engaged • Page tags & mentions • Page Checks ins
FACEBOOK METRICS
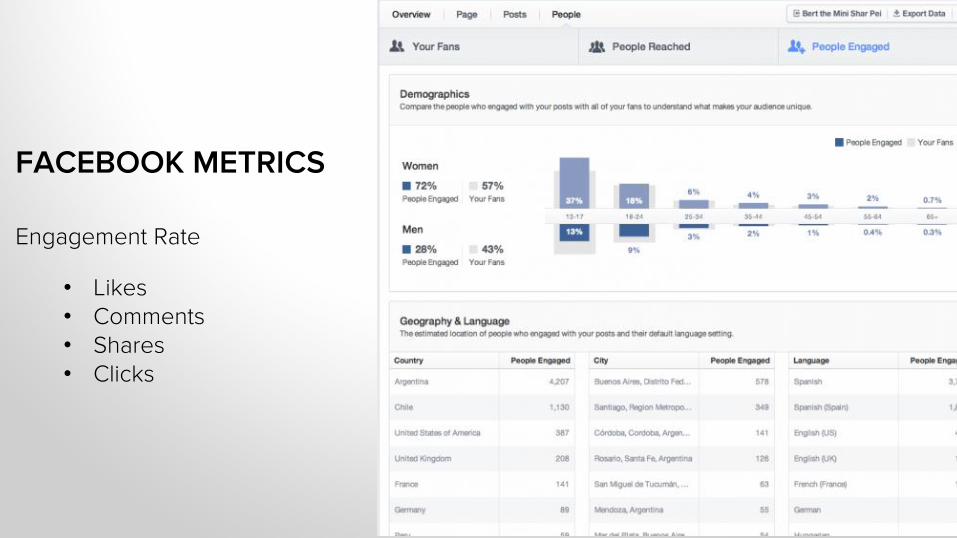
Engagement Rate
• Likes • Comments • Shares • Clicks
FACEBOOK METRICS
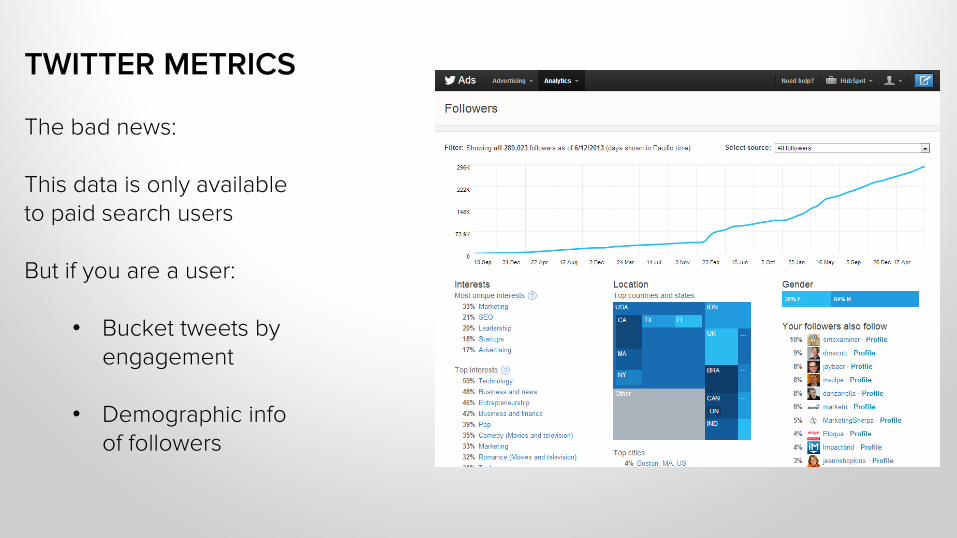
The bad news: This data is only available to paid search users But if you are a user:
• Bucket tweets by engagement
• Demographic info
of followers
TWITTER METRICS
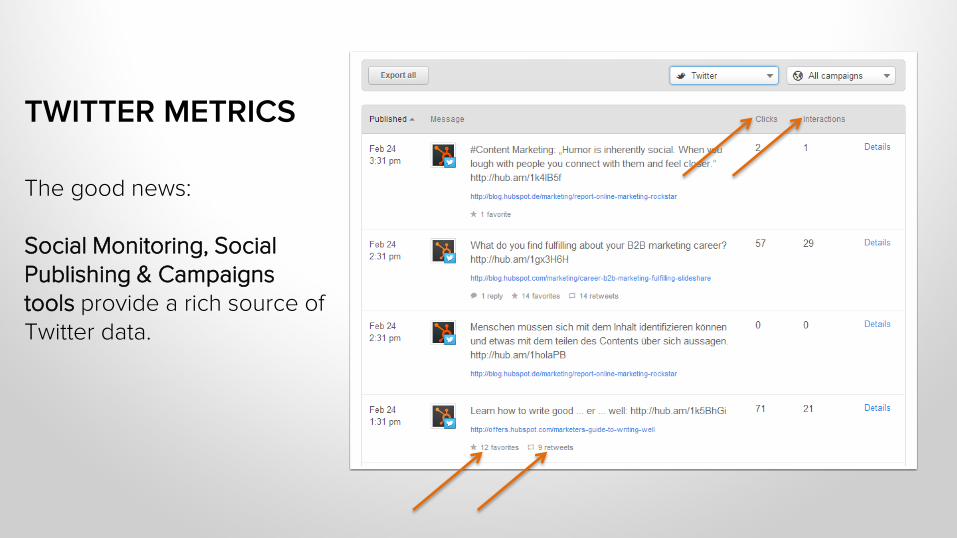
The good news: Social Monitoring, Social Publishing & Campaigns tools provide a rich source of Twitter data.
TWITTER METRICS

OVERCOMING CHALLENGES 3
• Boss is nervous about negative posts on social media
• Boss does not see the value of social media
• Sales team does not like the quality of leads
• No time, no results
COMMON SOCIAL MEDIA CHALLENGES:
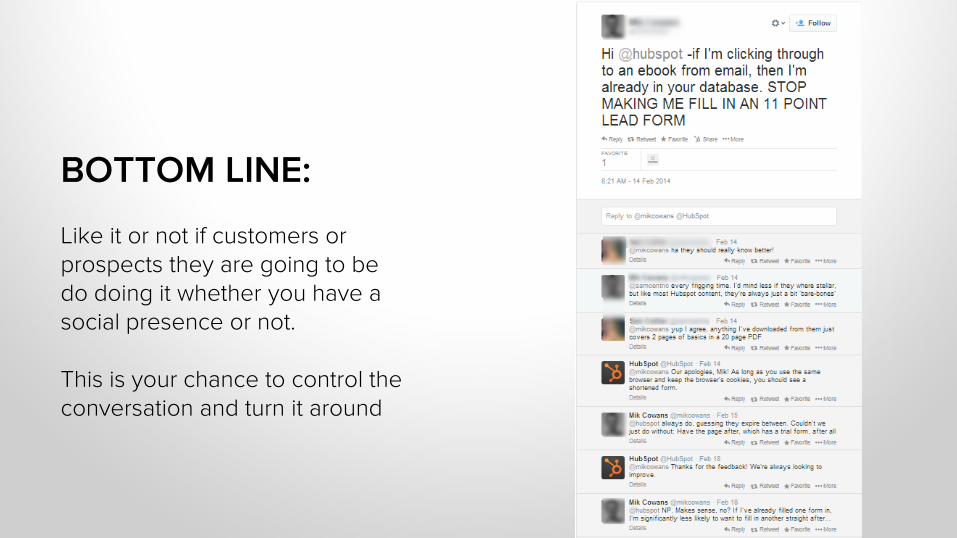
BOTTOM LINE: Like it or not if customers or prospects they are going to be do doing it whether you have a social presence or not. This is your chance to control the conversation and turn it around
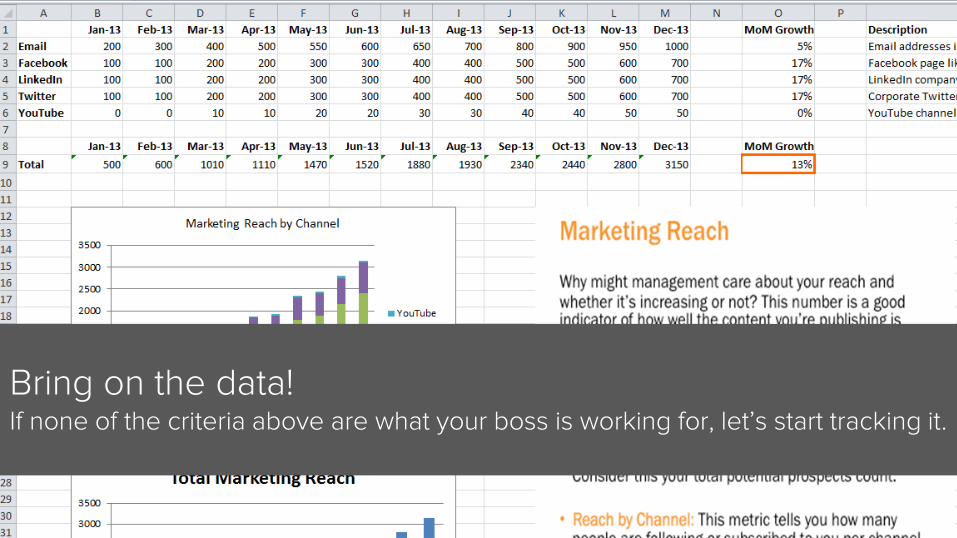
Bring on the data! If none of the criteria above are what your boss is working for, let’s start tracking it.
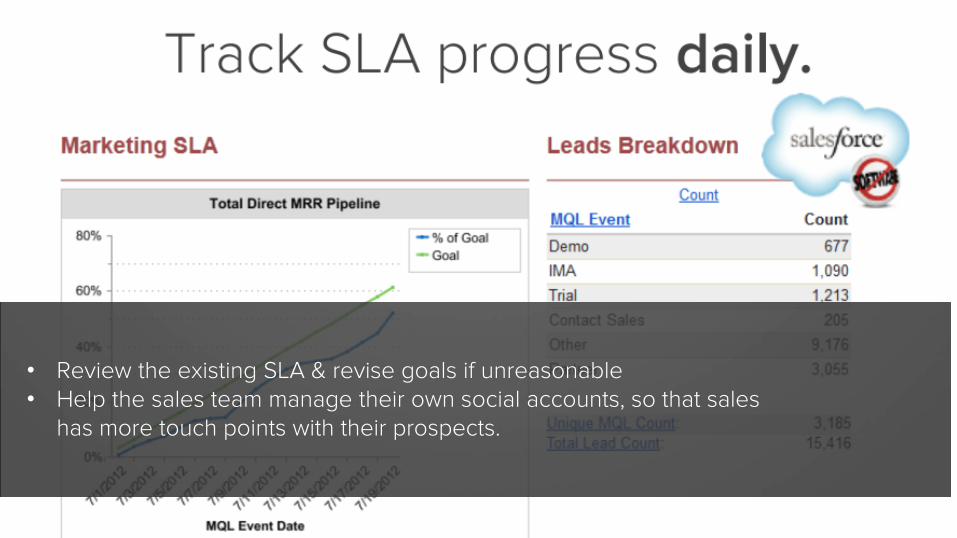
• Review the existing SLA & revise goals if unreasonable • Help the sales team manage their own social accounts, so that sales
has more touch points with their prospects.
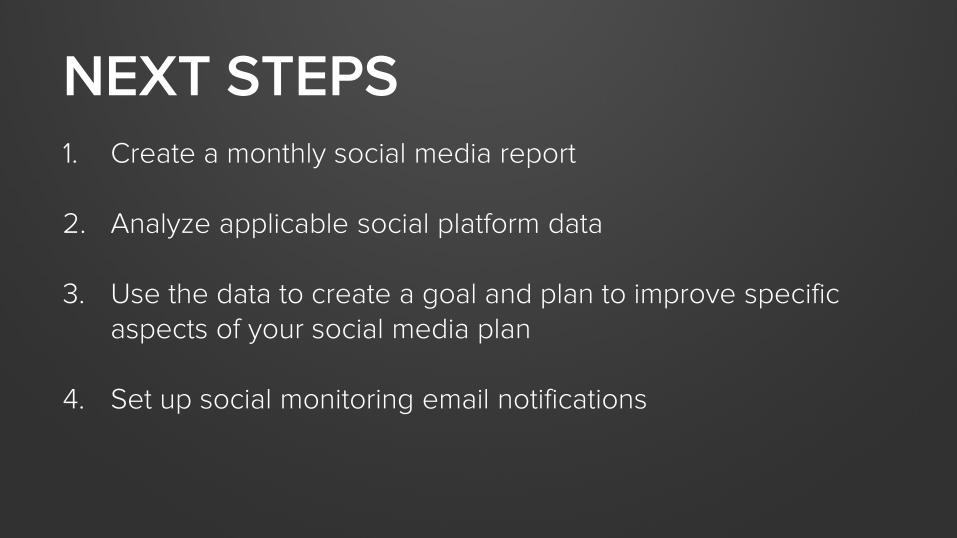
1. Create a monthly social media report
2. Analyze applicable social platform data
3. Use the data to create a goal and plan to improve specific aspects of your social media plan
4. Set up social monitoring email notifications
NEXT STEPS
• How to Convince Your Boss to Invest in Social Media Marketing
• How to install the Chrome plugin for HubSpot social media
• How to analyze your social media messages with HubSpot
• How to export details from your social media accounts
• Follow-Up a Customer Tweet With a Personal Email
CLASS RESOURCES

QUESTIONS?

THANK YOU.