Build a Moat in Your Portfolio - Morningstar, Inc. · Why Moats Matter × Wide-moat firms’...
47
Build a Moat in Your Portfolio × Matthew Coffina, CFA Editor, Morningstar StockInvestor
Transcript of Build a Moat in Your Portfolio - Morningstar, Inc. · Why Moats Matter × Wide-moat firms’...

Build a Moat in Your Portfolio
× Matthew Coffina, CFAEditor, Morningstar StockInvestor

Disclosure
× I own many of the stocks that will be discussed today, both personallyand in StockInvestor’s Tortoise and Hare portfolios.
× None of this presentation is intended as investment advice.× Please consult a financial advisor for questions about the suitability of
any investment strategy or product for your particular circumstances.

Morningstar’s Strategy
Invest in companies with strong and growing competitiveadvantages, trading at reasonable prices.

× Economic Moats× Moat Trends× Stewardship× Price/Fair Value Ratios× Uncertainty/Star Ratings
Five Morningstar Ratings Drive Stock Selection

Why Moats Matter
× Wide-moat firms’ ability to invest incremental capital at high rates ofreturn = faster earnings growth and/or higher free cash flow.
× Wide-moat firms are able to sustain excess returns longer than firmswithout moats.
× Morningstar’s fair value estimates are more accurate for wide-moatfirms because future cash flows are more predictable.

Star Ratings Performance*
Wide Moat Narrow Moat No Moat
All 11.0% 11.6% 12.9%
QQQQQ 19.7% 15.8% 19.3%
QQQ 8.1% 10.6% 12.4%
Q -2.3% 6.1% 15.3%
*Annualized Returns, 6/26/2002-2/28/2014

The Tortoise and Hare Strategy
× Real-money portfolios focused on buying wide- and expanding-moatstocks at discounts to Morningstar’s fair value estimates.
× Tortoise Portfolio invests in more conservative stocks.× Hare Portfolio takes on greater risk for higher total-return potential.× About 20 stocks in each portfolio.× Inception date of June 18, 2001.

Tortoise and Hare Performance
Combined Tortoise &Hare S&P 500
Trailing 1-Year 27.4% 25.4%
Trailing 5-Year 23.4% 23.0%
Trailing 10-Year 9.7% 7.2%
Since Inception 9.4% 5.5%
Annualized Total Returns as of 2/28/14

Other Benefits to a Wide-Moat Approach*
× The Tortoise and Hare have experiencedlow turnover (18% per year versus 89%for the average equity mutual fund).
× Standard deviation of returns (14.1%)below the S&P 500 (15.2%).
× Beta below one (0.87).× Greatest outperformance realized during
down markets.*All figures represent averages since inception for the combined Tortoise and Hare.

Definition of a Moat
× Sustainable competitive advantage(s).× Enables a company to earn positive
economic profits (ROIC>WACC).× At least one identifiable moat source.

Moat Ratings: Wide/Narrow/None
× Width of moat determined byduration of competitive advantage.
× Narrow moats: Excess returnsmore likely than not in 10 years.
× Wide moats: Excess returns nearlycertain in 10 years, more likelythan not in 20 years.

Wide Moats Are Rare
× We assign a wide moat rating to 14%of our global coverage universe.
× However, we intentionally try to coverhigh-quality companies.
× The share of wide moats in the overalleconomy/market would be much lower.
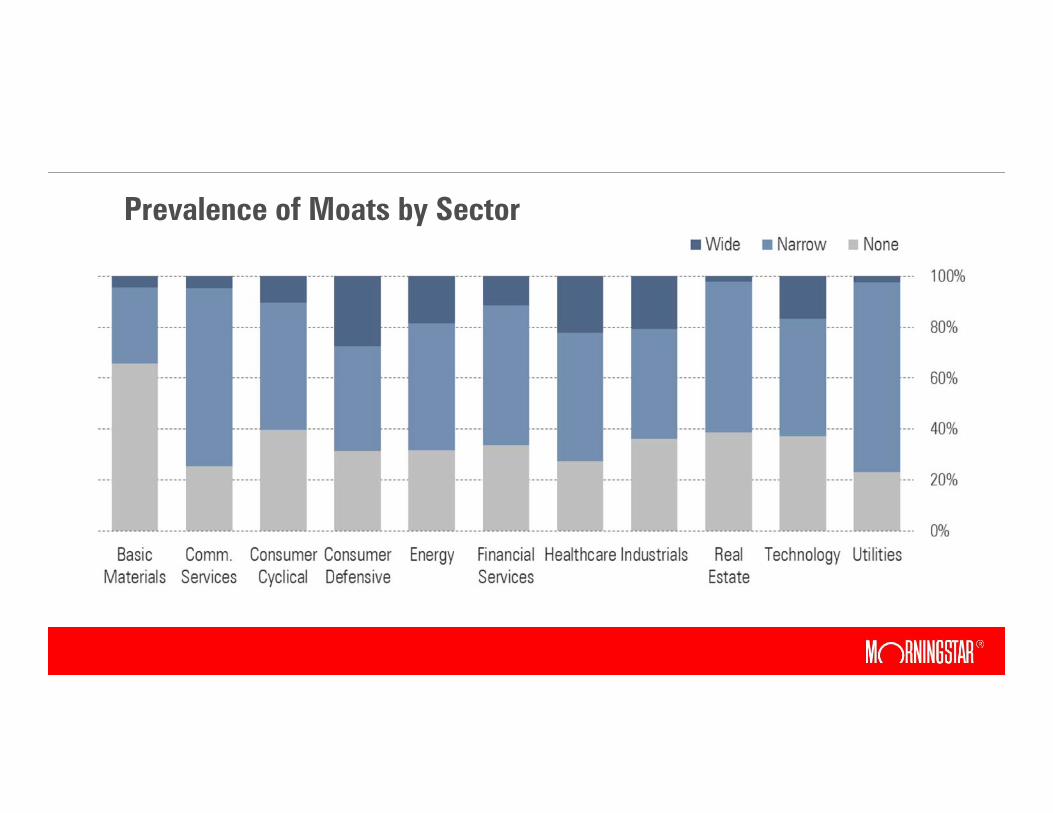
Prevalence of Moats by Sector

The Five Sources of a Moat
× Network Effect× Intangible Assets× Cost Advantage× Switching Costs× Efficient Scale

The Network Effect
× The value of a company’s service increases as more people use it.

Intangible Assets
× Patents, brands, or regulatory licenses that protect excess returns.

Cost Advantage
× Economies of scale, access to a unique asset, etc.

Switching Costs
× It is too expensive/troublesome for customers to stop using a product.

Efficient Scale
× A niche market is effectively served by one or a small handful of firms.

Prevalence of Moat Sources
× Firms often have multiple moat sources, which can reinforce one another.

Other Evidence of a Moat
× High barriers to entry.× Strong/improving market share.× Ability to raise prices.× High customer retention.× Few competitors, low competitive rivalry.× Margins ahead of peers and/or sustainable margin expansion.

Quantitative Evidence of a Moat: ROIC>WACC?
× In contrast to return on equity, return on invested capital isn’t affected bythe capital structure (the degree of leverage).
× ROIC is compared against the weighted average cost of capital,reflecting the cost of both equity and debt capital.
× ROIC>WACC is the ultimate test of shareholder value creation.

Basic Example: A Lemonade Stand
× Jill needs $100 for a table, sign, pitcher, lemons,sugar, ice, and cups.
× She borrows $50 from Mom and promises topay her 5% interest ($2.50).
× Dad has a higher risk tolerance and buys $50worth of common stock in Jill’s lemonade stand.
× Dad expects a 10% return (his cost of equity).

Jill’s Weighted Average Cost of Capital
× (Cost of Debt) x (Debt Weighting)+(Cost of Equity) x (Equity Weighting).× Jill’s capital structure includes 50% debt and 50% equity.× WACC = 5% x 0.5 + 10% x 0.5= 7.5%.

Jill’s Return on Invested Capital
× (Earnings Before Interest) ÷ (Invested Capital).× After a hard day’s work, Jill has earned a $10 profit after paying herself
a reasonable wage and replenishing her supplies.× Her invested capital was $100.× ROIC = $10/$100 = 10%.× 10%>7.5%, so ROIC>WACC and Jill has earned excess returns.

Dad’s Return on Equity
× Mom receives her $2.50 in interest.× The other $7.50 belongs to Dad, who has achieved a 15% return on
equity—above his 10% cost of equity.× ROE is affected by leverage.× For example, if the lemonade stand were funded with $80 in debt and
$20 in equity, Mom would be owed $4 in interest and Dad wouldreceive $6, for an ROE of 30%.

Real-World Challenges
× Is Earnings Before Interest normalized?× Cyclicality, one-time charges, noneconomic costs, cash taxes.
× What should be considered invested capital?× Goodwill, other intangibles, deferred taxes, capitalized lease
expense, capitalized R&D.× Changing assumptions can result in very different conclusions.

Example: ITC Holdings (ITC)
× Independent electricity transmission utility.× Efficient scale advantage—it isn’t cost-effective to
build multiple competing transmission lines.× Attractive set of investment opportunities to ensure
grid reliability, encourage wind-power development,and enable cross-regional electricity pricing arbitrage.
× Favorable allowed returns from the Federal EnergyRegulatory Commission are a key differentiator.


Calculating ITC’s Earnings Before Interest
× Net Income + (Interest Expense) x (1 - Tax Rate).× ITC reported $233,506 in net income last year (all figures in thousands).× Assume a marginal tax rate of 36.5%.× Interest expense was $168,319; tax-adjusted interest expense of
$106,883.× EBI = $233,506 + $106,883 = $340,389.

Adjustments to EBI
× However, last year ITC Holdings tried to acquire Entergy’s (ETR)transmission assets—a deal that failed to receive regulatory approval.
× Earnings in 2013 include $25,096 of nonrecurring transaction costs andother items (after tax).
× Adding these items back, operating earnings were $258,602.× Adjusted EBI = $258,602 + $106,883 = $365,485.


Calculating ITC’s Invested Capital
× Operating Assets - Operating Liabilities or Debt + Equity.× Use an average of current and preceding year’s balance sheet.× Average debt of $3,379,670 and average equity of $1,514,294.× Invested Capital = $4,893,964.× If we exclude $950,163 of goodwill, invested capital would be
$3,943,801.

ITC’s Return on Invested Capital
× Divide EBI by Invested Capital.
Invested Capital
With Goodwill Without Goodwill
EBI
Including One-Time Costs 7.0% 8.6%
Excluding One-Time Costs 7.5% 9.3%

Weighted Average Cost of Capital
× Calculating WACC involves its own complications:× The cost of equity can’t be observed.× Interest rates change over time.× Should we use a market or book capital structure weighting?

Considerations in Estimating COE
× For U.S. companies, Morningstar assigns a cost of equity of 8%, 10%,12%, or 14% depending on the level of “systematic risk.”
× Systematic risk = risk that can’t be eliminated through diversification.× Our version of CAPM, using fundamentals of revenue cyclicality,
operating leverage, and financial leverage in place of beta.× ITC’s formula-based rate regulation creates exceptionally low risk.× Primary uncertainty is FERC policy, which isn’t correlated with the
market.

Calculating ITC’s WACC
× Morningstar’s cost of capital assumptions:× 8.0% cost of equity.× 5.0% cost of debt, 3.2% after tax.× 62% equity/28% debt capital structure.× WACC = 6.2%.
× Using a book capital structure (31% equity/69% debt):× WACC = 4.7%.

ITC’s Economic Moat
× Under most assumptions, ROIC>WACC by a slim but sustainablemargin.
× Wide moat based on our belief that FERC policy will continue to favorindependent transmission operators.
× Compared with state regulators, FERC is less subject to local politicalpressures (less focused on consumer utility bills).
× Grid reliability trumps modest savings that could be achieved fromlower allowed ROEs.

ITC’s Return on Equity
× Stable cash flows allow ITC to safely leverage returns at the parentcompany level.
× Operating earnings of $258,602 last year relative to average equity of$1,514,294.
× Return on equity = 17.1%.× Incremental earnings of $42,086 on incremental equity of $177,420.× Incremental ROE of 23.7% in 2013—not bad for a regulated utility!


Moat Trend: Positive, Stable, Negative
× Is the competitive position strengthening or weakening?× The moat trend is independent of the moat.× Moat trend is less likely to be incorporated in current stock prices.

Stewardship: Exemplary, Standard, Poor
× We assign Stewardship Ratings based on the quality ofmanagement’s capital-allocation decisions and strategic execution.
× Exemplary stewardship characterized by:× Moat-widening investments and execution.× Prudent financial leverage and accounting decisions.× Effective dividend and share-repurchase policies.× Avoids conflicts of interest that could harm shareholders.

Fair Value Estimates
× We use discounted cash flow analysis to assign fair value estimatesto stocks.
× Analysts make detailed assumptions about future revenue, costs,working capital investments, capital expenditures, and so on.
× Moats reflected in duration of excess returns.× Free cash flows are discounted back to the present using the WACC.


Uncertainty/Star Ratings
× Greater uncertaintyrequires a larger marginof safety.
× Star ratings adjustautomatically based onmarket prices.

Questions?