BUDGETING & FORECASTING FINANCIAL MODELLING FOR MODERN … · budgeting & forecasting financial...
29
BUDGETING & FORECASTING FINANCIAL MODELLING FOR MODERN DAY MANAGEMENT ACCOUNTING A PRESENTATION BY INVHESTIA AFRICA LIMITED AT THE 9 TH MANAGEMENT ACCOUNTING CONFERENCE 27 th – 29 th July 2016
Transcript of BUDGETING & FORECASTING FINANCIAL MODELLING FOR MODERN … · budgeting & forecasting financial...
BUDGETING & FORECASTING FINANCIAL
MODELLING FOR MODERN DAY MANAGEMENT
ACCOUNTING
A PRESENTATION BY INVHESTIA AFRICA LIMITED
AT THE 9TH MANAGEMENT ACCOUNTING CONFERENCE
27th – 29th July 2016

2
Content
About the Presenter
Introduction
Case Study I – Financial Analysis
Case Study II – Data Presentation
Case Study III – Strategy
The FAST Standard
About Invhestia
Q & A

3
About the Presenter
Steve Ogada, CFA
Associate Principal
Invhestia Africa Ltd
• An investment banker by profession with over 10 years
experience in the East African capital markets.
• Has worked with a large regional Investment Bank
performing various investment banking roles including
sales trading, portfolio management for High Net Worth
& Institutional clients, research, advisory and capital raise
activities in both equities and debt instruments for
corporate clients.
• Has worked on over 75 financial models and prepared
financial feasibility reports cutting across various sectors
from Real Estate, Energy to Manufacturing concerns.
• Holds a Bachelor of Arts Degree (Honors) in Economics
from Kenyatta University, has the FAST (Flexible
Appropriate Structured Transparent) Level 1 Certificate
for financial modelling & is a Chartered Financial Analyst
(CFA).

4
“Mathematicians finally developed a financial model to accurately
compare apples and oranges. Any two kinds of fruit can be
compared, although guavas still cause minor rounding errors.”
― Graham Parke
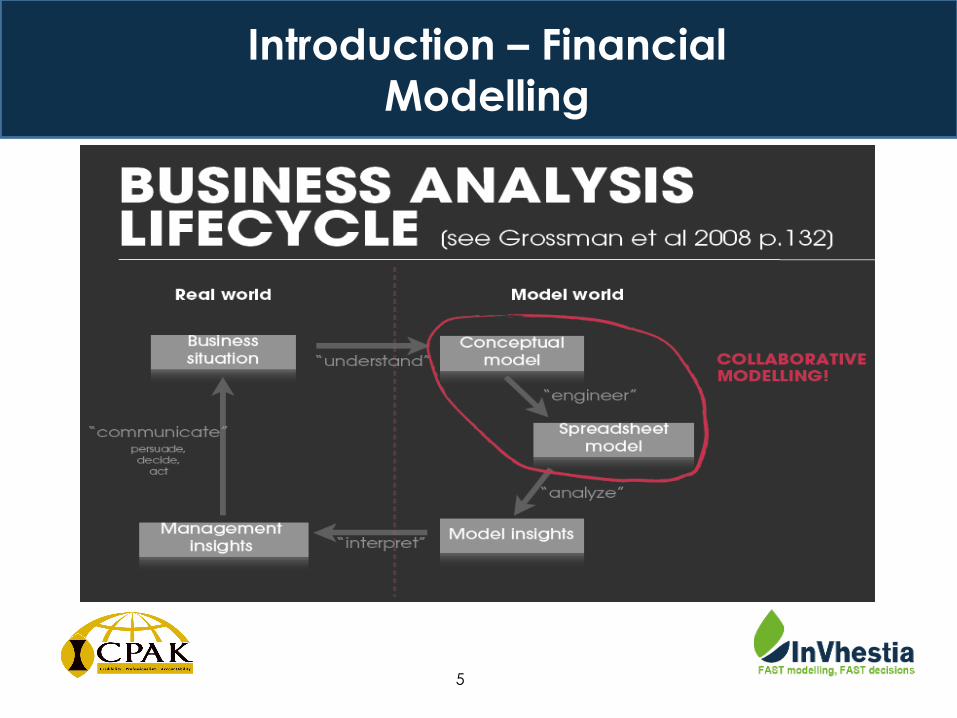
Too often, finance courses stop short of making a connection
between textbook finance and the problems of real-world business;
Financial Modelling bridges the gap between theory and practice by
providing a nuts-and-bolts guide to solving common finance
problems with spreadsheets.
Introduction – Financial
Modelling
5
Introduction – Financial
Modelling

6
Management accountants look ahead - they focus on forecasting, analysis and decision-making. They use various tools to advise on how the business can move forward;
Key amongst the tools used are budgets and forecasts to assist in strategic
decision-making. Decisions may include developing a new product line, acquiring another business, expanding into new territories and raising debt or equity;
The expectations that organizations have of a Management Accountant are that he/she should be able to generate timely, accurate & flexible reports & provide a rigorous analysis of the same.
The Modern Day Management Accountant is one who possesses the cutting edge financial modelling skill to be able to carry out analysis, create budgets and forecasts which are FAST.
Introduction - Today’s
Management Accountant
7
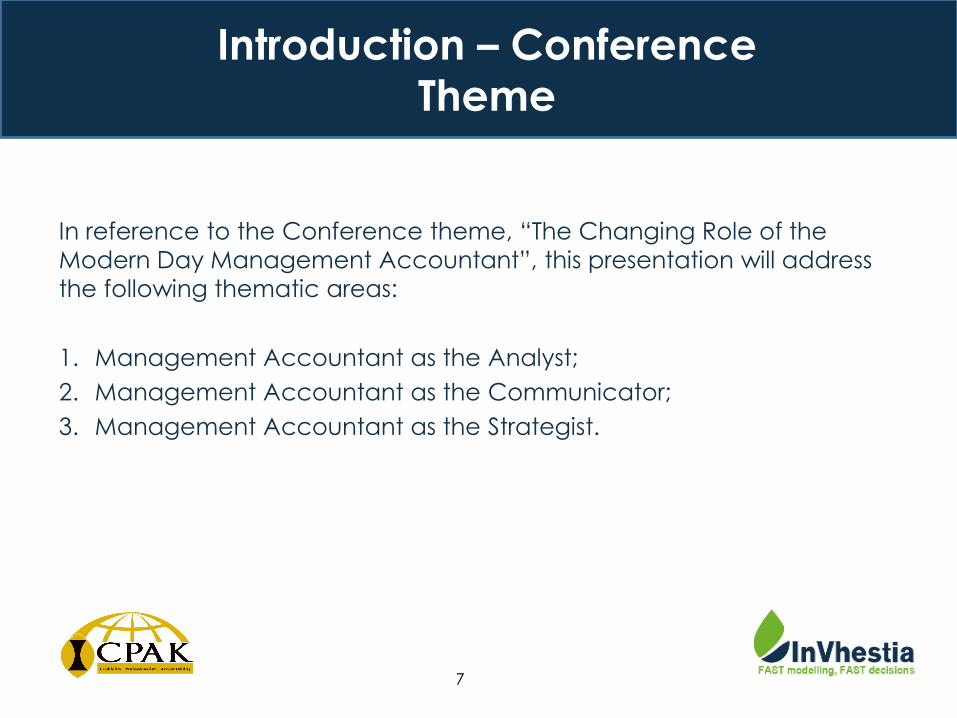
In reference to the Conference theme, “The Changing Role of the
Modern Day Management Accountant”, this presentation will address
the following thematic areas:
1. Management Accountant as the Analyst;
2. Management Accountant as the Communicator;
3. Management Accountant as the Strategist.
Introduction – Conference
Theme

8
Management Accountant as the Analyst
Case Study I – Financial Analysis

9
Case Study I – Financial
Analysis
This case is about a business in the education services sector;
The shareholders needed a forecast of their performance over a 5
year period. Additionally, a valuation was required to be used to
attract potential investors;
We built a financial model which made it easier to analyze the
financial performance of the business;
On a year on year basis, we were able to analyze both income and
expenditure per tutor, per student and per employee, amongst other
metrics.

10
Case Study I – Financial
Analysis Operating Metrics
2017 2018 2019 2020 2021 2022
Forecast Forecast Forecast Forecast Forecast Forecast
Student to tutor (both full time and part time) ratio 10 10 10 10 10 10
Student to Full Time Equivalent Tutors Required ratio 18 18 18 18 18 18
Income per FTE tutor 62,242 86,598 100,813 111,165 117,707 124,666
Tuition cost per FTE tutor 17,806 21,191 23,233 24,741 26,635 28,724
Forecast Income per long term Student 3,458 4,811 5,601 6,176 6,539 6,926
Advertising and Promotion Costs per student (921) (666) (484) (382) (317) (275)
Administrative Costs per student (1,445) (1,142) (995) (814) (730) (693)
Total expense per student (3,767) (3,007) (2,559) (2,209) (2,018) (1,923)
Key Growth Rates
2017 2018 2019 2020 2021 2022
Forecast Forecast Forecast Forecast Forecast Forecast
Long term student growth rate 163.89% 81.45% 44.49% 33.07% 26.58% 21.07%
Income growth 467.58% 152.45% 68.21% 46.73% 34.03% 28.23%
Total expenses growth 200.75% 44.83% 22.95% 14.87% 15.67% 15.38%
PAT growth 94.13% -80.77% -799.54% 88.50% 51.17% 36.88%
Key Ratios
2017 2018 2019 2020 2021 2022
Forecast Forecast Forecast Forecast Forecast Forecast
Gross Profit Margin 71.39% 75.53% 76.95% 77.74% 77.37% 76.96%
EBITDA Margin -37.55% 13.03% 31.27% 41.98% 46.51% 49.19%
PAT Margin -68.80% -5.24% 21.80% 28.00% 31.58% 33.71%

11
Management Accountant as the Communicator
Case Study II – Data Presentation

12
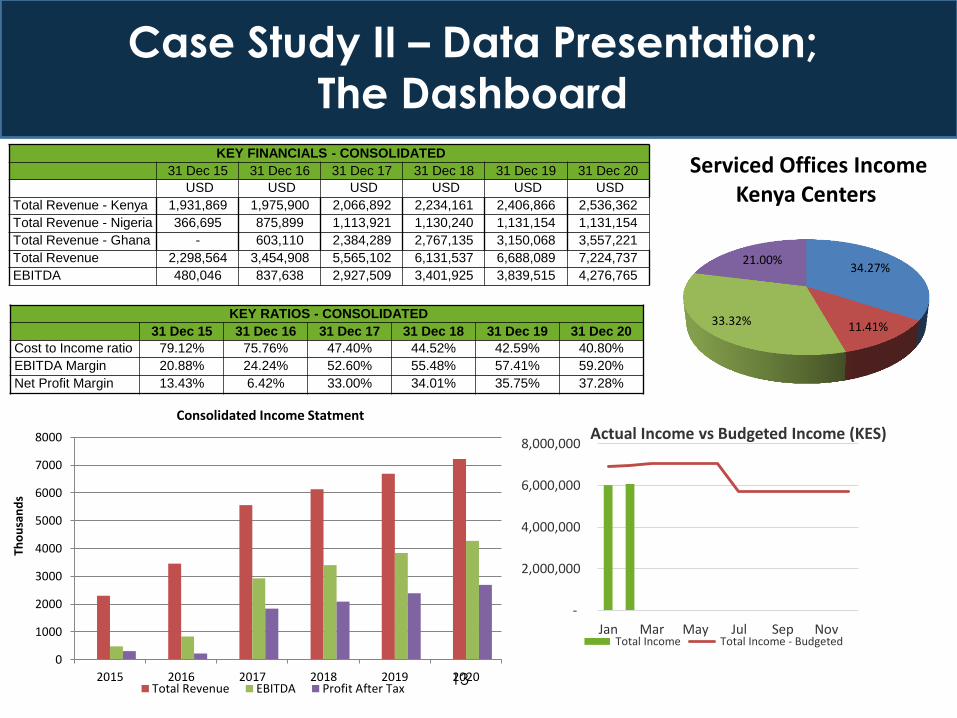
This case involves a business which offers managed offices in East & West Africa;
The assignment entailed building an operational financial model for the business, which was undergoing both expansion into new geographies as well as capital raising;
The business had various profit centers, financials in multiple currencies but still needed to be presented on a single platform in both a consolidated form and a country by country basis;
Upon building the financial model we used a dashboard to present the data. A dashboard is an effective tool for communicating complex financial data in a way that is easier on the eye of the audience.
Case Study II – Data Presentation
13
Case Study II – Data Presentation;
The Dashboard KEY FINANCIALS - CONSOLIDATED
31 Dec 15 31 Dec 16 31 Dec 17 31 Dec 18 31 Dec 19 31 Dec 20
USD USD USD USD USD USD
Total Revenue - Kenya 1,931,869 1,975,900 2,066,892 2,234,161 2,406,866 2,536,362
Total Revenue - Nigeria 366,695 875,899 1,113,921 1,130,240 1,131,154 1,131,154
Total Revenue - Ghana - 603,110 2,384,289 2,767,135 3,150,068 3,557,221
Total Revenue 2,298,564 3,454,908 5,565,102 6,131,537 6,688,089 7,224,737
EBITDA 480,046 837,638 2,927,509 3,401,925 3,839,515 4,276,765
KEY RATIOS - CONSOLIDATED
31 Dec 15 31 Dec 16 31 Dec 17 31 Dec 18 31 Dec 19 31 Dec 20
Cost to Income ratio 79.12% 75.76% 47.40% 44.52% 42.59% 40.80%
EBITDA Margin 20.88% 24.24% 52.60% 55.48% 57.41% 59.20%
Net Profit Margin 13.43% 6.42% 33.00% 34.01% 35.75% 37.28%
0
1000
2000
3000
4000
5000
6000
7000
8000
2015 2016 2017 2018 2019 2020
Tho
usa
nd
s
Total Revenue EBITDA Profit After Tax
Consolidated Income Statment
34.27%
11.41% 33.32%
21.00%
Serviced Offices Income Kenya Centers
-
2,000,000
4,000,000
6,000,000
8,000,000
Jan Mar May Jul Sep Nov
Actual Income vs Budgeted Income (KES)
Total Income Total Income - Budgeted

14
KEY FINANCIALS - CONSOLIDATED
31 Dec 15 31 Dec 16 31 Dec 17 31 Dec 18 31 Dec 19 31 Dec 20
USD USD USD USD USD USD
Total Revenue - Kenya 1,931,869 1,975,900 2,066,892 2,234,161 2,406,866 2,536,362
Total Revenue - Nigeria 366,695 875,899 1,113,921 1,130,240 1,131,154 1,131,154
Total Revenue - Ghana - 603,110 2,384,289 2,767,135 3,150,068 3,557,221
Total Revenue 2,298,564 3,454,908 5,565,102 6,131,537 6,688,089 7,224,737
EBITDA 480,046 837,638 2,927,509 3,401,925 3,839,515 4,276,765
KEY RATIOS - CONSOLIDATED
31 Dec 15 31 Dec 16 31 Dec 17 31 Dec 18 31 Dec 19 31 Dec 20
Cost to Income ratio 79.12% 75.76% 47.40% 44.52% 42.59% 40.80%
EBITDA Margin 20.88% 24.24% 52.60% 55.48% 57.41% 59.20%
Net Profit Margin 13.43% 6.42% 33.00% 34.01% 35.75% 37.28%
The Dashboard 1/2

15
The Dashboard 2/2
0
1000
2000
3000
4000
5000
6000
7000
8000
2015 2016 2017 2018 2019 2020
Tho
usa
nd
s
Total Revenue EBITDA Profit After Tax
Consolidated Income Statment
34.27%
11.41% 33.32%
21.00%
Serviced Offices Income Kenya Centers
-
2,000,000
4,000,000
6,000,000
8,000,000
Jan Feb Mar Apr May Jun Jul Aug Sep Oct Nov Dec
Actual Income vs Budgeted Income (KES)
Total Income Total Income - Budgeted

16
Management Accountant as the Strategist
Case Study III – Strategy
17
Case Study III – Strategy
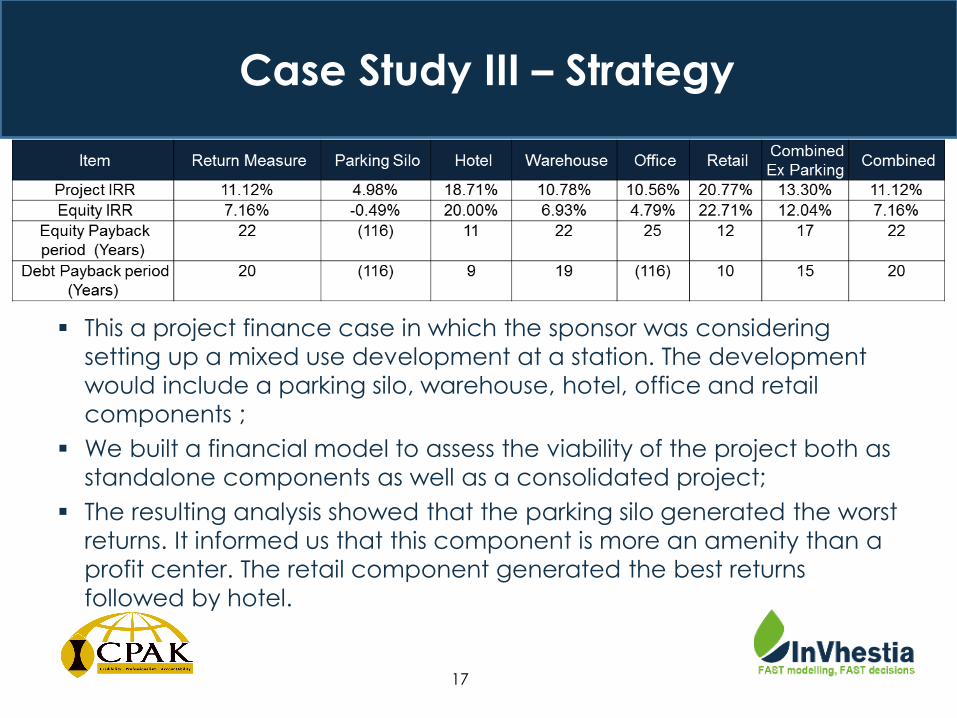
This a project finance case in which the sponsor was considering
setting up a mixed use development at a station. The development
would include a parking silo, warehouse, hotel, office and retail
components ;
We built a financial model to assess the viability of the project both as
standalone components as well as a consolidated project;
The resulting analysis showed that the parking silo generated the worst
returns. It informed us that this component is more an amenity than a
profit center. The retail component generated the best returns
followed by hotel.

18
Introduction to the FAST Standard
Methodology
19
The FAST Standard
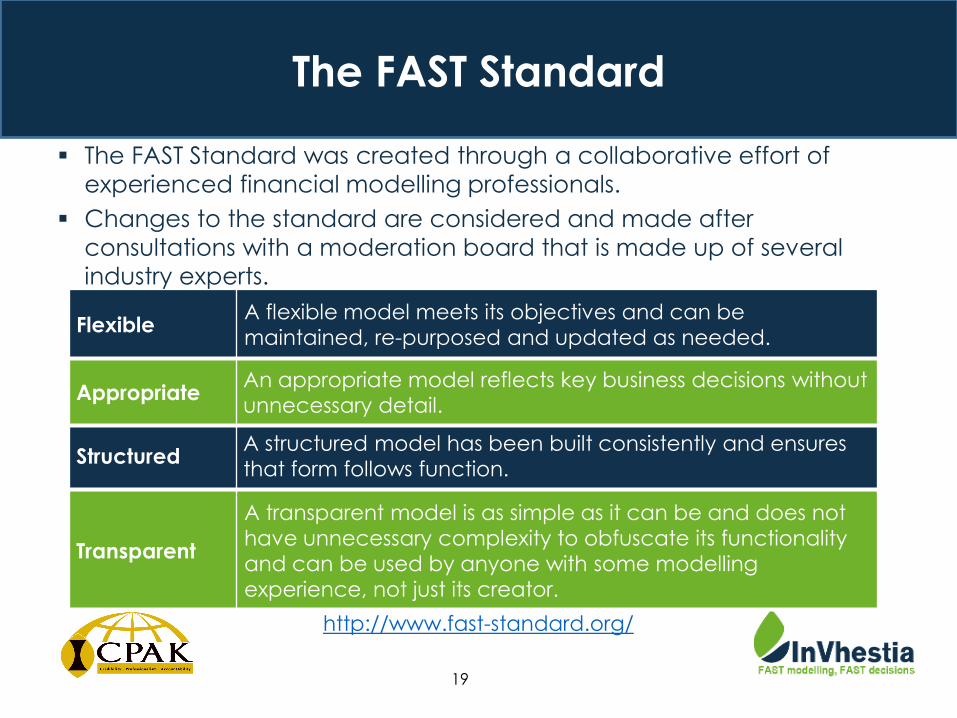
The FAST Standard was created through a collaborative effort of
experienced financial modelling professionals.
Changes to the standard are considered and made after
consultations with a moderation board that is made up of several
industry experts.
Transparent
A transparent model is as simple as it can be and does not
have unnecessary complexity to obfuscate its functionality
and can be used by anyone with some modelling
experience, not just its creator.
Structured A structured model has been built consistently and ensures
that form follows function.
Appropriate An appropriate model reflects key business decisions without
unnecessary detail.
Flexible A flexible model meets its objectives and can be
maintained, re-purposed and updated as needed.
http://www.fast-standard.org/
20
FAST Standard Users FAST Users

21
Who are we?

22
About Invhestia
InVhestia Africa Limited (www.invhestia.com) is a boutique project &
corporate finance advisory firm. We help firms in their decision-making
be they strategic, operational or financial by quantifying such decisions
and offering in depth analysis.
Advisory and consulting
Deal Structuring
Valuation
Negotiation
Project Appraisal
Financial modelling Solutions
(Model build, audit, training)
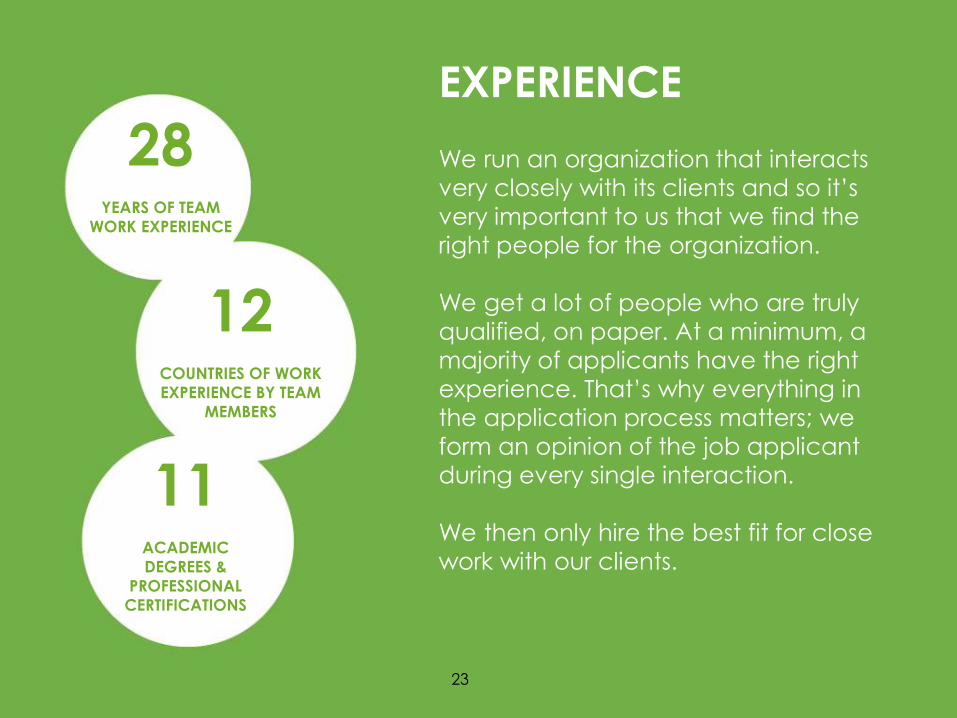
EXPERIENCE
We run an organization that interacts
very closely with its clients and so it’s
very important to us that we find the
right people for the organization.
We get a lot of people who are truly
qualified, on paper. At a minimum, a
majority of applicants have the right
experience. That’s why everything in
the application process matters; we
form an opinion of the job applicant
during every single interaction.
We then only hire the best fit for close
work with our clients.
28 YEARS OF TEAM
WORK EXPERIENCE
12 COUNTRIES OF WORK
EXPERIENCE BY TEAM
MEMBERS
11 ACADEMIC
DEGREES &
PROFESSIONAL
CERTIFICATIONS
23

24
Value Proposition
•We have years of practical experience working with entrepreneurs, corporates and project promoters across the East African economy, enhancing our knowledge of sectors;
•Our ability to originate & structure deals and problem solve is exhibited by our diverse portfolio of clients.
Advisory
•We have a team of financial modellers & analysts who are certified by the FAST Standard organization;
•The team has experience in financial modelling & model audits for businesses in various industries including FMCG, power, real estate, financial services & education.
Financial Modelling Assignments
(Model Build & Audit)
•The financial modelling courses offered by Invhestia are FAST Accredited;
•The courses are based on case studies and simulate the real business environment faced by participants.
Financial Modelling Training
•We offer the FAST Certification for financial modellers. This certificate, being internationally recognized, will set you apart from other modellers.
Certification

25
Financial Modelling
Training
Courses
Introduction to Financial Modelling and Data Analysis
Budgeting and Forecasting Financial Modelling
Corporate Finance and Valuation Financial Modelling*
Project Finance Financial Modelling**
Online Financial Modelling
FAST Level 1 Certification
* - This course has three versions: Manufacturing, Insurance, and Banking concerns
** - This course has two versions: Real Estate and Infrastructure concerns
26
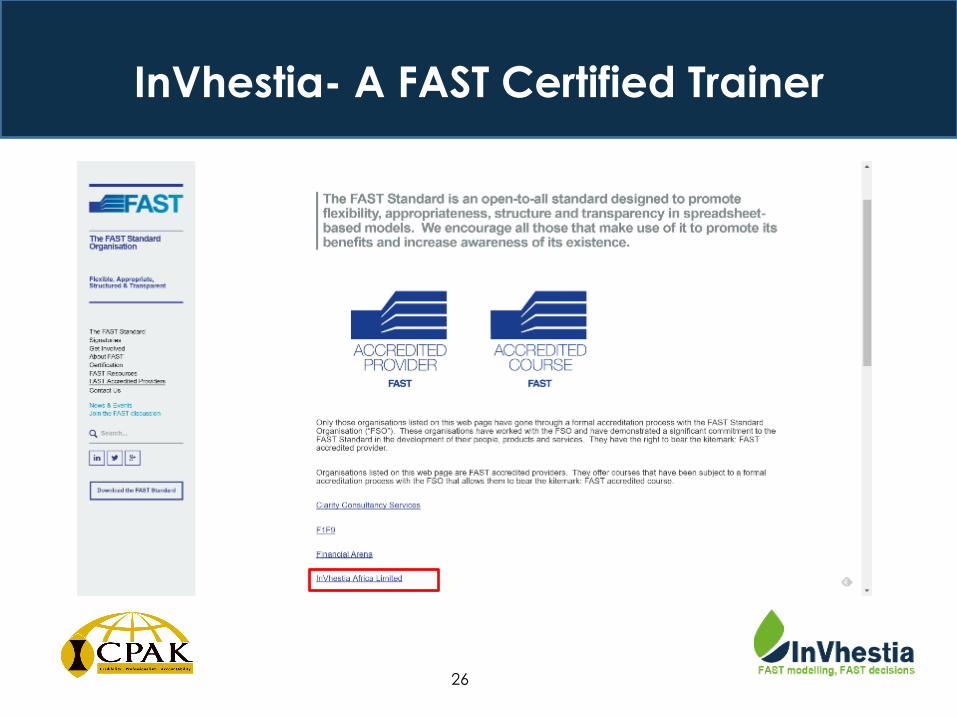
InVhestia- A FAST Certified Trainer
27
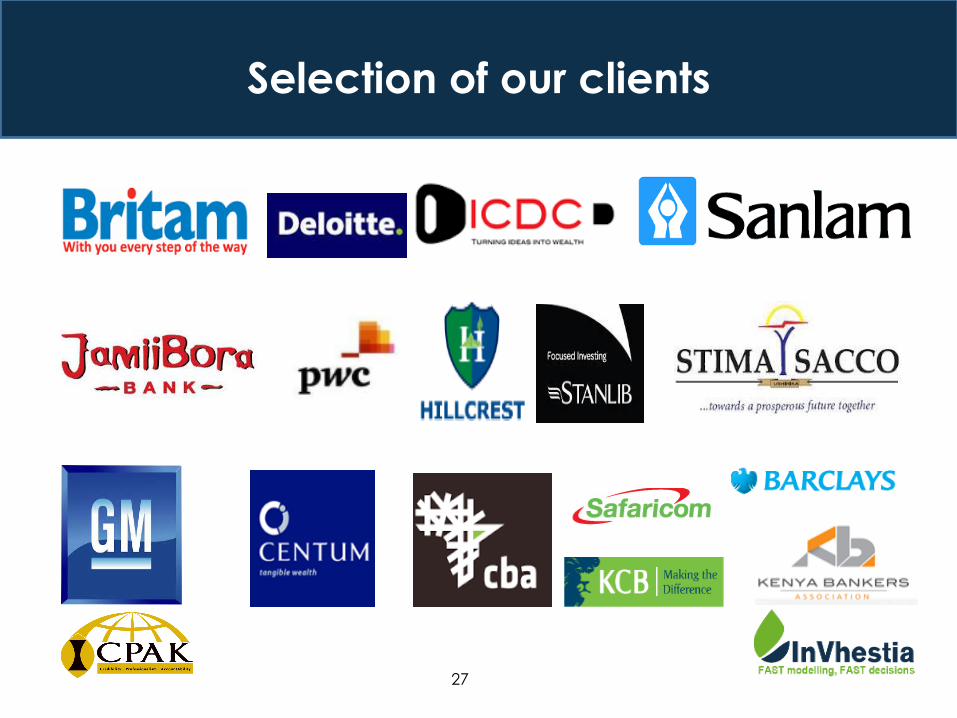
Selection of our clients

28

Industry Experts
InVhestia Africa Limited Ground Floor, Block B, Methodist Center, Lavington P.O. Box 24350 - 00100 Nairobi
Call us on +254 (0) 20 44 00 692
[email protected] www.invhestia.com