11/6/2015 FY2010 Final Budget · 11/6/2015 FY2010 Final Budget
Upload
oliver-brendan-grayCategory
view
215download
1
Budget UpdateOctober 22, 2010

Today’s Presentation
• Budget Summaries
• FY2010 Results
• FY2011 Update
• FY2012 Projection
• Next Steps
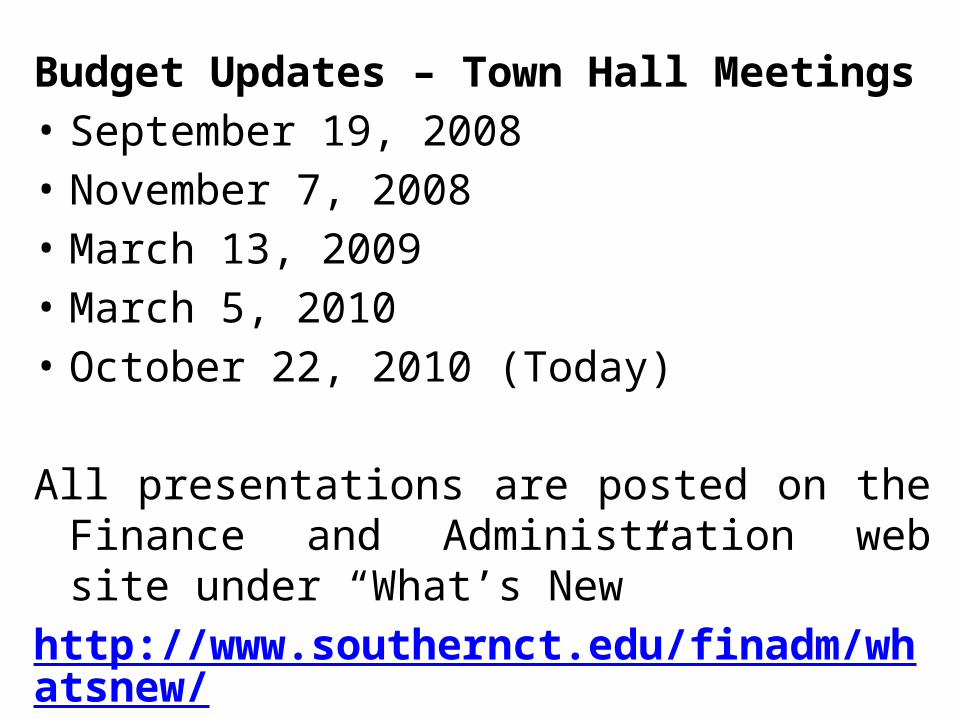
Budget Updates – Town Hall Meetings• September 19, 2008• November 7, 2008• March 13, 2009• March 5, 2010• October 22, 2010 (Today)
All presentations are posted on the Finance and Administration web site under “What’s New”
http://www.southernct.edu/finadm/whatsnew/

Personal Services 2006 2007 2008 2009 2010
Full-Time Personnel 58,815,523
61,376,973 65,815,182 69,611,436 62,966,390
Lecturer Teaching
8,314,200
9,360,084
9,751,694
10,306,113
11,502,143
Lecturer Non-Teaching
772,469
745,817
967,903
826,823
755,707
University Assistants
2,140,279
2,126,285
2,136,212
1,624,351
1,382,642
Over time
1,006,099
1,083,783
1,213,605
869,175
859,397
Rehire Retirees
77,082
156,831
273,428
295,923
550,811
Total
$71,125,652
$74,849,773
$80,158,024
$83,533,821
$78,017,090
SCSU Personal Services History
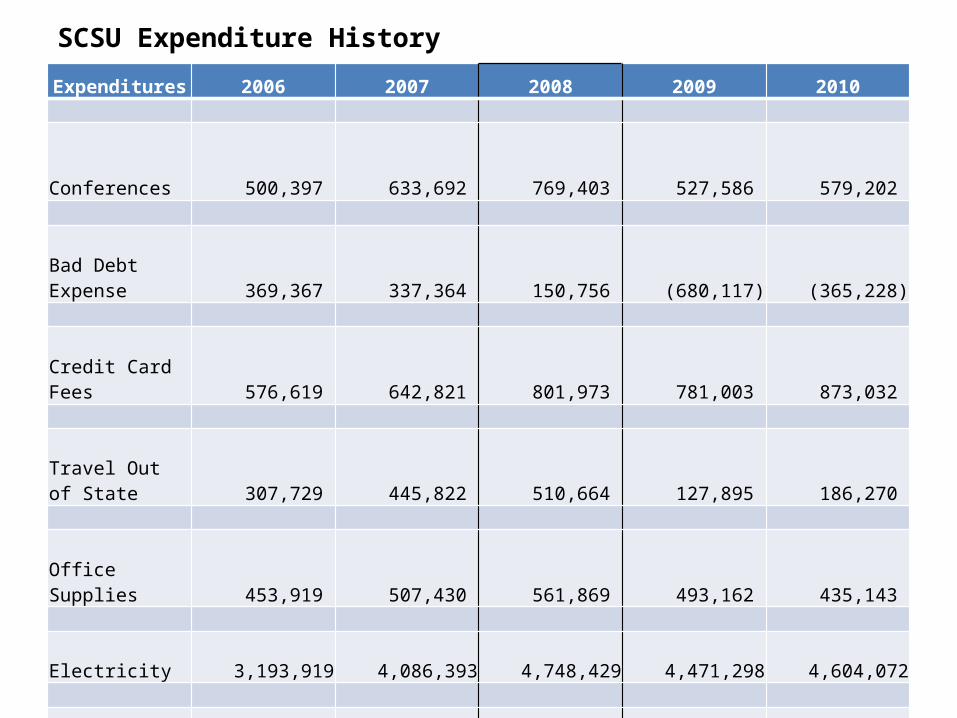
Expenditures 2006 2007 2008 2009 2010
Conferences
500,397
633,692
769,403
527,586
579,202
Bad Debt Expense
369,367
337,364
150,756
(680,117)
(365,228)
Credit Card Fees
576,619
642,821
801,973
781,003
873,032
Travel Out of State
307,729
445,822
510,664
127,895
186,270
Office Supplies
453,919
507,430
561,869
493,162
435,143
Electricity 3,193,919 4,086,393 4,748,429 4,471,298 4,604,072
Heat 1,898,175 1,888,492 2,373,396 1,746,030 1,645,840
Total
$7,300,125
$8,542,014
$9,916,490
$7,466,857
$7,958,331
SCSU Expenditure History
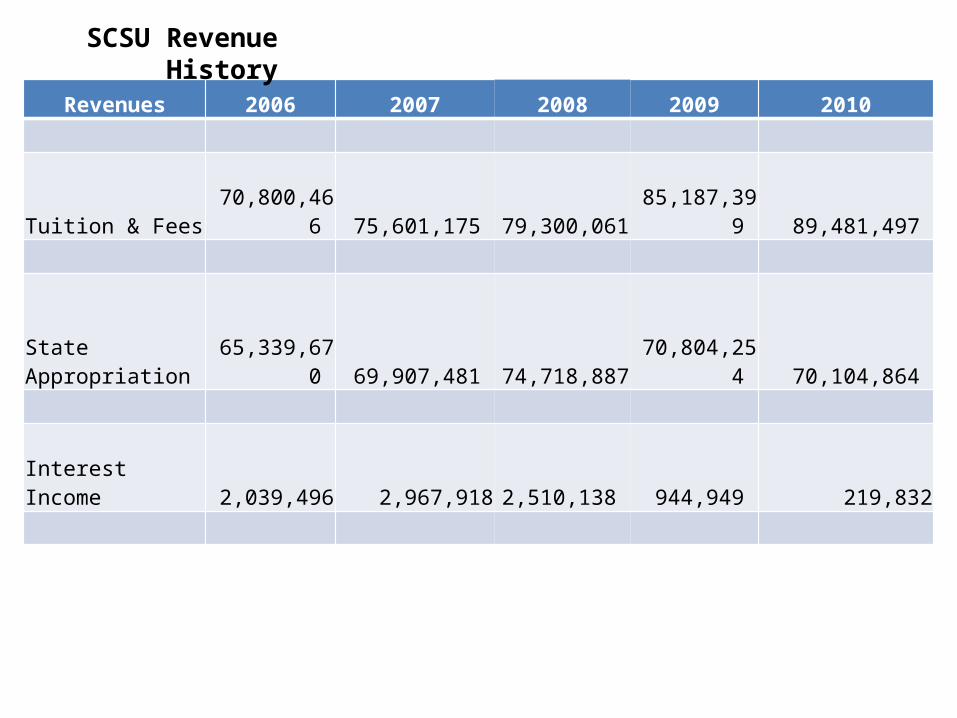
Revenues 2006 2007 2008 2009 2010
Tuition & Fees
70,800,466
75,601,175 79,300,061 85,187,399 89,481,497
State Appropriation
65,339,670
69,907,481
74,718,887
70,804,254 70,104,864
Interest Income
2,039,496
2,967,918
2,510,138
944,949 219,832
SCSU Revenue History

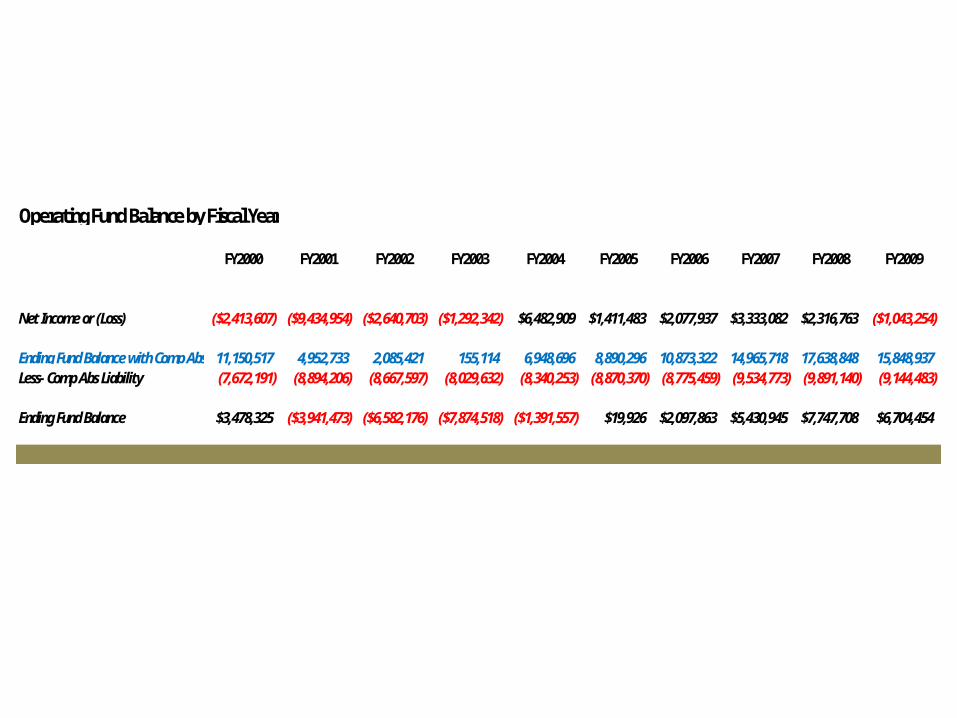
FY2000 FY2001 FY2002 FY2003 FY2004 FY2005 FY2006 FY2007 FY2008 FY2009
Net Income or (Loss) ($2,413,607) ($9,434,954) ($2,640,703) ($1,292,342) $6,482,909 $1,411,483 $2,077,937 $3,333,082 $2,316,763 ($1,043,254)
Ending Fund Balance with Comp Abs 11,150,517 4,952,733 2,085,421 155,114 6,948,696 8,890,296 10,873,322 14,965,718 17,638,848 15,848,937Less- Comp Abs Liability (7,672,191) (8,894,206) (8,667,597) (8,029,632) (8,340,253) (8,870,370) (8,775,459) (9,534,773) (9,891,140) (9,144,483)
Ending Fund Balance $3,478,325 ($3,941,473) ($6,582,176) ($7,874,518) ($1,391,557) $19,926 $2,097,863 $5,430,945 $7,747,708 $6,704,454
Operating Fund Balance by Fiscal Year

FY 2010

FY2010FY 2009-2010 Income Statement Comparison
FY09 FY10 ChangeTuition & Fees 85,187,399$ 89,481,497$ 4,294,098$ Room/Board 18,906,558 20,404,218 1,497,660State Appropriation 70,804,254 71,513,160 708,905Interest Income 944,950 219,832 (725,118)All Other Revenue 2,817,370 5,165,542 2,348,172Total Revenue 178,660,531 186,784,249 8,123,717Full-Time Salary Expenses 69,611,436 62,966,390 (6,362,610)Part-Time Salary Expenses 1,526,622 1,634,441 107,495Lecturers- Teaching & Non Teaching Salary Expenses 11,132,937 11,938,703 815,370University Assistants Salary Expenses 1,624,351 1,382,643 (209,532)Graduate Assts. & Interns Salary Expenses 508,797 552,685 (24,676)Student Labor Salary Expenses 2,870,936 2,799,304 (116,131)Other Salary Expenses 4,504,376 3,131,036 (1,340,135)Fringe Expenses 34,971,197 34,218,974 (694,981)Total Personnel Services Expense 126,750,651 118,624,176 (8,126,475)Total OE & Equipment 41,597,595 44,467,607 2,055,479Total Transfers 11,355,538 10,826,466 (95,341)
Net Income /(Loss) (1,043,254) 12,866,000$

FY2010Operating Fund Balance and Commitments
FY2010
Net Income or (Loss) 12,866,000$
Ending Fund Balance with Comp Abs 29,225,469 Less-Comp Abs Liability (9,655,015)
Ending Fund Balance 19,570,454
Actions to Effect FY2011State of CT Reduction of General Fund Appropriation (SCSU Portion) (3,812,567) Unfunded Contract Mandates- FY2011 (2,004,793)
Actions to Effect FY201227th Payroll (Operating portion)* (1,510,343) * Assumes that the General Fund protion is funded in FY2012 as requested.
Actions to Effect FY2013-15RIP from FY2009- Vacation & Sick Accrual Payouts (2,547,821)
Total Ending Fund Balance with action to effect FY2011-2015 9,694,930$

Brenda L. Sisco, Acting Secretary for the Office of Policy and Management outlined the following in her letter to State agency heads on August 13, 2010:
“The fiscal and economic situation facing thestate will present extraordinary challenges
for the next biennium.”
The State of Connecticut:• Has borrowed over $900 million to close the FY2009 deficit• Balanced the FY2009 – 2011 biennium by exhausting the $1.3
billion rainy day fund and using approximately $1.7 billion in federal stimulus funds (that will not be available in the next biennium FY2011 – 2013).
• Did not fully fund the state’s pension obligations• Is planning to borrow approximately $700 million to balance the
FY2011 budget.
Budget Update
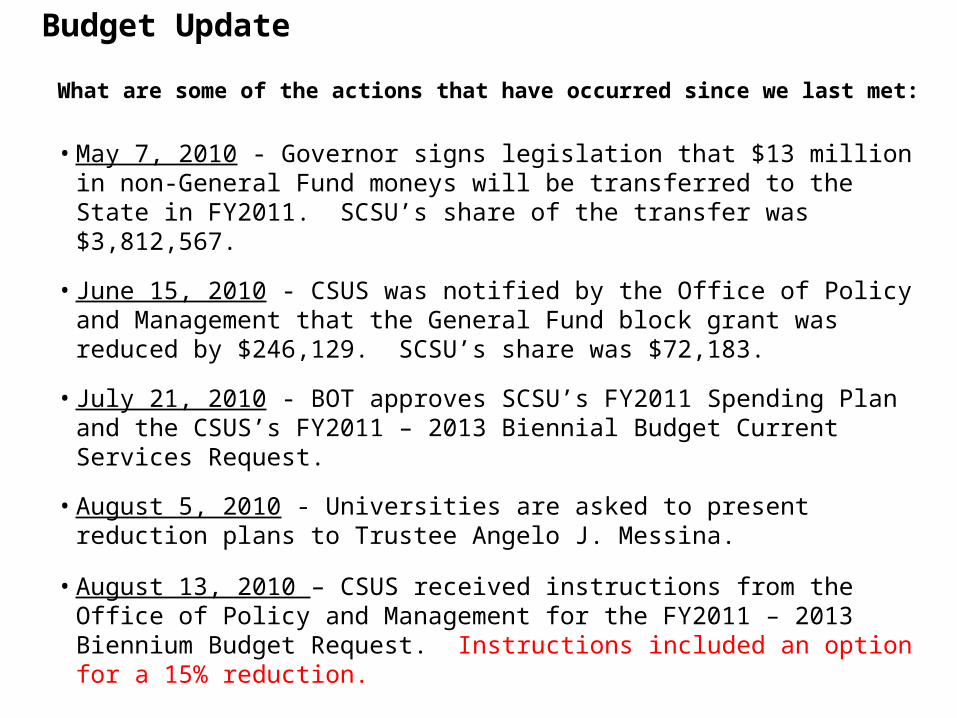
What are some of the actions that have occurred since we last met:
• May 7, 2010 - Governor signs legislation that $13 million in non-General Fund moneys will be transferred to the State in FY2011. SCSU’s share of the transfer was $3,812,567.
• June 15, 2010 - CSUS was notified by the Office of Policy and Management that the General Fund block grant was reduced by $246,129. SCSU’s share was $72,183.
• July 21, 2010 - BOT approves SCSU’s FY2011 Spending Plan and the CSUS’s FY2011 – 2013 Biennial Budget Current Services Request.
• August 5, 2010 - Universities are asked to present reduction plans to Trustee Angelo J. Messina.
• August 13, 2010 – CSUS received instructions from the Office of Policy and Management for the FY2011 – 2013 Biennium Budget Request. Instructions included an option for a 15% reduction.
Budget Update
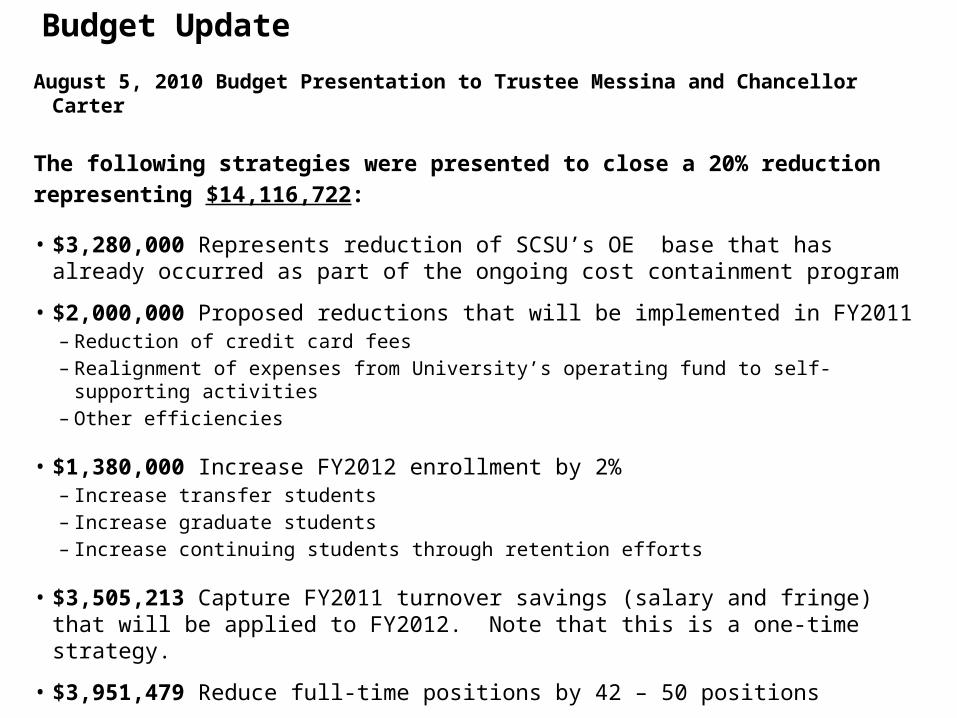
August 5, 2010 Budget Presentation to Trustee Messina and Chancellor Carter
The following strategies were presented to close a 20% reductionrepresenting $14,116,722:
• $3,280,000 Represents reduction of SCSU’s OE base that has already occurred as part of the ongoing cost containment program
• $2,000,000 Proposed reductions that will be implemented in FY2011 – Reduction of credit card fees– Realignment of expenses from University’s operating fund to self-supporting activities– Other efficiencies
• $1,380,000 Increase FY2012 enrollment by 2%– Increase transfer students– Increase graduate students– Increase continuing students through retention efforts
• $3,505,213 Capture FY2011 turnover savings (salary and fringe) that will be applied to FY2012. Note that this is a one-time strategy.
• $3,951,479 Reduce full-time positions by 42 – 50 positions
Budget Update

FY 2011
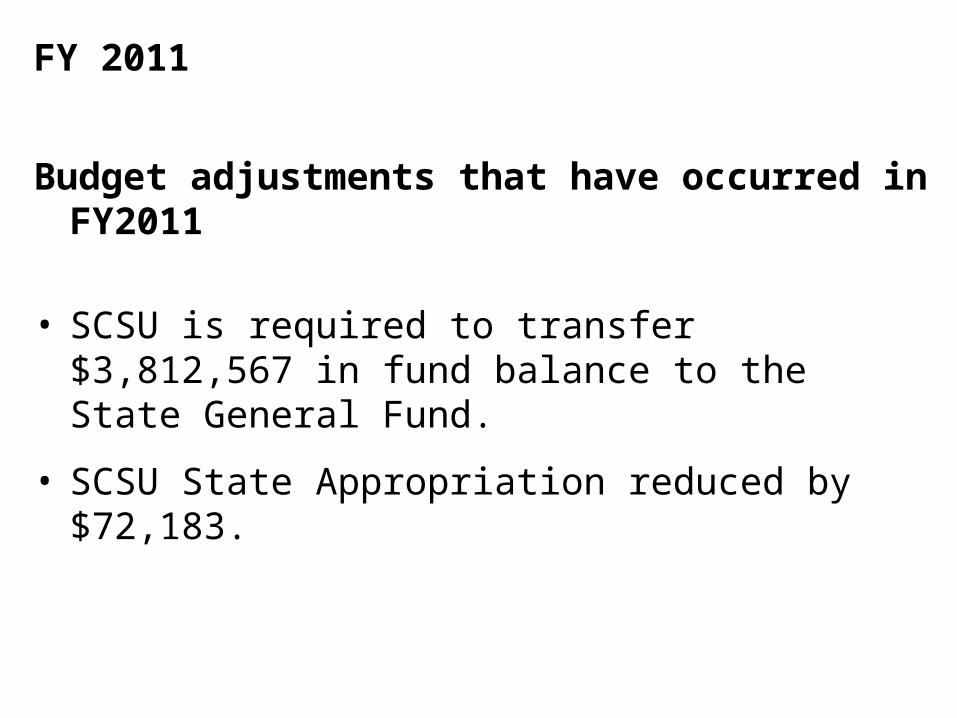
FY 2011
Budget adjustments that have occurred in FY2011
• SCSU is required to transfer $3,812,567 in fund balance to the State General Fund.
• SCSU State Appropriation reduced by $72,183.

FY 2011
Fall 2010 Enrollment as of the Third Week Census:• Freshman cohort: 1,248 students; just two short of 1,250 goal
• New transfer students: a record 947 students
• Overall Graduate students: up 2% from Fall 2009 (1,000 students)
• Part time Undergraduate students: up 4.4% or 54 students
• Part time Graduate students: down 2.4% or 53 students Retention:• First Year retention rate was 78.3% (down 1.4% from previous year)
• Second Year retention rate of 67.2% (up 4.6% from previous year)
• Third Year retention rate of 58.3% (up 4.3% from previous year)
Results/impact• Overall head count is up 1.3 % or 149 students
• Overall FTE is up 2 % or 183 FTE’s

Bargaining Unit
Total Positions Total Dollars
Projected Positions
Projected Actuals Projected Year-End Variance
Fringe Benefit Savings
Total Projected Savings
AAUP - Teaching 444
$33,947,161
424 $32,829,685 20
$1,117,476
$420,506
$1,537,982
Counselors 3
237,734 3 239,732 -
(1,998) (752)
(2,750)
Librarians 14
1,102,956
14 1,090,590 -
12,366 4,653
17,019
Coaches 24
1,493,204
24 1,488,772 -
4,432 1,668
6,100
Clerical 129
5,987,842
129 5,994,124 -
(6,282) (3,774)
(10,056)
Maintenace 130
5,578,948
125 5,100,726 5 478,222 303,862
782,084
A & R 12
786,146
12 770,391 -
15,755 9,032
24,787
Protective Services 26
1,522,227
26 1,550,044 -
(27,817) (15,736)
(43,553)
Healthcare 1
92,468 3 267,614 (2)
(175,146) (99,781)
(274,927)
SUOAF 198
14,443,990
200 14,855,531 (2)
(411,541) (159,966)
(571,507)
Mgt Confidential 42
4,701,485
41 4,765,215 1
(63,730) (22,943)
(86,673)
Grand Total 1,023
$69,894,161
*1,001
$68,952,423 22
$941,737 $436,769
$1,378,506
FY 2011 Spending Plan:
* position count is 952 as of 09/23/10 payroll.

FY 2012
FY 2012
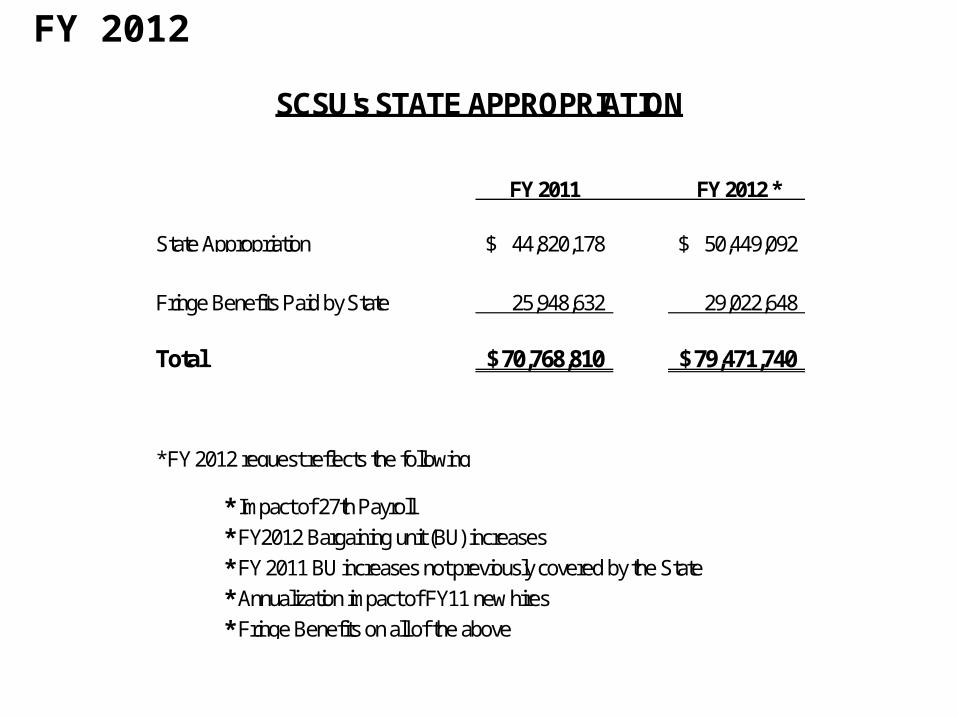
FY 2011 FY 2012 *
44,820,178$ 50,449,092$
Fringe Benefits Paid by State 25,948,632 29,022,648
70,768,810$ 79,471,740$
* FY 2012 request reflects the following:
* Impact of 27th Payroll
* FY2012 Bargaining unit (BU) increases
* FY 2011 BU increases not previously covered by the State
* Annualization impact of FY11 new hires
* Fringe Benefits on all of the above
SCSU's STATE APPROPRIATION
State Appropriation
Total

The CSUS was required to submit a budget option for a 15% reduction in its State Appropriation.
SCSU’s Share is:
SCSU Share:5% 10% 15% 20%
$3,973,587 $7,947,174 $ 11,920,761 $15,894,348
FY 2012
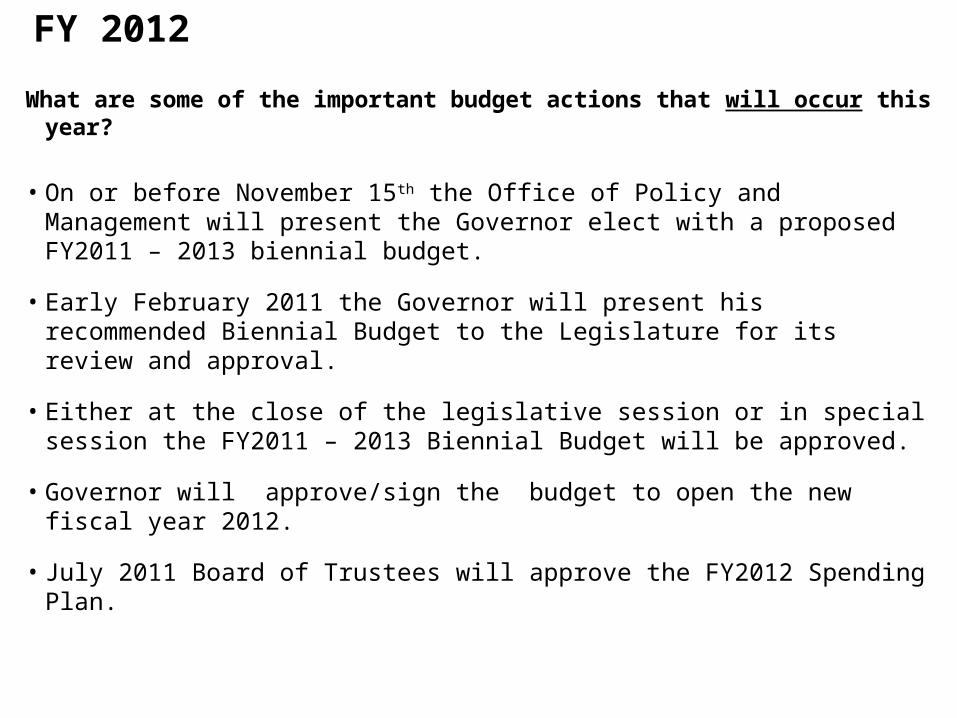
What are some of the important budget actions that will occur this year?
• On or before November 15th the Office of Policy and Management will present the Governor elect with a proposed FY2011 – 2013 biennial budget.
• Early February 2011 the Governor will present his recommended Biennial Budget to the Legislature for its review and approval.
• Either at the close of the legislative session or in special session the FY2011 – 2013 Biennial Budget will be approved.
• Governor will approve/sign the budget to open the new fiscal year 2012.
• July 2011 Board of Trustees will approve the FY2012 Spending Plan.
FY 2012
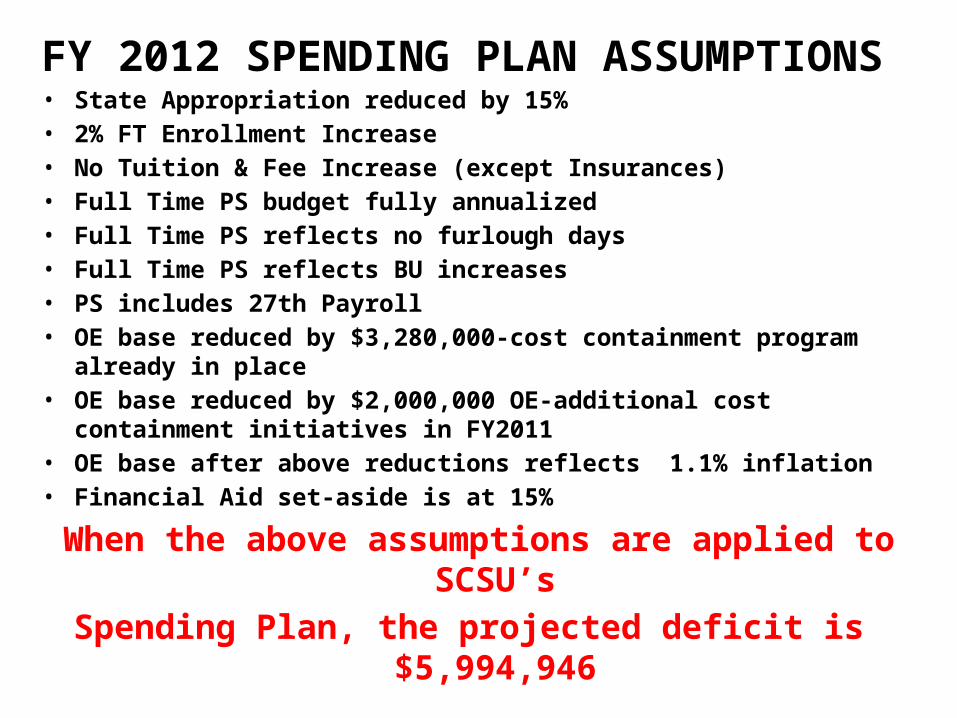
FY 2012 SPENDING PLAN ASSUMPTIONS• State Appropriation reduced by 15% • 2% FT Enrollment Increase• No Tuition & Fee Increase (except Insurances)• Full Time PS budget fully annualized• Full Time PS reflects no furlough days• Full Time PS reflects BU increases• PS includes 27th Payroll• OE base reduced by $3,280,000-cost containment program already in place• OE base reduced by $2,000,000 OE-additional cost containment initiatives
in FY2011• OE base after above reductions reflects 1.1% inflation• Financial Aid set-aside is at 15%
When the above assumptions are applied to SCSU’sSpending Plan, the projected deficit is $5,994,946

Guiding Principles (March 2009)
• Support and enhance the student academic experience • Support and enhance the student life experience on campus• Provide for sufficient qualified faculty and staff and an academically sound
faculty/student ratio to support the teaching-learning mission of the university– Prevent lay-offs of full-time faculty and staff– Address budgetary gaps caused by vacancies (e.g., early or scheduled retirements)
in a manner consistent with advancement of the USP
• Maintain enrollment to reflect appropriate mix of students (11,800 and 12,300 students –distributed through retention, transfer students, part-time students and a growing graduate student population, with a maximum enrollment of 1,350 for full-time entering freshman)
• Maintain a healthy (both physical and psychological) campus environment• Maintain appropriate student, faculty, and staff access to the campus and University
services, such that student success and learning are not impinged• Ensure that University assets are safeguarded• Comply with all governing laws, policies and procedures set forth by governing bodies
(Federal, State, NEASC, CSUS BOT) and accrediting bodies for academic programs/schools within the University
Guiding Principles (March 2009)
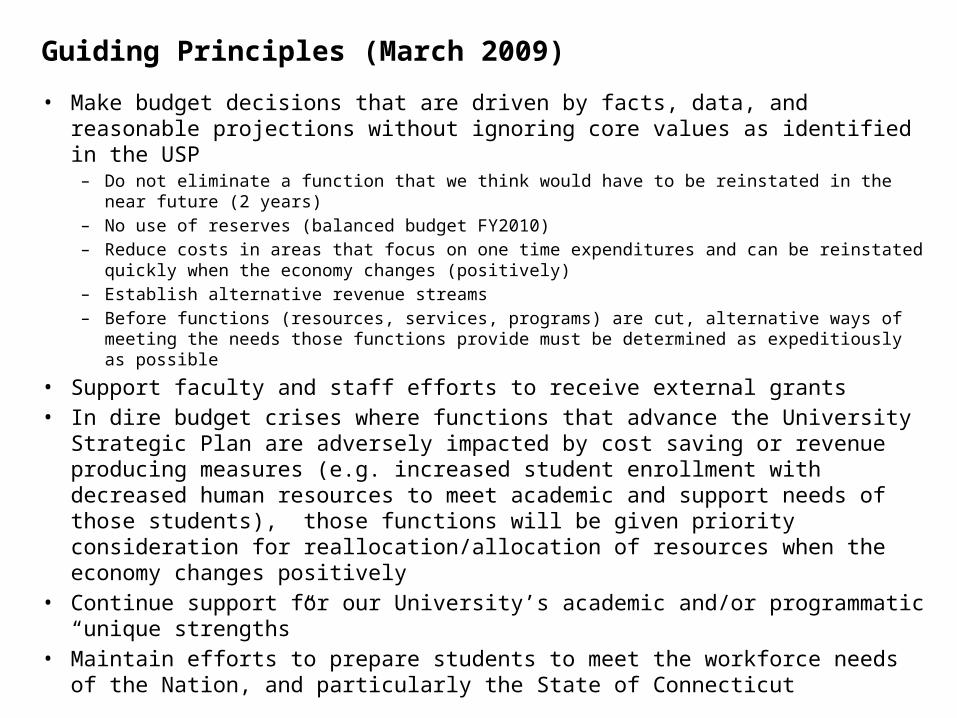
• Make budget decisions that are driven by facts, data, and reasonable projections without ignoring core values as identified in the USP
– Do not eliminate a function that we think would have to be reinstated in the near future (2 years)– No use of reserves (balanced budget FY2010)– Reduce costs in areas that focus on one time expenditures and can be reinstated quickly when
the economy changes (positively)– Establish alternative revenue streams– Before functions (resources, services, programs) are cut, alternative ways of meeting the needs
those functions provide must be determined as expeditiously as possible
• Support faculty and staff efforts to receive external grants• In dire budget crises where functions that advance the University Strategic Plan
are adversely impacted by cost saving or revenue producing measures (e.g. increased student enrollment with decreased human resources to meet academic and support needs of those students), those functions will be given priority consideration for reallocation/allocation of resources when the economy changes positively
• Continue support for our University’s academic and/or programmatic “unique strengths”
• Maintain efforts to prepare students to meet the workforce needs of the Nation, and particularly the State of Connecticut

These Principles give us guidancebut do not solve (close) the gap.

Options to close the Gap
• Hold positions vacant
• Increase Enrollment
• Other Efficiencies
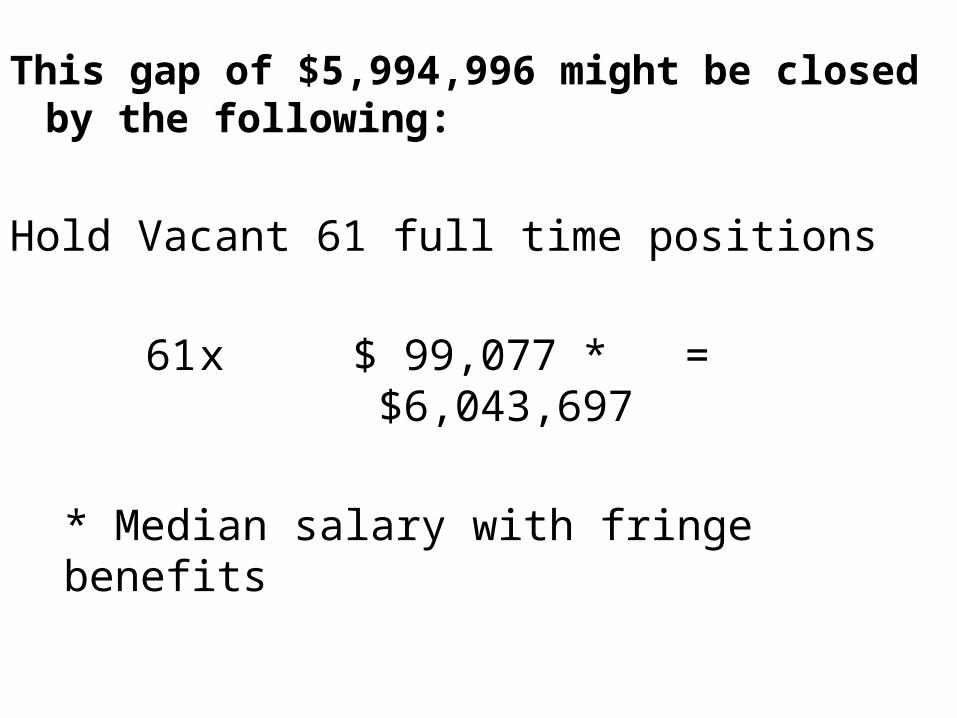
This gap of $5,994,996 might be closed by the following:
Hold Vacant 61 full time positions
61 x $ 99,077 * = $6,043,697
* Median salary with fringe benefits

PERSONNELSUMMARY OF SEPARATIONS BY FISCAL YEAR
55 positions to remain
vacant
Bargaining Unit FY2004 FY2005 FY2006 FY2007 FY2008 FY2009 * FY2010 Average
Average FY2012 Salary
Average Position X
Dollars
Faculty 12 24 28 24 38 52 25 25 $ 76,862
$1,921,551
Counselors 1 1 - 76,420
-
Librarians 1 2 2 1 1 76,078
76,078
Coaches 1 2 2 1 1 60,444
60,444
A & R 1 - - 65,267
-
Clerical 4 6 11 6 5 24 2 6 48,862 293,174
Maintenance 17 9 6 9 5 22 1 8 42,607 340,852
Protective Services 3 2 5 2 1 2 58,786
117,571
SUOAF 10 16 11 11 8 19 3 10 73,306 733,060
Mgt 5 4 2 3 1 8 3 3 106,983 320,950
Total 53 61 62 53 64 132 37 55 $68,329
3,863,680
F/B @ 45%
1,738,656
$5,602,336
*Note: FY 2009 is excluded from the calculation of the average because of the Retirement Incentive Program.
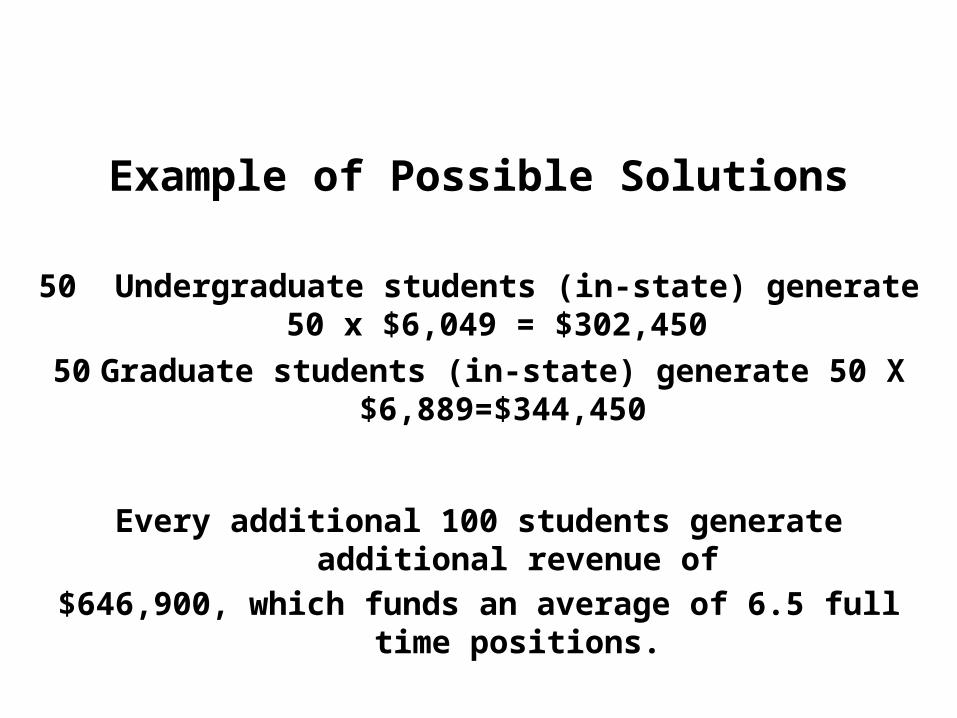
Example of Possible Solutions
50 Undergraduate students (in-state) generate 50 x $6,049 = $302,45050 Graduate students (in-state) generate 50 X $6,889=$344,450
Every additional 100 students generate additional revenue of$646,900, which funds an average of 6.5 full time positions.
WHAT IS THE BIGGEST CHALLENGE IN CLOSING THE GAP?
The biggest challenge will be determining whatpositions are to be held permanently vacant.
Guiding Principles (March 2009)
“Address budgetary gaps caused by vacancies (e.g., earlyor scheduled retirements) in a manner consistent with
advancement of the USP”

Planning Process:
• Nov 2010 to Jan 2011 Administrative budget review
Academic program review
• February 2011 Vice Presidents’ recommendations fordivisional 5%, 10%, 15% and 20%
reductions
Cabinet Review
• March 2011 Town Hall Meetings

Please send your comments & suggestions to
http://www.southernct.edu/yourideas/
Or email:Mr. James Blake – [email protected]