Budget Strategy and Outlook 2018-19 · Updated fiscal projections in the 2018‑19 Budget include:...
118
Budget Strategy and Outlook 2018-19 Budget Paper No. 2
Transcript of Budget Strategy and Outlook 2018-19 · Updated fiscal projections in the 2018‑19 Budget include:...

Budget Strategy and Outlook
2018-19
Budget Paper No. 2


1
Budget Strategy and Outlook
ContentsUnder Treasurer’s Certification 3
Chapter 1 Overview 5
Chapter 2 Fiscal Outlook 9
Chapter 3 Economic Outlook 23
Chapter 4 Fiscal Strategy Statement 35
Chapter 5 Intergovernmental Financial Relations Issues 41
Chapter 6 Territory Taxes and Royalties 59
Chapter 7 Risks and Contingent Liabilities 77
Chapter 8 Uniform Presentation Framework 87
Appendices 107
Appendix A Classification of Entities in the Northern Territory 109
Appendix B Glossary 110
In this book, the term ‘state’ or ‘states’ includes the Australian Capital Territory and the Northern Territory, unless the context indicates otherwise.

2
2018-19 Budget

3
Budget Strategy and Outlook
Under Treasurer’s CertificationIn accordance with provisions of the Fiscal Integrity and Transparency Act, I certify that the financial projections included in the May 2018 Budget documentation were based on Government decisions that I was aware of or that were made available to me by the Treasurer before 22 April 2018. The projections presented here are in accordance with the Uniform Presentation Framework.
Craig GrahamUnder Treasurer
23 April 2018

4
2018-19 Budget

Overview 5
Budget Strategy and Outlook
Chapter 1Overview
Budget Paper No. 2 presents whole of government financial information and consolidates information from other budget papers. It also meets the requirements of the Fiscal Integrity and Transparency Act and the Uniform Presentation Framework, as agreed by all Australian jurisdictions.
Fiscal outlookThe 2018‑19 Budget projections have been significantly influenced by lower GST revenue, weakening economic conditions and increased demand for government services, resulting in a substantial deterioration in the Territory’s fiscal position and outlook compared to the previous budget.
Recent changes in the distribution of GST among the states has resulted in a $1.4 billion reduction to the Territory’s estimated GST over the forward estimates, compared to that forecast in the 2017‑18 Budget. This loss is in addition to the almost $2 billion reduction incorporated in the 2017‑18 Budget forecasts, resulting in a total cumulative loss over the budget cycle to 2021‑22 of around $3.4 billion since the August 2016 Pre‑Election Fiscal Outlook (PEFO).
The Territory is unable to absorb such a substantial and unprecedented downturn in revenues without substantially reducing core government services, nor does it have the capacity to generate additional own‑source revenue to offset a reduction of this magnitude. In recognition of the Territory’s reduced GST share, the Commonwealth has provided the Territory with a one‑off financial assistance payment of $259.6 million for 2018‑19. The Territory Government is continuing negotiations with the Commonwealth for ongoing funding to supplement the Territory’s GST relativity reduction. Should ongoing financial support be secured, the Territory’s fiscal aggregates will improve over the forward estimates.
The Government is taking a considered approach to budget repair, acknowledging that drastic reductions in Government spending are likely to have detrimental effects on the Territory economy and population in the short term. As a result, significant fiscal balance deficits are projected across the forward estimates and, in the absence of a recovery in GST or other Commonwealth revenue, large fiscal deficits are likely to continue in the medium term. It is worth noting however, that excluding the combined GST reductions over the past two years, the 2018‑19 Budget aggregates would be significantly improved, with operating surpluses from 2020‑21 and net debt ratios half of those now projected in the 2018‑19 Budget.
Updated fiscal projections in the 2018‑19 Budget include:
• total revenue for the non financial public sector of $6.3 billion in 2018‑19 and operating expenditure of $6.9 billion
• a reduction in GST revenue estimates averaging 12 per cent per annum over the budget cycle when compared to the 2017‑18 Budget, bringing the total reduction in GST revenue estimates since the 2016 PEFO to an average 26 per cent per annum over the budget cycle
• general government net operating deficits projected across the budget and forward estimates, with a deficit of $603 million in 2018‑19 and forecast operating deficits averaging around $921 million per annum over the forward estimates
• a non financial public sector fiscal deficit of $1.2 billion in 2018‑19, and around $1.1 billion across all other years

6 Overview
2018-19 Budget
• net debt at the non financial public sector to increase to $7.5 billion by 2021‑22, largely as a result of the reductions in GST revenue, spending pressures and increased borrowings required to maintain government service levels
• consistent with increasing net debt, the net debt to revenue ratio is projected to rise from 72 per cent in 2018‑19 to 119 per cent in 2021‑22.
Table 1.1 provides the key fiscal aggregates for the general government sector and the non financial public sector for the 2018‑19 Budget.
Table 1.1: Key fiscal indicators and aggregates
2017-18 2018-19 2019-20 2020-21 2021-22
Estimate Budget Forward estimate
$M $M $M $M $M
General government sector
Net operating balance - 541 ‑ 603 - 920 - 922 - 922 Non financial public sector
Fiscal balance - 984 - 1 214 - 1 134 - 1 102 - 1 068
Net debt 3 313 4 485 5 547 6 550 7 543
Net debt to revenue (%) 51 72 91 106 119
Source: Department of Treasury and Finance
Further discussion on the comparison between the estimates contained in the 2018‑19 Budget and those projected at the time of the 2017‑18 Budget is provided in Chapter 2.
Economic outlook Table 1.2 details the outlook for the Territory’s key economic indicators, including actuals for 2016‑17, estimates for the current year, and forecasts for 2018‑19 and the forward estimates period.
Table 1.2: Territory key economic indicators (%)
2016-17 2017-18e 2018-19f 2019-20f 2020-21f 2021-22f
Gross state product1 4.0 2.6 2.1 - 0.4 2.6 2.8
State final demand1 8.2 0.1 - 8.0 - 4.4 2.0 2.8
Population2 0.3 0.0 - 0.7 0.6 1.0 1.1
Employment3 2.5 - 2.0 - 0.5 0.3 0.9 1.0
Unemployment rate4 3.4 4.3 4.9 4.5 4.3 4.0
Consumer price index3 0.1 0.5 1.0 1.7 1.9 2.3
Wage price index3 2.1 1.8 1.7 1.8 2.0 2.1
e: estimate; f: forecast1 Year ended June, year‑on‑year percentage change, inflation adjusted.2 As at December, annual percentage change.3 Year ended June, year‑on‑year percentage change.4 Year average.Source: Department of Treasury and Finance, Australian Bureau of Statistics
Over 2018‑19 and 2019‑20, the Territory economy will continue to face challenging conditions following a sustained period of record growth associated with the construction of the Ichthys liquefied natural gas (LNG) project. As the project transitions from construction to the

Overview 7
Budget Strategy and Outlook
production phase, key economic indicators are all expected to moderate from the levels reported over the past few years.
Chart 1.1: Territory economic indicator forecasts (%)
GSP: gross state product; SFD: state final demand; CPI: consumer price index; WPI: wage price indexSource: Department of Treasury and Finance, Australian Bureau of Statistics
The most significant effect of the Ichthys LNG project has been the substantial levels of private business investment. Over the five years from 2012‑13, it is estimated there was an additional $4 billion per annum of investment, equivalent to almost 20 per cent of the Territory’s total gross state product. This scale of investment is unprecedented in the Territory’s history and has had a substantial impact on the Territory’s economy.
The Territory economy has grown since 2006‑07 by 37.5 per cent, to be worth over $25.4 billion in 2016‑17 and is broader and more diversified compared to the mid‑2000s. There is also significant potential upside in the Territory’s economic outlook with a pipeline of major projects that have not yet reached final investment decision. If approved, these projects would provide a boost to the Territory economy and elevate key economic indicators as a consequence. Other opportunities exist with defence infrastructure investment, record levels of tourism investment and emerging agricultural and mining potential to stimulate the Territory economy.
The Territory’s headline economic growth strengthened in 2016‑17 to 4 per cent from 1.9 per cent in 2015‑16, driven by strong growth in private and public investment, as well as consumption. Economic growth over 2017‑18 and 2018‑19 is estimated to remain reasonably strong, before declining in 2019‑20, largely reflecting a projected decline in business investment. Public investment from the Territory Government’s $1.45 billion infrastructure spend in 2018‑19, combined with Commonwealth defence capital works projects, is expected to partially offset declining private investment over the same period.
Over the outer years of the forecast period, economic growth is likely to be underpinned by net exports, predominantly from the production phase of the Ichthys LNG project, as well as moderate growth in consumption from the household and public sectors, and business investment returning to moderate growth. However, this growth in export volumes is unlikely to flow through to other areas of the Territory economy, such as employment and population growth, which is reflected in state final demand forecasts over the outlook period.
The Territory’s population grew modestly at 0.3 per cent in 2016, but growth remains well below the long‑term trend. In 2017, population growth is estimated to be flat with the population level remaining unchanged, driven by underlying weakness across many sectors of the economy, as well as the construction phase of the Ichthys LNG project nearing completion. Over 2018, population
5 %
GSP
SFD
Employment
Unemployment rate
Darwin CPI
WPI
Population
-2 -1 0 1 2 3 410-year average Forecast 4-year average

8 Overview
2018-19 Budget
growth is forecast to decline by 0.7 per cent, reflecting the likely higher interstate migration outflow as a result of the Ichthys LNG project transitioning to a smaller operational workforce. From 2019, population is forecast to return to growth, trending upwards over the outer years of the forecast period, however remaining below the long‑term trend.
Following 2.5 per cent employment growth in 2016‑17, the Territory is estimated to experience declines in employment over 2017‑18 and 2018‑19, consistent with the stage of the business cycle. Over the outer forecast period, employment growth is estimated to strengthen gradually, however remaining below the long‑term trend. The Territory’s unemployment rate is expected to remain around long‑term trends over the forecast period, although initially trending upwards, averaging 4.7 per cent over 2018‑19 and 2019‑20. The Territory’s unemployment rate continues to remain one of the lowest of all jurisdictions.
Growth in the Darwin consumer price index (CPI) is estimated to remain restrained at 0.5 per cent in 2017‑18 before a modest return to growth over the forward estimates, however remaining below long‑term trend. The softer outlook is mainly due to the continuing effect of moderate population and employment growth, lower input and labour costs, and lower housing costs, particularly lower rents.
Wage growth in the Territory is expected to moderate to 1.8 per cent in 2017‑18, and remain subdued. Moderate improvement is expected over the medium‑term, consistent with national trends and the below trend growth forecasts for employment and the Darwin CPI in the Territory.
On 27 March 2018, the Independent Scientific Inquiry into Hydraulic Fracturing of Onshore Unconventional Reservoirs in the Northern Territory released its final report. The Territory Government has decided to lift the moratorium on hydraulic fracturing, accepting all 135 Inquiry recommendations in order to reduce risk to an acceptable level while creating jobs and guaranteeing significant economic activity over the medium to long term. The economic implications of this decision have not been factored into forecasts as the expected economic impacts on production, employment and regional economic activity are largely beyond the forecast period for the 2018-19 Budget.
The Territory Government’s Economic Development Framework is a long‑term strategy for the Territory to take advantage of its existing strengths in agribusiness, energy, minerals, tourism and defence, but also capitalise on emerging sectors such as environmental services, human service delivery, tropical health, renewable energy and marine maintenance to underpin future growth and opportunity. Collaboratively developed strategies and action plans are now being rolled out to support the development of these sectors, such as the Population Strategy, updated 10‑year Infrastructure Plan, industry strategies and regional economic development plans.

Fiscal Outlook 9
Budget Strategy and Outlook
Chapter 2 Fiscal Outlook
Fiscal outlook highlights• The updated financial outcome projections contained in the 2018‑19 Budget have worsened
since the 2017‑18 Budget, largely the result of continued reductions in GST revenue.
• Since the 2017‑18 Budget, forecast GST revenue has reduced by $1.4 billion over the forward estimates, bringing the total reduction in estimates of GST revenue since 2016 Pre‑Election Fiscal Outlook (PEFO) to around $3.4 billion.
• This $3.4 billion reduction equates to a 26 per cent average annual reduction in GST estimates over the budget cycle since the 2016 PEFO.
• A general government net operating deficit of $603 million in 2018‑19 and forecast deficits averaging around $921 million over the forward estimates.
• A non financial public sector fiscal deficit of $1.2 billion in 2018‑19, and averaging around $1.1 billion across all other years.
• In response to the further deterioration in the Territory’s GST revenue share, the 2018‑19 Budget incorporates additional budget repair and savings measures totalling $234 million across the budget cycle, which brings total cumulative savings measures to $828 million since the 2016 PEFO.
• In recognition of the Territory’s loss of GST revenue, the Commonwealth has provided a one‑off financial assistance payment of $259.6 million for 2018‑19.
• In the absence of reductions in GST revenue, over which the Territory has no control, the forecast fiscal aggregates would be materially improved on those presented in this Budget Paper, with a small fiscal deficit of $44 million projected in 2021‑22.
• In 2018‑19, total expenses for the non financial sector are estimated to be $6.9 billion, a 1.6 per cent reduction from 2017‑18, largely as a result of expiring Commonwealth recurrent funding agreements and implementation of savings measures since the 2016 PEFO.
• The 2018‑19 Budget includes infrastructure investment of $1.45 billion in 2018‑19 to support economic recovery and employment, including the Commonwealth’s $110 million per annum over five years contribution to remote Indigenous housing.
• The projected operating deficits combined with infrastructure investment are estimated to increase net debt to $7.5 billion by 2021‑22.
• The net debt to revenue ratio is also projected to increase over the forward estimates period, reaching 119 per cent in 2021‑22 compared to 72 per cent in 2018‑19.

10 Fiscal Outlook
2018-19 Budget
Overview The information provided in this chapter meets the requirements of section 10(1)(a) of the Fiscal Integrity and Transparency Act (FITA) for each fiscal outlook report to contain updated financial projections for the budget year and the following three financial years for the general government and non financial public sectors.
The full set of financial statements are presented in Chapter 8, with this chapter providing a comparison of the projections in the 2018‑19 Budget with those provided in the 2017‑18 Budget and 2017‑18 Mid‑Year Report. It also provides a discussion of the forward estimates and the assumptions that underpin them.
General government sector net operating balanceTable 2.1 highlights the movements in the general government sector net operating balance and compares the updated projections with those published in the 2017‑18 Budget and 2017‑18 Mid‑Year Report.
Table 2.1: General government sector – net operating balance
2017-18 2018-19 2019-20 2020-21 2021-22
Estimate Budget Forward estimate
$M $M $M $M $M
2017-18 Budget ‑ 503 - 509 - 561 - 556 n.a.
2017‑18 Mid‑Year Report ‑ 387 - 590 - 612 - 606 n.a.
2018‑19 Budget - 541 - 603 - 920 - 922 - 922
Variation from 2017‑18 Budget ‑ 39 - 94 ‑ 359 ‑ 366 n.a.
n.a.: not available at the time of publishing the 2017‑18 Budget and 2017‑18 Mid‑Year ReportSource: Department of Treasury and Finance
As shown in Table 2.1, the net operating balance is projected to worsen in all years when compared to the forecast at the time of the 2017‑18 Budget. The operating deficit of $603 million in 2018‑19 is not as pronounced as the forward estimates largely due to GST revenue reductions of $317 million when compared to the 2017‑18 Budget, offset to some extent by a one‑off financial assistance payment from the Commonwealth of $259.6 million.
From 2019‑20, the net operating balance is projected to worsen across the budget cycle by an average of $363 million per annum when compared to the 2017‑18 Budget, primarily due to a compounding reduction in GST revenue.
In addition to the GST reductions there have also been some increases in expenditure related to new initiatives, offset to some extent by revenue and savings measures of on average $65 million per annum over the budget cycle. Despite Government’s efforts to restrain expenditure growth through the introduction of further savings and budget repair measures, the cumulative loss of Commonwealth revenues cannot be absorbed without significantly undermining service standards or worsening economic outcomes. This, together with additional interest payments required to service new borrowings, means operating deficits are unavoidable in the short to medium term.
Further analysis of policy decisions of government are explained later in this chapter and in more detail in Budget Paper No. 3.

Fiscal Outlook 11
Budget Strategy and Outlook
Non financial public sector fiscal balance The general government sector excludes public non financial corporations, such as the Power and Water Corporation, Territory Generation and Jacana Energy. Therefore the fiscal balance measure is reported at the non financial public sector to ensure the financial performance of these entities is incorporated in Government’s fiscal targets and outcomes.
Table 2.2: Non financial public sector – fiscal balance
2017-18 2018-19 2019-20 2020-21 2021-22
Estimate Budget Forward estimate
$M $M $M $M $M
2017-18 Budget ‑1 312 - 859 - 611 - 572 n.a.
2017‑18 Mid‑Year Report -1 067 - 924 - 660 ‑ 643 n.a.
2018‑19 Budget - 984 - 1 214 - 1 134 - 1 102 - 1 068
Variation from 2017‑18 Budget 328 ‑ 355 - 522 ‑ 530 n.a.
n.a.: not available at the time of publishing the 2017‑18 Budget and 2017‑18 Mid‑Year Report Source: Department of Treasury and Finance
As shown in Table 2.2, the fiscal balance, which includes net investment in capital spending, has improved in 2017‑18 but worsened across the forward estimates when compared to the 2017‑18 Budget. The improved deficit in 2017‑18 is largely due to a one‑off increase in taxation and mining royalty revenue of $170 million, combined with the transfer of capital expenditure from 2017‑18 into forward years. These transfers from 2017‑18, combined with the worsened operating results, have contributed to increased fiscal deficits from 2018‑19, with a significant deficit of $1.2 billion in 2018‑19, representing the peak of capital investment and averaging around $1.1 billion projected for all forward years.
Reconciliation with previous fiscal projectionsThis section addresses the requirements of section 10(1)(f) of FITA that each fiscal outlook report is to contain an explanation of the factors and considerations that contributed to any material differences between the updated financial projections and the equivalent projections published in the last fiscal outlook report.
Although the most recent fiscal outlook report published under FITA is the 2017‑18 Mid‑Year Report, for completeness, the analysis in the remainder of the chapter reflects policy and non‑policy changes since the 2017‑18 Budget. Policy variations are the result of Government decisions to implement new or expand existing agency programs, and savings measures. Non‑policy variations are the result of influences outside the Government’s control, such as the timing of receipts from the Commonwealth or changes in economic parameters.
Policy and non‑policy changes since 2017‑18 BudgetTable 2.3 summarises the effect of policy and non‑policy changes on the non financial public sector’s fiscal balance since the 2017‑18 Budget.

12 Fiscal Outlook
2018-19 Budget
Table 2.3: Non financial public sector fiscal balance – policy and non‑policy changes since 2017‑18 Budget
2017-18 2018-19 2019-20 2020-21 Estimate Budget Forward estimate
$M $M $M $M2017‑18 Budget - 1 312 - 859 - 611 - 572
Policy changes ‑ 138 - 116 - 140 ‑ 73
Non‑policy changes 466 - 240 ‑ 382 - 4572018‑19 Budget - 984 - 1 214 - 1 134 - 1 102
Source: Department of Treasury and Finance
As outlined in Table 2.3, the major impact on the budget and forward estimates is the effect of non‑policy changes, largely GST revenue and timing changes and to a lesser extent, new expenditure commitments. Details on policy and non‑policy changes are discussed in further detail below.
Policy changes since 2017‑18 BudgetTable 2.4 highlights the effect of policy changes on the non financial public sector’s fiscal balance since the 2017‑18 Budget.
Table 2.4: Non financial public sector fiscal balance – policy changes since 2017‑18 Budget
2017-18 2018-19 2019-20 2020-21 2021-22 Estimate Budget Forward estimate
$M $M $M $M $MPolicy decisions
Recurrent commitments - 116 - 126 - 126 ‑ 123 - 121
Capital commitments - 5 - 21 - 21 - 22 - 20
Economic stimulus
Recurrent ‑ 13 - 50 - 5 - 2 - 1
Capital - 6 - 47
Revenue measures 2 10 16
Savings and contingency measures 2 129 10 63 692018‑19 Budget - 138 - 116 - 140 - 73 - 58
Source: Department of Treasury and Finance
The impact of policy decisions is more pronounced in 2017‑18 through to 2019‑20 as a result of Government’s decision to implement a number of economic stimulus packages and the step‑up of savings measures from 2020‑21. Policy decisions are discussed in more detail below, with the effect on individual agencies for 2017‑18 and 2018‑19 of new initiatives and savings measures included in more detail in Budget Paper No. 3.
Recurrent commitments Recurrent commitments include Government’s response to the Royal Commission into the Protection and Detention of Children in the Northern Territory, demand pressures for government services and other policy decisions incorporated in the 2017‑18 Mid‑Year Report. Combined, these average $122 million per annum over the budget cycle from 2017‑18, with key commitments including:
• $94.3 million from 2017‑18 to 2021‑22 and $31.1 million ongoing to fund responses to the recommendations from the Royal Commission into the Protection and Detention of Children in the Northern Territory

Fiscal Outlook 13
Budget Strategy and Outlook
• $86 million in 2017‑18 to provide support for demand pressures, including $60 million for health and hospital services, $16 million for policing and $10 million for correctional services
• $35.3 million over five years to 2022‑23 and $8.1 million ongoing to expand access to cancer treatment services through the establishment of positron emission tomography (PET) scanner service, cyclotron and radiopharmacy facility, and expanded chemotherapy and related services
• $14 million over four years from 2018‑19 for a new Remote Telecommunications Co‑investment Program in addition to the $8.5 million investment for the remote communications connectivity and capacity
• $5.6 million in 2017‑18 and $10 million ongoing for the Early Childhood Development Plan
• $6.5 million per annum for four years from 2018‑19 for the new Resourcing the Territory program, which focuses on stimulating mineral resource exploration and investment attraction
• $5.8 million over four years from 2018‑19 and $0.5 million ongoing from 2022‑23 to implement all 135 recommendations from the Scientific Inquiry into Hydraulic Fracturing in the Northern Territory
• $4.9 million in 2017‑18, $7.2 million in 2018‑19 and $6.7 million ongoing from 2019‑20 to support the implementation of the Northern Territory Concession Scheme and Senior Recognition Scheme reforms
• $3.6 million ongoing from 2018‑19 to continue the Electronic Monitoring program
• $1.2 million in each of 2018‑19 and 2019‑20, and $1.8 million ongoing from 2020‑21 to provide an expanded range of maternity services at the Palmerston Regional Hospital
• $0.3 million in 2017‑18, $11.8 million in 2018‑19 and $12.8 million per annum ongoing from 2019‑20 to implement the Alcohol Policing Support Unit, which will employ 75 community safety officers to provide a permanent presence at all take‑away liquor outlets in Alice Springs, Katherine and Tennant Creek.
Capital commitments Capital commitments increased by $89 million across the budget cycle, primarily related to:
• additional funding of $65.3 million from 2017‑18 to 2021‑22 to develop and implement a new information management system, as part of the response to the Royal Commission into the Protection and Detention of Children in the Northern Territory, to improve service coordination across the child protection and youth justice system
• $5 million in 2017‑18 and $10 million ongoing from 2018‑19 for undergrounding of powerlines, offset by
• redirected funding totalling $32.1 million from 2018‑19 to 2020‑21 and $8.5 million ongoing from 2021‑22 to support the operational program management requirements of the Remote Housing Investment Package.
Economic stimulus During 2017‑18, the Government announced a series of economic stimulus packages to boost the Territory economy including:
• $103 million across 2017‑18 and 2018‑19 for targeted tourism marketing, enhancing existing festivals and events, and for new and upgrading existing tourism infrastructure
• $7.8 million over four years from 2018‑19 to 2021‑22 for initiatives to support the Territory’s Population Strategy and action plan
• $4.5 million across 2017‑18 and 2018‑19 to fund the Home Energy Efficiency Program.

14 Fiscal Outlook
2018-19 Budget
Savings and contingency measuresIn response to the further deterioration in the Territory’s fiscal position, the Territory Government has introduced additional budget repair and savings measures totalling $234 million across the budget cycle. Key measures include:
• reducing the Government’s wages policy and associated indexation in agency budgets from 2.5 per cent to 2 per cent for all new enterprise agreements from 1 October 2018
• reducing consumer price index (CPI) indexation in agency budgets to 1 per cent in 2018‑19, 2 per cent in 2019‑20 and 2020‑21 and 2.5 per cent thereafter, consistent with updated economic forecasts
• a reduction to the repairs and maintenance program of $22.5 million per annum from 2018‑19
• sustainable workforce strategies to control the growth of the public sector, including targeted voluntary redundancies in non‑frontline roles and a freeze on new positions
• savings of $3 million per annum from 2018‑19 from efficiencies in Territory Generation
• reviewing grant arrangements to ensure value for money.
In addition to budget repair and savings measures, Government has utilised a proportion of the contingency amount included in the forward estimates to fund economic stimulus measures totalling $38 million across the budget cycle.
Government has also established a Budget Review Subcommittee of Cabinet to work with ministers and agencies to implement these measures, identify opportunities to generate further efficiencies and monitor financial performance against Government’s fiscal strategy.
As shown in Table 2.5, these new measures, combined with the significant budget improvement measures introduced in the 2017‑18 Budget, bring total cumulative savings measures to $828 million since the 2016 PEFO.
Table 2.5: Savings measures since 2016 PEFO
2017-18 2018-19 2019-20 2020-21 2021-22
Estimate Budget Forward estimate Cumulative
$M $M $M $M $M $M
2017-18 Budget 74 113 127 140 140 594
2018-19 Budget 41 53 64 77 234
Total 74 154 180 204 216 828
Source: Department of Treasury and Finance
Revenue measuresThe revenue‑related policy changes since the 2017‑18 Budget with budgetary implications include:
• the Local Employment Package that provides a payroll tax exemption for Territory resident employees starting new jobs from 1 May 2018 to 30 June 2020, allows miners in the calculations of royalties to deduct the costs of building social infrastructure and accommodation costs for Territory employees and removes royalty deductions for travel and ancillary costs for employees who do not reside in the Territory
• introduction of a hybrid royalty scheme from 1 July 2019 that requires mining companies to pay a minimum royalty based on the gross value of mineral production at a rate of 1 per cent in a mine’s first mineral royalty year, 2 per cent in second year and 2.5 per cent ongoing

Fiscal Outlook 15
Budget Strategy and Outlook
• a derelict and vacant property levy, commencing 1 July 2019, on unoccupied commercial land in the Darwin central business district, at a rate of 1 per cent of unimproved capital value for buildings which are 50 per cent or more vacant, and 2 per cent for undeveloped vacant properties
• amendments to the Revenue Units Act from 1 July 2018 to index the annual increase in the value of revenue units by the greater of CPI or 3 per cent
• deferral of community gaming machine tax increases on hotels that were to commence 1 July 2018
• removal of stamp duty exemption on the transfer of petroleum and pipeline interests.
In total these measures will generate net additional revenues of $2 million in 2019‑20, rising to $16 million per annum by 2021‑22. Further information on these revenue measures is outlined in Chapter 6 of this Budget Paper.
Non‑policy changes since the 2017‑18 BudgetTable 2.6 highlights the effect of non‑policy changes on the non financial public sector’s fiscal balance since the 2017‑18 Budget.
Table 2.6: Non‑policy changes since the 2017‑18 Budget
2017-18 2018-19 2019-20 2020-21 2021-22 Estimate Budget Forward estimate
$M $M $M $M $M
GST revenue - 8 ‑ 317 ‑ 339 ‑ 365 ‑ 391
Commonwealth financial assistance payment 260
Taxation and mining royalties 170 69 13 22 20
Interest variations 32 1 - 17 ‑ 43 - 99
Government owned corporations1 - 1 - 92 - 16 14 ‑ 3
Commonwealth and agency‑related adjustments
273 ‑ 163 ‑ 23 - 86 - 6
2018‑19 Budget 466 - 240 - 382 - 457 - 478
1 Government owned corporations includes Indigenous Essential Services Pty Ltd, a subsidiary company of the Power and Water Corporation.
Source: Department of Treasury and Finance
The non‑policy variations since the 2017‑18 Budget result in an improvement in the fiscal balance in 2017‑18 of $466 million, primarily related to the revised timing of Commonwealth and Territory‑funded programs and additional tax revenues and mining royalties. Non‑policy changes are set to significantly worsen the fiscal projections across the budget period, predominantly due to lower GST revenue. The lower GST in 2018‑19 is largely offset by the one‑off financial assistance payment provided by the Commonwealth and additional mining royalties. Key variations include:
• a further $1.4 billion reduction in GST revenue forecasts across the budget cycle, compared to estimates reported for the 2017‑18 Budget
• a one‑off Commonwealth financial assistance payment of $259.6 million for 2018‑19, in recognition of the Territory’s loss in GST revenue
• increases in taxation and royalty revenue across all years, with the increase in 2017‑18 and 2018‑19 primarily related to additional mining royalties and to a lower extent payroll tax in 2017‑18. Smaller increases to mining royalties flow into the forward estimates but will be partially offset by lower than anticipated collections of stamp duty on conveyances

16 Fiscal Outlook
2018-19 Budget
• an improvement to interest variations in 2017‑18 due to greater than anticipated interest received on investments. From 2018‑19 interest expenses are higher than previous forecasts due to increased borrowing requirements to maintain government services following the GST revenue reductions
• revised revenue and expense assumptions and capital requirements incorporated into the Territory’s government owned corporations’ statements of corporate intent
• Commonwealth and other agency‑related adjustments, resulting in an improvement in 2017‑18 and a corresponding worsening in forward years. These are largely related to the carryover of expenses from 2016‑17 and the revised timing of milestone payments for the Health Core Clinical Systems Renewal Program, remote housing and Government’s contribution towards the construction of a ship lift facility.
2018‑19 Budget and 2019‑20 to 2021‑22 forward estimates Basis of forward estimates
In accordance with FITA, five years of forward estimates are maintained and used by government, both as a policy and an operational tool. The budget and forward estimates provides the framework within which agencies plan and also forms the basis for the Government’s fiscal strategy.
Agency forward estimates vary in line with the application of parameters (inflators and deflators) to the budget year on a no‑policy‑change basis. New policy and funding decisions linked to demand or cost growth also adds to each agency’s budget and forward estimates. The main parameters used to adjust forward estimates are:
• wages – inflator
• CPI – inflator
• efficiency dividend – deflator.
As part of the new budget repair measures, the Government’s wages policy was amended from 2.5 per cent to 2 per cent for all new enterprise agreements from 1 October 2018. This will not affect agreements that, by this date, are already in place, have gone to ballot or are awaiting endorsement by the Fair Work Commission. As a result, the change in the policy and associated indexation in agency budgets will not come into full effect until 2021‑22.
A CPI factor of 1 per cent has been applied to operational costs in 2018‑19, consistent with the year‑on‑year to December 2017 CPI outcome, with 2 per cent estimated for 2019‑20 and 2020‑21 and 2.5 per cent ongoing from 2021‑22. However property management, undertaken on behalf of government by the Department of Corporate and Information Services, receives a higher parameter in line with contractual arrangements.
An additional growth parameter of 4 per cent is applied to wage and non‑wage expenditure for the Top End and Central Australia health services in recognition that hospital services and primary health care costs are generally demand driven.
An efficiency dividend is applied to operational and employee costs premised on agencies improving processes and technology, and delivering services more efficiently over time, as is the case with private sector enterprises. An efficiency dividend of 3 per cent has been applied in 2017‑18, reducing to 2 per cent in 2018‑19 and 2019‑20, with 1 per cent applied ongoing from 2020‑21. Efficiency dividends are not applied to grants and some contractual obligations.
For agencies, such as the Department of Education, Territory Families, Northern Territory Police, Fire and Emergency Services, the correctional services component of the Department of the Attorney‑General and Justice, and the hospital networks, a 67 per cent discount is applied to the

Fiscal Outlook 17
Budget Strategy and Outlook
efficiency dividend in recognition that a majority of their costs relate to frontline services, which are fixed in nature.
For Territory‑funded grants and subsidies, a composite indexation factor is applied based on 75 per cent of the wages factor and 25 per cent of the CPI factor.
Operating revenue – forward estimatesAs shown in Table 2.7, there is a significant decrease in total Territory revenue from 2017‑18 to 2018‑19, primarily due to reductions in GST revenue and one‑off increases in taxation and mining royalties in 2017‑18. As a result, it is projected that total revenue will not return to 2017‑18 levels in any year over the budget cycle, with average annual growth from 2018‑19 through to 2021‑22 projected at 0.3 per cent.
Table 2.7: Non financial public sector – revenue
2017-18 2018-19 2019-20 2020-21 2021-22
Estimate Budget Forward estimate $M $M $M $M $M
Revenue Taxation revenue 618 531 543 570 589
GST revenue 2 901 2 713 2 811 2 937 3 071
Commonwealth financial assistance payment 260
Current grants 1 097 929 895 886 870
Capital grants 270 328 226 166 126
Sales of goods and services 1 013 1 061 1 178 1 197 1 224
Interest income 108 73 78 81 83
Dividend and income tax equivalent income 22 28 36 35 42
Mining royalties income 336 272 239 239 239
Other 81 75 82 81 81
Total revenue 6 446 6 268 6 090 6 192 6 325
Year‑on‑year percentage increase (%) ‑ 3 ‑ 3 2 2
Source: Department of Treasury and Finance
Taxation revenueTaxation revenue is the most significant component of the Territory’s own‑source revenue and has been revised upwards by $60 million in 2017‑18, with reductions averaging $27 million per annum over the forward estimates when compared to the 2017‑18 Budget. The increase in the 2017‑18 estimate is largely attributable to a one‑off increase in payroll tax ($83 million) offset by reduced stamp duty on conveyances ($30 million).
In terms of year‑on‑year variations, the overall reduction in taxation revenue of $87 million from 2017‑18 to 2018‑19 is primarily due to an expected moderation in payroll tax as the Ichthys LNG project transitions from the peak of its construction workforce to a smaller ongoing production workforce. The growth from 2018‑19 onwards largely reflects normal growth across all categories, albeit from a lower base.
GST revenueThe parameters that influence the amount of GST revenue the Territory receives are growth in national GST collections, GST relativities as assessed by the Commonwealth Grants Commission, and the Territory’s share of the national population.

18 Fiscal Outlook
2018-19 Budget
In 2018‑19 the Territory’s GST revenue is estimated to decline by a further $317 million from that forecast in the 2017‑18 Budget and $761 million from that forecast at the time of 2016 PEFO. This is primarily due to a significant reduction in the Territory’s GST relativity (4.66 in 2017‑18 to 4.26 in 2018‑19) combined with a decline in the Territory’s share of the national population, partially offset by an increase in the national GST pool. This reduction, compared to previous forecasts, flows through to all forward years resulting in an overall reduction in estimated GST revenue of $1.4 billion over the budget cycle, compared to the 2017‑18 Budget and more than $3.4 billion less than the estimates in the 2016 PEFO.
Consequently, the Territory is expected to receive $2901 million in 2017‑18 compared to $3157 million in 2016‑17 in actual GST receipts. Although GST revenue is projected to increase over the forward estimates from 2018‑19, it is from a much lower base. In real terms, GST revenue is not expected to return to 2016‑17 levels over the budget cycle.
In recognition of the Territory’s loss of GST revenue, the Commonwealth has provided a one‑off financial assistance payment of $259.6 million for 2018‑19. The Territory Government is continuing negotiations with the Commonwealth for ongoing funding to supplement the Territory’s GST relativity reduction. Should ongoing financial support be secured, the Territory’s fiscal aggregates will improve over the forward estimates.
Chart 2.1 highlights the reductions in GST revenue forecasts since the 2016 PEFO.
Chart 2.1: Variations to GST revenue since 2016 PEFO
In the absence of reductions in GST revenue, over which the Territory has no control, the forecast fiscal aggregates would be materially improved on those presented in this Budget Paper.
Table 2.8 demonstrates that, if not for the GST reductions over the last two budgets, operating surpluses would have been achievable from 2020‑21 and a small fiscal balance deficit at the non financial public sector in 2021‑22. Net debt to revenue ratios would also have been likely to be constant over the budget cycle, and less than half of the ratios now projected.
2600
2800
3000
3200
3400
3600
3800
2015-16 2016-17 2017-18 2018-19 2019-20 2020-21 2021-222016 PEFO 2017-18 Budget 2018-19 Budget
$M
Commonwealth financial assistance payment

Fiscal Outlook 19
Budget Strategy and Outlook
Table 2.8: Underlying fiscal aggregates with GST reductions removed
2017-18 2018-191 2019-20 2020-21 2021-22 Estimate Budget Forward estimate
$M $M $M $M $MGeneral government sector Net operating balance ‑ 136 - 101 ‑ 32 24 102 Non financial public sector
Fiscal balance - 579 - 713 - 246 - 156 - 44
Net debt 2 908 3 579 3 753 3 810 3 779
Net debt to revenue (%) 42 53 54 53 51
1 Excludes the Commonwealth financial assistance payment of $259.6 million in 2018‑19.Source: Department of Treasury and Finance
Commonwealth fundingDuring each budget year there are significant changes in tied and untied Commonwealth funding estimates as funding agreements are finalised. These adjustments tend not to affect the fiscal outcome as increases in revenue are generally matched by a corresponding increase in expenditure. However, timing differences in the receipt of tied revenue and associated expenditure introduce a degree of volatility affecting the budgeted and actual outcomes in a given year.
Current and capital grants have increased across all years when compared to the 2017‑18 Budget as a result of the Commonwealth’s financial assistance payment of $259.6 million for 2018‑19 and the Commonwealth’s contribution to remote Indigenous housing of $110 million per annum from 2018‑19 to 2022‑23.
Sales of goods and servicesRevenue from the sales of goods and services has largely decreased in all years since the 2017‑18 Budget, predominantly as a result of revised revenue assumptions incorporated into the government owned corporations’ statements of corporate intent and revised patient‑generated income within the health services. However, revenue from the sales of goods and services is still projected to increase on average by 5 per cent over the forward estimates from the lower 2018‑19 base.
Mining royaltiesMining and petroleum revenue forecasts are reliant on advice from mining companies and petroleum producers for estimated liability and related company estimates of commodity price movements, production levels and the value of the Australian dollar. Based on advice from royalty payers, it is expected that the Territory will receive an additional $111 million in 2017‑18 and $96 million in 2018‑19, compared to the forecasts in the 2017‑18 Budget.
Following the release of the final report of the Independent Scientific Inquiry into Hydraulic Fracturing of Onshore Unconventional Reservoirs in the Northern Territory, the Territory Government has decided to lift the moratorium on hydraulic fracturing. The economic implications and subsequent royalties that are likely to be paid to the Territory from hydraulic fracturing activities have not been factored into the current forward estimates. These payments are largely beyond the budget forecast period.
Operating expensesTable 2.9 sets out the revised expense projections for total expenditures for 2017‑18 and the forward estimates.

20 Fiscal Outlook
2018-19 Budget
Table 2.9: Non financial public sector – expenditure
2017-18 2018-19 2019-20 2020-21 2021-22
Estimate Budget Forward estimate
$M $M $M $M $M
Expenses
Employee expenses 2 527 2 454 2 510 2 545 2 578
Superannuation expenses 357 359 361 358 359
Depreciation and amortisation 598 584 574 573 572
Other operating expenses 2 012 1 947 2 032 2 021 2 049
Interest expenses 288 324 385 440 506
Current grants 931 959 891 920 922
Capital grants 112 80 36 26 24
Subsidies and personal benefit payments 153 158 160 164 168
Total expenses 6 977 6 866 6 949 7 048 7 179
Year‑on‑year percentage increase (%) 7 -2 1 1 2 Net capital 1 036 1 179 821 795 763
Total expenditure 8 014 8 044 7 770 7 844 7 942
Year‑on‑year percentage increase (%) 7 0 ‑3 1 1
Source: Department of Treasury and Finance
Total expenses in 2018‑19 are expected to decline by 1.6 per cent from 2017‑18, predominantly as a result of ceasing recurrent Commonwealth‑funded programs in 2017‑18. Total expense growth has been further restrained over the forward estimates period by the application of savings and budget repair measures incorporated in the 2017‑18 and 2018‑19 budgets, resulting in an average annual growth rate of 1.5 per cent per annum.
Employee expenses continue to account for about one third of total expenses over the forward estimate period and are estimated to increase on average by 1.7 per cent per annum from 2018‑19 consistent with Government’s wages policy, offset by efficiency and savings measures.
The growth from the budget year in other operating expenses is estimated at around 1.7 per cent per annum on average.
As a result of projected fiscal deficits, the Government has been required to significantly increase its borrowing program and this has resulted in increased interest expense of $47 million by 2020‑21.
Table 2.10 sets out interest expenses projected for the non financial public sector compared to those estimated in the 2017‑18 Budget.Table 2.10: Non financial public sector – interest expenses
2017-18 2018-19 2019-20 2020-21 2021-22
Estimate Budget Forward estimate
$M $M $M $M $M
2017-18 Budget 289 325 365 393 n.a.
2018‑19 Budget 288 324 385 440 506
Variation - 1 - 1 20 47 n.a.
n.a.: not available at the time of publishing the 2017‑18 Budget and 2017‑18 Mid‑Year ReportSource: Department of Treasury and Finance

Fiscal Outlook 21
Budget Strategy and Outlook
The fluctuation in current and capital grants expense across the forward estimate period reflects the timing of tied Commonwealth funding agreements.
A number of variations to net capital spending, including transfers between years, have resulted in a reduction in 2017‑18 and increases across the forward estimates from the 2017‑18 Budget. These primarily relate to the revised timing of milestone payments for the Health Core Clinical Systems Renewal Program, remote housing and Government’s contribution towards the construction of a ship lift facility.
Key fiscal indicators – balance sheetThe key measures for the balance sheet are net debt and the resulting net debt to revenue ratio.
As shown in Table 2.11, net debt is now projected to be $3.3 billion in 2017‑18, rising to an estimated $7.5 billion by 2021‑22. The net debt to revenue ratio is projected to be 72 per cent in 2018‑19 and rise to 119 per cent by 2021‑22.
Table 2.11: Non financial public sector – net debt and net debt to revenue ratio
2016-171 2017-18 2018-19 2019-20 2020-21 2021-22
Outcome Estimate Budget Forward estimate
$M $M $M $M $M $M
Net debt
2017-18 Budget 2 358 3 604 4 404 4 939 5 479 n.a.
2017‑18 Mid‑Year Report 2 271 3 272 4 135 4 720 5 330 n.a.
2018‑19 Budget 2 271 3 313 4 485 5 547 6 550 7 543
Variation from 2017‑18 Budget - 88 - 291 82 608 1 071 n.a. Net debt to revenue (%)
2017-18 Budget 36 58 73 80 87 n.a.
2017‑18 Mid‑Year Report 35 50 68 76 84 n.a.
2018‑19 Budget 35 51 72 91 106 119
Variation from 2017‑18 Budget - 1 - 7 - 1 11 19 n.a.
n.a.: not available at the time of publishing the 2017‑18 Budget and 2017‑18 Mid‑Year Report1 2017‑18 Mid‑Year Report and 2018‑19 Budget reflect actual outcome.Source: Department of Treasury and Finance
The significant increases in net debt, when compared to the 2017‑18 Budget, are the consequence of the projected fiscal balance deficits, largely the result of non‑policy changes, such as reduced GST revenues and additional borrowing costs to maintain government services. Table 2.12 summarises the effect of policy and non‑policy variations on net debt since the 2017‑18 Budget.
Table 2.12: Non financial public sector – effect of policy and non‑policy variations on net debt
2017-18 2018-19 2019-20 2020-21 2021-22
Estimate Budget Forward estimate
$M $M $M $M $M
Cumulative variations
Policy 138 254 394 467 525
Non‑policy - 429 - 172 214 604 1 049
Net impact - 291 82 608 1 071 1 574
Source: Department of Treasury and Finance

22 Fiscal Outlook
2018-19 Budget
Table 2.13 provides details on the cumulative factors that have contributed to the deterioration in net debt over the forward estimates since the 2017‑18 Budget.
Table 2.13: Non financial public sector – detailed cumulative variations to net debt
2017-18 2018-19 2019-20 2020-21 2021-22
Estimate Budget Forward estimate
$M $M $M $M $M
Cumulative variations
GST revenue 8 325 664 1 029 1 420
Commonwealth financial assistance payment - 260 - 260 - 260 - 260
Taxation, mining royalties and revenue measures
- 170 ‑ 238 ‑ 253 - 285 ‑ 321
Recurrent commitments 116 242 368 491 612
Capital commitments 5 26 47 69 89
Economic stimulus 19 115 121 123 124
Savings and contingency measures - 2 ‑ 130 - 140 - 204 - 272
Government owned corporations 1 93 109 95 98
Interest variations ‑ 32 ‑ 33 - 17 27 125
Timing and other variations ‑ 236 - 58 ‑ 31 ‑ 13 - 40
Net impact - 291 82 608 1 071 1 574
Source: Department of Treasury and Finance
As demonstrated in Table 2.13, variations to net debt total $1.57 billion by 2021‑22, of which in excess of $1.4 billion can be attributed to the estimated reduction in GST revenue, partially offset by the Commonwealth’s financial assistance payment of $259.6 million for 2018‑19.

Economic Outlook 23
Budget Strategy and Outlook
Chapter 3Economic Outlook
OverviewThis overview section provides a summarised assessment of the Northern Territory Economy, including a brief description of recent economic performance and the outlook across a number of key indicators, including economic growth, population, labour market, prices and wages, as well as a description of the structure of the economy and the external economic environment. More detailed commentary on current and historical economic conditions in the Territory are now provided through the new Territory Economy website at territoryeconomy.dtf.nt.gov.au. The website content will be updated regularly as new data becomes available and should be read in conjunction with budget papers.
Economic outlook highlights • The updated economic forecasts contained in the 2018‑19 Budget have deteriorated since
the 2017‑18 Budget, particularly in the outlook for 2018‑19 and 2019‑20.
• The Territory economy has exhibited typical resource‑driven business cycles over the past decade with strong expansionary and contractionary phases and is currently transitioning from a period of sustained growth.
• The current business cycle is no exception, though it differs due to the sheer scale of the Ichthys liquefied natural gas (LNG) project for which the timing of construction completion, commissioning and initial level of exports continue to have a material impact on the Territory’s economic forecasts.
• Overall the size of the economy is expected to be more than 50 per cent larger by 2021‑22, at $28 billion, compared to 10 years ago.
• Economic growth, measured by Gross State Product (GSP), is estimated to remain reasonably strong over 2017‑18 and 2018‑19, before declining in 2019‑20, largely reflecting declines in business investment. Economic growth in the outer years is likely to be supported by net exports, as well as moderate growth in consumption from both households and public sectors.
• Domestic economic activity, measured by State Final Demand is expected to contract over the forecast period as, unlike headline economic growth, it will not benefit from the boost in exports from 2018‑19 onwards.
• Other key economic indicators such as population, employment, unemployment, consumer price index and wage price index largely follow on from the economic growth story. All indicators are forecast to remain subdued or in some cases decline in the next couple of years, before gradually strengthening over the outlook period.
• Despite economic challenges, there is significant potential upside to the Territory economy with a pipeline of major projects that have not yet reached final investment decision. Other opportunities exist with defence infrastructure investment, record levels of tourism investment, and emerging agricultural and mining potential, together with onshore gas to support growth of the Territory economy over the medium term.
24 Economic Outlook
2018-19 Budget
The Territory’s key economic forecasts for the 2018‑19 Budget are detailed in Table 3.1.
Table 3.1: Territory key economic indicators (%)
2016-17 2017-18e 2018-19f 2019-20f 2020-21f 2021-22f
Gross state product1 4.0 2.6 2.1 - 0.4 2.6 2.8
State final demand1 8.2 0.1 - 8.0 - 4.4 2.0 2.8
Population2 0.3 0.0 - 0.7 0.6 1.0 1.1
Employment3 2.5 - 2.0 - 0.5 0.3 0.9 1.0
Unemployment rate4 3.4 4.3 4.9 4.5 4.3 4.0
Consumer price index3 0.1 0.5 1.0 1.7 1.9 2.3
Wage price index3 2.1 1.8 1.7 1.8 2.0 2.1
e: estimate; f: forecast1 Year ended June, year‑on‑year percentage change, inflation adjusted.2 As at December, annual percentage change.3 Year ended June, year‑on‑year percentage change.4 Year average.Source: Department of Treasury and Finance, ABS
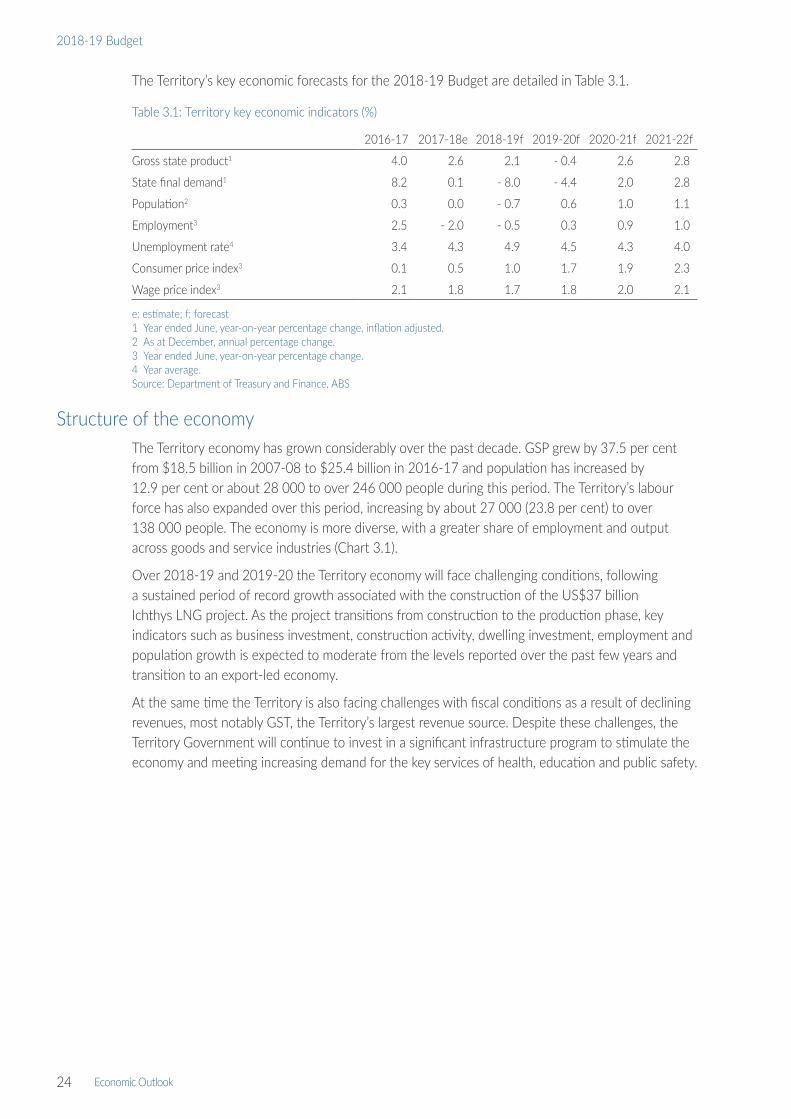
Structure of the economyThe Territory economy has grown considerably over the past decade. GSP grew by 37.5 per cent from $18.5 billion in 2007‑08 to $25.4 billion in 2016‑17 and population has increased by 12.9 per cent or about 28 000 to over 246 000 people during this period. The Territory’s labour force has also expanded over this period, increasing by about 27 000 (23.8 per cent) to over 138 000 people. The economy is more diverse, with a greater share of employment and output across goods and service industries (Chart 3.1).
Over 2018‑19 and 2019‑20 the Territory economy will face challenging conditions, following a sustained period of record growth associated with the construction of the US$37 billion Ichthys LNG project. As the project transitions from construction to the production phase, key indicators such as business investment, construction activity, dwelling investment, employment and population growth is expected to moderate from the levels reported over the past few years and transition to an export‑led economy.
At the same time the Territory is also facing challenges with fiscal conditions as a result of declining revenues, most notably GST, the Territory’s largest revenue source. Despite these challenges, the Territory Government will continue to invest in a significant infrastructure program to stimulate the economy and meeting increasing demand for the key services of health, education and public safety.
Economic Outlook 25
Budget Strategy and Outlook
Chart 3.1: Contributions to GSP, 2016‑17
GSP: gross state product1 Non‑industry components of GSP include ownership of dwellings, taxes less subsidies and statistical discrepancy.2 Other services components of GSP include personal services and general repair and maintenance activities.Source: ABS, Australian National Accounts: State Accounts, Cat. No. 5220.0
The outlook for the structure of the Territory economy is a shift from construction as the dominant sector to mining and manufacturing. Net exports are then expected to emerge as the primary driver of Territory economic growth, increasing substantially over 2018‑19 and 2019‑20, and remaining at these levels well into the future.
The most significant effect of the Ichthys LNG project has been the substantial levels of private business investment. Over the five years from 2012‑13, it is estimated there was an additional $4 billion per annum of investment, equivalent to almost 20 per cent of the Territory’s total GSP. This scale of investment is unprecedented in the Territory’s history and has had a substantial impact on the Territory’s economy.
All economies are subject to cyclical effects, with the frequency, magnitude and length of time between periods of growth often linked to the size of the economy, structure, reliance on key industries, and vulnerability to external factors such as commodity prices and exchange rates. As a small open economy heavily reliant on resources and historically driven by major projects, the economic cycles in the Territory tend to be more pronounced than in other jurisdictions in Australia. Over the last 25 years the Territory has experienced growth cycles averaging between six to seven years where expansionary economic conditions have persisted. These expansionary cycles were followed by periods of contraction.
The Territory is currently transitioning through a downturn in the economic cycle, which is reflected in low growth across a number of key economic indicators. The Territory’s GSP, employment and population collectively provide an overview of the cyclical nature of the Territory economy (Chart 3.2). The highly transient nature of the Territory’s population is a significant factor in these movements, as economic and particularly employment conditions influence people to come to or leave the Territory. Consequently, population growth is generally in line with the growth in the Territory’s GSP. Since employment is a key driver of net interstate migration, its movement is generally consistent with population growth. The recent period of economic expansion, which peaked in 2012‑13, was driven by the Ichthys LNG project that had an unprecedented effect on the Territory economy and will continue to provide a positive contribution for the duration of the 40‑year operational life of the project, largely through exports of LNG, ongoing maintenance activities including major shut downs and potential future investment. However, employment
Public administration and safety (12.0%)
Education and training (4.8%)Health care andsocial assistance (6.3%)
Electricity, gas and water (1.5%)Accommodation and food services (2.4%)
Transport, postal and warehousing (3.0%)Information media and telecommunication (0.5%)
Financial and insurance services (2.3%)Rental, hiring and real estate services (1.4%)
Professional, scientific and technical services (3.8%)
Administrative and support services (2.0%)Arts and recreation services (1.1%)
Other services2 (1.5%)
Agriculture, forestryand fisheries (2.9%)
Mining (11.8%)
Construction (11.2%)
Retail and wholesale trade (4.8%)
Non-industry1 (21.6%)
Manufacturing (5.0%)
Mining and manufacturing (16.8%)
Government and community services (23.1%)
Service industries (19.5%)

26 Economic Outlook
2018-19 Budget
growth through the LNG exports will be limited due to the smaller workforce required for the project’s operational phase.
Chart 3.2: Year‑on‑year change in key indicators
GSP: gross state product1 Inflation adjusted.2 Annual change.Source: ABS, Australian National Accounts: State Accounts, Cat. No. 5220.0, Labour Force, Australia, Cat. No. 6202.0,
Australian Demographic Statistics, Cat. No. 3101.0
Despite the current economic conditions, there is also significant potential upside in the Territory economy with a pipeline of major projects that have not yet reached final investment decision. If approved, these projects will provide a boost to the Territory’s key economic indicators. Other opportunities exist with defence infrastructure investment, record levels of tourism investment and emerging agricultural and mining potential to stimulate the Territory economy.
On 27 March 2018, the Independent Scientific Inquiry into Hydraulic Fracturing of Onshore Unconventional Reservoirs in the Northern Territory released its final report. The Territory Government has decided to lift the moratorium on hydraulic fracturing, accepting all 135 Inquiry recommendations in order to reduce risk to an acceptable level while creating jobs and guaranteeing significant economic activity over the medium to long term. The economic implications of this decision have not been factored into forecasts as the expected economic impacts on production, employment and regional economic activity are largely beyond the forecast period for the 2018‑19 Budget.
The Territory Government’s Economic Development Framework is a long‑term strategy for the Territory to take advantage of its existing strengths in agribusiness, energy, minerals, tourism and defence, but also capitalises on emerging sectors such as environmental services, human service delivery, tropical health, renewable energy and marine maintenance to underpin future growth and opportunity. Collaboratively developed strategies and actions plans are now being rolled out to support the development of these sectors, such as the Population Plan, updated 10‑year Infrastructure Plan, industry strategies and regional economic development plans.
Economic growthThe Territory recorded headline economic growth of 4.0 per cent in 2016‑17, with GSP increasing to $25.4 billion, driven by strong growth in private and public investment, as well as consumption. The Territory recorded the second highest economic growth rate of the jurisdictions and above the national economic growth rate of 2.1 per cent.
-4
-2
0
2
4
6
8
10
12
14
94 96 98 00 02 04 06 08 10 12 14 16 18e 20f 22f
GSP¹ Employment Population²Year ended June
%
Forecast period6 years 7 years 7 years3 years

Economic Outlook 27
Budget Strategy and Outlook
The Territory’s economic growth over the forecast period continues to reflect a transition from record levels of private investment to export‑driven growth (Chart 3.3). This transition will be largely dominated by activity related to the Ichthys LNG project. As construction of the Ichthys LNG project is completed and the plant commences production in 2018, growth in Territory domestic economic activity will moderate further. However, commencement of the production phase will benefit the economy significantly due to a boost in LNG, liquefied petroleum gas and condensate exports beginning in 2018‑19, reaching full export capacity in 2019‑20 at levels expected to be sustained throughout the project’s 40‑year life.
As a consequence, Territory GSP is forecast to grow moderately over 2017‑18 and 2018‑19, before declining in 2019‑20, largely reflecting declines in business investment as the Ichthys LNG project completes its construction and commissioning phase. This will be partly offset by a significant improvement (over 375 per cent) in net exports during 2018‑19 and 2019‑20, from 2017‑18 (Chart 3.3). However, given the significant scale of the project, any changes to the construction completion, commissioning timing or initial level of exports from the Ichthys LNG project will have a material impact on the Territory’s annual economic growth forecasts over the 2017‑18 to 2019‑20 period.
Public investment from the Territory Government’s $1.45 billion infrastructure spend in 2018‑19, combined with Commonwealth defence capital works projects, is expected to partially offset declining private investment over the same period.
Economic growth in the outer years is likely to be supported by the stabilisation of business investment and net exports, as well as moderate growth in consumption from both households and public sectors. Growth over 2020‑21 and 2021‑22 is forecast to strengthen from 2.6 per cent to 2.8 per cent. This improving trend (Chart 3.3) is in line with forecasts for the Territory’s population and employment in the outer years.
Overall the Territory economy is expected to be over 50 per cent larger in 2021‑22, at $28.0 billion in size, compared to 2006‑07.
Prospective investment projects in the pipeline, including those with major project status, are not included in the above forecasts as they have not yet received final investment decisions. If realised, these projects have the potential to provide significant improvement to the Territory’s economic growth over the forecast period.
Chart 3.3: Components of Territory GSP
GSP(E): expenditure measure of gross state product; ppt: percentage point; e: estimate; f: forecast1 Inflation adjusted.Source: Department of Treasury and Finance, ABS, Australian National Accounts: State Accounts, Cat. No. 5220.0
-20
-10
0
10
20
30
40
08 09 10 11 12 13 14 15 16 17 18 19 20 21 22
Private investment Public investmentHousehold consumption Public consumption
Net exportsBalancing item and statistical disrepancy
ppt
Year ended June
GSP(E)
Forecast period
ff f fe

28 Economic Outlook
2018-19 Budget
The change in the size of the domestic economy over the forecast period, as measured by state final demand (SFD), reflects the Territory’s economic transition to domestic consumption. SFD will experience a significant rebalancing following years of record private investment and consumption (Chart 3.4). As a result, SFD is expected to contract over the forecast period as, unlike GSP growth, it will not benefit from the boost in exports from 2018‑19 onwards.
SFD is estimated to moderate to 0.1 per cent growth in 2017‑18, following an 8.2 per cent increase in 2016‑17 to $30.0 billion, which was mainly driven by strong private investment. However this decline in business investment in 2017‑18 will be partly offset by increased public investment associated with the Territory Government’s infrastructure program, and moderate growth in household consumption that will provide some support to SFD.
SFD is expected to contract in the medium term, with an 8.0 per cent decline forecast in 2018‑19 and 4.4 per cent decline in 2019‑20, largely reflecting the declines in business investment. Underlying public investment is expected to provide some offsetting support to SFD however not at a level sufficient to fully offset the scale of the decline in private investment (Chart 3.4).
SFD is expected to return to moderate growth of 2.0 per cent in 2020‑21 and 2.8 per cent in 2021‑22 as household consumption strengthens, albeit below trend levels over the medium term, and private investment resets to long‑term trend.
Chart 3.4 Territory SFD1
SFD: state final demand; e: estimate; f: forecast1 Inflation adjusted.Source: ABS, Australian National Accounts: State Accounts, Cat. No. 5220.0
InvestmentPrivate investment increased 23.5 per cent to $9.9 billion in 2016‑17 and was a major contributor to economic growth. The main driver of the increase was business investment, up 30.3 per cent, largely reflecting activity related to the Ichthys LNG project, however also contributing to growth in 2016‑17 was increased cultivated biological resources and intellectual property products investment. Offsetting the increases in business investment, dwelling investment contracted 23.9 per cent to $644 million in 2016‑17, continuing a trend of moderation since a peak in 2013‑14.
In 2017‑18, private investment is estimated to decrease by 4.3 per cent. This is in line with the latest data trends for private investment, showing a 23.5 per cent decrease in the December quarter 2017. This reflects the transition of the Ichthys LNG project, as well as lower dwelling investment. Despite the decline, private investment in 2017‑18 is expected to remain above the 10‑year average level of $7.8 billion.
0
5
10
15
20
25
30
35
08 09 10 11 12 13 14 15 16 17 18e 19f 20f 21f 22f
Private investment Public investment Household consumption Public consumptionYear ended June
$B
10-year average
Forecast period

Economic Outlook 29
Budget Strategy and Outlook
Private investment is expected to contract further in the medium term, down 25.7 per cent in 2018‑19 and 18.5 per cent in 2019‑20. However, the forecast decline is softened by the construction of the $800 million Northern Gas Pipeline, the expected commencement of the Darwin luxury hotel and Darwin ship lift facility, as well as ongoing levels of investment associated with maintenance and operation of the Ichthys LNG plant.
In the outer years, private investment in the Territory is expected to return to pre‑Ichthys long‑term trend levels of around $5.8 billion per annum, with forecast growth of 0.8 per cent in 2020‑21, later strengthening to 3.3 per cent in 2021‑22.
Public investment increased by 7.5 per cent in 2016‑17, to $1.4 billion. The major driver of the increase was higher general government investment by local and state governments, up 10.2 per cent to $875 million.
Public investment is expected to play an important role in supporting economic activity over the forecast period and provide a significant support to economic growth, particularly in 2017‑18 and 2018‑19. The Territory Government’s infrastructure spending and the Commonwealth’s large‑scale defence projects remain key drivers of public investment over the medium term.
In 2017‑18, public investment is estimated to increase by 18.6 per cent and contribute 1.0 percentage point to economic growth in the year. Following elevated levels of public investment in recent years, including 2017‑18, public investment will begin to transition back to long‑term levels over 2018‑19 and 2019‑20, and is forecast to contract to an average $1.4 billion per annum in the outer years (Chart 3.4).
ConsumptionTotal household consumption in the Territory increased by 2.8 per cent to $11.4 billion in 2016‑17, with a wide number of categories contributing to household expenditure growth in the year.
Household consumption is estimated to be relatively subdued over the forecast period, reflecting underlying trends in economic activity, wages, employment and population growth in the Territory. Growth in household consumption in 2017‑18, although moderating from 2016‑17, is expected to be supported by expenditure on recreation and culture, finance and insurance services, and personal care goods and services. Household consumption is forecast to remain below trend, averaging growth of 1.7 per cent per annum over 2018‑19 and 2019‑20.
Over the outer years, household consumption is expected to strengthen by 2.7 per cent by 2021‑22. This growth will be supported by strengthening, though still modest, employment and population forecasts in the outer years. Household consumption is however expected to remain below the 10‑year average historical growth rate of 3.5 per cent.
In 2016‑17, public consumption decreased 0.3 per cent, reflecting contraction in consumption spending across all three tiers of government.
Growth in public consumption is expected to provide moderate support, on average, to economic growth across the forecast period. In 2017‑18, public consumption is expected to increase 0.9 per cent. Public consumption is forecast to contract in 2018‑19 by 0.7 per cent, reflecting Territory Government budget constraints.
Growth in the outer years, averaging around long‑term trend levels, will be supported by Territory Government resourcing of health, family and children services, education and police. Commonwealth expenditure relating to ongoing defence operations in the Territory, including the growing Joint Australia‑United States (US) Force Posture Initiative and the continued rollout of the National Disability Insurance Scheme, will positively contribute to public consumption.

30 Economic Outlook
2018-19 Budget
External economic environmentNational and international economic activity influences the Territory economy through changes to exchange rates, commodity prices, population flows, interstate trade volumes, tourism activity and the availability of workers to meet the Territory’s labour requirements. Additionally, monetary policy set by the Reserve Bank of Australia influences household consumption, business confidence and investment in the Territory.
According to the International Monetary Fund (IMF), in 2017 about 120 countries experienced economic growth, signifying a strengthening of global economic recovery. The IMF forecasts global growth to increase marginally from 3.6 per cent in 2017 to 3.7 per cent in 2018. Advanced economies are forecast to grow at 2.0 per cent, while emerging markets and developing economies are forecast to grow at 4.9 per cent in 2018.
This trend is forecast to continue in the coming years with emerging markets and developing economies remaining the key drivers of global growth, increasing to 5.1 per cent in 2019.
In Asia, growth will be driven by the advancement of Asia’s tiger economies (Indonesia, Thailand, Malaysia, Philippines). Indonesia in particular is a key market for the Territory’s live cattle trade, taking 82.5 per cent of total international live cattle exports.
Over the next five years, global growth is expected to average 3.7 per cent from 2017, largely driven by emerging markets and developing economies, with advanced economies growing moderately below trend.
Most recently, the US has decided to apply tariffs on all steel (25 per cent) and aluminium (10 per cent) imports. While the new tariffs are not likely to impact Australia, this new tariff could ultimately impact global growth through higher prices, as well as lower global trade, particularly if other countries react with retaliatory trade barriers.
The IMF forecasts economic growth in Australia to be 2.9 per cent in 2018 and average 2.8 per cent over the five‑year forecast period to 2022. The 2017‑18 Commonwealth Mid‑Year Economic and Fiscal Outlook (MYEFO) anticipates that Australia’s 26 consecutive years of economic growth will continue over the medium term. MYEFO forecasts the Australian economy to grow by 2.5 per cent in 2017‑18 before increasing to 3.0 per cent by the end of the forecast period in 2021‑22. Future economic growth is expected to be supported by non‑mining business investment, housing consumption and public investment, supported by a weaker Australian dollar and benefiting goods and services exports.
International tradeNet exports of goods and services from the Territory decreased by 58.6 per cent to $865 million in 2016‑17, reflecting a significant increase in goods imports and a small decline in the volume of goods exports.
The Territory’s net exports over the three years 2017‑18 to 2019‑20 remain heavily influenced by the Ichthys LNG project. Over 2017‑18 net exports are expected to contribute strong growth to GSP, due to declining levels of imports associated with the Ichthys LNG project, as well as some growth in exports of minerals and the agricultural sector. Over 2018‑19 and 2019‑20 the Territory’s net exports will increase by over 375 per cent or about $6.2 billion, from 2017‑18, reflecting the commencement of exports from the Ichthys LNG project as well as below‑trend growth in imports (Chart 3.5).

Economic Outlook 31
Budget Strategy and Outlook
Over the outer years of the forecast period, net exports are expected to stabilise at around $8.0 billion per annum, reflecting average growth of 0.5 per cent. This below‑trend growth in net exports reflects moderate growth in both exports and imports, albeit with exports at historically high levels.
Chart 3.5 Territory net exports1
e: estimate; f: forecast1 Inflation adjusted.Source: ABS, Australian National Accounts: State Accounts, Cat. No. 5220.0
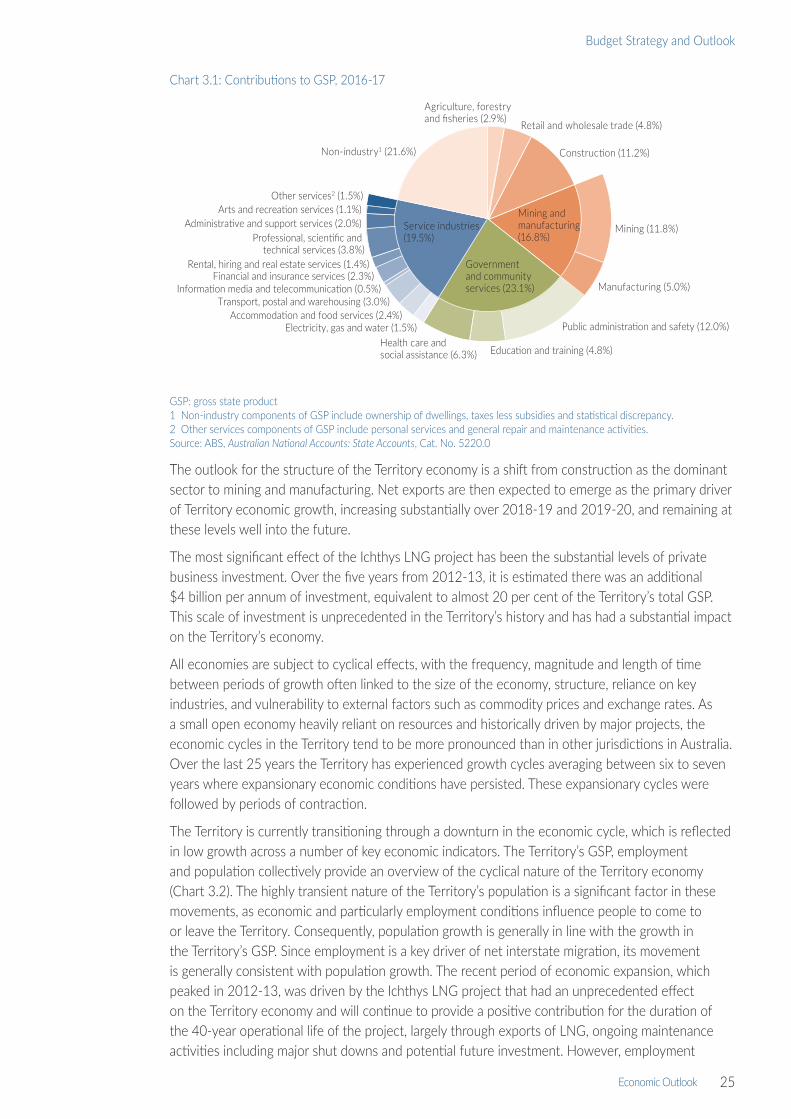
PopulationThe Territory’s estimated resident population of nearly 250 000, comprising 1 per cent of the total Australian population, is spread over the third largest Australian jurisdiction by geographical area, making it the most sparsely populated jurisdiction with 0.2 persons per square kilometre. Over half (59.4 per cent) of the Territory’s population resides in Greater Darwin and the remainder is dispersed over remote and very remote areas. About one third of the Territory’s population is Aboriginal, around 80 per cent of whom live in remote and very remote areas.
The Territory’s population growth has been subdued over the past few years, driven by large net outflows of interstate migrants, as well as lower levels of overseas migration inflows, compared to recent highs. In 2016, the Territory’s population increased by 0.3 per cent, to 245 740. Since then, the rate of population growth has slowed, with no change in population reported between the September quarter 2016 and the September quarter 2017.
The Territory’s population growth over 2017 is expected to be flat, with natural increase and a small improvement in net overseas migration (NOM) being offset by continued elevated levels of net interstate migration (NIM) outflows. Much of the increase in the NIM outflow is expected to have been driven by an underlying weakness in non‑construction‑related sectors of the Territory economy, such as retail trade, as well as lower levels of new employees required at the Ichthys LNG project as construction nears completion through 2018. The first three quarters of 2017 also saw a strong decline in the number of people arriving in the Territory, reflecting strong economic and population growth in other jurisdictions, particularly in Victoria and New South Wales, which is also contributing to elevated NIM outflows.
In 2018 the Territory’s population is forecast to decline by 0.7 per cent. Much of this decline reflects further expected NIM outflows over the year as workers, who had relocated to the Territory to work on major projects, depart. NOM is expected to continue to be a stable positive contributor
2
4
6
8
10
12
14
08 09 10 11 12 13 14 15 16 17 18e 19f 20f 21f 22f
Total exports Total imports Net exportsYear ended June
$BForecast period
32 Economic Outlook
2018-19 Budget
to the Territory’s population but levels are not expected to be high enough to offset NIM outflows (Chart 3.6).
The outlook for the Territory’s population is expected to improve in the outer forecast period, returning to growth from 2019. This in part reflects much lower levels of anticipated post‑construction outflows of workers from the Ichthys LNG project, the majority of whom are expected to depart in 2018. Fewer departures interstate from 2019 onwards should result in moderating NIM outflows. NOM and natural increase are both expected to remain steady contributors to population growth.
Chart 3.6: Components of Territory population growth (moving annual total)
e: estimate; f: forecastSource: ABS, Australian Demographic Statistics, Cat. No. 3101.0
Labour MarketThe Territory has consistently recorded low unemployment and high labour force participation rates compared to other jurisdictions in Australia. These features mean the Territory is reliant on interstate and overseas workers to meet growth in the demand for labour associated with major projects and other economic activity.
In 2016‑17 resident employment in the Territory increased by 2.5 per cent, which accounted for an average of 138 180 employed residents in the Territory during the year. Since then, employment has moderated, decreasing by 0.3 per cent in the year to February 2018, to an average of 136 370 employed residents in the Territory. Given this current trend, the outlook for employment growth is expected to be weak.
Territory employment growth is expected to average below long‑term trends over the outlook period, with a shift from the construction sector as the main driver to an increased reliance on general growth across other key industries in the Territory including tourism, health and education services, public administration, agricultural and defence sectors (Chart 3.7).
-6
-4
-2
0
2
4
6
8
97 98 99 00 01 02 03 04 05 06 07 08 09 10 11 12 13 14 15 16 17 18f 19f 20f 21f 22f
Totalgrowth
Natural increase
Netoverseas
migration
Net interstatemigration
Year ended June
Number (persons) (000)
Forecast period

Economic Outlook 33
Budget Strategy and Outlook
Chart 3.7: Year‑on‑year change in employment and unemployment
e: estimate; f: forecastSource: ABS, Labour Force, Australia, Cat. No. 6202.0
In the year to February 2018, the Territory’s unemployment rate averaged 3.9 per cent, in line with the 10‑year average, but an increase from the 2016‑17 rate of 3.4 per cent. However, the unemployment rate is expected to peak at an average of 4.9 per cent in 2018‑19 as employment growth deteriorates following the major transition to the production and operational phase of the Ichthys LNG project.
From 2019 onwards, a large proportion of workers who become unemployed and are unsuccessful in securing other employment are expected to move interstate for other employment opportunities or return to their usual place of residence. While reducing employment and the overall size of the labour market, the outflow of workers from the Territory is expected to limit the impact of the wind‑down of the Ichthys LNG project construction phase on the Territory’s unemployment rate over the outlook. Thus, the unemployment rate is expected to average 4.3 per cent over the four years from 2018‑19.
Prices and wagesGrowth in the Darwin consumer price index (CPI) remains well below long‑term trend with growth of 0.1 per cent in 2016‑17, continuing a substantial decline in the Darwin CPI in recent years and a lower rate than the eight capital cities’ CPI growth of 1.7 per cent. The primary drivers of moderation in prices for the Darwin CPI include, food and non‑alcoholic beverages, clothing and footwear, housing, communications, and recreation and culture. Contributors to growth in the Darwin CPI over 2016‑17 were alcohol and tobacco (mainly tobacco excise tax), health and education costs.
The Darwin CPI is forecast to remain restrained for 2017‑18 at 0.5 per cent with modest growth of 1.0 per cent in 2018‑19. In the outer years of the forecast period, the Darwin CPI is expected to trend upwards to 2.3 per cent as a number of categories are forecast to return to moderate levels of price growth, but nevertheless remaining below the historical trend (Chart 3.8).
In 2016‑17, the Territory’s wage price index (WPI) recorded an increase of 2.1 per cent, a historically low level for the Territory, and also consistent with national WPI growth of 2.0 per cent. WPI growth in the Territory continued a moderating path, remaining below the 10‑year average of 3.2 per cent. This largely reflects declining private sector wage growth and is consistent with increased capacity of the Territory labour market, as well as slowing public sector wage growth.
-2
-1
0
1
2
3
4
5
6
7
8
08 09 10 11 12 13 14 15 16 17 18e 19f 20f 21f 22f
Employment growth Unemployment rateYear ended June
%
Forecast period

34 Economic Outlook
2018-19 Budget
Wage growth is expected to continue to moderate to 1.8 per cent in 2017‑18, and remain subdued. Moderate growth is expected over the medium term, consistent with national trends and the below‑trend growth forecasts for employment in the Territory and the Darwin CPI.
Chart 3.8: Darwin CPI and Territory WPI, financial year‑on‑year percentage change
CPI: consumer price index; WPI: wage price index; e: estimate; f: forecast Source: ABS, Consumer Price Index, Australia, Cat. No. 6401.0; Department of Treasury and Finance
-0.5
0.5
1.5
2.5
3.5
4.5
5.5
08 09 10 11 12 13 14 15 16 17 18e 19f 20f 21f 22f
Year ended June
Darwin CPI
%
Territory WPI
Forecast period

Fiscal Strategy Statement 35
Budget Strategy and Outlook
Chapter 4 Fiscal Strategy Statement Overview
The 2017‑18 Budget fiscal strategy was developed in response to subdued Territory economic conditions, falling GST revenue and the Government’s commitment to increase investment to support jobs and stimulate the Territory economy. The 2018‑19 Budget fiscal strategy has been framed in similar circumstances and hence remains unchanged and incorporates both short‑term and medium‑term fiscal objectives and targets.
The short‑term strategy is aimed at supporting the economy in the current period of reduced revenues and moderating economic conditions, and the medium‑term strategy sets the budget on a pathway back to balance and reduced debt levels once revenues and economic activity return to historical levels of growth.
However, further reductions in GST revenue since the 2017‑18 Budget have led to continued deterioration to the Territory’s budget position and present an added challenge to the Government in meeting its fiscal strategy targets.
This chapter assesses the updated 2018‑19 Budget fiscal projections against the Government’s short‑term and medium‑term fiscal objectives and targets.
2018‑19 Fiscal strategyThe Territory’s fiscal strategy is an essential element of budget planning and accountability and outlines the Government’s short and medium‑term fiscal objectives in the context of prevailing economic and fiscal conditions. It provides the basis against which policy decisions can be assessed.
As a requirement of section 10(1)(g) of the Fiscal Integrity and Transparency Act (FITA), each fiscal outlook report is to contain an explanation of factors and considerations contributing to any material differences between the updated fiscal projections and the Government’s fiscal objectives and targets.
Under FITA, the fiscal strategy statement must be based on principles of sound fiscal management where the Government must:
• formulate and apply spending and taxation policies, having regard to the effect of these policies on employment, economic development and growth of the Territory economy
• formulate and apply spending and taxing policies so as to give rise to a reasonable degree of stability and predictability
• ensure funding for services is provided by the current generation
• prudently manage financial risks faced by the Territory (having regard to economic circumstances), including the maintenance of Territory debt at prudent levels.
These financial management principles underpin the Territory’s fiscal strategy that consists of the following four components:
• sustainable service provision
• infrastructure for economic and community development
• competitive tax environment
• prudent management of debt and liabilities.

36 Fiscal Strategy Statement
2018-19 Budget
Sustainable service provision The Government’s overarching target in sustainable service provision is to achieve a general government sector net operating surplus. Due to the Territory’s small own‑source revenue base, the Territory has limited ability to influence the level of revenue it can generate. The Territory is also reliant on Commonwealth revenue over which the Territory has little control, and for 2018‑19 comprises 67 per cent of total revenues. However, it is able to directly influence expenditure growth when pursuing this fiscal strategy target.
Short‑term target: Maintain an improving operating position over the budget cycle by ensuring growth in general government operating expenses is declining in real terms.To assist in achieving this target, the 2018‑19 Budget contains a number of additional budget repair and savings measures totalling $234 million across the budget cycle as discussed in Chapter 2. These measures include:
• a reduction in the Territory public service wages policy from 2.5 per cent to 2 per cent
• a reduction in operational budget indexation to reflect lower observed growth in the consumer price index (CPI)
• implementing a targeted voluntary redundancy program across government
• additional expenditure efficiencies from Territory Generation
• reviewing grant arrangements to ensure value for money
• an annual reduction in repairs and maintenance expenditure.
These measures, combined with those incorporated in the 2017‑18 Budget, bring total cumulative savings measures to $828 million since the 2016 PEFO.
Following further reductions in GST revenue, the Territory’s largest source of untied revenue, operating deficits are unavoidable over the budget cycle. The short‑term strategy of ensuring general government operating expenses growth is declining in real terms will help contain operating deficits to a minimum until the economy and revenues recover.
As shown in Table 4.1, the Territory’s total expenses are projected to grow on average by 0.4 per cent per annum over the forward estimates from the budget year, lower than the average CPI of 1.9 per cent over the same period used to inflate agency budgets annually. The estimated annual average growth in operating expenses is marginally lower than the 0.5 per cent projected at the time of the 2016 PEFO.
Table 4.1: General government sector – expenditure growth
2018-19 2019-20 2020-21 2021-22
Average Budget Forward estimate
Total expenses ($M) 6 219 6 260 6 372 6 488
Year‑on‑year percentage increase (%) - 2.5 0.7 1.8 1.8 0.4
CPI index funded parameter (%) 1.0 2.0 2.0 2.5 1.9
Source: Department of Treasury and Finance
Medium‑term target: Achieve a general government sector net operating surplus that ensures new general government capital investment is funded through revenues rather than borrowings. While the Government is taking a considered approach to budget repair with continual focus on limiting expenditure growth, it is unable to absorb such a substantial and unprecedented downturn in revenues without significantly reducing core government services, compromising standards of services and exacerbating current economic challenges. In the absence of a recovery in the

Fiscal Strategy Statement 37
Budget Strategy and Outlook
Territory’s share of GST revenue or other Commonwealth revenue, large fiscal deficits will continue in the medium term.
Table 4.2 highlights the worsening net operating balance from 2017‑18, primarily the result of further reductions to GST revenue. The impact of GST reductions in 2018‑19 are largely offset by the Commonwealth’s one‑off financial assistance payment, as well as royalties from mining companies.
Table 4.2: General government sector – net operating balance
2017-18 2018-19 2019-20 2020-21 2021-22
Estimate Budget Forward estimate
$M $M $M $M $M
2017-18 Budget ‑ 503 - 509 - 561 - 556 n.a.
2017‑18 Mid‑Year Report ‑ 387 - 590 - 612 - 606 n.a.
2018-19 Budget - 541 - 603 - 920 - 922 - 922
Variation from 2017‑18 Budget ‑ 39 - 94 ‑ 359 ‑ 366 n.a.
n.a.: not available at the time of publishing the 2017‑18 Budget and 2017‑18 Mid‑Year ReportSource: Department of Treasury and Finance
Infrastructure for economic and community development Short‑term target: Stimulate the economy by maintaining general government sector infrastructure spending to at least twice the level of depreciation on average over the immediate budget cycle to 2020.Capital investment is essential to meet the Territory’s social and economic needs. This is particularly relevant in periods of economic downturn, where short‑term, countercyclical increases in infrastructure spending provide a stimulus to support economic recovery and sustain jobs in the Territory.
As shown in Table 4.3, projected investment in infrastructure is consistent with this element of the fiscal strategy, with capital investment averaging 2.3 times depreciation to 2019‑20.
Further information on capital investment is included in Chapter 2 and Budget Paper No. 4.

38 Fiscal Strategy Statement
2018-19 Budget
Table 4.3: General government sector – capital investment to depreciation ratio
2017-18 2018-19 2019-20
Estimate Budget
Forward estimate Average
2017-18 Budget
Total capital investment ($M) 1 255 841 514 870
Depreciation ($M) 354 351 349 351
Capital investment to depreciation ratio 3.5 2.4 1.5 2.5
2018-19 Budget
Total capital investment ($M) 989 1 147 764 967
Depreciation ($M) 407 415 413 412
Capital investment to depreciation ratio 2.4 2.8 1.8 2.3
Variation from 2017-18 Budget
Total capital investment ($M) - 266 306 250 97
Depreciation ($M) 53 64 64 61
Capital investment to depreciation ratio - 1.1 0.4 0.3 - 0.2
Source: Department of Treasury and Finance
Medium‑term target: When the economy returns to historical trends, maintain general government infrastructure spending consistent with depreciation expense.Once economic growth returns to long‑term trends, the need for increased government investment in infrastructure will be reduced to make way for private sector investment. When this occurs, the Territory’s medium‑term strategy will be to maintain infrastructure spending at least equal to depreciation charges.
This will ensure the Territory’s infrastructure investment is maintained at appropriate levels while moving towards the objective of ensuring new general government capital investment is funded through revenues rather than borrowings.
Competitive tax environment Target: Maintain a competitive tax environment that encourages investment, creates jobs and attracts business to the Territory, while raising sufficient revenue to contribute to funding government’s service delivery requirements.This fiscal strategy target aims to maintain taxation at levels that are competitive with the other jurisdictions, and encourage increased levels of business activity in the Territory while ensuring sufficient levels of own‑source revenue are generated to contribute to government’s service delivery.
Comparisons of relative tax competitiveness across states are complex due to inherent differences in respective economies and taxation regimes. Chapter 6 describes the representative taxpayer model and compares the main Territory taxes using this model. Another measure of the competitiveness of the Territory’s tax system is taxation effort as assessed by the Commonwealth Grants Commission (CGC).
The CGC’s analysis of ‘tax capacity and effort’ assesses the extent to which a particular jurisdiction’s capacity to raise revenue is above or below the national average and whether tax rates applied are above or below the states’ average.

Fiscal Strategy Statement 39
Budget Strategy and Outlook
Table 4.4: 2016‑17 taxation effort by jurisdiction
NSW Vic Qld WA SA Tas ACT NT
% % % % % % % %
Total taxation 104 105 85 102 103 89 97 85
Source: Commonwealth Grants Commission 2018 Update
The Territory’s below average total taxation effort largely reflects the fact the Territory does not impose a land tax and levies lower than average motor vehicle taxes, somewhat offset by above‑average effort in stamp duty and payroll tax.
With the introduction of new revenue‑raising measures from 2018‑19, it is expected the Territory’s taxation effort will increase and be closer to the average of the states in future updates.
Prudent management of debt and liabilitiesShort‑term target: Achieve an improving fiscal balance at the non financial public sector over the budget cycle.The fiscal balance differs from the net operating balance as it includes capital spending but excludes depreciation, a non‑cash expense, and therefore provides a more complete measure of the Territory’s fiscal performance. A fiscal surplus indicates a government has sufficient fiscal capacity to finance its capital spending. A fiscal deficit position indicates a government’s level of capital investment is greater than its level of savings. Prolonged deficits will result in a government being required to borrow to fund its capital investment.
During the current period of subdued economic conditions, the short‑term strategy is to achieve an improving fiscal balance over the budget cycle to minimise the increase in net debt. As shown in Table 4.5, while the fiscal balance is lower than the budget year, and therefore achieving this element of the fiscal strategy, the fiscal balance is projected to increase significantly from 2017‑18 budget estimates. Fiscal deficits are now projected to exceed $1 billion per annum over the budget cycle and result in a corresponding increase to net debt.
Table 4.5: Non financial public sector – fiscal balance
2017-18 2018-19 2019-20 2020-21 2021-22
Estimate Budget Forward estimate
$M $M $M $M $M
2017-18 Budget ‑ 1 312 - 859 - 611 - 572 n.a.
2017‑18 Mid‑Year Report - 1 067 - 924 - 660 ‑ 643 n.a.
2018-19 Budget - 984 - 1 214 - 1 134 - 1 102 - 1 068
Variation from 2017‑18 Budget 328 ‑ 355 - 522 ‑ 530 n.a.
n.a.: not available at the time of publishing the 2017‑18 Budget and 2017‑18 Mid‑Year ReportSource: Department of Treasury and Finance
Medium to long‑term target: The Territory’s non financial public sector net debt as a percentage of revenue is returning towards the long‑term average of 40 per cent. Over the medium to long‑term, this element of the strategy is for the Territory’s non financial public sector net debt as a percentage of revenue to return to the long‑term average of 40 per cent. This strategy will be dependent on achieving operating surpluses at the general government sector to provide capacity to invest in infrastructure without requiring additional borrowings, combined with improvements in the government owned corporations’ commercial sustainability.

40 Fiscal Strategy Statement
2018-19 Budget
Given the unprecedented reductions in GST revenue, increases to net debt are unavoidable without significantly affecting service delivery. Consequently, the Territory’s net debt position is projected to increase in line with the increased fiscal deficits.
Table 4.6: Non financial public sector – net debt
2017-18 2018-19 2019-20 2020-21 2021-22
Estimate Budget Forward estimate
$M $M $M $M $M
2017-18 Budget 3 604 4 404 4 939 5 479 n.a.
2017‑18 Mid‑Year Report 3 272 4 135 4 720 5 330 n.a.
2018-19 Budget 3 313 4 485 5 547 6 550 7 543
Variation from 2017‑18 Budget - 291 82 608 1 071 n.a.
n.a.: not available at the time of publishing the 2017‑18 Budget and 2017‑18 Mid‑Year ReportSource: Department of Treasury and Finance
Once revenues return to more historical levels, the government’s strategy is to apply any excess revenues to retiring debt accumulated as a result of the current subdued economic conditions and revenue reductions.
Such improvements in the operating and fiscal balances will result in lower net debt levels and set the pathway for the net debt to revenue ratio to return to the long‑term average of 40 per cent, as experienced over the last 10 financial years. However over the immediate budget cycle, as shown in Table 4.7, net debt to revenue is projected to increase to 119 per cent by 2021‑22.
Table 4.7: Non financial public sector – net debt to revenue
2017-18 2018-19 2019-20 2020-21 2021-22
Estimate Budget Forward estimate
% % % % %
2017-18 Budget 58 73 80 87 n.a.
2017‑18 Mid‑Year Report 50 68 76 84 n.a.
2018-19 Budget 51 72 91 106 119
Variation from 2017‑18 Budget - 7 - 1 11 19 n.a.
n.a.: not available at the time of publishing the 2017‑18 Budget and 2017‑18 Mid‑Year ReportSource: Department of Treasury and Finance
ConclusionThe Territory is facing increasingly challenging fiscal conditions following further significant reductions to GST revenue, ongoing demand for core government services and continued economic challenges. These conditions have led to significant fiscal deficits and increased debt levels. The Territory Government is largely unable to influence these factors without significantly affecting the delivery of core government services or having a detrimental effect on the Territory economy and population. Despite the Government’s efforts to constrain expenditure, through cumulative savings measures of $828 million since the 2016 PEFO, these have not been sufficient to outweigh the impact of the $3.4 billion loss in GST revenue across the forward estimates.
Consequently, the Territory has entered a period of extended deficits, with fiscal deficits now projected beyond the budget cycle. Without a significant rebound in revenues, including ongoing financial assistance from the Commonwealth to offset reductions in the Territory’s share of the GST, and ongoing expenditure containment measures, a return to a surplus position is unlikely over the medium to long term.

Intergovernmental Financial Relations Issues 41
Budget Strategy and Outlook
Chapter 5Intergovernmental Financial Relations IssuesOverview
The Territory is estimated to receive $4229 million in Commonwealth funding in 2018‑19, representing about 67 per cent of the Territory’s total non‑financial public sector revenue. This comprises $2975 million in untied payments, largely GST revenue, and $1254 million in tied funding.
GST revenue is the largest single fiscal transfer from the Commonwealth, representing around 43 per cent of the Territory’s total revenue. The Territory is expected to receive $2713 million in GST revenue in 2018‑19, a $188 million decrease from the estimate of $2901 million for 2017‑18, well below the $3157 million in GST revenue received in 2016‑17 and akin to levels received in 2012‑13. The estimated decrease between 2017‑18 and 2018‑19 is driven by a reduction in the Territory’s GST relativity from 4.66024 to 4.25816 and a reduction in the Territory’s share of the national population, partially offset by an increase in the GST pool.
GST revenue is projected to remain below 2016‑17 levels over the entire forward estimates period to 2021‑22, significantly reducing the Territory’s capacity to return the Budget to a surplus position.
The decrease in the Territory’s GST relativity for 2018‑19 is the outcome of the Commonwealth Grants Commission's (CGC) 2018 Update of GST Revenue Sharing Relativities. The main contributors to the lower relativity were the Territory’s higher national share of tied Commonwealth payments, a national increase in investment in urban transport, for which the Territory has below‑average needs, and a decline nationally in investment in rural roads and utilities subsidies for which the Territory has above‑average needs. Combined, these factors are assessed as reducing the Territory’s need for GST revenue. These factors were partly offset by the Territory’s below‑average growth in property sales, which reduced its capacity to raise revenue from conveyance duty and therefore increased its need for GST revenue.
In recognition of the significant drop in the Territory’s GST relativity in 2018‑19 and the impact this has on the Territory’s budget position, the Commonwealth has committed to provide the Territory a one‑off untied financial assistance payment of $259.6 million for 2018‑19.
Tied Commonwealth revenue is estimated to contribute $1254 million or 20 per cent of the Territory’s total revenue in 2018‑19 compared to $1364 million in 2017‑18. The lower revenue in 2018‑19 is primarily attributed to a reduction in payments under the Quality Schools arrangements, which is currently under re‑negotiation, and other Commonwealth payments.
Federal financial relationsAustralia’s federal system is characterised by a high level of vertical fiscal imbalance, whereby the expenditure obligations of states and territories (states) under the Australian Constitution far outweigh their capacities to raise revenue, while for the Commonwealth the opposite applies, necessitating significant revenue transfers from the Commonwealth to the states.
Chart 5.1 highlights the level of vertical fiscal imbalance in Australia. In 2016‑17, states were responsible for around 42 per cent of total government expenditure in Australia, but only raised around 25 per cent of total revenue. Conversely, the Commonwealth raised around 75 per cent of total national revenue but its expenditure obligations only accounted for around 58 per cent of total expenditure. As a result, the Commonwealth makes transfers to the states to support the provision of states’ expenditure obligations, such as health care, education, public safety and transport.

42 Intergovernmental Financial Relations Issues
2018-19 Budget
Chart 5.1: Comparison of Commonwealth and states’ total expenditure and revenues, 2016‑17
Source: Commonwealth 2016‑17 Final Budget Outcome; state and territory 2016‑17 annual financial reports
There are also significant differences in the fiscal capacities of the states arising from differences in demographic, geographic and economic circumstances. Consequently, the Commonwealth provides differing levels of per capita funding to each state in recognition of these imbalances. Table 5.1 shows in 2016‑17 Commonwealth payments accounted for 74 per cent of the Territory’s revenue, compared to an average of 46 per cent across the states.
Table 5.1: Commonwealth funding as a percentage of states’ total general government revenue, 2016‑17
NSW Vic Qld WA SA Tas ACT NT Average
Revenue from the Commonwealth, $ per capita
4 491 4 218 5 212 3 259 5 738 8 152 5 045 17 825 4 745
Commonwealth proportion of total state revenue, %
44.8 46.4 45.3 31.1 53.3 65.3 39.3 74.1 45.5
Source: Commonwealth 2016‑17 Final Budget Outcome; state and territory 2016‑17 annual financial reports
Commonwealth funding to the Territory includes both general revenue assistance (comprising GST revenue and grants in lieu of uranium royalties arising from the Commonwealth’s ownership of uranium) and tied funding to be used for specific purposes. General revenue is discretionary, with states determining how to spend this funding according to their specific priorities, as sovereign governments. Tied funding includes specific purpose payments (SPPs), national partnership (NP) payments, National Health Reform funding and Quality Schools funding, which replaced the Students First funding arrangements from 1 January 2018.
The majority of Commonwealth revenue to the Territory is provided under the Intergovernmental Agreement on Federal Financial Relations (IGA). Funding is also provided through Commonwealth own‑purpose expenses (COPE), primarily fee‑for‑service arrangements payable to either government or non‑government entities. COPE funding is outside the IGA payment arrangements.
Table 5.2 shows in 2018‑19 total Commonwealth payments to the Territory are estimated to be $4229 million, of which 30 per cent is tied funding, with the remaining 70 per cent comprising untied GST revenue, grants in lieu of uranium royalties and a financial assistance payment.
Compared with 2017‑18, total revenue from the Commonwealth is expected to decrease by $39 million, or around 1 per cent, in 2018‑19. The decrease is primarily due to a $188 million reduction in GST revenue and a $111 million reduction in tied payments from the Commonwealth, largely offset by the one‑off financial assistance payment by the Commonwealth of $260 million.
NP payments are anticipated to increase by $63 million in 2018‑19 due to an increase in assistance payments to the Territory from the Disability Care Australia Fund and a number of road
0
10
20
30
40
50
60
70
80
90
100%
Revenue ExpenditureCommonwealth States
Vertical fiscalimbalance

Intergovernmental Financial Relations Issues 43
Budget Strategy and Outlook
infrastructure investment programs, partly offset by a decrease in payments for Northern Territory Remote Aboriginal Investment arrangements.
Table 5.2: Components of Territory revenue1
2016-17 Actual
2017-18 Estimate
2018-19 Budget
$M $M $M
General revenue assistance
GST revenue2 3 157 2 901 2 713
Grants in lieu of uranium royalties 3 3 2
Financial assistance payment 260
Tied revenue
Specific purpose payments 43 44 31
National partnership payments 476 456 519
Quality Schools Package3 351 369 336
National Health Reform funding 246 257 253
Other Commonwealth payments4 237 238 115
Total Commonwealth revenue 4 514 4 268 4 229
Territory own‑source revenue 1 925 2 178 2 039
Total revenue 6 439 6 446 6 268
1 Includes non financial public sector.2 Includes balancing adjustments for over or under payment of GST in the previous financial year.3 Includes payments ‘through’ the Territory for non‑government schools. Student First Funding arrangements were replaced by
the Quality Schools Package from 1 January 2018.4 For consistency of reporting with the Commonwealth, funding under the Natural Disaster Relief and Recovery Arrangements is
reported as tied funding.Note: Numbers may not add due to rounding.Source: Department of Treasury and Finance
Intergovernmental Agreement on Federal Financial Relations The IGA, agreed by all states and the Commonwealth in 2008, provides a framework for national collaboration on policy development and service delivery, and facilitates the implementation of national economic and social reforms.
The aim of the IGA is to improve the effectiveness of government services through:
• fair and sustainable federal financial arrangements that focus on long‑term policy development and enhanced government service delivery
• clearly defined roles and responsibilities between the Commonwealth and states
• enhanced public accountability through simpler, standardised and more transparent performance reporting
• performance reporting that focuses on the achievement of outcomes and outputs
• reduced administration and compliance overheads
• elimination of financial and other input controls imposed on states for service delivery in Commonwealth funding agreements
• the equalisation of fiscal capacities between states.
These arrangements are formalised through:
• national agreements (NAs) for significant state services (health care, school education, skills and workforce development, disability, affordable housing and Aboriginal reform)

44 Intergovernmental Financial Relations Issues
2018-19 Budget
• NP agreements for nationally significant reforms, service delivery initiatives and or projects
• the provision of GST revenue to the states, with all proceeds from the GST provided on an untied basis and distributed among the states in accordance with the principle of horizontal fiscal equalisation (HFE).
HFE aims to ensure each state has the fiscal capacity to provide its residents with the same access to government services and infrastructure as residents of other states.
Current issues in federal financial relationsIn recent years, the Commonwealth has moved away from the principles of the IGA, taking on a more unilateral approach to funding negotiations and increasingly imposing prescriptive measures in new agreements such as: input controls, maintenance of effort, matched funding requirements, stringent performance benchmarks and penalties for non‑compliance.
Further, the Commonwealth has adopted a legislative approach towards major funding and reform agreements, often with little or no consultation with the states and in the absence of an agreed multilateral policy position. Agreements where the Commonwealth has imposed conditions under legislation include the National Housing and Homelessness Agreement (NHHA) and the future Quality Schools Package arrangements, as wells as the revenue source underpinning the NP on the Skilling Australians Fund. This approach from the Commonwealth poses a significant risk to states’ autonomy and budget flexibility, resulting in uncertainty around the level of Commonwealth funding contribution and requiring states to cede control of a significant proportion of state budgets.
Another significant risk to the Territory’s finances and service delivery capability is the Productivity Commission (PC) Inquiry into Australia’s system of HFE, commissioned by the Commonwealth Treasurer on 5 May 2017. The inquiry is to consider the effect of Australia’s system of HFE on national and state productivity, economic growth and budget management.
Notwithstanding recognition that fiscal equity in the Australian federation has broad support, the PC’s draft report, released in October 2017, recommended a weakening of HFE and current arrangements for distributing GST revenue among the states on the basis that the mining boom has resulted in the equalisation task becoming too large. Assuming the recommendations in the final report remain unchanged and are accepted by the Commonwealth Treasurer, the redistribution of GST revenues between states that result will significantly favour the fiscally strongest jurisdiction(s), primarily at the expense of the smaller states, leading to inequitable levels of service delivery across Australia. States will be provided a level of GST revenue that will enable them to deliver services and associated infrastructure of a reasonable standard rather than at the same standard.
The majority of states, in particular the Territory, have vigorously opposed the PC’s draft report recommendations, arguing the level of GST redistribution, particularly in recent years, is a reflection that the current system of HFE is operating as intended. In particular the current system has continued to deliver a level of equity across all states throughout the economic cycle, including over the commodities boom in the last decade, and has not negatively impacted on national productivity and reform, and economic efficiency and growth.
The outcome of the recent CGC 2018 Update report clearly supports states’ views given it has resulted in recommending a relativity increase for Western Australia (the fiscally strongest state), from 0.34434 in 2017‑18 to 0.47287 in 2018‑19 reflecting its weaker capacity to raise mining royalties following the commodities boom. The report also notes the size of the redistribution task has fallen by around $1 billion, from $7.8 billion (12.5 per cent of the GST pool) to $6.8 billion (10.4 per cent), between 2017‑18 and 2018‑19.
The PC’s Final Report, which is expected to include transitional arrangements for implementing its proposed options to change HFE, is due to the Commonwealth Treasurer on 15 May 2018.

Intergovernmental Financial Relations Issues 45
Budget Strategy and Outlook
The Commonwealth has 25 sitting days to table the Final Report in Parliament prior to its public release. It is unclear at this stage when the report will be released to states and what action the Commonwealth will take. A further compounding issue is the CGC 2020 Methodology Review on GST revenue sharing relativities that is concurrently under way and may result in revisions to the current method for distributing GST.
GST revenueGST revenue is the largest revenue transfer from the Commonwealth, representing an estimated 52 per cent of Commonwealth payments to the states. For the Territory, GST revenue is estimated to account for about 64 per cent of total Commonwealth payments in 2018‑19.
A state’s GST revenue entitlement is dependent on three parameters: the state’s share of the national population, its GST relativity as determined by the Commonwealth Treasurer, and the total amount of GST revenue available for distribution to the states (usually referred to as the GST pool).
As Table 5.3 shows, the Territory’s GST revenue can be highly volatile, with actual annual growth rates ranging between ‑8.1 and 14.1 per cent across the period 2012‑13 to 2017‑18, due to the combined changes in shares of the national population, GST relativities and the GST pool. This presents a significant challenge in attempting to forecast GST parameters, particularly relativities, into the future.
Table 5.3: Territory GST revenue parameters, 2012‑13 to 2019‑20
2012‑13Actual
2013‑14Actual
2014-15Actual
2015-16Actual
2016-17Actual
2017-18Estimate
2018-19Budget
2019-20Forward estimate
GST pool ($M) 48 061 51 090 54 342 57 352 59 846 62 400 65 582 68 534
Change in GST pool (%) 4.4 6.3 6.4 5.5 4.3 4.3 5.1 4.5
Territory GST relativity 5.52818 5.31414 5.66061 5.57053 5.28450 4.66024 4.25816 4.25816
Territory share of national population (%)
1.0342 1.0404 1.0340 1.0195 1.0051 0.9910 0.9697 0.9609
Territory GST revenue1 ($M) 2 793 2 828 3 225 3 266 3 157 2 901 2 713 2 811
Change in Territory GST revenue (%) 11.4 1.3 14.1 1.3 ‑3.3 - 8.1 - 6.5 3.6
1 GST revenue amounts for 2012‑13 to 2017‑18 include balancing adjustments for the over or under payment of GST revenue to the Territory in the preceding year.
Source: Commonwealth Grants Commission, Department of Treasury and Finance
In 2017‑18, the Territory is expected to receive $2901 million in GST revenue, representing a decrease of $256 million or 8.1 per cent compared to 2016‑17. This is driven by a decline in the Territory’s share of the national population from 1.0051 per cent to 0.9910 per cent and an 11.8 per cent decline in the Territory’s GST relativity, partially offset by a 4.3 per cent increase in the GST pool. The estimate for 2017‑18 also incorporates a $17 million increase in the Territory’s GST entitlement in respect of an equivalent underpayment of GST to the Territory in 2016‑17.
In 2018‑19 the Territory’s GST revenue is expected to further decrease by $188 million, or 6.5 per cent, to $2713 million. The expected decrease is mainly due to further declines in the Territory’s GST relativity of 8.6 per cent and in the Territory’s share of the national population to 0.9697 per cent, its lowest level in 27 years. These factors will more than offset the impact of an expected 5.1 per cent increase in the GST pool in 2018‑19 (Table 5.4).

46 Intergovernmental Financial Relations Issues
2018-19 Budget
Table 5.4: Drivers of change in the Territory's GST revenue from 2017‑18 to 2018‑19
$M
Estimated GST revenue in 2017‑18 2 901
Impact of:
Increase in GST pool 147
Decrease in GST relativity - 248
Decrease in population share - 59
Interaction between GST parameters - 28
Estimated GST revenue in 2018‑19 2 713
Source: Department of Treasury and Finance
As shown in Table 5.5, current estimates of the Territory’s GST revenue in 2017‑18 and 2018‑19 are lower than estimated in the 2017‑18 Mid‑Year Report (MYR) due to downward revisions of all three GST parameters from the prior year.
Over the budget and forward estimates period, total GST revenues are estimated to be $1.4 billion less than estimated in the 2017‑18 MYR. This reduction is in addition to the $2 billion reduction in GST revenues reported in the 2017‑18 Budget, when compared to the 2016‑17 Pre‑Election Fiscal Outlook.
Table 5.5: Factors contributing to revisions in the Territory’s GST revenue estimates
2017-18 2018-19
$M $M
GST revenue
As at 2017‑18 Mid‑Year Report 2 926 3 030
As at 2018-19 Budget 2 901 2 713
Difference - 25 - 317
Change caused by:
National GST collections - 16 - 16
Relativities 0 - 252
Population - 9 - 45
Interactions1 0 ‑ 3
Total - 25 - 317
Note: Numbers may not add due to rounding.1 Impact of rounding and the interaction between the updated parameters in the calculation of states’ GST shares.Source: Department of Treasury and Finance
A detailed discussion of the GST parameters follows.
GST relativitiesOf the three GST parameters, the GST relativity is the most challenging to forecast, given the wide range of factors and variables that are used in the CGC’s methodology for calculating relativities.
The GST relativity component determines whether a state will receive more or less than its population share of the GST revenue pool. The relativities are calculated by the CGC, as the independent body responsible for recommending to the Commonwealth Treasurer the distribution of GST revenue between the states each year, in accordance with the principle of HFE.
Given that each state’s population has different characteristics, which in turn results in differences in the cost of providing a particular standard of service across states, the achievement of HFE requires that states receive different amounts of GST revenue.

Intergovernmental Financial Relations Issues 47
Budget Strategy and Outlook
HFE is responsive to both structural and cyclical changes affecting state economies, and ensures the whole federation shares in the nation’s economic booms and busts regardless of location of resource endowments and other revenue bases, that are outside government control. Simply distributing the GST on a population basis, as proposed by some states, or based on a ‘reasonable standard’ approach as suggested by the PC, would not achieve HFE and would result in states having different capacities to provide services.
In calculating GST relativities, the CGC considers across the three most recent completed financial years:
• the average state policy and revenue raised by states for seven own‑source revenue categories
• average state policy and spending in 13 expenditure categories
• how each state’s revenue‑raising capacity and expenditure‑related needs differ from the state average
• the amount of tied Commonwealth payments received by each state.
The Territory is assessed as having the lowest fiscal capacity in Australia, mainly due to the significantly above‑average cost of providing the average standard of services in the Territory and a slightly below‑average capacity to raise own‑source revenue.
The major drivers of the Territory’s above‑average service delivery costs are its small and sparsely distributed population (a significant proportion of which resides in remote areas), a relatively large disadvantaged Aboriginal population, isolation from major supply centres in the eastern states and the lack of economies of scale in service delivery and central administration.
On the revenue side, while the Territory is assessed as having above‑average capacity to raise mining revenue and payroll tax, it has below‑average capacity to raise all other types of revenues due to its relatively small tax bases compared to other jurisdictions.
Generally, the four large states have greater influence than the smaller states on the average revenue and expenditure against which all states’ fiscal capacities are assessed. In recent years, changes in relativities have been driven mainly by the revenue assessments, particularly in the mining revenue category (dominated by Western Australia) and the stamp duty category (dominated by New South Wales and Victoria). In 2016‑17, Western Australia accounted for 50 per cent of all mining revenue assessed by the CGC, while New South Wales and Victoria accounted for 69 per cent of stamp duty revenue. In addition, due to its recent strong population growth, Victoria is assessed as having a higher infrastructure investment expenditure need.
Consequently, a large change in the factors that drive these states’ revenue collections, including commodity and residential property prices, and expenditure requirements such as urban infrastructure, has a significant effect on GST relativities, particularly for the Territory as it receives a significant share of the GST redistributed by the CGC’s assessments.
In recent years the Territory’s relativity has also been significantly affected by the expenditure patterns of the large states, particularly in relation to services provided in remote areas. The large states drive the average cost of remote service delivery (against which all states are assessed), as the majority of Australia’s remote population reside in these states. However, a change in average remote service delivery costs affects the Territory’s GST relativity more substantially than it does any other state’s relativity, given a large proportion of the Territory’s population resides in remote areas.
In 2016‑17, New South Wales, Queensland and Western Australia accounted for around 65 per cent of Australia’s remote and very remote population. Consequently, changes in the spending patterns of these states drive changes in the national average cost of providing services

48 Intergovernmental Financial Relations Issues
2018-19 Budget
in remote areas. For example, if these states decrease spending, the national average service delivery cost also decreases, meaning all states are then assessed as needing to spend less to provide average services in remote areas. The magnitude of the impact on each state depends on the proportion of its own population that resides in remote areas. In 2016‑17, around 41 per cent of the Territory’s population resided in remote and very remote areas. In other jurisdictions, remote residents ranged between 0 per cent (ACT) to 6 per cent (Western Australia) of the state population. While the Territory’s GST relativity reflects its large remote population, the Territory is the most significantly impacted jurisdiction when the large states change their spending patterns in remote areas, as this directly affects the assessed expenditure needs of this group.
Given the uncertainty surrounding changes in the revenue and expenditure patterns of the larger states in the short to medium term, it is difficult to reliably forecast GST relativities over the forward estimates. The 2018 Budget applies the 2018 Update GST relativity on a constant basis across the Budget and forward estimates period. This approach is consistent to that applied in the 2017 Budget and the approach generally adopted by the Commonwealth. However, the PC’s Final Report on HFE represents a significant potential risk to the Territory’s future GST revenues.
GST poolThe GST pool is significantly affected by consumer sentiment and the resulting consumption patterns, particularly in relation to discretionary spending on goods and services subject to GST. Given the volatility of the GST pool in recent years and the Commonwealth’s greater knowledge of macro‑economic drivers, the Territory has aligned its forecasts of the average GST pool growth over the budget and forward estimates period with the Commonwealth’s 2017‑18 Mid‑Year Economic and Fiscal Outlook (MYEFO). The GST pool is expected to increase by 4.3 per cent in 2017‑18 and around 4.9 per cent per annum between 2018‑19 and 2021‑22.
Since the global financial crisis, there has been a notable shift in consumer spending patterns from items that attract GST (mainly discretionary spending) to those GST exempt, resulting in a moderation in GST collections over time. As Chart 5.2 shows, prior to the global financial crisis, the GST pool grew at an average rate of 8.3 per cent per annum. However, since the global financial crisis, GST revenue growth has been subdued, averaging 4.0 per cent per annum.
Chart 5.2: Growth in the GST pool, 2001‑02 to 2016‑17
Source: Commonwealth Final Budget Outcomes, 2001‑02 to 2016‑17
Chart 5.3 shows that consumption of items attracting GST as a proportion of private consumption was on a downward trajectory between 2005‑06 and 2012‑13, reflecting a decline in consumer spending on discretionary items. In addition, private consumption as a proportion of gross domestic
- 4
- 2
0
2
4
6
8
10
12
14
16
02 03 04 05 06 07 08 09 10 11 12 13 14 15 16 17
%
Year ended June
Average growth 8.3%
Average growth 4.0%
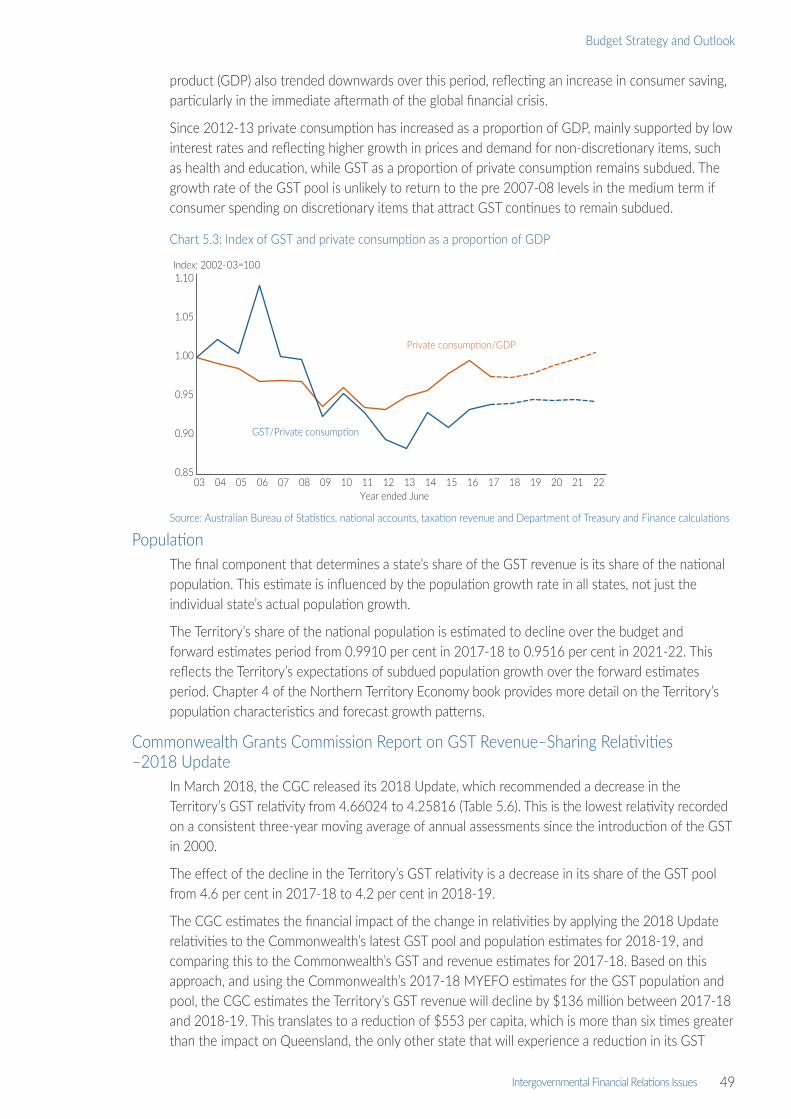
Intergovernmental Financial Relations Issues 49
Budget Strategy and Outlook
product (GDP) also trended downwards over this period, reflecting an increase in consumer saving, particularly in the immediate aftermath of the global financial crisis.
Since 2012‑13 private consumption has increased as a proportion of GDP, mainly supported by low interest rates and reflecting higher growth in prices and demand for non‑discretionary items, such as health and education, while GST as a proportion of private consumption remains subdued. The growth rate of the GST pool is unlikely to return to the pre 2007‑08 levels in the medium term if consumer spending on discretionary items that attract GST continues to remain subdued.
Chart 5.3: Index of GST and private consumption as a proportion of GDP
Source: Australian Bureau of Statistics, national accounts, taxation revenue and Department of Treasury and Finance calculations
PopulationThe final component that determines a state’s share of the GST revenue is its share of the national population. This estimate is influenced by the population growth rate in all states, not just the individual state’s actual population growth.
The Territory’s share of the national population is estimated to decline over the budget and forward estimates period from 0.9910 per cent in 2017‑18 to 0.9516 per cent in 2021‑22. This reflects the Territory’s expectations of subdued population growth over the forward estimates period. Chapter 4 of the Northern Territory Economy book provides more detail on the Territory’s population characteristics and forecast growth patterns.
Commonwealth Grants Commission Report on GST Revenue–Sharing Relativities –2018 Update
In March 2018, the CGC released its 2018 Update, which recommended a decrease in the Territory’s GST relativity from 4.66024 to 4.25816 (Table 5.6). This is the lowest relativity recorded on a consistent three‑year moving average of annual assessments since the introduction of the GST in 2000.
The effect of the decline in the Territory’s GST relativity is a decrease in its share of the GST pool from 4.6 per cent in 2017‑18 to 4.2 per cent in 2018‑19.
The CGC estimates the financial impact of the change in relativities by applying the 2018 Update relativities to the Commonwealth’s latest GST pool and population estimates for 2018‑19, and comparing this to the Commonwealth’s GST and revenue estimates for 2017‑18. Based on this approach, and using the Commonwealth’s 2017‑18 MYEFO estimates for the GST population and pool, the CGC estimates the Territory’s GST revenue will decline by $136 million between 2017‑18 and 2018‑19. This translates to a reduction of $553 per capita, which is more than six times greater than the impact on Queensland, the only other state that will experience a reduction in its GST
0.85
0.90
0.95
1.00
1.05
1.10
03 04 05 06 07 08 09 10 11 12 13 14 15 16 17 18 19 20 21 22
GST/Private consumption
Private consumption/GDP
Year ended June
Index: 2002-03=100
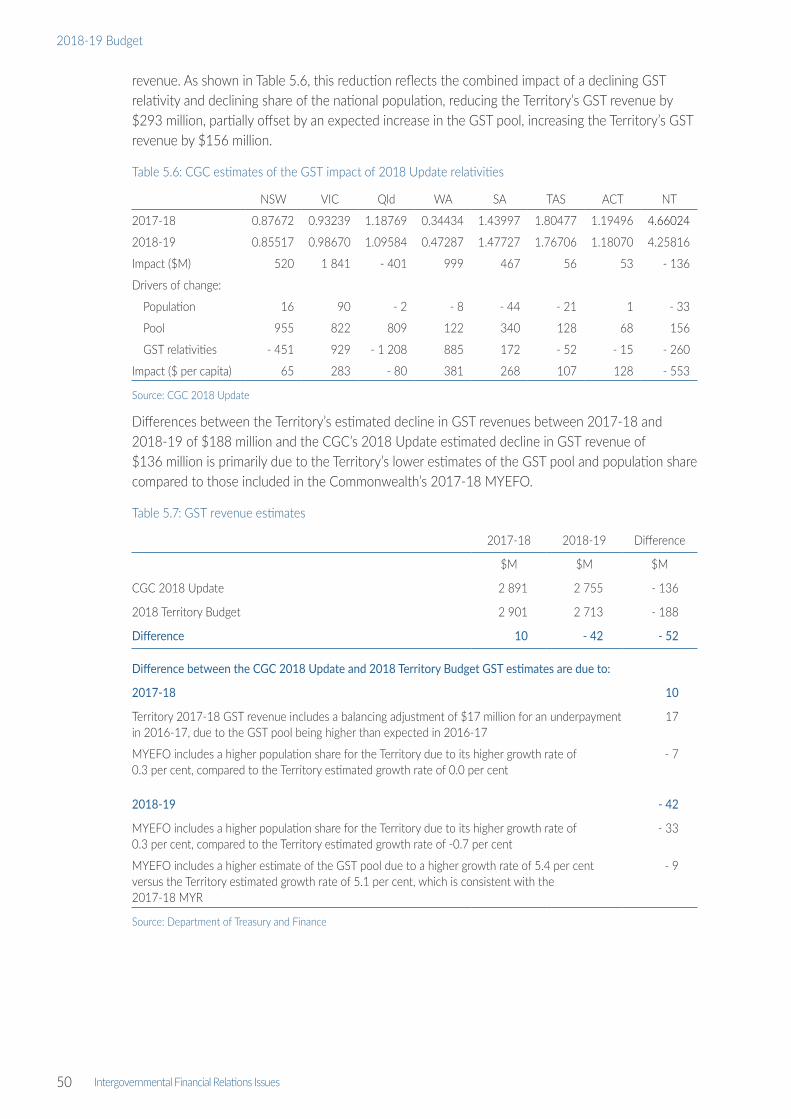
50 Intergovernmental Financial Relations Issues
2018-19 Budget
revenue. As shown in Table 5.6, this reduction reflects the combined impact of a declining GST relativity and declining share of the national population, reducing the Territory’s GST revenue by $293 million, partially offset by an expected increase in the GST pool, increasing the Territory’s GST revenue by $156 million.
Table 5.6: CGC estimates of the GST impact of 2018 Update relativities
NSW VIC Qld WA SA TAS ACT NT
2017-18 0.87672 0.93239 1.18769 0.34434 1.43997 1.80477 1.19496 4.66024
2018-19 0.85517 0.98670 1.09584 0.47287 1.47727 1.76706 1.18070 4.25816
Impact ($M) 520 1 841 - 401 999 467 56 53 ‑ 136
Drivers of change:
Population 16 90 - 2 - 8 - 44 - 21 1 ‑ 33
Pool 955 822 809 122 340 128 68 156
GST relativities - 451 929 - 1 208 885 172 - 52 - 15 - 260
Impact ($ per capita) 65 283 - 80 381 268 107 128 ‑ 553
Source: CGC 2018 Update
Differences between the Territory’s estimated decline in GST revenues between 2017‑18 and 2018‑19 of $188 million and the CGC’s 2018 Update estimated decline in GST revenue of $136 million is primarily due to the Territory’s lower estimates of the GST pool and population share compared to those included in the Commonwealth’s 2017‑18 MYEFO.
Table 5.7: GST revenue estimates
2017-18 2018-19 Difference
$M $M $M
CGC 2018 Update 2 891 2 755 ‑ 136
2018 Territory Budget 2 901 2 713 - 188
Difference 10 - 42 - 52
Difference between the CGC 2018 Update and 2018 Territory Budget GST estimates are due to:
2017-18 10
Territory 2017‑18 GST revenue includes a balancing adjustment of $17 million for an underpayment in 2016‑17, due to the GST pool being higher than expected in 2016‑17
17
MYEFO includes a higher population share for the Territory due to its higher growth rate of 0.3 per cent, compared to the Territory estimated growth rate of 0.0 per cent
- 7
2018-19 - 42
MYEFO includes a higher population share for the Territory due to its higher growth rate of 0.3 per cent, compared to the Territory estimated growth rate of ‑0.7 per cent
‑ 33
MYEFO includes a higher estimate of the GST pool due to a higher growth rate of 5.4 per cent versus the Territory estimated growth rate of 5.1 per cent, which is consistent with the 2017‑18 MYR
- 9
Source: Department of Treasury and Finance

Intergovernmental Financial Relations Issues 51
Budget Strategy and Outlook
The main contributors to the decline in the Territory’s GST relativity in the 2018 Update are the following changes in the Territory’s circumstances between the years assessed in the 2017 and 2018 updates:
• an increase in the Territory’s share of tied Commonwealth payments, which reduced its assessed need for GST funding by $88 million
• an increase nationally in investment in urban road infrastructure, for which the Territory has below‑average needs, combined with a decrease nationally in investment in rural roads, for which the Territory has above‑average needs, resulting in reduced assessed need for GST funding by $33 million
• the Territory’s reduced capacity to raise revenue from conveyance duty as a result of below‑average growth in property sales has increased its assessed need for GST funding by $29 million
• a decrease nationally on spending on utility subsidies, for which the Territory has a high share of the population receiving such subsidies, resulting in a reduced assessed need for GST funding by $25 million
• an increase in Natural Disaster Relief and Recovery Arrangements revenue in 2014‑15 and 2015‑16, reducing need for GST by $24 million.
Given the zero‑sum nature of GST distribution, changes in the circumstances of other states also have an impact on the Territory’s GST share.
Specific purpose paymentsSPPs are provided by the Commonwealth to the states to support the achievement of the outputs and outcomes agreed under the relevant sector’s NA. In 2018‑19 it is expected there will be two SPPs associated with an NA (disability, and skills and workforce development). Under the IGA, SPP funding is ongoing, indexed annually and untied within the relevant sector. SPPs are distributed among the states on a population‑share basis. The former National Healthcare SPP and National Schools SPP have been replaced with National Health Reform and Quality Schools Package funding arrangements, respectively. These payments are ongoing and indexed on a sector‑specific basis, providing a degree of certainty for states’ budgeting, similar to SPPs.
The National Affordable Housing SPP will be replaced by the NHHA from 2018‑19.
The National Health Reform Agreement replaced the former National Healthcare Agreement in July 2011, and introduced activity‑based funding of hospitals across Australia, based on a national efficient price. Similarly, the Students First funding arrangements replaced the National Education Agreement from January 2014, and was then replaced by the Quality Schools Package funding arrangements from 1 January 2018. Although these payments are no longer considered SPPs, funds are similarly linked to longer‑term reform objectives and are untied within the health and education sectors.
In 2018‑19, the Territory expects to receive $619.6 million from the two SPPs for disability, and skills and workforce development, and the two funding arrangements for health and schools.
Table 5.8 provides estimates of SPP, National Health Reform and Quality Schools Package funding to be received by the Territory in 2017‑18 and 2018‑19.

52 Intergovernmental Financial Relations Issues
2018-19 Budget
Table 5.8: Specific purpose payments, National Health Reform and Quality Schools Package
2017-18 Estimate
2018-19 Budget
$M $M
National Disability 15.5 16.1
National Skills and Workforce Development 15.1 15.3
National Affordable Housing 13.5 0.0
National Health Reform 257.1 252.6
Quality Schools Package 369.4 335.7
Total 670.6 619.6
Source: Department of Treasury and Finance
National partnership paymentsThe IGA established NP agreements to implement projects of national importance and or involving significant reform or service delivery initiatives. NP agreements have been developed for initiatives across a broad range of state services, including where the initiatives relate to reform directions outlined in NAs. Project agreements, simpler forms of NP agreements, are for initiatives that require relatively less funding than NP agreements and are considered low risk. Some NP agreements require implementation plans or schedules to outline state‑specific arrangements where sufficient detail cannot be provided in the overarching NP agreement.
The Territory currently has around 44 NP and project agreements, with the Territory expected to receive associated revenue of $456 million in 2017‑18 and $518.9 million in 2018‑19. Although NP payments may be provided as upfront payments to facilitate initiatives, the majority are paid on achievement of specified performance benchmarks or milestones. Table 5.9 provides estimates of NP revenue to the Territory by agency responsible for delivering the associated service.
Table 5.9: National partnership payments
2017-18 Estimate
2018-19 Budget
$M $M
Department of the Chief Minister 1.3 1.3
Northern Territory Police, Fire and Emergency Services 37.7 29.0
Department of Education 34.9 30.4
Department of the Environment and Natural Resources 2.7 0.5
Department of Housing and Community Development1 220.7 139.2
Department of Infrastructure, Planning and Logistics2 60.4 192.9
Department of Health 66.4 100.1
Territory Families 12.6 11.1
Department of the Attorney‑General and Justice 10.1 9.6
Department of Primary Industry and Resources 8.4 4.8
Department of Tourism and Culture 0.8 0.0
Total2 456.0 518.9
1 Reduction reflects the expiry of the recurrent funding for NP on Remote Housing at the end of 2017‑18.2 Includes Department of Infrastructure, Planning and Logistics‑managed projects on behalf of government agencies.Source: Department of Treasury and Finance

Intergovernmental Financial Relations Issues 53
Budget Strategy and Outlook
NP revenue included in the Territory’s Budget represents funding agreed by the Territory and Commonwealth governments. As additional agreements are finalised throughout the year, the Territory’s NP revenue for 2018‑19 and forward estimates will be adjusted accordingly. The timing and quantum of revenue over the life of an agreement may vary subject to the achievement of agreed milestones and or performance benchmarks, and the nature of the initiative.
The $63 million increase in NP revenue from 2017‑18 to 2018‑19 is predominantly due to a $38 million increase in the assistance to states from the Disability Care Australia Fund and a $117.8 million increase for road projects under the Commonwealth’s Infrastructure Investment Program and Developing Northern Australia initiative, partly offset by changes in the level of funding provided under the NP on Northern Territory Remote Aboriginal Investment (a reduction of $60.4 million) and the NP on Remote Housing (a reduction of $48 million).
Expiring national partnership agreements The Territory has eight NP agreements, or schedules under agreements, for which funding is expected to expire in 2017‑18, with a total of $57.71 million expected to be received in 2017‑18, the majority relating to the housing component of the Northern Territory Remote Aboriginal Investment NP. Funding in relation to a further 14 NP agreements is due to expire by the end of 2018‑19, for which total expected funding is $74.9 million in 2018‑19, with the majority related to the Royal Darwin Hospital’s National Critical Response Centre and the Asset Recycling Initiative. While many of these agreements have a high service delivery component, particularly in the sectors of skills, affordable housing, education and health, around 74 per cent of the total funding during this period is capital.
Table 5.10 shows the NP agreements and associated funding due to expire in 2017‑18.
Table 5.10: Expiring national partnership agreements
Expiring in 2017-18
$M
Remote Aboriginal Investment – Remote Australia Strategies Implementation Plan – Housing 47.42
Construction of Palmerston Regional Hospital 8.00
Family Advocacy and Support Services 0.54
Tourism Demand‑Driver Infrastructure 0.78
National Quality Agenda for Early Childhood Education and Care 0.30
National Bowel Cancer Screening Program – Participant Follow‑up Function 0.12
Online Safety Program in Schools 0.08
National School Chaplaincy Program 0.48
Total 57.71
Source: Department of Treasury and Finance
Under the IGA, the Council on Federal Financial Relations may make recommendations as to the treatment of expiring NP agreements, however details regarding the continuation of the majority of expiring NP agreements are not generally known until the Commonwealth Budget is handed down. Given NP agreements are generally based on a financial‑year basis, this timing makes it extremely difficult for governments to budget appropriately.
If NP payments cease, additional demands may be placed on state finances to continue to deliver relevant services. While the expiry of NP agreements that focus on discrete initiatives (such as infrastructure) can be relatively easily managed by states, it is more problematic where the NP agreement creates expectations of ongoing service delivery that may or may not accord

54 Intergovernmental Financial Relations Issues
2018-19 Budget
with state priorities. Although the Territory takes steps to manage public expectations of Commonwealth‑funded programs and services, the effect of expiring NP agreements on the Territory’s budget remains a risk and will continue to be closely monitored.
Commonwealth revenue received by Territory agenciesDetails of the significant SPPs and NP payments expected to be received in 2018‑19 by Territory agencies are provided in the following section.
Department of Trade, Business and InnovationNational Skills and Workforce Development SPPThe National Skills and Workforce Development SPP supports the achievement of objectives included in the NA on Skills and Workforce Development. In 2018‑19, the Territory expects to receive $15.3 million for this SPP.
The NA on Skills and Workforce Development aims to achieve a vocational education and training (VET) system that delivers a more productive and highly skilled workforce, enabling all working‑age Australians to participate effectively in the labour market and contribute to Australia’s economic future. It was revised in April 2012 and, while it maintains a broadly similar intent to the previous NA, the revised agreement has a stronger focus on VET reform and economic participation.
The NP Agreement on Skills Reform and the Skilling Australians FundThe NP Agreement on Skills Reform expired on 30 June 2017 and the Commonwealth has established a permanent Skilling Australians Fund for all states, with the distribution of the fund to be managed through the NP on the Skilling Australians Fund. The aim of the fund is to improve employment outcomes in Australia by supporting up to an additional 300 000 apprenticeships and traineeships nationwide, from 2017‑18 to 2020‑21.
Under the fund, the Commonwealth will provide an estimated $350 million to the states in 2017‑18. From 2018‑19, the Commonwealth’s financial contribution will be subject to revenue generated from the fund. Revenue for the fund will be generated through a levy collected from employers accessing workers under the temporary and permanent employer‑sponsored migration programs.
During negotiations with the Commonwealth all states raised concerns about maintenance of effort requirements, given its impact on states' sovereignty, and the uncertainty surrounding the Commonwealth’s contributions under the agreement if revenue generated under the fund is lower than estimated.
Department of Infrastructure, Planning and LogisticsNP agreements as part of the Infrastructure Investment Program and Infrastructure Growth Package in the Northern TerritoryThe NP agreements that are part of the Infrastructure Investment Program and Infrastructure Growth Package aim to improve the productivity, efficiency and safety of an integrated national land transport network in the Territory, to enhance Australia’s economic growth and international competitiveness. They encompass a number of road programs including national network construction and maintenance and off‑network projects. In 2018‑19, the Territory anticipates receiving $154.5 million under these NP agreements.

Intergovernmental Financial Relations Issues 55
Budget Strategy and Outlook
Department of HealthNational Health Reform agreementThe National Health Reform (NHR) Agreement provides an activity‑based funding framework and arrangements aimed at improving patient access to services and increasing public hospital efficiencies by funding agreed services based on a national efficient price.
Between 2017‑18 and 2019‑20, the Commonwealth will cap its total funding contribution growth for NHR payments at 6.5 per cent, with arrangements in place for distributing this funding across states. In addition, the Territory has negotiated an annual contingency amount of up to $15 million should there be a gap between the Territory’s hospital activity and the Commonwealth’s cap during this period.
At the 9 February 2018 COAG meeting, New South Wales and Western Australia were the only jurisdictions to sign a new Heads of Agreement (HoA) on public hospital funding and health reform. The HoA forms the basis for a five‑year national health agreement, beginning 1 July 2020, which will continue to see growth in Commonwealth funding capped at 6.5 per cent nationally per annum.
In 2018‑19, the Territory anticipates receiving $252.6 million under the current NHR agreement, for hospital services, teaching, training and research, and public health activities.
National Disability Services SPPThe National Disability Services SPP supports the achievement of outputs and outcomes under the National Disability Agreement, which aims to enable people with a disability to achieve economic participation and social inclusion, and enjoy choice, wellbeing and the opportunity to live as independently as possible. It also aims to ensure families and carers of people with a disability are supported. The Commonwealth has assumed funding and policy responsibility for all aged care services for non‑Aboriginal people aged 65 years and over, and Aboriginal people aged 50 years and over. The Territory has funding and program responsibility for basic community care services for people under these ages in line with its principal responsibility for the delivery of other disability services under the National Disability Agreement. In 2018‑19, the Territory expects to receive $16.1 million for the National Disability SPP.
Project Agreement for the National Critical Care and Trauma Response CentreThe Project Agreement for the National Critical Care and Trauma Response Centre supports the continued operation and development of the Centre in Darwin as a hub for emergency care and health responses to incidents of national and international significance, and for maintaining and building disaster response research and education capabilities, with $16.3 million expected to be received in 2018‑19.
NP Agreement on Health InfrastructureThe NP Agreement on Health Infrastructure encompasses existing Health and Hospital Fund infrastructure projects in the Territory, including the establishment of new remote renal clinics as well as minor upgrades to most regional hospitals. The Territory anticipates it will receive $10.7 million in 2018‑19 for health infrastructure initiatives.
Department of Housing and Community DevelopmentNational Affordable Housing SPP and NHHAThe National Affordable Housing SPP aims to provide support and accommodation for people who are homeless or at risk of homelessness and to assist people with social housing and those in the private rental market who are purchasing houses. Improving affordable housing opportunities and reducing overcrowding for Aboriginal people are specific focuses of this agreement. In 2017‑18,

56 Intergovernmental Financial Relations Issues
2018-19 Budget
the Territory expects to receive $13.5 million for the National Affordable Housing SPP to fund supported accommodation projects.
The NHHA will replace the National Affordable Housing SPP and the NP Agreement on Homelessness from 2018‑19, and will maintain funding levels provided under those agreements. Funding will be ongoing, indexed and tied to the achievement of agreed outputs. The funding distribution between jurisdictions under the NHHA will be as currently provided for under the Affordable Housing SPP and the NP Agreement on Homelessness, with the Territory estimated to receive around $19.1 million per annum.
National Partnership Agreement on Remote HousingThe current National Partnership Agreement on Remote Housing expires at the end of 2017‑18.
In 2016 the Commonwealth Minister for Indigenous Affairs commissioned a review into Remote Housing which identified the need for an additional 5500 homes across Australia by 2028 to reduce levels of overcrowding in remote areas to acceptable levels, half of which is required in the Northern Territory alone.
In recognition of this fact the Territory and the Commonwealth have committed to a further five‑year funding agreement for remote Indigenous housing from 2018‑19. While specific details are yet to be finalised, the new agreement will provide $550 million in Commonwealth funding from 2018‑19 to 2022‑23, which will effectively match the Territory’s annual investment of $110 million over the same period under its $1.1 billion 10‑year housing program aimed at addressing remote Aboriginal overcrowding.
Department of Primary Industry and ResourcesProject Agreement for the Management of the Former Rum Jungle Mine Site (Stage 2a)The Project Agreement for the Management of the Former Rum Jungle Mine Site aims to support the delivery of the Rum Jungle Mine Site Rehabilitation Project (stage 2a) at sites within the former Rum Jungle uranium mine to ensure it continues to meet Australia’s public radiation protection standards. The Territory is expected to receive about $4.1 million in 2018‑19.
Department of EducationQuality Schools Package The Quality Schools Package commenced from 1 January 2018 and replaces the Students First funding arrangements, which focused on the key areas of teacher quality, school autonomy, engaging parents in education and strengthening the curriculum.
On 22 June 2017, the Commonwealth passed amendments to the Australian Education Act 2013, to modify Commonwealth funding currently provided for schools under the Students First Funding arrangements as part of the Commonwealth’s Quality Schools Package. The amendments will transition Commonwealth funding for schools to a consistent rate across jurisdictions and introduce funding targets for states that will deliver total funding at least equivalent to 95 per cent of the Schooling Resource Standard (SRS) for all schools by 2023.
Under the new Quality Schools Package arrangements, the Commonwealth will fund 20 per cent of the SRS for Territory government schools, requiring the Territory to fund 75 per cent of the SRS, with penalties for not achieving and maintaining the required share of the SRS. These requirements pose a significant financial risk to the Territory. Bilateral discussions are currently ongoing and states have signed an interim agreement that enables Commonwealth funding for the 2018 calendar year to be provided.
The Territory has budgeted to receive Commonwealth funding totalling $335.7 million in 2018‑19. This figure is lower than that published in the Commonwealth’s MYEFO in recognition of the

Intergovernmental Financial Relations Issues 57
Budget Strategy and Outlook
fiscal challenges associated with meeting the proposed Territory’s contribution requirements. The Territory will continue to work with the Commonwealth to negotiate a fiscally sustainable bilateral agreement for funding from the 2019 calendar year that meets the needs of Territory students. The agreement is expected to be finalised by mid‑2018.
NP Agreement on Universal Access to Early Childhood EducationThe Territory continues to participate in the NP Agreement on Universal Access to Early Childhood Education, which aims to improve access to quality early childhood education and preschool programs in the year before full‑time schooling. The Territory expects to receive $3.3 million in 2018‑19 from the Commonwealth under this NP agreement.
Multi‑agency agreementsNP Agreement on Northern Territory Remote Aboriginal InvestmentThe National Partnership on Northern Territory Remote Aboriginal Investment (NTRAI) aims to improve Aboriginal outcomes through funding programs in the areas of health; schooling; community safety and justice; tackling alcohol abuse; child, youth, family and community wellbeing; housing; municipal and essential services; and remote engagement and coordination. Under NTRAI, the Territory will be eligible to receive up to $1028.7 million between 2015‑16 and 2021‑22, including funding for non‑government schools of around $42.6 million.
Seven agencies are directly engaged in delivering initiatives under this NP agreement, with Commonwealth NP payments of $94.5 million anticipated in 2018‑19. Commonwealth and Territory own‑purpose funding will also contribute to achieving the intended outcomes of this NP.
National Disability Insurance SchemeThe National Disability Insurance Scheme (NDIS) was a key recommendation from the PC’s report into a national long‑term disability care and support scheme. The NDIS will reform the way the Commonwealth and states fund and deliver disability services in Australia.
The NDIS is aimed at providing life‑long care and support for people with a significant disability, including greater choice and control over the supports received and a focus on early intervention.
In December 2012, COAG signed an intergovernmental agreement for the NDIS launch. The agreement sets out the objectives, roles and responsibilities of all parties during the first stage of the NDIS and provides a framework for progressing to a full scheme.
In May 2016, the Territory Government signed a bilateral agreement for transition to the full scheme, built on the lessons learnt from the Barkly trial. The Territory commenced a staged, region‑by‑region rollout of the NDIS from 1 January 2017. Currently, the NDIS is available in the East Arnhem, Barkly, Darwin remote and Katherine regions of the Territory and to all supported accommodation participants. From 1 July 2018, the NDIS will become available in the Darwin urban area and Central Australia, including Alice Springs. Full scheme NDIS will commence in the Territory from 1 July 2019.

58
2018-19 Budget

Territory Taxes and Royalties 59
Budget Strategy and Outlook
Chapter 6Territory Taxes and RoyaltiesOverview
Although the Territory is more reliant on Commonwealth grants than other jurisdictions, the Territory’s own‑source revenue forms an important component of total revenue. Own‑source revenue provides states with the fiscal autonomy to tailor infrastructure and services to meet the needs of their respective jurisdiction.
Territory own‑source revenue predominantly comprises taxes and mining revenue but also includes fees and charges, rent and tenancy income, interest and dividend revenue, and profit and loss on the disposal of assets. It comprises 33 per cent of the Territory’s total revenue in 2018‑19.
This chapter provides details of the Territory’s own‑source revenue categories of taxes and royalties, information on revenue forecasts and a comparison of the Territory’s taxation revenue with other jurisdictions. It also includes a statement of the Territory’s forecast tax expenditure as a result of concessions and exemptions for 2017‑18 through to 2021‑22, as required by the Fiscal Integrity and Transparency Act (FITA).
Analysis of Territory taxes and royaltiesThe projected revenue from taxes and royalties for 2018‑19 totals $802.6 million. The main contributors are mining royalties at $271.8 million or 34 per cent, taxes on employers (payroll tax) estimated at $242.6 million or 30 per cent, and taxes on gambling at $82.9 million or 10 per cent.
Chart 6.1 shows the Territory’s estimated main own‑source revenues for 2018‑19 according to the classification used in the Uniform Presentation Framework adopted for the Territory’s reporting requirements.
Chart 6.1: Main taxes and royalties categories, 2018‑19
Note: Excludes payroll tax from the non‑financial public sector.Source: Department of Treasury and Finance
As shown in Table 6.1, the latest estimated revenue in 2017‑18 from taxes and royalties totals $953.5 million, compared to the original 2017‑18 budget forecast of $782.6 million. The $170.9 million increase is mainly due to higher royalty collections, resulting from the value of mineral production, and payroll tax, largely related to the extension of the construction phase of the Ichthys liquefied natural gas (LNG) project and the associated higher level of peak work force for employers associated with the project.
Mining royalties $271.8M
Taxes on employers $242.6M Taxes on property $79.6M
Taxes on gambling $82.9M
Motor vehicletaxes $79.6M
Taxes on insurance $46.1M

60 Territory Taxes and Royalties
2018-19 Budget
For 2018‑19 a decrease of $150.9 million in own‑source revenue from taxes and royalties is expected. This decrease is predominantly due to lower mineral royalty forecasts, based on royalty payer estimates, and also a reduction in payroll tax collections, largely related to the expected timing of construction completion of the Ichthys LNG project.
Table 6.1: Main taxes and royalties category estimates 2017-18
Budget2017-18 Estimate
2018-19 Budget
$000 $000 $000
Mining royalties 225 037 335 668 271 807
Taxes on employers 260 030 343 445 242 594
Taxes on property 103 532 73 570 79 571
Taxes on gambling 78 016 78 908 82 881
Motor vehicle taxes 76 713 76 714 79 600
Taxes on insurance 39 255 45 194 46 098
Total 782 583 953 499 802 551
Source: Department of Treasury and Finance
Revenue initiativesThe 2018 Budget includes several changes in revenue policy. In summary, the main policy changes are:
• the Local Employment Package provides a payroll tax exemption for Territory resident employees starting new jobs from 1 May 2018 to 30 June 2020, allows miners in the calculations of royalties to deduct the costs of building social infrastructure and accommodation costs for Territory employees and removes royalty deductions for travel and ancillary costs for employees who do not reside in the Territory
• a minimum royalty based on the gross value of mineral production, commencing 1 July 2019 at a rate of 1 per cent and increasing to 2.5 per cent over the first three years of production for each royalty payer
• a derelict and vacant property levy, commencing 1 July 2019, on unoccupied commercial land in the Darwin central business district, at a rate of 1 per cent of unimproved capital value for buildings which are 50 per cent or more vacant, and 2 per cent for undeveloped vacant property
• deferral of community gaming machine tax increases on hotels that were to commence 1 July 2018.
Further information on these initiatives is provided later in this chapter. Additionally, other minor amendments have been made to:
• remove the stamp duty exemption on the transfer of petroleum and pipeline interests
• provide a stamp duty exemption for vehicles registered in the Territory as a result of the closure of the Federal Interstate Registration Scheme
• update a reference to the stamp duty senior, pensioner and carer concession to reflect the new Northern Territory Concession Scheme
• ensure the value of the revenue unit from 1 July 2018 increases by the greater of the consumer price index (CPI) or 3 per cent.

Territory Taxes and Royalties 61
Budget Strategy and Outlook
Mining and petroleum revenueMining revenue is obtained from royalties levied on the recovery of mineral commodities from mining tenements in the Territory. Similarly, petroleum revenue accrues from royalties imposed on the production of petroleum resources in the Territory. Mineral and petroleum royalties are a charge for resource usage, payable to the Territory as the owner of the site or the mineral or petroleum rights over the site.
Other states primarily use output‑based royalty schemes that impose a royalty rate on the value of production (ad valorem) or on the tonnage extracted. The Territory’s mining royalty revenues are generally based on a profit‑based regime specified under the Mineral Royalty Act. From 1 July 2019 this will move to a hybrid royalty scheme, where a royalty payer is required to pay the greater of the profit‑based calculation or a minimum value‑based royalty.
The Territory’s profit‑based calculation uses the net value of a mine’s production to calculate royalty. This is the operating revenue derived from mining activities after deducting allowable project costs, prior year carried forward losses, the cost of capital employed in the mine and cost of capital and exploration expenditure on the mine site. The minimum royalty commences 1 July 2019, and is based on the gross value of mineral production and calculated at the rate of 1 per cent in a mine’s first royalty year, 2 per cent in the second royalty year and 2.5 per cent per annum thereafter. Small mines with gross production revenue under $500 000 per annum will not be required to pay royalty.
Concerns were raised by the community as part of consultations on the Revenue Discussion Paper that a number of smaller mines had operated for short periods of time before going into care and maintenance or closing, and had not been liable to pay royalties under the profit‑based scheme. Similarly, concerns were raised that large mature mines could be in a non‑royalty paying situation in certain years despite being operational for many years and having a high production volume. The minimum value‑based royalty addresses these concerns by ensuring all mines make a financial contribution for the extraction of non‑renewable Territory resources, while ensuring the Territory is competitive and attractive for new mines by setting a low initial rate that increases over the first three years of production.
A further change to the mineral royalty regime stems from Government’s Local Employment Package. As part of this, a mineral royalty deduction will be provided for the costs of providing accommodation for resident employees. While the necessary accommodation on site for a mine (such as camp facilities) are already deductible, this will extend to, for example, building or renting accommodation in a nearby Territory town or city for mine workers in order to attract Territory residents in preference to interstate fly‑in fly‑out workers. Similarly, a current deduction for the costs of travel and ancillary expenses for interstate workers will no longer be provided.
Also, a mineral royalty deduction will be allowed for the costs of social infrastructure built by the mining company that is beneficial to nearby communities affected by the mine’s operations. This may include recreational or social facilities, such as sporting ovals or swimming pools, or developing or paving town roads.
Mineral royalties are collected in the Territory from mining for gold, silver, bauxite, manganese, lead, zinc and limestone. Other mineral commodities, such as copper, phosphate, rare earths and iron, are also subject to royalties under the Territory’s Mineral Royalty Act. However, the Territory Government is unable to impose royalties on uranium mined in the Territory as, unlike the states, the Commonwealth retains the ownership of uranium. Nonetheless, the Territory receives a grant in lieu of uranium royalty from the Commonwealth.

62 Territory Taxes and Royalties
2018-19 Budget
The only uranium mine in the Territory is the Ranger Project, which has a long‑standing ad valorem royalty scheme applied by the Commonwealth. The Territory receives grant payments reflecting the royalty regime that applied at the time the Ranger Project arrangements were settled. However, Commonwealth legislation provides that royalty on any future uranium mines in the Territory would be based on the Mineral Royalty Act. Royalties would continue to be paid to the Territory as a grant in lieu of royalty.
A key feature of the Territory’s Mineral Royalty Act is that both prices and mining costs, including mine setup costs carried forward to profitable years, are taken into account in royalty calculations. If commodity prices, production costs or the value of the Australian dollar rise or fall, royalty liabilities vary accordingly. This variability produces stronger growth in royalty revenues in times of high mineral prices than under ad valorem royalties.
In terms of petroleum royalties, the Territory’s Petroleum Act imposes an ad valorem royalty on the value of production, which is generally consistent with the position across Australia.
In 2017‑18, it is expected the Territory will receive $335.7 million in mining and petroleum revenue, $110.6 million higher than forecast in the 2017‑18 budget, based on collections to date.
Mining and petroleum revenue forecasts are reliant on advice from mining companies and petroleum producers of estimated liability and related company estimates of commodity price movements, production levels and the value of the Australian dollar. The forecast for royalty revenue in 2018‑19 is $271.8 million and is based on forecasts from royalty payers. Forecasts are based on the assumption the Australian dollar and commodity prices, especially in relation to gold, bauxite and manganese, do not materially change. Royalties are expected to moderate to $239.3 million per annum over the forward estimates, based on estimates provided by royalty payers and the effects of the 2018 Budget royalty scheme changes.
Taxation revenue The Territory’s taxation revenue for 2017‑18 is expected to total $617.8 million. In 2018‑19 taxation revenue is expected to decrease by 14.1 per cent to $530.7 million.
The components of the Territory’s taxation revenue are payroll tax, stamp duty on conveyances, taxes on gambling, taxes on insurance, and motor vehicle fees and taxes. Table 6.2 shows the 2017‑18 forecast at the 2017 Budget, estimate at the 2018 Budget, and the forecast for 2018‑19.
Table 6.2: Territory taxation revenue 2017-18
Budget2017-18 Estimate
2018-19 Budget
$000 $000 $000
Taxes on employers
Payroll tax 260 030 343 445 242 594
Taxes on property
Conveyance and related duty 103 532 73 570 79 571
Taxes on the provision of goods and services
Taxes on gambling 78 016 78 908 82 881
Taxes on insurance 39 255 45 194 46 098
Taxes on use of goods and performance of activities
Motor vehicle taxes 76 713 76 714 79 600
Total 557 547 617 831 530 744
Source: Department of Treasury and Finance

Territory Taxes and Royalties 63
Budget Strategy and Outlook
Payroll taxPayroll tax is payable in the Territory when the total annual Australian wages of an employer (or group of employers) exceeds the Territory’s annual threshold amount of $1.5 million. The threshold reduces proportionately if an employer pays wages in another state or territory. The threshold amount is a deduction from taxable wages, which operates so businesses with total Australian wages of up to $1.5 million do not pay any payroll tax. The deduction reduces by $1 for every $4 in wages paid by an employer above the $1.5 million threshold. This means an employer paying wages of $7.5 million or more does not receive a deduction.
Payroll tax is calculated at the rate of 5.5 per cent, based on taxable wages (less the deduction) paid by an employer for services rendered by employees in the Territory.
In 2017‑18, payroll tax revenue is expected to be $343.4 million, an increase of about $83.4 million from the forecast of $260 million in the 2017‑18 Budget. This largely reflects the extension of the construction phase of the LNG project and the associated higher level of peak work force for employers associated with the project.
With a range of potential smaller scale major projects not included in tax forecasts given the uncertainty around final investment decisions and timing, payroll tax collections are expected to decline in the next two financial years before recovering modestly with growth of 2.5 per cent per annum expected from 2020‑21. Accordingly, in 2018‑19 payroll tax receipts are expected to be lower at $242.6 million.
This is mainly due to compositional changes in the payroll tax base as the Ichthys LNG project transitions from construction to a much smaller ongoing production workforce. The level of ongoing employment required for operational and maintenance work at the Ichthys LNG project, together with any changes in the timing of the transition of the project from the construction to production phase, as well as assumptions around the broader economic outlook and lower projected employment and wages growth, will impact on the extent of the decline in payroll tax collections.
The forecasts also reflect the Government’s Local Employment Package, which will provide a payroll tax rebate for new employees hired on or before 30 June 2020 for the first two years of employment of either:
• a new employee who is resident and working in the Territory that increases the number of employees of the Territory business, or
• The replacement of a former employee who was not previously resident in the Territory with a Territory resident that works in the Territory.
The Local Employment Package reflected feedback from the community through the Revenue Discussion Paper consultations that the tax and royalty schemes should provide incentives for Territory businesses to employ Northern Territory residents in preference to interstate based fly‑in fly‑out workers. This was of particular relevance in Territory towns outside the greater Darwin region and regions with existing mining activity or potential new mines being opened.
Employers will be able to claim the rebate as exempt wages on a monthly basis, with a requirement to substantiate eligibility through the annual payroll tax reconciliation process by keeping records evidencing the increase in the business’ employee numbers and proof of residence for the new employees.
The effect on payroll tax is expected to be about $3.5 million per annum over the life of the package.

64 Territory Taxes and Royalties
2018-19 Budget
Stamp duty and other property revenueConveyance and related dutyThe Territory’s conveyance and related duty is derived from direct and indirect conveyances of dutiable property in the Territory. Such property comprises real estate and transfers of businesses.
Conveyance and related duty in the Territory is calculated by a formula that determines a rate applicable to the value of dutiable property conveyed. This is different from the other states, which levy stamp duty on the basis of marginal rates. A comparison of the Territory’s stamp duty regime with the other states is provided later in this chapter.
In 2017‑18, the Territory is expected to collect $73.6 million in conveyance and related duty, a decrease of $30 million from the 2017‑18 Budget forecast. This is mainly due to continued softness in the residential and commercial property market.
In 2018‑19, conveyance and related duty is estimated to increase slightly to $79.6 million, reflecting a slight improvement in the forecast of residential property market, in terms of both transaction volumes and prices, and the removal of the stamp duty exemptions for the transfer of petroleum and pipeline interests.
Derelict and vacant property levyCommencing 1 July 2019, Government will introduce a derelict and vacant property levy relating to unoccupied commercial land in the Darwin CBD. The levy will be imposed at a rate of 1 per cent of unimproved capital value for vacant buildings and 2 per cent for vacant undeveloped land. Vacancy will be assessed on the use of the property for the 12 months preceding the tax being assessed, with a property that is more than 50 per cent vacant for the preceding year, based on the proportion of utilised space and proportion of the year the space is occupied, being subject to the levy.
The levy responds to significant community and business concerns as to the amount of vacant, undeveloped or under‑utilised land and property in the Darwin CBD. The levy is intended to stimulate owners to develop or update properties, and offer reasonable lease terms for businesses, and social organisations seeking commercial premises.
Subject to finalising the design of the levy, it is expected to raise $3 million per annum.
Stamp duty on insurance Insurance duty is imposed on general insurance policies. Stamp duty on general insurance is calculated at a rate of 10 per cent of the premium paid on all general insurance products relating to property or risk in the Territory. Where the policy also relates to a risk or property outside the Territory, the premium is apportioned.
Revenue from insurance duty is estimated to be $45.2 million in 2017‑18. Insurance duty is forecast to grow marginally to $46.1 million in 2018‑19 and by 2 per cent per annum over the forward estimates thereafter.
Motor vehicle taxes Motor vehicle taxes comprise stamp duty on the transfer and initial registration of motor vehicles and motor vehicle registration fees.
Generally, stamp duty is levied on the purchase price of the vehicle at a rate of $3 per $100 or part thereof. Revenue from this source in 2017‑18 is estimated to be $22.8 million. In 2018‑19, it is expected to increase to $23.4 million, which includes the long‑term growth rate applied to the forward estimates of 2.5 per cent per annum.

Territory Taxes and Royalties 65
Budget Strategy and Outlook
Motor vehicle registrations comprise heavy vehicle and light vehicle registrations. Heavy vehicle registration fees are determined by the Standing Council on Transport and Infrastructure.
Light vehicle registration fees are determined by each state. In the Territory, the light vehicle registration fee is calculated by reference to a differential rate scale based on the engine capacity of the vehicle. Fees are expressed in revenue units and therefore are adjusted each year in line with movements in the CPI or by a minimum of 3 per cent.
In 2017‑18, the Territory is forecast to receive $53.9 million in motor vehicle fees, increasing to $56.2 million in 2018‑19, reflecting the 3 per cent increase in the revenue unit value that will occur on 1 July 2018. Revenue from motor vehicle fees are forecast to increase by 3 per cent over the forward estimates.
Gambling taxesIn 2018‑19, gambling tax revenue is forecast to be $82.9 million, or the third largest contributor to the Territory’s own‑source taxation and royalty revenue. The components of gambling taxes in the Territory are community gaming machine tax, lotteries tax, the community benefit levy, bookmaker tax, casino/internet tax, wagering tax and betting exchange tax.
In 2017‑18, the Territory expects to receive $78.9 million in gambling taxes, a slight increase from the 2017-18 Budget.
Table 6.3 shows the estimated revenue from each of the Territory’s gambling taxes.
Table 6.3: Estimated revenue from gambling taxes 2017-18
Budget2017-18Estimate
2018-19Budget
$000 $000 $000
Community gaming machine tax 32 494 32 494 35 619
Lotteries tax 23 412 23 412 23 997
Community benefit levy 11 593 11 593 12 173
Bookmaker tax – racing and sports betting tax 5 397 6 289 5 863
Casino/internet tax 3 782 3 782 3 876
Wagering tax 763 763 763
Betting exchange tax 575 575 590
Total 78 016 78 908 82 881
Source: Department of Treasury and Finance; Department of the Attorney‑General and Justice
Community gaming machine tax is based on gross profits (that is, net player losses) from gaming machines and is expected to increase from a forecast of $32.5 million in 2017‑18 to over $35.6 million in 2018‑19, and by 5 per cent per annum over the forward estimates. Stronger than expected growth in gaming machine tax receipts means the forecast revenue in 2018‑19 has not been revised downward despite the deferral of tax increases that were to occur on 1 July 2018.
The community benefit levy, which is directed to the Community Benefit Fund, is expected to record growth of 5 per cent per annum over the forward estimates.
In 2017‑18, bookmaker tax is expected to increase to $6.3 million due to the entry of a new bookmaker, while betting exchange tax is estimated to be $0.6 million, following the establishment of a betting exchange licensing scheme in 2016. Similarly, minimal change in casino/internet tax is expected with limited growth expected over the forward estimates.
Lotteries tax for 2018‑19 is expected to increase slightly, reflecting the annual growth rate of 2.5 per cent used in the forward estimates.

66 Territory Taxes and Royalties
2018-19 Budget
Wagering tax is expected to remain stagnant over the forward estimates, reflecting the market impact of many consumers having switched from betting with totalisators to utilising betting services provided by corporate bookmakers.
Interstate tax comparisonThe composition of state taxes is broadly similar between the states, however there are differences in the application of particular taxes. These differences primarily relate to rates, exemptions and thresholds. The ability of states to modify their rates and tax bases promotes competition between states, and provides the autonomy and capacity to structure their tax systems to accommodate their specific fiscal, economic and social circumstances.
Various approaches to measuring tax competitiveness can be adopted. Two common approaches are the Commonwealth Grants Commission (CGC) measures of taxation effort and capacity, and the representative taxpayer model.
Commonwealth Grants CommissionRevenue effortCGC assesses each state’s revenue‑raising effort on an annual basis. Revenue effort is the ratio of the actual amount of revenue a state raises to the amount of tax revenue CGC assesses could be raised if the state applied national average tax rates to its tax base.
Average revenue effort is assessed as 100 per cent. A state with an above‑average revenue effort will score more than 100 per cent, while a below‑average effort scores less than 100 per cent.
Table 6.4 provides a comparison of the CGC’s assessment of taxation and own‑source revenue‑raising effort in 2016‑17 (the latest year an assessment is available). The total own‑source revenue figures include taxation, mining revenue, contributions by trading enterprises and public safety user charges. The table shows the Territory’s taxation and own‑source revenue‑raising effort is below the national average; the lowest of all the states with respect to total taxation and second lowest with respect to total own‑source revenue.
This is consistent with the result seen in 2015‑16 when the Territory’s total taxation and own‑source revenue efforts were 85 per cent and 95 per cent, respectively.
Table 6.4: 2016‑17 Revenue effort by jurisdiction
NSW Vic Qld WA SA Tas ACT NT
% % % % % % % %
Total taxation 104 105 85 102 103 89 97 84
Total own‑source revenue 98 97 104 101 103 88 154 92
Source: Commonwealth Grants Commission 2018 Update
The Territory’s low total taxation and own‑source revenue effort largely reflects the position adopted by the Territory not to impose a land tax and to levy lower than average motor vehicle taxes.
Revenue capacity States are limited to growing their own‑source revenues by either replacing current taxes with a new growth tax or by expanding existing tax bases. Nationally, state own‑source revenue comprises only about 50 per cent of total state revenue. However, in 2017‑18 the Territory’s taxation and royalty own‑source revenue is much lower, comprising about 15 per cent of total revenue for the non financial public sector.

Territory Taxes and Royalties 67
Budget Strategy and Outlook
The revenue limitations imposed on the states are the result of the Australian Constitution and Commonwealth‑state financial relations. For instance, states are unable to raise excise and customs duties and the Commonwealth has long assumed the collection of income tax.
In addition, state taxation policy provides a balance between raising sufficient revenue to deliver government services, minimising the tax burden on the community, fostering business development and creating a tax environment that is competitive with other jurisdictions.
Although all states face similar constraints in raising own‑source revenue, the Territory’s capacity to raise revenue is further limited by its relatively small revenue base. This is illustrated in Table 6.5, which shows the CGC’s assessments of revenue‑raising capacity for the major taxes and mining revenue. Revenue capacity is the ratio of the per capita amount a state could raise if it applied the national average policy to its tax base, compared to the actual per capita average revenue raised on the national tax base. This measure removes differences in state policies.
Table 6.5: Assessed revenue‑raising capacity, 2016‑17 NSW Vic Qld WA SA Tas ACT NT
% % % % % % % %
Payroll tax 109 95 89 129 72 61 104 122
Land tax 118 111 78 102 61 56 62 76
Stamp duty 128 105 94 59 56 58 98 52
Insurance tax 108 93 97 98 108 83 96 112
Motor tax 91 100 104 117 105 117 83 90
Total taxation 113 101 92 97 75 71 94 88
Mining revenue 48 3 149 472 29 32 0 151
Source: Commonwealth Grants Commission 2018 Update
Other than payroll tax and insurance tax, the Territory is assessed as having a relatively low capacity to raise taxes, particularly land tax and conveyance duty, where the Territory’s capacity is significantly below the national average of 100 per cent. This reflects the Territory’s different circumstances, such as a relatively small number of very high value commercial and residential properties.
Representative taxpayer modelComparisons can also be made of states’ tax schemes by comparing the amount of tax payable by a representative household or firm. This approach takes into account the different circumstances of each state by applying each state’s tax rate to a representative or average standard.
Payroll taxTable 6.6 compares the payroll tax rates and thresholds for each jurisdiction. The table shows the Territory’s payroll tax annual threshold is the second highest in Australia and its payroll tax rate is equal to the national average.
Table 6.6: State and territory payroll tax rates and annual thresholdsNSW Vic1 Qld2 WA3 SA4 Tas5 ACT NT3 Average
Threshold ($M) 0.75 0.625 1.1 0.85 0.6 1.25 2.0 1.5 1.08
Rate (%) 5.45 4.85 4.75 5.5 4.95 6.1 6.85 5.5 5.49
1 Rate is 3.65% for regional Victorian employers.2 Threshold reduces as an employer’s wages increase, so no exemption is provided for employers with wages over $5.5 million.3 Threshold reduces as an employer’s wages increase, so no exemption is provided for employers with wages over $7.5 million.4 Rate is 2.5% for wages between $0.6M and $1M and variable from 2.5% to 4.95% for wages between $1M and
$1.5M Existing threshold to change to allow exemption for businesses with wages between $0.6 million to $1.5 million from 1 January 2019.
5 Reduced rate from 6.1% to 4% for wages between $1.25 million to $2 million expected as of 1 July 2018.Source: State legislation and information available at 9 April 2018

68 Territory Taxes and Royalties
2018-19 Budget
Table 6.7 provides the effective payroll tax rate at various wage levels for each jurisdiction after considering individual state thresholds and the payroll tax rates. For businesses with wages of $3 million and below, the Territory has a very competitive payroll tax scheme with an effective tax rate below the national average. For very large businesses with wage costs of $20 million or more, the Territory has a more favourable effective payroll tax rate than the Australian Capital Territory and Tasmania, and is comparable to Western Australia and New South Wales.
Table 6.7: Effective state and territory payroll tax rates at various wage levels
Wages NSW Vic Qld WA SA Tas ACT NT Average
$M % % % % % % % % %
1 1.36 1.82 0.00 0.93 1.00 0.00 0.00 0.00 0.64
2 3.41 3.33 2.67 3.57 3.47 2.29 0.00 1.72 2.56
3 4.09 3.84 3.76 4.45 3.96 3.56 2.28 3.44 3.67
4 4.43 4.09 4.30 4.88 4.21 4.19 3.43 4.30 4.23
5 4.63 4.24 4.63 5.15 4.36 4.58 4.11 4.81 4.56
10 5.04 4.55 4.75 5.50 4.65 5.34 5.48 5.50 5.10
20 5.25 4.70 4.75 5.50 4.80 5.72 6.17 5.50 5.30
Source: State legislation and information available at 9 April 2018
Stamp duty on conveyances in the TerritoryThe Territory Government provides significant incentives to encourage home ownership in the Territory. Non‑first home buyers receive a rebate of $7000 on the purchase of a new home to be used as a principal place of residence, equivalent to a stamp duty concession on around the first $231 500 of the value of the residence.
Seniors, pensioners and carers receive a concession of $10 000 on the purchase of a principal place of residence for property values up to $750 000. This is equivalent to a stamp duty concession on the first $292 300 of the value of the residence.
First home buyers of established homes receive a concession of up to $23 928.60 for property values up to $650 000. This is equivalent to a stamp duty concession on the first $500 000 of the value of the home. Rather than receiving stamp duty assistance, a grant of $26 000 is available to first home owners of new homes.
Overall it is difficult to compare stamp duty on houses in each state, given the significant variation in median house prices. Chart 6.2 shows Darwin has the sixth highest median house price behind Perth, Brisbane, Canberra, Melbourne and Sydney.
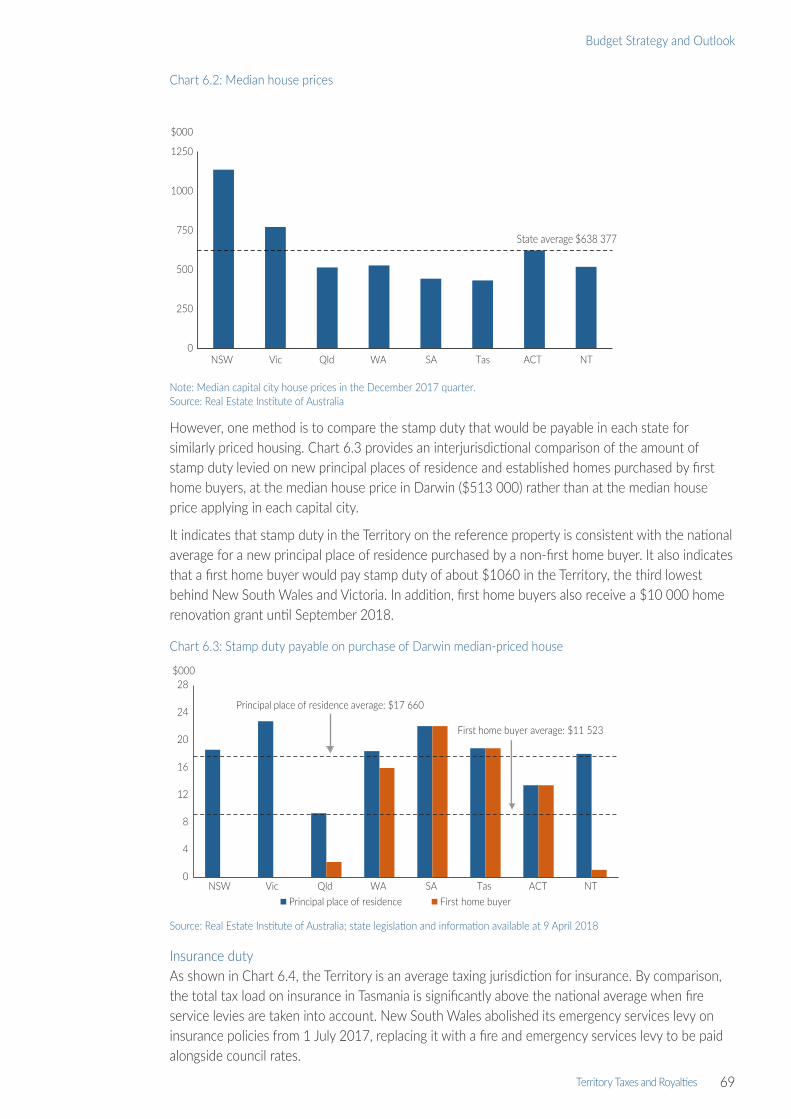
Territory Taxes and Royalties 69
Budget Strategy and Outlook
Chart 6.2: Median house prices
Note: Median capital city house prices in the December 2017 quarter.Source: Real Estate Institute of Australia
However, one method is to compare the stamp duty that would be payable in each state for similarly priced housing. Chart 6.3 provides an interjurisdictional comparison of the amount of stamp duty levied on new principal places of residence and established homes purchased by first home buyers, at the median house price in Darwin ($513 000) rather than at the median house price applying in each capital city.
It indicates that stamp duty in the Territory on the reference property is consistent with the national average for a new principal place of residence purchased by a non‑first home buyer. It also indicates that a first home buyer would pay stamp duty of about $1060 in the Territory, the third lowest behind New South Wales and Victoria. In addition, first home buyers also receive a $10 000 home renovation grant until September 2018.
Chart 6.3: Stamp duty payable on purchase of Darwin median‑priced house
Source: Real Estate Institute of Australia; state legislation and information available at 9 April 2018
Insurance dutyAs shown in Chart 6.4, the Territory is an average taxing jurisdiction for insurance. By comparison, the total tax load on insurance in Tasmania is significantly above the national average when fire service levies are taken into account. New South Wales abolished its emergency services levy on insurance policies from 1 July 2017, replacing it with a fire and emergency services levy to be paid alongside council rates.
0
250
500
750
1000
1250
NSW Vic Qld WA SA Tas ACT NT
State average $638 377
$000
0
4
8
12
16
20
24
28
NSW Vic Qld WA SA Tas ACT NTPrincipal place of residence First home buyer
$000
Principal place of residence average: $17 660
First home buyer average: $11 523

70 Territory Taxes and Royalties
2018-19 Budget
All states impose taxes on general insurance premiums at rates between 9 per cent and 11 per cent, with New South Wales, Queensland and Tasmania having special rates on particular classes of general insurance. The only exception is the Australian Capital Territory where insurance duty was abolished on 1 July 2016. In addition to the Australian Capital Territory, Victoria, Western Australia and the Northern Territory are the other jurisdictions that do not collect taxes on life insurance policies.
Tasmania collects a portion of its fire service levies through a charge on insurers. While Tasmania raises a levy on insurance, a large proportion of the levy is sourced from a charge on property owners through local councils, which is similar to Victoria, Queensland, South Australia, Western Australia and New South Wales. The Territory does not impose any emergency or fire service levies on the general public, although, like the states, it does charge for commercial fire alarm monitoring.
Chart 6.4: Average state tax rate on general insurance premiums
Source: State legislation and information available at 9 April 2018
Stamp duty on motor vehicles Chart 6.5 compares the stamp duty applicable for a new motor vehicle, represented by a four cylinder, 2018 Toyota Camry Atara SL Auto E valued at $37 440. The chart shows the stamp duty payable in the Territory is below the national average and equal second lowest in Australia.
Chart 6.5: Stamp duty on purchase of $37 440 motor vehicle
Note: Based on four cylinder, 2018 Toyota Camry Atara SL Auto E.Source: State legislation and information available at 9 April 2018
0
5
10
15
20
25
30
35
40
45
NSW Vic Qld WA SA Tas ACT NT
%
State average including fire service levy
State average
Fire service levyStamp duty
0
400
800
1200
1600
2000
NSW Vic Qld WA SA Tas ACT NT
$
State average $1322

Territory Taxes and Royalties 71
Budget Strategy and Outlook
Motor vehicle registration Motor vehicle registration fees comprise registration, compulsory third‑party insurance and other fees, and therefore vary significantly between jurisdictions. Chart 6.6 compares the costs of registering a medium‑sized passenger vehicle in each jurisdiction. A registration fee of $179 and total registration cost of $737.85 for a 2018 Toyota Camry Atara SL Auto E demonstrates that the Territory has the second lowest registration fees and total registration costs in Australia for a medium‑sized passenger vehicle.
Chart 6.6: Annual registration fees and charges for a medium‑sized passenger vehicle
Note: Based on four cylinder, 2018 Toyota Camry Atara SL Auto E.Source: State legislation and information available at 9 April 2018
The higher than average compulsory insurance premiums in the Territory reflect the inherently higher costs associated with the small population size of the Territory and relatively high incidence of road accident casualties. Motor Accident Compensation scheme premiums aim to ensure likely compensation claims for the upcoming year can be met and the scheme maintains a prudent solvency margin.
Despite this, total registration costs in the Territory remain among the lowest in Australia and significantly below the national average. This is due to relatively low registration fees and because the Territory does not, unlike some jurisdictions, also add ancillary taxes and levies. These additional levies imposed in other jurisdictions include fire and emergency service levies, motor taxes, traffic improvement levies and road safety contributions.
Land revenue This category includes taxes on the ownership of land, where the tax is based on the assessed unimproved value of the land. It also includes any metropolitan land planning, development, and fire and emergency service levies included in the land tax base of some states.
Land tax is an important source of income for the other states and territories, estimated to generate more than $10.6 billion in revenue in 2016‑17. Land tax is levied on the landowner’s total holdings of commercial land and investment residential property, although generally an exclusion is provided for land used for primary production. Land tax rates are generally progressive and most jurisdictions have tax-free thresholds.
The Territory does not impose a land tax. However, in its 2018 Update, the CGC assessed that the Territory could raise about $81 million if it adopted the average state policies on land tax.
The derelict and vacant property tax levy, which is to commence 1 July 2019, is estimated to raise about $3 million per annum.
0
200
400
600
800
1000
1200
1400
1600
1800
NSW Vic Qld WA SA Tas ACT NT
$
Registration feesThird-party insuranceAdministration fee
Tax/levy
Average total registration
Average registration

72 Territory Taxes and Royalties
2018-19 Budget
Tax expenditure statementTax concessions are often provided to benefit a specified activity or class of taxpayer. They are expenditures in the sense that their impact on the budget is similar to direct outlays and can be used to achieve similar goals to grant programs.
Tax expenditure can be provided in a variety of ways, including by way of exemption, deduction, rebate or a concessionary tax rate.
The tax expenditure statement details revenue estimated to be forgone by the Government or financial benefits obtained by taxpayers as a result of tax exemptions or concessions provided. Identifying this expenditure assists in providing a more accurate picture of the Government’s contributions by way of taxation concessions to assist various groups or industries.
The tax expenditure identified in this statement relates to the more important and material concessions available in the Territory. In accordance with FITA, the tax expenditure statement provides an estimate of expenditure in 2017‑18, and forecast information for 2018‑19 and the following three financial years.
Table 6.8 details the total tax expenditure across payroll tax, stamp duty and motor vehicle fees.
Table 6.8: Total tax expenditure2017-18 2018-19 2019-20 2020-21 2021-22
Tax expenditure ($M) 159.2 166.7 173.0 180.5 186.1
Source: Department of Treasury and Finance
MethodologyTax expenditure has been estimated by applying the benchmark rate of taxation to the forecast volume of activities or assets exempted by a particular concession. Only future events certain or highly likely to affect assumed tax bases or tax rates have been considered in estimating future tax expenditure. Otherwise, existing taxation arrangements are assumed to apply for future years.
Measuring tax expenditure requires the identification of:
• a benchmark tax base
• concessionary taxed components of the benchmark tax base, such as specific activity or class of taxpayer
• a benchmark tax rate to apply to the concessionary taxed components of the tax base.
The establishment of a benchmark tax base provides a basis against which each tax concession can be evaluated. The aim of the benchmark is to determine which concessions are tax expenditures rather than structural elements of the tax.
By definition, tax expenditure comprises those tax concessions not included as part of the benchmark tax base.
Payroll taxThe benchmark tax base for payroll tax is assumed to be all wages (as defined under the payroll tax legislation) paid in the Territory. The benchmark tax rate is 5.5 per cent.
Table 6.9: Payroll tax expenditure2017-18 2018-19 2019-20 2020-21 2021-22
Tax expenditure ($M) 110.8 115.6 118.0 121.3 124.9
Source: Department of Treasury and Finance

Territory Taxes and Royalties 73
Budget Strategy and Outlook
As data is not generally collected from employers that do not have a payroll tax liability, tax expenditure in relation to many payroll tax concessions is difficult to estimate. Accordingly, the reported estimated tax expenditure outlined in Table 6.9 was calculated by adding recorded tax concessions to a figure derived by comparing Australian Taxation Office (ATO) data about wages paid by employers in the Territory, and ABS data on employment and wages in the Territory to data reported by employers registered for payroll tax in the Territory. The difference provides a reasonable estimate of wages paid by non‑registered employers not subject to Territory payroll tax because of the small business exclusion (detailed below) or because of being an exempt body.
The reported estimated tax expenditure in relation to payroll tax mainly comprises the following exemptions.
Small business exclusionEmployers with wages below $1.5 million are not required to pay payroll tax, a saving for them of up to $82 500. Employers with payrolls over $1.5 million a year receive a deduction of up to $1.5 million, which reduces by $1 for every $4 in wages paid by the employer where the wages paid by the employer exceed $1.5 million. This means employers with wages of $7.5 million or more will not receive a deduction and will pay payroll tax on the total wages paid.
Local employment packageUntil 2020, wages paid to new resident employees who either increase a business’ total number of employees compared to May 2018 or replace an interstate resident employee are exempt from payroll tax for up to two years.
Charities and other exempt bodiesNon‑profit organisations having a sole or dominant purpose that is charitable, benevolent, philanthropic or patriotic are exempt from payroll tax to the extent that wages are paid for an employee’s services relating directly to the purpose for which the organisation was established. In addition, employment agencies providing temporary staff to exempt organisations are able to claim payroll tax exemptions for these wages.
Stamp duty on conveyancesThe benchmark tax base is assumed to be sales of all dutiable property, including chattels that are part of a transaction conveying other dutiable property. The benchmark tax scale is the currently applicable stamp duty scale.
Table 6.10: Stamp duty on conveyances expenditure2017-18 2018-19 2019-20 2020-21 2021-22
Tax expenditure ($M) 19.0 20.5 23.1 25.9 26.5
Source: Department of Treasury and Finance
Tax expenditure estimates in Table 6.10 are based on an historical revenue base indexed by normal growth parameters. The tax expenditure estimates mainly comprise the following concessions.
Corporate reconstructions exemptionCorporate groups formed by commonly owned corporations are able to reorganise the ownership of assets without incurring a stamp duty liability. The estimated tax expenditure is the actual stamp duty forgone for approved reconstruction exemptions.
Principal place of residence rebateHome buyers who purchase a new home are entitled to a rebate of $7000 when purchasing a principal place of residence. Tax expenditure is estimated by actual collections in relation to the rebate.

74 Territory Taxes and Royalties
2018-19 Budget
Senior, Pensioner and Carer’s ConcessionA concession of $10 000 is provided for Senior, Pensioner and Carer’s Concession cardholders when purchasing a principal place of residence to the value of $750 000. Tax expenditure is estimated by actual collections in relation to the concession.
First home owner discountFrom 1 September 2016, first home buyers of established homes with dutiable value of up to $650 000 receive a stamp duty discount of up to $23 928.60. Tax expenditure is estimated by actual collections in relation to the discount.
Other conveyance duty exemptionsSeveral other conveyance stamp duty exemptions are provided that together result in significant revenue forgone by the Territory, the largest of these being exemptions for:
• property transferred to charitable organisations having a sole or dominant purpose that is charitable, benevolent, philanthropic or patriotic
• the transfer of a company’s property, on its winding up, to a shareholder of the company entitled to the property on a distribution in‑kind
• an exemption under the Commonwealth Family Law Act for instruments made pursuant to a court order that alter the interests of the parties to a marriage or de facto partnership
• the conveyance of property between partners of a de facto relationship on the breakdown of the relationship.
The estimated tax expenditure for these concessions is based on actual historical data collected in relation to the various exemptions granted and how these relate to overall conveyance stamp duty collections.
Stamp duty on general insurance policiesThe benchmark tax base is all classes of general insurance policies. This does not include life insurance policies, which are treated differently for stamp duty purposes. The benchmark tax rate is 10 per cent of the premium.
Table 6.11: Stamp duty on general insurance2017-18 2018-19 2019-20 2020-21 2021-22
Tax expenditure ($M) 26.7 27.9 29.2 30.6 32.0
Source: Department of Treasury and Finance
The Territory provides stamp duty concessions on certain insurance products to reduce the costs of such insurance, namely workers compensation insurance and private health insurance. Tax expenditure outlined in Table 6.11 has been estimated using total work health insurance policy premiums paid during past years compared to total payroll data of employers in the Territory and data on private health insurance premiums obtained from the Private Health Insurance Administration Council.

Territory Taxes and Royalties 75
Budget Strategy and Outlook
Motor vehicle registration feesMotor vehicle registration concessions are available under the Northern Territory Pensioner and Carer’s Concession Scheme and to Northern Territory Seniors cardholders. Table 6.12 shows the motor vehicle registration fees expenditure. Actual registration fee data has been used to estimate this item of tax expenditure.
Table 6.12: Motor vehicle registration fees expenditure2017-18 2018-19 2019-20 2020-21 2021-22
Tax expenditure ($M) 2.7 2.7 2.7 2.7 2.7
Source: Department of Treasury and Finance

76
2018-19 Budget

Risks and Contingent Liabilities 77
Budget Strategy and Outlook
Chapter 7Risks and Contingent Liabilities
As required under section 10(1)(e) of the Fiscal Integrity and Transparency Act (FITA) each fiscal outlook report is required to contain ‘a statement of the risks, quantified as far as practicable, that could materially affect the updated financial projections, including any contingent liabilities and any related Government negotiations that have yet to be finalised’.
This chapter outlines the potential effect of risks to the budget due to changes in revenue and expense estimates and the likelihood of contingent liabilities becoming actual liabilities.
Risks to the budgetRevenue
GST revenueVolatility in GST revenue represents the largest revenue risk for the Northern Territory, with GST revenue accounting for about 43 per cent of the Territory’s total revenue in 2018‑19. The risk is evident in the context of the 2018‑19 Budget where GST revenue has been reduced by $317 million in the budget year and around $1.4 billion over the budget and forward estimates, when compared to estimates in the 2017‑18 Budget. This reduction is in addition to the $2 billion reduction over the budget period reported in the 2017‑18 Budget. These changes in GST revenue estimates have significantly affected the Territory’s fiscal capacity across the forward estimates period.
In recognition of the Territory’s loss of GST revenue driven primarily by the reduction in its GST relativity, the Commonwealth has provided a one‑off financial assistance payment of $259.6 million for 2018‑19. The Territory Government is continuing negotiations with the Commonwealth for ongoing funding to supplement the Territory’s reduction to its GST relativity. Should ongoing financial support be secured, the Territory’s fiscal aggregates will improve over the forward estimates.
The Territory’s GST entitlement is dependent on three parameters: national GST collections, the Territory’s share of the national population and GST relativities as determined by the Commonwealth Treasurer based on recommendations of the Commonwealth Grants Commission (CGC). There are many variables that influence each of these parameters, adding to the complexity of forecasting GST revenue over the budget and forward estimates period.
GST poolThe Territory’s estimates of the GST pool in 2018‑19 and over the forward estimates period are informed by the Commonwealth’s published advice and forecasts of national economic indicators.
The Territory’s GST revenue is directly affected by variations in the GST pool. A ±1 percentage point change in the GST pool growth rate is estimated to have a ±$26 million impact on the Territory’s GST revenue in 2018‑19. If variations of ±1 percentage point were applied to the growth rates in each of the budget and forward estimates years, the cumulative impact on Territory GST revenue is about ±$283 million over the four years to 2021‑22.

78 Risks and Contingent Liabilities
2018-19 Budget
Territory’s share of national populationThe Territory’s population is expected to grow at a slower rate than nationally over the budget and forward estimates period. Estimates of the Territory’s population growth relative to the national rate influence the Territory’s share of the national population, and therefore affect forecasts of the Territory’s GST revenue. The effect of a ±1 percentage point variation in the Territory’s forecast population growth is estimated at ±$26 million in 2018‑19, all other things being equal. The cumulative impact of a ±1 percentage point variation in the estimate of the Territory’s population growth rate over the budget and forward estimates period is about ±$284 million over the four years to 2021-22.
GST relativitiesThe CGC is responsible for recommending GST relativities, which are updated each year to incorporate new data and changes in states’ fiscal capacities. In its 2018 Update, the CGC recommended a significant decrease in the Territory’s GST relativity from 4.66024 in 2017‑18 to 4.25816 in 2018-19.
The impact of a ±1 per cent variation in the Territory’s GST relativity is around ±$26 million per annum. A ±1 per cent variation in the Territory’s GST relativity in each year of the forward estimates period would have a cumulative effect of around ±$111 million.
The above analysis examines the effect of variations in estimates of each parameter in isolation. However, these parameters interact and, as a result, variations in each parameter could have a compounding or offsetting effect on GST revenue estimates.
Productivity Commission Inquiry into Australia’s System of Horizontal Fiscal EqualisationOn 5 May 2017, the Commonwealth Treasurer commissioned the Productivity Commission (PC) Inquiry into Australia’s System of Horizontal Fiscal Equalisation (HFE). The inquiry is considering the effect of Australia’s system of HFE on national and state productivity, economic growth and budget management.
Although recognising that fiscal equity in the Australian federation has broad support, the PC’s draft report, released in October 2017, recommended a weakening HFE and current arrangements for distributing GST revenue among the states. The recommendations proposed by the PC, if unchanged and accepted by the Commonwealth Treasurer, will result in a redistribution of GST revenue between states that significantly favours the fiscally strongest jurisdictions, primarily at the expense of the smaller states, and represents a financial risk to the Territory’s GST revenue.
The PC’s final report is due to the Commonwealth Treasurer on 15 May 2018 and the Commonwealth has 25 sitting days to table this in Parliament prior to its public release. It is unclear at this stage when the report will be released to states and what action the Commonwealth will take. A further compounding issue is that the CGC 2020 Methodology Review on GST revenue sharing relativities is concurrently under way and may result in revisions to the current method for distributing GST.
Other Commonwealth grants and subsidiesCommonwealth funding is provided under the Intergovernmental Agreement on Federal Financial Relations (IGA), through specific purpose payments (SPPs), National Health Reform (NHR) payments, Quality Schools Package funding and national partnership (NP) payments, and through Commonwealth own‑purpose expenses (COPE) provided directly to agencies.
The IGA provides for flexibility of expenditure of SPPs across the relevant sector (disability, and skills and workforce development) without input controls, co‑investment or maintenance of effort requirements. These payments are ongoing and indexed on a sector‑specific basis, providing

Risks and Contingent Liabilities 79
Budget Strategy and Outlook
a degree of certainty for the Territory’s funding, although adequacy of indexation in terms of capturing growth in costs remains an ongoing risk.
NP agreements continue to include many risks to states including co‑investment, input controls such as budget benchmarks, burdensome reporting and administrative arrangements, and the Commonwealth’s potential withdrawal of funding. Further, the Commonwealth has recently adopted a legislative approach toward major funding and reform agreements, often with little or no consultation with the states and in the absence of an agreed multilateral policy position. This non‑collaborative approach from the Commonwealth poses a significant risk to states’ autonomy and budget flexibility, resulting in uncertainty around the level of Commonwealth funding contribution and requiring states to cede control of a significant proportion of state budgets.
The expiry of NP agreements, which by their nature are time limited, also poses a potential risk to the Territory’s Budget, particularly where funding has raised service delivery expectations.
The Territory has eight NP agreements, including schedules under agreements, for which funding is expected to expire during 2017‑18, totalling $57.71 million in 2017‑18. Funding associated with a further 14 NP agreements, including schedules under agreements, totalling $74.9 million are due to expire by the end of 2018‑19. Should the funding under these agreements not be renewed, the Territory would need to either reduce service delivery levels or provide additional funding. The timing of Commonwealth decisions regarding the treatment of expiring NP agreements and their funding is also critical to ensure appropriate planning and continuity of service delivery or allow for alternative approaches to be considered should funding be declined or not available.
In June 2017, the Commonwealth’s Quality Schools funding arrangements were enacted through unilateral amendments to the Australian Education Act. The amendments established contribution targets for states and territories, upon which Commonwealth schools funding will be contingent. The Territory’s targets are relatively onerous and would require significant additional Territory funding. As with all jurisdictions, the Territory is currently negotiating a bilateral funding agreement with the Commonwealth, which seeks to recognise the broader nature of investment required to deliver educational outcomes in the Territory, particularly in remote communities, and which will determine the quantum and timing of any additional Commonwealth funding required. The bilateral arrangements are expected to be finalised by the end of 2018.
Own‑source revenueThe amount of revenue received from Territory taxes and royalties is dependent on the performance of the Territory economy and other external factors. Forecasting such revenue involves judgements and assumptions to be made about the performance of the various economic factors and indicators that directly affect Territory taxes and royalties, such as growth in wages, employment, average hours worked, commodity prices, market activity and exchange rates.
It is challenging to accurately predict revenue collections into the future, particularly for the later years of the forward estimates. The most difficult source of revenue to forecast is mining royalty revenue because it is influenced by a number of factors, predominantly mineral pricing, production levels and exchange rate conditions.
Mining revenue forecasts rely mainly on advice from mining companies of their expected payment for the financial year. Unpredicted market changes in mineral prices, production or exchange rates will have a material effect on this forecast. Notwithstanding this volatility, the importance of royalties as a source of revenue is evident in the 2018‑19 Budget.
Forecasting conveyance stamp duty is linked to the outlook for the property market. The extent and timing of any market changes in terms of property prices and transaction levels is difficult to predict and can have a significant effect on conveyance duty collections. In particular, residential

80 Risks and Contingent Liabilities
2018-19 Budget
property demand is heavily influenced by market sentiment, and the continued softness in prices and transaction volumes will be impacted by the labour market and interstate migration flows.
In addition, the Territory has a relatively small conveyance duty base, which includes valuable commercial properties such as pastoral properties and mining projects. These factors introduce significant variability in collections as a result of the impact of the duty collected from large commercial transactions.
Growth in gambling taxes tend to trend towards long‑term population growth rates, although structural shifts in gambling habits toward online gambling has made forecasting of some tax types more uncertain. An additional risk in forecasting gambling taxes lies around uncertainty of the effect of proposed point of consumption taxes on online bookmakers. It is difficult to forecast how such taxes or changes to the regulation of online gambling affect the business of online bookmakers registered in the Territory.
Payroll tax generally provides more stable revenue than royalties and conveyance stamp duty. With a range of potential major projects not included in forecasts given the uncertainty around final investment decisions and timing, payroll tax collections are expected to increase in the 2017‑18 financial year compared to the published budget, before declining in the 2018‑19 and 2019‑20 financial years. Given the size of the Ichthys liquefied natural gas (LNG) project, there is a risk in this forecast relating to the timing of the relevant phases of the project. Forecasts are based on publicly available information and delays in the transition of the project from construction to a much smaller ongoing production workforce will influence payroll tax collections. More broadly, any variations to projected employment and wages growth across the Territory would also affect estimated payroll tax collections.
In total, a variation of ±1 per cent to the parameters used to forecast Territory taxes and royalties would affect revenue by about ±$9 million in 2018‑19.
Expenses and paymentsThe forward estimates for expenses are based on known policy decisions, with adjustments for non‑policy changes.
The most significant risk to the expense estimates is budget pressures due to increased cost and demand for government services, and the inability to meet savings measures factored into agency budgets.
The 2018‑19 Budget includes a reduction to the approved wage parameter from 2.5 per cent to 2 per cent for all new enterprise agreements from 1 October 2018. This poses a risk to the budget to the extent the outcome of enterprise agreement negotiations exceeds amounts currently factored into the forward estimates, however the majority of agreements have been finalised recently, deferring this risk to the later years of the forward estimates.
The 2018‑19 Budget includes a reduction in the consumer price index from 1.5 per cent to 1 per cent in 2018‑19 and from 2.5 per cent to 2 per cent in 2019‑20 and 2020‑21, with 2021‑22 remaining unchanged at 2.5 per cent.
In accordance with FITA, the 2018‑19 Budget includes forward estimates up to 2021‑22. There is the potential for the fiscal aggregates beyond the forward estimates period to be affected by existing commitments. These could take the form of recurrent costs not expected to crystallise until later in the forward estimates period, recurrent initiatives that roll out over time and have therefore not yet reached their peak of funding, or capital infrastructure for which the associated recurrent costs are not fully incorporated into forward years as their completion falls either close to or outside the forward estimates period.

Risks and Contingent Liabilities 81
Budget Strategy and Outlook
Royal Commission into the Protection and Detention of Children in the Northern TerritoryThe Royal Commission into the Protection and Detention of Children in the Northern Territory was announced by the Prime Minister on 26 July 2016. The Commission handed down its final report on 17 November 2017, and it contained recommendations to the Territory’s child protection and youth justice systems. The Territory has accepted the intent and direction of all recommendations of the Royal Commission. The Territory’s financial responses to these recommendations are factored into this budget, however the Commonwealth has made no commitment to follow the Commission’s direction to participate in funding specific initiatives. Consequently, there is a risk that further investment from the Territory Government may be required in the forward estimates period to fully implement the recommendations. This risk is not quantifiable at this time and therefore not included in the revised fiscal projections.
National Redress Scheme for Institutional Child Sexual AbuseIn response to the recommendations of the Royal Commission into Institutional Child Sexual Abuse, the Commonwealth intends to commence the 10‑year Redress Scheme for Survivors of Institutional Child Sexual Abuse in July 2018. An intergovernmental agreement and the Territory’s participation in the scheme is still subject to negotiations between the Commonwealth and the Territory. The costs to the Territory in agreeing to the scheme are not quantifiable at this time and therefore not included in the revised fiscal projections.
Government owned corporationsFollowing the separation of the Power and Water Corporation into three standalone government owned corporations, the corporations are continuing to establish their own standalone business systems and processes and finalise specific one‑off transformation projects.
Decreasing demand growth and increasing generation and retail competition requires greater focus on efficiency and business responsiveness, to be managed through the preparation of each corporation’s Statement of Corporate Intent, the annual performance agreement between the board and the shareholding minister.
In late 2017, concerns were raised with the ongoing financial sustainability of Territory Generation. A review was undertaken and changes to the strategic direction of the corporation are being implemented. The financial performance of Territory Generation has been revised to reflect higher than previously forecast expenditure and lower demand through increased competition. The financial performance and financial position of the corporation is forecast to improve across the budget period and will be closely monitored to ensure improved efficiencies are achieved.
Power and Water Corporation’s Statement of Corporate Intent for 2018‑19 aligns with its submission to the Australian Energy Regulator for regulated network services in 2019‑20 and beyond. The Australian Energy Regulator’s draft response to Power and Water Corporation’s submission will not be known until September 2018. To the extent that the final revenue cap determined by the Australian Energy Regulator varies to Power and Water Corporation’s submission represents an ongoing risk to the Budget.
To the extent that each corporation is unable to achieve its Statement of Corporate Intent targets, there is an ongoing risk to the Budget.
The Territory’s gas market will be connected to the East Coast Wholesale Gas Market in late 2018 following commissioning of the Northern Gas Pipeline. The Territory is subject to the National Gas Law (NGL) and Natural Gas Rules (NGR). Any gas industry reforms considered by the Energy Council and implemented through changes to the NGL or NGR could apply to the Territory and may impact the Power and Water Corporation’s existing long‑term gas contracts. To mitigate this risk, the

82 Risks and Contingent Liabilities
2018-19 Budget
Territory will continue to examine any reforms stemming from reviews on a case‑by‑case basis for appropriateness in the context of the Territory’s circumstances.
Risks to economic forecastsEconomic forecasts incorporated in the budget papers are subject to a number of upside and downside risks and uncertainties. Economic conditions in the Territory also tend to be highly volatile due to the relatively small size of the Territory’s economy. This is often reflected in the available data, which can be subject to significant revisions.
The availability, range of sources and volatility of data for the Territory’s economy presents an underlying risk to forecasts, particularly in relation to the reporting of capital expenditure for major projects. Some data is confidentialised, making it difficult to report when actual expenditure occurs. There are also difficulties associated with the measurement of interstate trade flows and other complexities associated with the balancing item of gross state product (GSP), the components of which are not available publicly.
Most significant for current Territory forecasts is the timing and quantum of investment associated with the commissioning and production phase of the Ichthys liquefied natural gas project. Given the size of the project, it has been factored into forecasts based on publicly available information, including timing of the completion of construction and anticipated commencement of production. However, further delays in the transition of the project from construction to the production and export phase, as well as variations in investment and costs of the project, have the potential to influence a range of economic indicators, particularly GSP, state final demand, labour market and population forecasts.
There are also a number of major projects not included in the Territory’s economic forecasts, given the uncertainty around final investment decisions, timing, levels of proposed expenditure and other impacts on the economy, including projects such as the Mount Peake rare earths mine, Ammaroo phosphate mine, Chandler salt mine, Nolans rare earths mine and Project Sea Dragon. In addition, government‑facilitated projects in the pipeline include the Alice Springs tourism commercial development, seniors’ lifestyle accommodation in Alice Springs and Darwin Ship Lift and Marine Industry Project and the Mount Isa to Tennant Creek railway project. If any of these projects reach the final investment decision phase, it will have positive implications across a range of economic indicators.
On 27 March 2018, the Independent Scientific Inquiry into Hydraulic Fracturing of Onshore Unconventional Reservoirs in the Northern Territory released its final report. The Territory Government has decided to lift the moratorium on hydraulic fracturing, accepting all 135 recommendations made by the report, which should reduce risk to an acceptable level while creating jobs and guaranteeing significant economic activity over the medium to long term. The economic implications of this decision have not been factored into forecasts as the expected economic impacts on production, employment and regional economic activity are largely beyond the forecast period for the 2018‑19 Budget.
The Territory economy is heavily exposed to changes in the global economy. Movements in global commodity prices can have significant impacts on the viability of mining activity in the Territory, as experienced in recent years. Also, global oil prices can influence the cost of living and doing business in the Territory, affecting not only the price of automotive fuel for consumers but also transport costs, as well as other goods and services.
Movements in the Australian dollar against other currencies (mainly the United States dollar) will affect the cost of the Territory’s imports and the competitiveness of Territory goods and service exports, particularly for industries such as tourism, agriculture, and mining and manufacturing. A

Risks and Contingent Liabilities 83
Budget Strategy and Outlook
significant depreciation in the Australian dollar could potentially have positive trade implications for the Territory, with price movements leading to higher levels of exports and lower levels of imports, but this would also put pressure on prices domestically, in turn adding upward pressure to the consumer price index.
Economic conditions in other Australian jurisdictions also present risks to the Territory’s economic forecasts. This includes effects on the labour market and interstate migration flows. The relative labour market conditions in other jurisdictions can affect the availability of labour in the Territory. Interest rate movements also present uncertainty for the Territory economy, particularly influencing business, residential properties, household consumption and investment.
Adverse weather conditions, natural events (such as cyclones, flooding, drought and climate variability) and agricultural pests and diseases are also key risks to many of the Territory’s economic forecasts and have the potential to place upward pressure on food prices due to effects on agricultural production across the country.
Contingent liabilitiesContingent liabilities are potential future costs to government that may arise from guarantees, indemnities, and legal and contractual claims and hence constitute a risk to the Territory’s financial position.
Contingent liabilities have the potential to materially affect the budget due to the likelihood of an actual liability arising. Therefore, where possible, the potential extent of the actual liability should be quantified.
Material contingent liabilities of the Territory are defined as guarantees and indemnities with potential exposure greater than $5 million and are disclosed in annual financial statements of the Territory in accordance with Australian Accounting Standards.
Quantifiable and unquantifiable contingent liabilities remain unchanged since the 2016‑17 Treasurer’s Annual Financial Report and the 2017‑18 Mid‑Year Report.
As at the date of this report, no transaction or event of a material nature has occurred that would crystallise the contingent liabilities reported in this section.
Quantifiable contingent liabilitiesDetails of estimated amounts of remaining material quantifiable contingent liabilities as at 30 June 2017, resulting from guarantees or indemnities granted by the Territory, are presented in Table 7.1.
Table 7.1: Material quantifiable contingent liabilities
Estimated quantifiable contingent liability as
at 30 June 2017
$M
Public Trustee Common Fund 1 33.5
Source: Department of Treasury and Finance
The Public Trustee Common Fund 1, which had a reported total of $33.5 million as at 30 June 2017, is government guaranteed.
Under section 97 of the Public Trustee Act, the Treasurer indemnifies the Common Fund against any deficiencies in money available to meet claims on it. The Common Fund is a repository for all monies received by the Public Trustee on behalf of estates, trusts or persons, and earns interest.
84 Risks and Contingent Liabilities
2018-19 Budget
Money to the credit of the Common Fund is invested according to the directions issued by an Investment Board.
Although a material statutory contingent liability exists, the prospect of this contingent liability being called upon is considered low.
Unquantifiable contingent liabilitiesUnquantifiable contingent liabilities exist, which could pose a risk to the Government’s financial projections.
TransportThe Territory has contingent liabilities in this category that relate to indemnities and guarantees provided in support of the Adelaide to Darwin railway project.
The AustralAsia Railway Corporation (AARC) and the Territory and South Australian governments have entered into a concession arrangement for the Adelaide to Darwin railway on a build, own, operate and transfer‑back basis.
Unquantifiable contingent liabilities of the Territory in relation to the Adelaide to Darwin railway project relate to the following:
• joint guarantee of the obligations of AARC
• indemnities granted in relation to title over the railway corridor (title is secure but the indemnity continues).
AARC and the governments have comprehensive risk management procedures in place for all events that would give rise to liabilities.
Prior to the long‑term lease of the Port of Darwin, the railway corridor interfacing the port was owned by the former Darwin Port Corporation (DPC), which leased the facilities to the concession holder. As part of the long‑term lease of the Darwin port, the railway corridor was transferred to the Territory and leased to the concession holder. There are contingent liabilities that arise out of any loss or claim incurred or suffered as a result of the Territory’s failure to comply with its environmental obligation contained in the lease. The lease contains similar indemnities given by the lessee with respect to contamination caused by the lessee and a failure to comply with its environmental obligations. To the extent that DPC had contingent liabilities prior to the Port of Darwin transaction, the Territory Government has the same contingent liabilities now.
The Territory Government has entered into agreements for the relocation of fuel terminals from near the Darwin central business district to East Arm industrial estate. The agreements include certain unquantifiable contingent liabilities in favour of the developer of the fuel terminal and Shell, an oil company. The Government has put in place comprehensive risk management processes to address potential exposure.
The Territory has assumed DPC’s indemnity in relation to certain remedial works at East Arm Port. The indemnity covers third party claims, loss, damage, cost and expenses that may be incurred or sustained by Shell arising out of any breach of the Territory’s obligation under the agreement, or in connection with any failure of defect in the integrity of the bunker lines, as well as rectification of damage to the wharf. Comprehensive risk management procedures are in place to minimise risk exposure to the Territory.
Contingent considerations in relation to the long‑term lease of the Port of Darwin are considered unlikely and consequently no contingent liabilities have been disclosed at this time. The Territory will continue to assess any risks under the arrangement and determine whether any future disclosure is required.

Risks and Contingent Liabilities 85
Budget Strategy and Outlook
Gas The Territory has entered into a number of agreements relating to the Northern Gas Pipeline. Contingent considerations in relation to these agreements are considered unlikely and consequently no contingent liabilities have been disclosed at this time. The Territory will continue to assess any risks under the arrangement and determine whether any future disclosure is required.
Health and community services The Territory has granted a series of health‑related indemnities for various purposes including indemnities to specialist medical practitioners employed or undertaking work in public hospitals, indemnities provided to medical professionals requested to give expert advice on inquiries before the Medical Board, and indemnities to midwives.
Although the risks associated with health indemnities are potentially high, the beneficiaries of the indemnities are highly trained and qualified professionals. The indemnities generally cannot be called upon where there is wilful or gross misconduct on the part of the beneficiary.
There are no reportable contingent liabilities in this category.
Government administrationWhere the Territory has invited the participation of private sector persons and government officers on boards of government owned or funded companies, the Territory may grant indemnities to the board members to cover them for any losses that may result from good faith actions.
These indemnities are generally consistent with cover available through Directors and Officers Insurance and the policy of issuing an indemnity rather than purchasing commercial insurance is in line with the Government’s self‑insurance arrangements.
In relation to corporations established in accordance with the Government Owned Corporations Act, an indemnity given by the Territory to board members is limited to actions arising from compliance with a direction issued by the shareholding minister or the portfolio minister pursuant to the Government Owned Corporations Act.
The resulting contingent liabilities are considered low risk as board members are professionals, selected based on their expertise and knowledge. Further, the indemnities are restricted to good faith actions only. These contingent liabilities are unquantifiable.
Indemnities are also granted to the Commonwealth and other entities involved in funding or sponsoring activities and programs initiated or undertaken by the Territory. Under the indemnities, the Territory generally accepts liability for damage or losses occurring as a result of the activities or programs and acknowledges that, while the Commonwealth or another party has contributed financially or provided in‑kind support, the Territory is ultimately liable for the consequences of the activity or program.
Although the resulting contingent liability may, depending on the activity undertaken, not always be low risk, the Territory’s financial exposure is no greater than would have been the case without funding or sponsorship assistance. These contingent liabilities are unquantifiable.
Where the Territory is engaged in legal proceedings and disputes, due to the wide variety and nature of these cases and the uncertainty of any potential liability, no value can be attributed to these cases. In addition, the attribution of a value to these cases also has the potential to prejudice the outcome of the proceedings and disputes.
Secure facilitiesThe Territory has contingent liabilities in this category that relate to indemnities and guarantees provided in support of the Darwin Correctional Precinct that was constructed and is operated under a public private partnership agreement.

86 Risks and Contingent Liabilities
2018-19 Budget
The Territory has indemnified the proponent for losses arising from uninsurable risks.
FinanceThe Territory’s financial management framework is underpinned by centralised banking arrangements. The sole provider of banking‑related services has been granted indemnities under the whole of government banking contract. These indemnities are considered not to involve significant risk.
There are no reportable contingent liabilities in this category.
Property and business servicesAgreements for leases or licences of property, plant or equipment generally contain standard indemnity provisions, similar to those commonly found in commercial leases, covering the lessor or licensor for any losses suffered as a result of the lease or licence arrangement. The contingent liabilities resulting from the indemnities are unquantifiable.
The granting of a concession to Darwin Cove Convention Centre Pty Ltd gives rise to contingent liabilities associated with:
• discriminatory changes in law
• environmental clean‑up costs
• incentive payments to the operator if performance targets established for the centre are exceeded
• negotiated payments to the operator in the early years of the centre’s operation.
For the categories listed above, neither the probability nor the amount the Territory might be called upon to pay at some future date can be determined reliably. As a result, these items are regarded as contingent liabilities, where the existence of an actual liability in the future will be confirmed only by the occurrence of uncertain future events that lie outside the control of the Territory.
A contingent asset also arises as a consequence of the concession arrangement. The Territory Availability Payment (TAP) is recognised as a liability on the general government sector and whole of government balance sheets. However, the Territory has the right to recover up to 75 per cent of that liability if the operator should not achieve certain performance criteria. Because neither the probability of such a recovery nor the amount that might be recovered can be determined reliably, the part of the TAP that may be subject to abatement is classified as a contingent asset.
AccommodationThe Territory has contingent liabilities in this category that relate to indemnities provided in support of the Darwin luxury hotel development. The risks associated with the indemnities are considered low and consequently no contingent liabilities have been disclosed at this time. The Territory will continue to assess any risks under the arrangement and determine whether any future disclosure is required.

Uniform Presentation Framework 87
Budget Strategy and Outlook
Chapter 8Uniform Presentation Framework
Under the Uniform Presentation Framework (UPF), Commonwealth, state and territory governments have agreed to publish information in a standard format in budget papers. The UPF is based on accounting standard AASB 1049 Whole of Government and General Government Sector Financial Reporting, which harmonises Government Finance Statistics and generally accepted accounting principles with the objective of improving the clarity and transparency of government financial statements.
The harmonised standard means that government financial reports are presented on the same basis by all jurisdictions, resulting in greater transparency and consistency.
The Fiscal Integrity and Transparency Act requires that fiscal outlook reports be prepared in accordance with external reporting standards, including the Australian Accounting Standards or the UPF.
The tables in this chapter meet the Territory’s reporting obligations under both the Fiscal Integrity and Transparency Act and the UPF. For each sector of government, they include a:
• comprehensive operating statement
• balance sheet
• cash flow statement.
Also included are supplementary tables for the general government sector presenting:
• taxes
• grant revenue and expenses
• dividend and income tax equivalent income
• operating expenses by function
• purchases of non‑financial assets by function.
The financial statements for the general government, public non financial corporation and non financial public sectors include the revised 2017‑18 Estimate, 2018‑19 Budget and 2019‑20 to 2021‑22 forward estimates. The statements for the public financial corporation sector and total public sector present the 2017‑18 Estimate only, with the remaining supplementary tables presenting both the 2017‑18 Estimate and the 2018‑19 Budget.
The classification of government functions incorporated in tables 8.20 and 8.21 are presented in accordance with the revised 2015 Australian System of Government Finance Statistics manual that became effective from 1 July 2017.

88 Uniform Presentation Framework
2018-19 Budget
Table 8.1
General Government Sector Comprehensive Operating Statement 2017-18 2018-19 2019-20 2020-21 2021-22
Estimate Budget Forward estimate
$000 $000 $000 $000 $000
REVENUE
Taxation revenue 627 665 540 476 553 138 579 636 598 456
Current grants 3 997 366 3 900 646 3 705 902 3 822 259 3 940 518
Capital grants 253 447 319 679 222 426 161 806 121 996
Sales of goods and services 380 578 380 316 404 046 407 863 408 774
Interest income 107 717 73 314 78 321 81 055 82 794
Dividend and income tax equivalent income 84 928 80 786 89 800 110 938 126 977
Other revenue 387 123 320 542 286 570 286 056 286 055
TOTAL REVENUE 5 838 824 5 615 759 5 340 203 5 449 613 5 565 570
less EXPENSES
Employee benefits expense 2 399 638 2 325 370 2 377 114 2 416 111 2 446 289
Superannuation expenses
Superannuation interest cost 129 094 128 080 128 080 128 080 128 080
Other superannuation expenses 212 896 216 037 217 924 214 766 215 811
Depreciation and amortisation 406 652 414 955 413 220 412 385 411 354
Other operating expenses 1 590 269 1 471 859 1 527 715 1 518 388 1 538 880
Interest expenses 227 194 260 447 313 619 370 238 429 890
Other property expenses
Current grants 990 019 1 018 074 949 947 981 056 984 297
Capital grants 143 307 108 135 64 655 54 983 52 868
Subsidies and personal benefit payments 281 175 275 637 268 210 275 673 280 086
TOTAL EXPENSES 6 380 244 6 218 594 6 260 484 6 371 680 6 487 555
equals NET OPERATING BALANCE - 541 420 - 602 835 - 920 281 - 922 067 - 921 985
plus Other economic flows – included in operating result 20 469 48 125 50 317 52 531 54 270
equals OPERATING RESULT - 520 951 - 554 710 - 869 964 - 869 536 - 867 715
plus Other economic flows – other comprehensive income
- 770 152 221 181 519 202 563 201 763
equals COMPREHENSIVE RESULT – total change in net worth before transactions with owners in their capacity as owners
- 521 721 - 402 489 - 688 445 - 666 973 - 665 952
NET OPERATING BALANCE - 541 420 - 602 835 - 920 281 - 922 067 - 921 985
less Net acquisition of non financial assets
Purchases of non financial assets 845 792 1 038 764 699 498 673 539 613 638
Sales of non financial assets ‑ 49 238 ‑ 53 260 ‑ 57 983 - 49 211 - 49 211
less Depreciation 406 652 414 955 413 220 412 385 411 354
plus Change in inventories
plus Other movements in non financial assets - 2 650
equals Total net acquisition of non financial assets 387 252 570 549 228 295 211 943 153 073
equals FISCAL BALANCE - 928 672 - 1 173 384 - 1 148 576 - 1 134 010 - 1 075 058

Uniform Presentation Framework 89
Budget Strategy and Outlook
Table 8.2
General Government Sector Balance Sheet 2017-18 2018-19 2019-20 2020-21 2021-22
Estimate Budget Forward estimate
$000 $000 $000 $000 $000
ASSETS
Financial assets
Cash and deposits 186 363 101 308 137 426 101 656 129 071
Advances paid 171 367 171 367 171 367 171 367 171 167
Investments, loans and placements 2 063 984 2 196 924 2 305 029 2 426 234 2 549 366
Receivables 359 290 366 213 379 244 364 822 377 395
Equity
Investments in other public sector entities 2 079 127 2 081 695 2 119 123 2 180 067 2 245 127
Investments – other
Other financial assets 17 387 17 387 17 387 17 387 17 387
Total financial assets 4 877 518 4 934 894 5 129 576 5 261 533 5 489 513
Non financial assets
Inventories 13 632 13 632 13 632 13 632 13 632
Property, plant and equipment 15 101 515 15 680 785 15 917 801 16 138 465 16 300 259
Investment property 99 495 95 495 91 495 87 495 83 495
Other non financial assets 122 353 122 332 122 311 122 290 122 269
Total non financial assets 15 336 995 15 912 244 16 145 239 16 361 882 16 519 655
TOTAL ASSETS 20 214 513 20 847 138 21 274 815 21 623 415 22 009 168
LIABILITIES
Deposits held 285 444 283 141 330 406 355 974 370 711
Advances received 283 895 285 315 286 083 276 135 265 490
Borrowing 3 933 915 5 080 733 6 261 651 7 371 564 8 520 359
Superannuation 3 502 439 3 357 677 3 212 915 3 068 153 2 926 093
Other employee benefits 628 549 628 549 628 549 628 549 628 549
Payables 208 530 212 058 214 708 218 142 220 930
Other liabilities 820 182 850 595 879 878 911 246 949 336
TOTAL LIABILITIES 9 662 954 10 698 068 11 814 190 12 829 763 13 881 468
NET ASSETS/(LIABILITIES) 10 551 559 10 149 070 9 460 625 8 793 652 8 127 700
Contributed equity
Accumulated surplus/(deficit) 2 147 130 1 742 073 1 016 200 288 283 - 442 729
Reserves 8 404 429 8 406 997 8 444 425 8 505 369 8 570 429
NET WORTH 10 551 559 10 149 070 9 460 625 8 793 652 8 127 700
NET FINANCIAL WORTH1 ‑ 4 785 436 ‑ 5 763 174 - 6 684 614 ‑ 7 568 230 ‑ 8 391 955
NET FINANCIAL LIABILITIES2 6 864 563 7 844 869 8 803 737 9 748 297 10 637 082
NET DEBT3 2 081 540 3 179 590 4 264 318 5 304 416 6 306 956
1 Net financial worth equals total financial assets minus total liabilities.2 Net financial liabilities equals the sum of total liabilities less total financial assets excluding investments in other public sector entities.3 Net debt equals the sum of deposits held, advances received and borrowing, minus the sum of cash and deposits, advances paid and
investments, loans and placements.

90 Uniform Presentation Framework
2018-19 Budget
Table 8.3
General Government Sector Cash Flow Statement 2017-18 2018-19 2019-20 2020-21 2021-22 Estimate Budget Forward estimate
$000 $000 $000 $000 $000Cash receipts from operating activitiesTaxes received 627 665 540 476 553 138 579 636 598 456Receipts from sales of goods and services 412 924 407 428 434 074 437 895 438 804Grants and subsidies received 4 250 813 4 220 325 3 928 328 3 984 065 4 062 514Interest receipts 107 717 73 314 78 321 81 055 82 794Dividends and income tax equivalents 53 221 70 046 77 663 122 090 111 134Other receipts 631 211 566 313 532 068 531 577 531 574Total operating receipts 6 083 551 5 877 902 5 603 592 5 736 318 5 825 276Cash payments for operating activitiesPayments for employees ‑ 2 735 160 - 2 661 726 - 2 720 919 ‑ 2 759 230 - 2 792 667Payment for goods and services - 1 841 581 ‑ 1 713 784 ‑ 1 777 743 ‑ 1 761 302 ‑ 1 775 631Grants and subsidies paid - 1 411 296 - 1 400 475 - 1 282 812 ‑ 1 311 712 ‑ 1 317 251Interest paid - 227 609 - 257 899 ‑ 310 959 ‑ 367 686 - 427 421Other payments Total operating payments - 6 215 646 - 6 033 884 - 6 092 433 - 6 199 930 - 6 312 970NET CASH FLOWS FROM OPERATING ACTIVITIES - 132 095 - 155 982 - 488 841 - 463 612 - 487 694Cash flows from investments in non financial assetsSales of non financial assets 49 238 53 260 57 983 49 211 49 211Purchases of non financial assets - 845 792 ‑ 1 038 764 - 699 498 ‑ 673 539 ‑ 613 638Net cash flows from investments in non financial assets - 796 554 - 985 504 - 641 515 - 624 328 - 564 427NET CASH FROM OPERATING ACTIVITIES AND INVESTMENTS IN NON FINANCIAL ASSETS
- 928 649 - 1 141 486 - 1 130 356 - 1 087 940 - 1 052 121
Net cash flows from investments in financial assets for policy purposes1
- 5 510 200
Net cash flows from investments in financial assets for liquidity purposes
24 663 - 89 504 - 62 477 ‑ 73 363 ‑ 73 551
NET CASH FLOWS FROM INVESTING ACTIVITIES - 777 401 -1 075 008 ‑ 703 992 - 697 691 ‑ 637 778Net cash flows from financing activitiesAdvances received (net) 2 014 1 420 768 - 9 948 - 10 645Borrowing (net) 941 302 1 146 818 1 180 918 1 109 913 1 148 795Deposits received (net) ‑ 131 415 ‑ 2 303 47 265 25 568 14 737Other financing (net) NET CASH FLOWS FROM FINANCING ACTIVITIES 811 901 1 145 935 1 228 951 1 125 533 1 152 887NET INCREASE/DECREASE IN CASH HELD - 97 595 - 85 055 36 118 ‑ 35 770 27 415Net cash flows from operating activities ‑ 132 095 - 155 982 - 488 841 ‑ 463 612 - 487 694Net cash flows from investments in non financial assets - 796 554 - 985 504 - 641 515 ‑ 624 328 - 564 427CASH SURPLUS (+)/DEFICIT (-) - 928 649 - 1 141 486 - 1 130 356 - 1 087 940 - 1 052 121Future infrastructure and superannuation contributions/ earnings2
- 41 866 - 25 804 ‑ 27 353 - 28 994 ‑ 30 733
UNDERLYING SURPLUS (+)/DEFICIT (-) - 970 515 - 1 167 290 - 1 157 709 - 1 116 934 - 1 082 854Additional information to the Cash Flow StatementCASH SURPLUS (+)/DEFICIT (‑) - 928 649 - 1 141 486 ‑ 1 130 356 - 1 087 940 - 1 052 121Acquisitions under finance leases and similar arrangements ABS GFS SURPLUS (+)/DEFICIT (‑) including finance leases and similar arrangements
- 928 649 - 1 141 486 ‑ 1 130 356 - 1 087 940 - 1 052 121
1 Includes equity acquisitions, disposals and privatisations (net).2 Contributions for future infrastructure and superannuation requirements.

Uniform Presentation Framework 91
Budget Strategy and Outlook
Table 8.4
Public Non Financial Corporation Sector Comprehensive Operating Statement 2017-18 2018-19 2019-20 2020-21 2021-22
Estimate Budget Forward estimate
$000 $000 $000 $000 $000
REVENUE
Current grants 188 564 177 704 169 106 173 720 176 050
Capital grants 48 467 36 037 31 806 32 760 33 313
Sales of goods and services 697 589 744 373 838 212 852 919 879 309
Interest income 3 967 3 165 3 073 3 165 3 499
Other revenue 32 530 28 637 37 393 36 684 36 919
TOTAL REVENUE 971 117 989 916 1 079 590 1 099 248 1 129 090
less EXPENSES
Employee benefits expense 127 210 128 332 132 537 128 536 132 209
Superannuation expenses 17 096 16 934 16 934 16 934 16 934
Depreciation and amortisation 191 046 169 498 160 959 161 002 161 013
Other operating expenses 496 923 549 327 578 600 576 879 584 496
Interest expenses 64 405 66 292 74 162 73 164 79 739
Other property expenses 41 565 28 578 24 249 39 107 47 855
Current grants 47 48 49 50
Capital grants
Subsidies and personal benefit payments 1 293 1 265 1 273 1 287 1 318
TOTAL EXPENSES 939 538 960 273 988 762 996 958 1 023 614
equals NET OPERATING BALANCE 31 579 29 643 90 828 102 290 105 476
plus Other economic flows – included in operating result - 186 022 - 2 771 ‑ 23 820 - 4 895 - 2 964
equals OPERATING RESULT - 154 443 26 872 67 008 97 395 102 512
plus Other economic flows – other comprehensive income
1 291 ‑ 35
equals COMPREHENSIVE RESULT – total change in net worth before transactions with owners in their capacity as owners
- 153 152 26 837 67 008 97 395 102 512
NET OPERATING BALANCE 31 579 29 643 90 828 102 290 105 476
less Net acquisition of non financial assets
Purchases of non financial assets 244 642 193 131 179 521 171 148 198 653
Sales of non financial assets - 4 719
less Depreciation 191 046 169 498 160 959 161 002 161 013
plus Change in inventories - 1 191 5 825 5 757 2 586 2 854
plus Other movements in non financial assets 18 044 17 000 21 913 20 913 20 913
equals Total net acquisition of non financial assets 65 730 46 458 46 232 33 645 61 407
equals FISCAL BALANCE - 34 151 - 16 815 44 596 68 645 44 069

92 Uniform Presentation Framework
2018-19 Budget
Table 8.5
Public Non Financial Corporation Sector Balance Sheet 2017-18 2018-19 2019-20 2020-21 2021-22
Estimate Budget Forward estimate
$000 $000 $000 $000 $000
ASSETS
Financial assets
Cash and deposits 181 995 165 549 204 538 244 712 271 059
Advances paid
Investments, loans and placements
Receivables 130 725 151 091 130 015 129 362 130 560
Equity 3 3 3 3 3
Other financial assets
Total financial assets 312 723 316 643 334 556 374 077 401 622
Non financial assets
Inventories 183 134 188 959 194 716 197 302 200 156
Property, plant and equipment 3 143 121 3 180 055 3 213 933 3 241 411 3 296 167
Investment property
Other non financial assets 29 437 28 940 32 207 35 788 39 585
Total non financial assets 3 355 692 3 397 954 3 440 856 3 474 501 3 535 908
TOTAL ASSETS 3 668 415 3 714 597 3 775 412 3 848 578 3 937 530
LIABILITIES
Deposits held 601 601 601 601 601
Advances received
Borrowing 1 412 737 1 470 737 1 486 737 1 489 737 1 506 737
Superannuation
Other employee benefits 60 676 62 232 63 499 63 388 62 959
Payables 64 311 66 265 85 080 94 228 103 077
Other liabilities 72 594 54 698 42 003 42 188 40 660
TOTAL LIABILITIES 1 610 919 1 654 533 1 677 920 1 690 142 1 714 034
NET ASSETS/(LIABILITIES) 2 057 496 2 060 064 2 097 492 2 158 436 2 223 496
Contributed equity 643 300 643 300 643 300 643 300 643 300
Accumulated surplus/(deficit) 588 139 590 707 628 135 689 079 754 139
Reserves 826 057 826 057 826 057 826 057 826 057
TOTAL EQUITY 2 057 496 2 060 064 2 097 492 2 158 436 2 223 496
NET FINANCIAL WORTH1 - 1 298 196 ‑ 1 337 890 ‑ 1 343 364 ‑ 1 316 065 ‑ 1 312 412
NET DEBT2 1 231 343 1 305 789 1 282 800 1 245 626 1 236 279
1 Net financial worth equals total financial assets minus total liabilities.2 Net debt equals the sum of deposits held, advances received and borrowing, minus the sum of cash and deposits, advances paid and
investments, loans and placements.
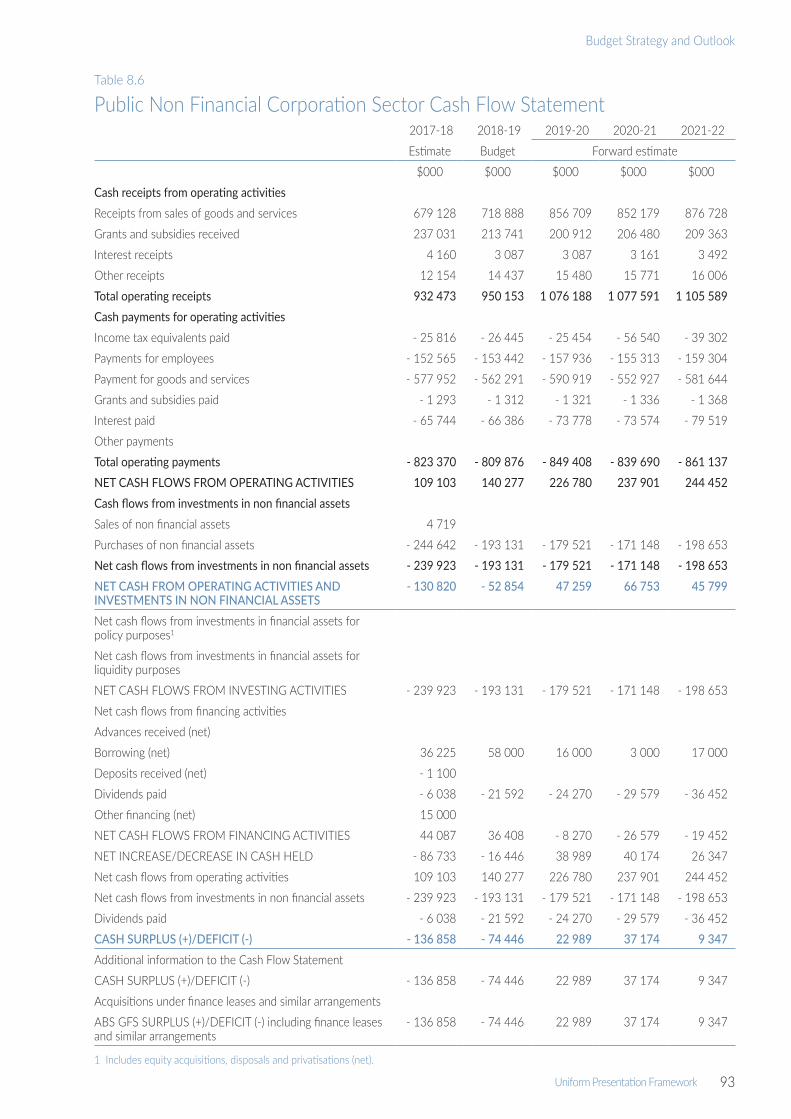
Uniform Presentation Framework 93
Budget Strategy and Outlook
Table 8.6
Public Non Financial Corporation Sector Cash Flow Statement 2017-18 2018-19 2019-20 2020-21 2021-22 Estimate Budget Forward estimate
$000 $000 $000 $000 $000Cash receipts from operating activitiesReceipts from sales of goods and services 679 128 718 888 856 709 852 179 876 728Grants and subsidies received 237 031 213 741 200 912 206 480 209 363Interest receipts 4 160 3 087 3 087 3 161 3 492Other receipts 12 154 14 437 15 480 15 771 16 006Total operating receipts 932 473 950 153 1 076 188 1 077 591 1 105 589Cash payments for operating activitiesIncome tax equivalents paid - 25 816 - 26 445 - 25 454 - 56 540 ‑ 39 302Payments for employees - 152 565 ‑ 153 442 ‑ 157 936 ‑ 155 313 ‑ 159 304Payment for goods and services - 577 952 - 562 291 - 590 919 - 552 927 - 581 644Grants and subsidies paid ‑ 1 293 ‑ 1 312 ‑ 1 321 ‑ 1 336 ‑ 1 368Interest paid - 65 744 ‑ 66 386 ‑ 73 778 ‑ 73 574 - 79 519Other payments Total operating payments - 823 370 - 809 876 - 849 408 - 839 690 - 861 137NET CASH FLOWS FROM OPERATING ACTIVITIES 109 103 140 277 226 780 237 901 244 452Cash flows from investments in non financial assetsSales of non financial assets 4 719 Purchases of non financial assets - 244 642 ‑ 193 131 - 179 521 - 171 148 ‑ 198 653Net cash flows from investments in non financial assets - 239 923 - 193 131 - 179 521 - 171 148 - 198 653NET CASH FROM OPERATING ACTIVITIES AND INVESTMENTS IN NON FINANCIAL ASSETS
- 130 820 - 52 854 47 259 66 753 45 799
Net cash flows from investments in financial assets for policy purposes1
Net cash flows from investments in financial assets for liquidity purposes
NET CASH FLOWS FROM INVESTING ACTIVITIES ‑ 239 923 ‑ 193 131 - 179 521 - 171 148 ‑ 198 653Net cash flows from financing activitiesAdvances received (net) Borrowing (net) 36 225 58 000 16 000 3 000 17 000Deposits received (net) - 1 100 Dividends paid ‑ 6 038 - 21 592 - 24 270 - 29 579 ‑ 36 452Other financing (net) 15 000 NET CASH FLOWS FROM FINANCING ACTIVITIES 44 087 36 408 - 8 270 - 26 579 - 19 452NET INCREASE/DECREASE IN CASH HELD ‑ 86 733 - 16 446 38 989 40 174 26 347Net cash flows from operating activities 109 103 140 277 226 780 237 901 244 452Net cash flows from investments in non financial assets ‑ 239 923 ‑ 193 131 - 179 521 - 171 148 ‑ 198 653Dividends paid ‑ 6 038 - 21 592 - 24 270 - 29 579 ‑ 36 452CASH SURPLUS (+)/DEFICIT (-) - 136 858 - 74 446 22 989 37 174 9 347Additional information to the Cash Flow StatementCASH SURPLUS (+)/DEFICIT (‑) ‑ 136 858 - 74 446 22 989 37 174 9 347Acquisitions under finance leases and similar arrangements ABS GFS SURPLUS (+)/DEFICIT (‑) including finance leases and similar arrangements
‑ 136 858 - 74 446 22 989 37 174 9 347
1 Includes equity acquisitions, disposals and privatisations (net).

94 Uniform Presentation Framework
2018-19 Budget
Table 8.7
Non Financial Public Sector Comprehensive Operating Statement 2017-18 2018-19 2019-20 2020-21 2021-22
Estimate Budget Forward estimate
$000 $000 $000 $000 $000
REVENUE
Taxation revenue 617 831 530 744 543 406 569 904 588 724
Current grants 3 997 865 3 901 146 3 706 402 3 822 759 3 941 018
Capital grants 270 198 327 823 225 981 165 950 126 227
Sales of goods and services 1 013 483 1 060 643 1 178 356 1 196 880 1 224 181
Interest income 107 717 73 314 78 321 81 055 82 794
Dividend and income tax equivalent income 22 009 27 939 35 971 35 380 41 670
Other revenue 417 013 346 771 321 555 320 332 320 566
TOTAL REVENUE 6 446 116 6 268 380 6 089 992 6 192 260 6 325 180
less EXPENSES
Employee benefits expense 2 526 848 2 453 702 2 509 651 2 544 647 2 578 498
Superannuation expenses
Superannuation interest cost 129 094 128 080 128 080 128 080 128 080
Other superannuation expenses 227 859 230 838 232 725 229 567 230 612
Depreciation and amortisation 597 698 584 453 574 179 573 387 572 367
Other operating expenses 2 012 167 1 947 133 2 032 406 2 021 358 2 049 467
Interest expenses 287 632 323 574 384 708 440 237 506 130
Other property expenses
Current grants 931 342 959 496 890 580 920 424 922 149
Capital grants 111 591 80 242 36 404 26 367 23 786
Subsidies and personal benefit payments 153 080 158 323 160 292 164 421 168 052
TOTAL EXPENSES 6 977 311 6 865 841 6 949 025 7 048 488 7 179 141
equals NET OPERATING BALANCE - 531 195 - 597 461 - 859 033 - 856 228 - 853 961
plus Other economic flows – included in operating result ‑ 165 553 45 354 26 497 47 636 51 306
equals OPERATING RESULT - 696 748 - 552 107 - 832 536 - 808 592 - 802 655
plus Other economic flows – other comprehensive income
175 027 149 618 144 091 141 619 136 703
equals COMPREHENSIVE RESULT – total change in net worth before transactions with owners in their capacity as owners
- 521 721 - 402 489 - 688 445 - 666 973 - 665 952
NET OPERATING BALANCE - 531 195 - 597 461 - 859 033 - 856 228 - 853 961
less Net acquisition of non financial assets
Purchases of non financial assets 1 090 434 1 231 895 879 019 844 687 812 291
Sales of non financial assets ‑ 53 957 ‑ 53 260 ‑ 57 983 - 49 211 - 49 211
less Depreciation 597 698 584 453 574 179 573 387 572 367
plus Change in inventories - 1 191 5 825 5 757 2 586 2 854
plus Other movements in non financial assets 15 394 17 000 21 913 20 913 20 913
equals Total net acquisition of non financial assets 452 982 617 007 274 527 245 588 214 480
equals FISCAL BALANCE - 984 177 - 1 214 468 - 1 133 560 - 1 101 816 - 1 068 441

Uniform Presentation Framework 95
Budget Strategy and Outlook
Table 8.8
Non Financial Public Sector Balance Sheet 2017-18 2018-19 2019-20 2020-21 2021-22
Estimate Budget Forward estimate
$000 $000 $000 $000 $000
ASSETS
Financial assets
Cash and deposits 186 382 101 327 137 445 101 675 129 090
Advances paid 171 367 171 367 171 367 171 367 171 167
Investments, loans and placements 2 063 984 2 196 924 2 305 029 2 426 234 2 549 366
Receivables 417 136 439 537 427 401 422 883 427 094
Equity
Investments in other public sector entities 21 631 21 631 21 631 21 631 21 631
Investments – other 3 3 3 3 3
Other financial assets 17 387 17 387 17 387 17 387 17 387
Total financial assets 2 877 890 2 948 176 3 080 263 3 161 180 3 315 738
Non financial assets
Inventories 196 766 202 591 208 348 210 934 213 788
Property, plant and equipment 18 244 636 18 860 840 19 131 734 19 379 876 19 596 426
Investment property 99 495 95 495 91 495 87 495 83 495
Other non financial assets 151 790 151 272 154 518 158 078 161 854
Total non financial assets 18 692 687 19 310 198 19 586 095 19 836 383 20 055 563
TOTAL ASSETS 21 570 577 22 258 374 22 666 358 22 997 563 23 371 301
LIABILITIES
Deposits held 104 069 118 212 126 488 111 882 100 272
Advances received 283 895 285 315 286 083 276 135 265 490
Borrowing 5 346 652 6 551 470 7 748 388 8 861 301 10 027 096
Superannuation 3 502 439 3 357 677 3 212 915 3 068 153 2 926 093
Other employee benefits 689 225 690 781 692 048 691 937 691 508
Payables 263 763 269 169 290 646 303 226 314 854
Other liabilities 828 975 836 680 849 165 891 277 918 288
TOTAL LIABILITIES 11 019 018 12 109 304 13 205 733 14 203 911 15 243 601
NET ASSETS/(LIABILITIES) 10 551 559 10 149 070 9 460 625 8 793 652 8 127 700
Contributed equity
Accumulated surplus/(deficit) 2 735 269 2 332 780 1 644 335 977 362 311 410
Reserves 7 816 290 7 816 290 7 816 290 7 816 290 7 816 290
NET WORTH 10 551 559 10 149 070 9 460 625 8 793 652 8 127 700
NET FINANCIAL WORTH1 - 8 141 128 - 9 161 128 - 10 125 470 ‑ 11 042 731 ‑ 11 927 863
NET FINANCIAL LIABILITIES2 8 162 759 9 182 759 10 147 101 11 064 362 11 949 494
NET DEBT3 3 312 883 4 485 379 5 547 118 6 550 042 7 543 235
1 Net financial worth equals total financial assets minus total liabilities.2 Net financial liabilities equals the sum of total liabilities less total financial assets excluding investments in other public sector entities.3 Net debt equals the sum of deposits held, advances received and borrowing, minus the sum of cash and deposits, advances paid and
investments, loans and placements.

96 Uniform Presentation Framework
2018-19 Budget
Table 8.9
Non Financial Public Sector Cash Flow Statement 2017-18 2018-19 2019-20 2020-21 2021-22 Estimate Budget Forward estimate
$000 $000 $000 $000 $000Cash receipts from operating activitiesTaxes received 617 831 530 744 543 406 569 904 588 724Receipts from sales of goods and services 1 027 370 1 062 268 1 226 883 1 226 170 1 251 630Grants and subsidies received 4 268 063 4 228 969 3 932 383 3 988 709 4 067 245Interest receipts 107 717 73 314 78 321 81 055 82 794Dividends and income tax equivalents 21 367 22 009 27 939 35 971 35 380Other receipts 642 856 580 475 547 273 547 073 547 307Total operating receipts 6 685 204 6 497 779 6 356 205 6 448 882 6 573 080Cash payments for operating activitiesPayments for employees - 2 877 891 ‑ 2 805 436 ‑ 2 869 123 - 2 904 811 ‑ 2 942 239Payment for goods and services ‑ 2 354 342 - 2 211 752 ‑ 2 304 487 - 2 250 050 ‑ 2 293 100Grants and subsidies paid - 1 192 808 - 1 196 690 - 1 087 276 - 1 111 212 ‑ 1 113 987Interest paid ‑ 289 193 ‑ 321 198 ‑ 381 650 ‑ 438 099 ‑ 503 448Other paymentsTotal operating payments - 6 714 234 - 6 535 076 - 6 642 536 - 6 704 172 - 6 852 774NET CASH FLOWS FROM OPERATING ACTIVITIES - 29 030 - 37 297 - 286 331 - 255 290 - 279 694Cash flows from investments in non financial assetsSales of non financial assets 53 957 53 260 57 983 49 211 49 211Purchases of non financial assets ‑ 1 090 434 ‑ 1 231 895 - 879 019 - 844 687 - 812 291Net cash flows from investments in non financial assets - 1 036 477 - 1 178 635 - 821 036 - 795 476 - 763 080NET CASH FROM OPERATING ACTIVITIES AND INVESTMENTS IN NON FINANCIAL ASSETS
- 1 065 507 - 1 215 932 - 1 107 367 - 1 050 766 - 1 042 774
Net cash flows from investments in financial assets for policy purposes1
9 490 200
Net cash flows from investments in financial assets for liquidity purposes
24 663 - 89 504 - 62 477 ‑ 73 363 ‑ 73 551
NET CASH FLOWS FROM INVESTING ACTIVITIES ‑ 1 002 324 ‑ 1 268 139 ‑ 883 513 ‑ 868 839 ‑ 836 431Net cash flows from financing activitiesAdvances received (net) 2 014 1 420 768 - 9 948 - 10 645Borrowing (net) 977 527 1 204 818 1 196 918 1 112 913 1 165 795Deposits received (net) - 45 782 14 143 8 276 - 14 606 - 11 610Other financing (net) NET CASH FLOWS FROM FINANCING ACTIVITIES 933 759 1 220 381 1 205 962 1 088 359 1 143 540NET INCREASE/DECREASE IN CASH HELD - 97 595 - 85 055 36 118 ‑ 35 770 27 415Net cash flows from operating activities ‑ 29 030 ‑ 37 297 ‑ 286 331 - 255 290 - 279 694Net cash flows from investments in non financial assets ‑ 1 036 477 ‑ 1 178 635 ‑ 821 036 - 795 476 ‑ 763 080CASH SURPLUS (+)/DEFICIT (-) - 1 065 507 - 1 215 932 - 1 107 367 - 1 050 766 - 1 042 774Future infrastructure and superannuation contributions/ earnings2
- 41 866 - 25 804 ‑ 27 353 - 28 994 ‑ 30 733
UNDERLYING SURPLUS (+)/DEFICIT (-) - 1 107 373 - 1 241 736 - 1 134 720 - 1 079 760 - 1 073 507Additional information to the Cash Flow StatementCASH SURPLUS (+)/DEFICIT (‑) - 1 065 507 ‑ 1 215 932 ‑ 1 107 367 - 1 050 766 - 1 042 774Acquisitions under finance leases and similar arrangements ABS GFS SURPLUS (+)/DEFICIT (‑) including finance leases and similar arrangements
- 1 065 507 ‑ 1 215 932 ‑ 1 107 367 - 1 050 766 - 1 042 774
1 Includes equity acquisitions, disposals and privatisations (net).2 Contributions for future infrastructure and superannuation requirements.

Uniform Presentation Framework 97
Budget Strategy and Outlook
Table 8.10
Public Financial Corporation Sector Comprehensive Operating Statement 2017-18
Estimate
$000
REVENUE
Current grants
Capital grants
Sales of goods and services 822
Interest income 231 467
Other revenue
TOTAL REVENUE 232 289
less EXPENSES
Employee benefits expense 853
Superannuation expenses 100
Depreciation and amortisation
Other operating expenses 1 669
Interest expenses 207 658
Other property expenses 6 603
Current grants
Capital grants
Subsidies and personal benefit payments
TOTAL EXPENSES 216 883
equals NET OPERATING BALANCE 15 406
plus Other economic flows – included in operating result
equals OPERATING RESULT 15 406
plus Other economic flows – other comprehensive income
equals COMPREHENSIVE RESULT – total change in net worth before transactions with owners in their capacity as owners
15 406
NET OPERATING BALANCE 15 406
less Net acquisition of non financial assets
Purchases of non financial assets
Sales of non financial assets
less Depreciation
plus Change in inventories
plus Other movements in non financial assets
equals Total net acquisition of non financial assets
equals FISCAL BALANCE 15 406

98 Uniform Presentation Framework
2018-19 Budget
Table 8.11
Public Financial Corporation Sector Balance Sheet 2017-18
Estimate
$000
ASSETS
Financial assets
Cash and deposits 23 943
Advances paid 74 350
Investments, loans and placements 4 892 178
Receivables 4 463
Equity
Other financial assets
Total financial assets 4 994 934
Non financial assets
Inventories
Property, plant and equipment
Investment property
Other non financial assets
Total non financial assets
TOTAL ASSETS 4 994 934
LIABILITIES
Deposits held 312
Advances received 208 736
Borrowing 4 690 213
Superannuation
Other employee benefits 161
Payables 51 872
Other liabilities 22 009
TOTAL LIABILITIES 4 973 303
NET ASSETS/(LIABILITIES) 21 631
Contributed equity 18 714
Accumulated surplus/(deficit) 2 917
Reserves
TOTAL EQUITY 21 631
NET FINANCIAL WORTH1 21 631
NET DEBT2 - 91 210
1 Net financial worth equals total financial assets minus total liabilities.2 Net debt equals the sum of deposits held, advances received and borrowing, minus the sum of cash and deposits, advances paid and
investments, loans and placements.

Uniform Presentation Framework 99
Budget Strategy and Outlook
Table 8.12
Public Financial Corporation Sector Cash Flow Statement 2017-18
Estimate
$000
Cash receipts from operating activities
Receipts from sales of goods and services 822
Grants and subsidies received
Interest receipts 232 694
Other receipts
Total operating receipts 233 516
Cash payments for operating activities
Income tax equivalents paid - 6 410
Payments for employees ‑ 953
Payment for goods and services - 1 669
Grants and subsidies paid
Interest paid - 200 765
Other payments
Total operating payments - 209 797
NET CASH FLOWS FROM OPERATING ACTIVITIES 23 719
Cash flows from investments in non financial assets
Sales of non financial assets
Purchases of non financial assets
Net cash flows from investments in non financial assets
NET CASH FROM OPERATING ACTIVITIES AND INVESTMENTS IN NON FINANCIAL ASSETS 23 719
Net cash flows from investments in financial assets for policy purposes1
Net cash flows from investments in financial assets for liquidity purposes - 985 010
NET CASH FLOWS FROM INVESTING ACTIVITIES - 985 010
Net cash flows from financing activities
Advances received (net) ‑ 7 434
Borrowing (net) 939 000
Deposits received (net)
Dividends paid - 14 957
Other financing (net)
NET CASH FLOWS FROM FINANCING ACTIVITIES 916 609
NET INCREASE/DECREASE IN CASH HELD - 44 682
Net cash flows from operating activities 23 719
Net cash flows from investments in non financial assets
Distributions paid - 14 957
CASH SURPLUS (+)/DEFICIT (-) 8 762
Additional information to the Cash Flow Statement
CASH SURPLUS (+)/DEFICIT (‑) 8 762
Acquisitions under finance leases and similar arrangements
ABS GFS SURPLUS (+)/DEFICIT (‑) including finance leases and similar arrangements 8 762
1 Includes equity acquisitions, disposals and privatisations (net).

100 Uniform Presentation Framework
2018-19 Budget
Table 8.13
Total Public Sector Comprehensive Operating Statement 2017-18
Estimate
$000
REVENUE
Taxation revenue 617 831
Current grants 3 997 865
Capital grants 270 198
Sales of goods and services 1 012 828
Interest income 107 917
Dividend and income tax equivalent income
Other revenue 416 957
TOTAL REVENUE 6 423 596
less EXPENSES
Employee benefits expense 2 527 701
Superannuation expenses
Superannuation interest cost 129 094
Other superannuation expenses 227 903
Depreciation and amortisation 597 698
Other operating expenses 2 012 359
Interest expenses 264 023
Other property expenses
Current grants 931 342
Capital grants 111 591
Subsidies and personal benefit payments 153 080
TOTAL EXPENSES 6 954 791
equals NET OPERATING BALANCE - 531 195
plus Other economic flows – included in operating result ‑ 165 553
equals OPERATING RESULT - 696 748
plus Other economic flows – other comprehensive income 175 027
equals COMPREHENSIVE RESULT – total change in net worth before transactions with owners in their capacity as owners
- 521 721
NET OPERATING BALANCE - 531 195
less Net acquisition of non financial assets
Purchases of non financial assets 1 090 434
Sales of non financial assets ‑ 53 957
less Depreciation 597 698
plus Change in inventories - 1 191
plus Other movements in non financial assets 15 394
equals Total net acquisition of non financial assets 452 982
equals FISCAL BALANCE - 984 177

Uniform Presentation Framework 101
Budget Strategy and Outlook
Table 8.14
Total Public Sector Balance Sheet 2017-18
Estimate
$000
ASSETS
Financial assets
Cash and deposits 186 382
Advances paid 171 367
Investments, loans and placements 2 063 984
Receivables 395 124
Equity
Investments in other public sector entities
Investments – other 3
Other financial assets 17 387
Total financial assets 2 834 247
Non financial assets
Inventories 196 766
Property, plant and equipment 18 244 636
Investment property 99 495
Other non financial assets 151 790
Total non financial assets 18 692 687
TOTAL ASSETS 21 526 934
LIABILITIES
Deposits held 80 438
Advances received 214 053
Borrowing 5 348 915
Superannuation 3 502 439
Other employee benefits 689 386
Payables 311 168
Other liabilities 828 976
TOTAL LIABILITIES 10 975 375
NET ASSETS/(LIABILITIES) 10 551 559
Contributed equity
Accumulated surplus/(deficit) 2 738 186
Reserves 7 813 373
NET WORTH 10 551 559
NET FINANCIAL WORTH1 - 8 141 128
NET DEBT2 3 221 673
1 Net financial worth equals total financial assets minus total liabilities.2 Net debt equals the sum of deposits held, advances received and borrowing, minus the sum of cash and deposits, advances paid and
investments, loans and placements.

102 Uniform Presentation Framework
2018-19 Budget
Table 8.15
Total Public Sector Cash Flow Statement 2017-18
Estimate
$000
Cash receipts from operating activities
Taxes received 617 831
Receipts from sales of goods and services 1 026 715
Grants and subsidies received 4 268 063
Interest receipts 107 717
Other receipts 642 856
Total operating receipts 6 663 182
Cash payments for operating activities
Payments for employees - 2 878 844
Payment for goods and services ‑ 2 354 534
Grants and subsidies paid - 1 192 808
Interest paid - 257 264
Other payments
Total operating payments - 6 683 450
NET CASH FLOWS FROM OPERATING ACTIVITIES - 20 268
Cash flows from investments in non financial assets
Sales of non financial assets 53 957
Purchases of non financial assets ‑ 1 090 434
Net cash flows from investments in non financial assets - 1 036 477
NET CASH FROM OPERATING ACTIVITIES AND INVESTMENTS IN NON FINANCIAL ASSETS - 1 056 745
Net cash flows from investments in financial assets for policy purposes1 9 490
Net cash flows from investments in financial assets for liquidity purposes 24 663
NET CASH FLOWS FROM INVESTING ACTIVITIES ‑ 1 002 324
Net cash flows from financing activities
Advances received (net) ‑ 7 434
Borrowing (net) 933 531
Deposits received (net) - 1 100
Other financing (net)
NET CASH FLOWS FROM FINANCING ACTIVITIES 924 997
NET INCREASE/DECREASE IN CASH HELD - 97 595
Net cash flows from operating activities - 20 268
Net cash flows from investments in non financial assets ‑ 1 036 477
CASH SURPLUS (+)/DEFICIT (-) - 1 056 745
Future infrastructure and superannuation contributions/earnings2 - 41 866
UNDERLYING SURPLUS (+)/DEFICIT (-) - 1 098 611
Additional information to the Cash Flow Statement
CASH SURPLUS (+)/DEFICIT (‑) - 1 056 745
Acquisitions under finance leases and similar arrangements
ABS GFS SURPLUS (+)/DEFICIT (‑) including finance leases and similar arrangements - 1 056 745
1 Includes equity acquisitions, disposals and privatisations (net).2 Contributions for future infrastructure and superannuation requirements.

Uniform Presentation Framework 103
Budget Strategy and Outlook
Table 8.16
General Government Sector Taxes 2017-18 Estimate
2018-19 Budget
$M $M
Taxes on employers’ payroll and labour force 353 252
Payroll taxes 353 252
Taxes on property 74 80
Stamp duties on financial and capital transactions 74 80
Taxes on the provision of goods and services 124 128
Taxes on gambling 79 82
Taxes on insurance 45 46
Taxes on the use of goods and performance of activities 77 80
Motor vehicle registration fees 77 80
TOTAL TAXES 628 540
Table 8.17
State and Territory General Government Sector Grant Revenue 2017-18 Estimate
2018-19 Budget
$M $M
Current grant revenue
Current grants from the Commonwealth (including for on‑passing)
National partnership payments 258 213
Specific purpose payments 389 367
General purpose grants 3 350 3 320
Total current grant revenue 3 997 3 901
Capital grant revenue
Capital grants from the Commonwealth (including for on‑passing)
National partnership payments 197 306
Specific purpose payments 24
General purpose grants 32 14
Total capital grant revenue 253 320
TOTAL GRANTS REVENUE 4 250 4 220

104 Uniform Presentation Framework
2018-19 Budget
Table 8.18
State and Territory General Government Sector Grant Expenses 2017-18 Estimate
2018-19 Budget
$M $M
Current grant expenses including subsidies and personal benefit payments
Local government 120 111
Private and not‑for‑profit sector (including for on‑passing) 873 924
Grants to other sectors of government 59 59
Other 219 200
Total current grant expenses including subsidies and personal benefit payments 1 271 1 294
Capital grant expenses
Local government 21 10
Private and not‑for‑profit sector (including for on‑passing) 88 70
Grants to other sectors of government 32 28
Other 3
Total capital grant expenses 143 108
TOTAL GRANT EXPENSES 1 415 1 402
Table 8.19
General Government Sector Dividend and Income Tax Equivalent Income 2017-18 Estimate
2018-19 Budget
$M $M
Dividend and income tax equivalent income from public non financial corporations sector 63 53
Dividend and income tax equivalent income from public financial corporations sector 22 28
TOTAL DIVIDEND AND INCOME TAX EQUIVALENT INCOME 85 81

Uniform Presentation Framework 105
Budget Strategy and Outlook
Table 8.20
General Government Sector Operating Expenses by Function 2017-18 Estimate
2018-19 Budget
$M $M
General public services 492 490
Public order and safety 776 764
Economic affairs 510 458
Environmental protection 114 116
Housing and community amenities 653 582
Health 1 565 1 486
Recreation, culture and religion 198 192
Education 1 159 1 180
Social protection 600 648
Transport 314 301
TOTAL OPERATING EXPENSES 6 380 6 219
Table 8.21
General Government Sector Purchases of Non Financial Assets by Function 2017-18 Estimate
2018-19 Budget
$M $M
General public services 17 14
Public order and safety 63 126
Economic affairs 28 53
Environmental protection 4 7
Housing and community amenities 217 365
Health 157 70
Recreation, culture and religion 55 34
Education 69 51
Social protection 13 32
Transport 223 287
TOTAL PURCHASES OF NON FINANCIAL ASSETS 846 1 039

106
2018-19 Budget

Appendix B 107
Budget Strategy and Outlook
Appendices

108
2018-19 Budget

109
Budget Strategy and Outlook
Appendix A
Appendix A Classification of Entities in the Northern TerritoryTotal Public Sector
Non Financial Public SectorGeneral GovernmentAboriginal Areas Protection AuthorityAuditor‑General’s OfficeAustralAsia Railway Corporation1
Batchelor Institute of Indigenous Tertiary Education1
Central Australia Health Service2
Central Holding AuthorityDarwin Waterfront Corporation1
Data Centre Services2
Department of the Attorney‑General and JusticeDepartment of the Chief MinisterDepartment of Corporate and Information ServicesDepartment of EducationDepartment of Environment and Natural ResourcesDepartment of Health Department of Housing and Community DevelopmentDepartment of Infrastructure, Planning and LogisticsDepartment of the Legislative AssemblyDepartment of Primary Industry and ResourcesDepartment of Tourism and CultureDepartment of Trade, Business and InnovationDepartment of Treasury and Finance Desert Knowledge Australia1
Motor Accidents (Compensation) Commission1
Museums and Art Galleries Board of the Northern Territory1
Nominal Insurer’s Fund1
Northern Territory Electoral CommissionNorthern Territory Legal Aid Commission1
Northern Territory Major Events Company Pty Ltd1
Northern Territory Police, Fire and Emergency ServicesNT Build Statutory Corporation1
NT Fleet2
NT Home Ownership2
Office of the Commissioner for Public EmploymentOmbudsman’s OfficeTerritory FamiliesTerritory Wildlife Parks2
Top End Health Service2
Public Non Financial CorporationsIndigenous Essential Services Pty Ltd1
Jacana Energy1, 3
Land Development Corporation2
Power and Water Corporation1, 3
Territory Generation1, 3
Public Financial CorporationNorthern Territory Treasury Corporation2
1 Non‑budget sector entity.2 Government business division.3 Government owned corporation.

110 Appendix B
2018-19 Budget
Appendix B Glossary
Advances/advances paidAdvances are the creation of financial assets (that is, an increase in the indebtedness to government units) with the aim of funding particular enterprise, household or government activities.
AgencyA unit of government administration, office or statutory corporation, nominated in an Administrative Arrangements Order for the purposes of the Financial Management Act and including, where the case requires, a part or division (by whatever name called) of an agency.
AppropriationAn authority given by the Legislative Assembly to make payments, now or at some future time, for the purposes stated, up to the limit of the amount in the particular Act.
Australian Accounting StandardsStatements of accounting standards that can be applied in preparation and presentation of financial statements.
Australian Bureau of Statistics (ABS) The ABS is a Commonwealth agency that coordinates statistical activities and collaborates with official bodies in the collection, compilation, analysis and distribution of statistics.
Capital grantsTransactions in which the ownership of an asset (other than cash and inventories) is transferred from one institutional unit to another, cash is transferred to enable the recipient to acquire another asset, or the funds realised by the disposal of another asset are transferred, for which no economic benefits of equal value are receivable or payable in return.
Cash surplus/deficitReported in the Cash Flow Statement and measures the net impact of cash flows during the period. It equals net cash flows from operating activities plus net cash flows from acquisition and disposal of non financial assets, less distributions paid, less value of assets acquired under finance leases and similar arrangements.
Classifications of Functions of Government of Australia (COFOG‑A)A framework to classify government outlays or expenditure by the purpose served, for example, health or education.
Commonwealth Grants Commission (CGC)The CGC is a Commonwealth statutory body that makes recommendations to the Commonwealth Treasurer on how the revenues raised from GST should be distributed to the states and territories to achieve horizontal fiscal equalisation.
Commonwealth own‑purpose expenses (COPE) Payments by the Commonwealth for goods and services and associated transfer payments for the conduct of its own general government activities.

Appendix B 111
Budget Strategy and Outlook
Community service obligation (CSO)A CSO arises when the Government requires a government business division or government owned corporation to carry out activities that it would not choose to do on a commercial basis or would only do at higher commercial prices. CSOs allow the Government to achieve identifiable community or social objectives that would not be achieved if left to commercial considerations.
Comprehensive resultThe net result of all items of income and expense recognised for the period. It is the aggregate of operating result and other movements in equity, other than transactions with owners.
Consumer price index (CPI)A general indicator of the prices paid by household consumers for a specific basket of goods and services in one period relative to the cost of the same basket in a base period.
Contingent liabilityA potential financial obligation arising out of a condition, situation, guarantee or indemnity, the ultimate effect of which will be confirmed only on the occurrence or non‑occurrence of one or more uncertain future events.
Current grantsAmounts payable or receivable for current purposes for which no economic benefits of equal value are receivable or payable in return.
Finance leaseLease agreements that transfer substantially all the risks and benefits relating to ownership of an asset from the lessor (legal owner) to the lessee (party using the asset).
Financial assetAny asset that is:
• cash
• an equity instrument of another entity
• a contractual right:
− to receive cash or another financial asset from another entity or
− to exchange financial assets or financial liabilities with another entity under conditions that are potentially favourable to the entity or
• a contract that will or may be settled in the entity’s own equity instruments and is:
− a non‑derivative for which the entity is or may be obliged to receive a variable number of the entity’s own equity instruments or
− a derivative that will or may be settled other than by the exchange of a fixed amount of cash or another financial asset for a fixed number of the entity’s own equity instruments.
For this purpose, the entity’s own equity instruments do not include instruments that are themselves contracts for the future receipt or delivery of the entity’s own equity instruments.
112 Appendix B
2018-19 Budget
Fiscal balance (net lending/borrowing)Fiscal balance, also referred to as net lending/borrowing, is an operating statement measure that differs from the net operating balance in that it includes spending on capital items but excludes depreciation. A net lending (or fiscal surplus) balance indicates that a government is saving more than enough to finance all its investment spending. A net borrowing (or fiscal deficit) position indicates that a government’s level of investment is greater than its level of savings.
General government sector (GGS)Defined in Government Finance Statistics as an entity or group of entities that are mainly engaged in the production of goods and or services outside the normal market mechanism. Goods and services are provided free of charge or at nominal charges well below costs of production.
Generally accepted accounting principles (GAAP)Term used to describe broadly the body of principles that governs the accounting for financial transactions underlying the preparation of a set of financial statements.
Goods and services tax (GST) revenueThe Territory’s share of nationally collected GST, based on the Territory’s population share weighted by its GST relativity. Revenue‑sharing relativities are determined by the Commonwealth Treasurer, informed by the recommendations of the CGC.
Government business division (GBD)A Territory‑controlled trading entity that follows commercial practices and is required to comply with competitive neutrality principles.
Government finance statistics (GFS)Refers to statistics that measure the financial transactions of governments and reflect the impact of those transactions on other sectors of the economy. GFS in Australia are developed by the ABS in conjunction with all governments and are mainly based on international statistical standards developed, in consultation with member countries, by the International Monetary Fund.
Government owned corporationAn entity in which its objectives are to operate at least as efficiently as any corporate business and maximise sustainable return to government. The Government Owned Corporations Act adopts the shareholder model of corporate governance. The Territory has three government owned corporations: Power and Water Corporation, Territory Generation (power generation) and Jacana Energy (power retail corporation).
GrantsTransactions in which one unit provides goods, services, assets (or extinguishes a liability) or labour to another unit without receiving approximately equal value in return. Grants can either be current or capital nature (see current grants and capital grants).
Grants can be paid as general purpose grants, which refer to grants that are not subject to conditions regarding their use. Alternatively, they may be paid as specific purpose grants, which are paid for a particular purpose and or have conditions attached regarding their use.
Grants for on-passingAll grants paid to one institutional sector (for example, a state general government) to be passed on to another institutional sector (for example, local government or a non‑profit institution).

Appendix B 113
Budget Strategy and Outlook
Gross domestic product (GDP)The total value of goods and services produced in Australia over the period for final consumption. Intermediate goods, or those used in the production of other goods, are excluded. Gross domestic product can be calculated by summing total output, total income or total expenditure.
Gross state product (GSP)Measures the total value of goods and services produced in a jurisdiction. It is the sum of all income, namely wages, salaries and profits, plus indirect taxes less subsidies. It can also be calculated by measuring expenditure, where it is the sum of state final demand and international and interstate trade, changes in the level of stocks and a balancing item.
GuaranteeAn undertaking to answer for the debt or obligations of another person or entity.
IndemnityA written undertaking to compensate, protect or insure another person or entity against future financial loss, damage or liability.
Intergovernmental agreementAn agreement signed by all states and the Commonwealth in December 2008 defining the framework for federal financial relations, encompassing Commonwealth funding to states and territories through general revenue assistance, specific purpose payments and national partnership payments.
National partnership agreementsNational partnership (NP) agreements are agreements between the Commonwealth, states and territories with defined objectives, outcomes, outputs and performance measures related to the delivery of projects of national significance or to facilitate reforms.
National partnership paymentsNP payments are tied Commonwealth grants provided to states and territories to enable them to achieve the outcomes and outputs of an NP agreement.
Net acquisition/(disposal) of non financial assets from transactionsPurchases (or acquisitions) of non financial assets less sales (or disposals) of non financial assets less depreciation plus changes in inventories and other movements in non financial assets.
Purchases and sales (or net acquisitions) of non financial assets generally include accrued expenses and payables for capital items. Purchases exclude non‑produced assets and valuables, which are included in other movements in non financial assets.
Net actuarial gainsIncludes actuarial gains and losses on defined benefit superannuation plans.
Net cash flows from investments in financial assets (liquidity management purposes)Cash receipts from liquidation or repayment of investments in financial assets for liquidity management purposes less cash payments for such investments. Investment for liquidity management purposes means making funds available to others with no policy intent and with the aim of earning a commercial rate of return.

114 Appendix B
2018-19 Budget
Net cash flows from investments in financial assets (policy purposes) Cash receipts from the repayment and liquidation of investments in financial assets for policy purposes less cash payments for acquiring financial assets for policy purposes. Acquisition of financial assets for policy purposes is distinguished from investments in financial assets (liquidity management purposes) by the underlying government motivation for acquiring the assets. Acquisition of financial assets for policy purposes is motivated by government policies such as encouraging the development of certain industries or assisting citizens affected by natural disasters.
Net debtNet debt measures a government’s net stock of selected gross financial liabilities less financial assets.
It equals the sum of deposits held, advances received, government securities, loans and other borrowing less the sum of cash and deposits, advances paid and investments, loans and placements.
Net financial liabilitiesTotal liabilities less financial assets, other than equity in public non financial corporations and public financial corporations. This measure is broader than net debt, as it includes significant liabilities, other than borrowings (for example, accrued employee liabilities such as superannuation and long service leave entitlements). For the public non financial corporation and public financial corporation sectors, it is equal to negative net financial worth.
Net financial worthA measure of a government’s net holdings of financial assets. It is calculated from the Uniform Presentation Framework Balance Sheet as financial assets minus liabilities. Net financial worth is a broader measure than net debt as it incorporates provisions (such as superannuation, but excludes depreciation and doubtful debts) as well as holdings of equity. Net financial worth includes all classes of financial assets and liabilities.
Net operating balance Total revenue from transactions less total expenses from transactions. It is a summary measure of the ongoing sustainability of operations and excludes gains and losses resulting from changes in price levels and other changes in the volume of assets. It is the component of the change in net worth that is due to transactions and can be attributed directly to government policies.
Net worthProvides a relatively comprehensive picture of a government’s overall financial position. It is calculated as total assets less total liabilities less shares and other contributed capital. It includes a government’s non financial assets, such as land and other fixed assets, which may be sold and used to repay debt, as well as its financial assets and liabilities including debtors, creditors and superannuation liabilities. Net worth also shows asset acquisitions over time, giving an indication of the extent to which borrowings are used to finance asset purchases, rather than only current expenditure.
Non‑budget sector entityAn entity in which the Territory has a controlling interest. The entity is consolidated at whole‑of‑government level but is not presented separately in the Territory’s financial reports. Outside the scope of the Financial Management Act, it is generally a statutory body that does not meet the definition of a general government sector entity, public non financial corporation or public financial corporation.

Appendix B 115
Budget Strategy and Outlook
Non financial assetsAssets that are not financial assets and predominantly comprise land and other fixed assets.
Non financial public sector (NFPS)The sector formed through a consolidation of the general government and public non financial corporation sectors.
Other economic flowsChanges in the volume or value of an asset or liability that do not result from transactions (such as revaluations and other changes in the volume of assets).
Other superannuation expenseIncludes all superannuation expenses from transactions except superannuation interest cost. It generally includes current service cost, which is the increase in entitlements associated with the employment services provided by employees in the current period. Superannuation actuarial gains/losses are excluded as they are considered other economic flows.
PayablesIncludes short‑term and long‑term trade debt and accounts payable, grants and interest payable.
Public financial corporations (PFC)Government‑controlled entities that perform central bank functions, and or have the authority to incur liabilities and acquire financial assets in the market on their own account.
Public non financial corporationsPublic enterprises primarily engaged in the production of goods or services of a non financial nature, for sale in the market place, at prices that aim to recover most of the costs involved.
ReceivablesIncludes short‑term and long‑term trade credit and accounts receivable, grants, taxes and interest receivable.
Sale of goods and servicesRevenue from the direct provision of goods and services and includes fees and charges for services rendered, sale of goods and services, fees from regulatory services, and work done as an agent for private enterprises. It also includes rental income under operating leases and on produced assets such as buildings and entertainment, but excludes rental income from the use of non‑produced assets such as land. User charges include sale of goods and services revenue.
Specific purpose payments (SPPs)A Commonwealth financial contribution to support delivery of services in a particular sector. Payments are made from the Commonwealth Treasury to state and territory treasuries and are appropriated to the relevant government agency.
State final demand Final consumption expenditure plus gross fixed capital formation in each jurisdiction. It represents the total expenditure on consumption and investment in a jurisdiction.
Superannuation interest costInterest cost is the increase during a period in the present value of a defined benefit obligation that arises because the benefits are one period closer to settlement, as per the relevant accounting standard. The cost is measured net of the return on plan assets of defined benefit schemes.

116 Appendix B
2018-19 Budget
Tax equivalent regimeThe mechanism to ensure government business divisions and government owned corporations incur similar tax liabilities to privately owned organisations. Thus, greater parity exists between the cost structures of government‑controlled trading entities and the private sector, aiding in the achievement of competitive neutrality.
Total public sectorThe total public sector is formed through a consolidation of the non financial public sector and public financial corporations.
Treasurer’s AdvanceAn appropriation purpose of that name as specified in an Appropriation Act, which provides a pool of funds specifically set aside in each budget to meet one‑off unexpected costs that arise during the year and are substantial enough to warrant additional appropriation.
Uniform Presentation Framework (UPF) A uniform framework agreed by the Australian Loan Council and last revised in 2008 incorporating accounting standard AASB 1049 Whole of Government and General Government Sector Financial Reporting. The UPF requires Commonwealth, state and territory governments to present a minimum set of budget and financial outcome information based on the GFS, according to an agreed format, and specified Loan Council reporting arrangements.