Budget Presentation FY20 FinalR - Houston · )XQGLQJ 5HTXLUHPHQWV 67$7( )('(5$/ 25 7+,5' 3$57<...
53
HOUSTON CITY COUNCIL BUDGET WORKSHOP FY2020 Stephen L. Williams Director May 16, 2019
Transcript of Budget Presentation FY20 FinalR - Houston · )XQGLQJ 5HTXLUHPHQWV 67$7( )('(5$/ 25 7+,5' 3$57<...

HOUSTON CITY COUNCILBUDGET WORKSHOP FY2020Stephen L. WilliamsDirectorMay 16, 2019

Contents
01|STATUTORY REQ LICENSURES
03| FUNDING SOCIETAL IMPACTANTICIPATED GROWTH
02|
OUR TEAMOUR MISSIONWHAT WE DO
05|06|APPENDIX
DEMOGRAPHICS RACE/ETHNICITYDEMOGRAPHICS GENDERBUDGET REDUCTIONSPERFORMANCE MEASURESACHIEVEMENTS
04|FUNCTIONAL ORG CHARTTHREE YEAR REDUCTIONS
NET INVESTMENTFY20 REVENUES & EXPENDITURES

Leadership Org. Chart
21
DIRECTORStephen Williams
CHIEF COMMUNICATIONS
OFFICER Scott Packard
PUBLIC HEALTH AUTHORITY
David Persse, MD
ASSISTANT DIRECTOR
ENVIRONMENTAL HEALTH
Patrick Key
DEPUTY PUBLIC HEALTH AUTHORITY
Joann Schulte, MD
ASSISTANT DIRECTOR
CHILDREN HEALTH SERVICES
Decrecia Limbrick
ASSISTANT DIRECTOR DISEASE
PREVENTION & CONTROL
Marlene McNeese
ASSISTANT DIRECTORHEALTH CENTERS &
MULTI-SERVICE CENTERSSolly Diaz
DEPUTY DIRECTORCHIEF OF STAFF
Judy Harris
ASSISTANT DIRECTOR INFORMATION TECHNOLOGY
(Interim)William Bryant
DEPUTY DIRECTORADMINISTRATIVE SERVICES
C. Nicolette Walker
CHIEF PROGRAM OFFICEROFFICE OF PROGRAM DEVELOPMENT
Angelina Esparza
OFFICE OF PERFORMANCE MANAGEMENTWilliam Bryant
ASSISTANT DIRECTOR
HUMAN SERVICESDeborah Moore
PUBLIC INFORMATION OFFICERPorfirio Villarreal
3

4
Vision | Mission | GoalsOUR VISION: SELF-SUFFICIENT FAMILIES AND INDIVIDUALS IN SAFE AND HEALTHY COMMUNITIES.
OUR MISSION: TO WORK IN PARTNERSHIP WITH THE COMMUNITY TO PROMOTE AND PROTECT THE HEALTH AND SOCIAL WELL-BEING OF HOUSTONIANS AND THE ENVIRONMENT IN WHICH THEY LIVE.
1
ACCESS TO CARE
3
CHRONIC DISEASES
2
INFECTIOUS DISEASES
6MATERNAL & CHILD HEALTH
4ENVIRONMENTAL HEALTH HUMAN SERVICES
7CULTURE OF EXCELLENCE
OUR GOALS SUPPORT THE FOLLOWING PRIORITY/FOCUS AREAS:
PREPAREDNESS
1 2 3
4 5 6
7 8

Aging & Disability Services
Care CoordinationBehavioral HealthAdolescent Health
Re-EntryMy Brother’s Keeper
Food SafetyAir/Water QualityIndoor Air Quality
Non-Smoking OrdinanceLead Hazards
Ambulance PermitsSwimming Pools
Special WasteVital Statistics
HIV/STDTB/Hansen’s Disease
InformaticsSurveillanceLaboratory
PreparednessChronic Disease
DAWN
ImmunizationsWomen, Infants &
Children (WIC)Nurse-Family Partnership
Healthy Families
Health CentersPharmacy
MSC ProgrammingClient Access
Title XOral Health
Vision
5
Department ProgrammingMAJOR SERVICES
6
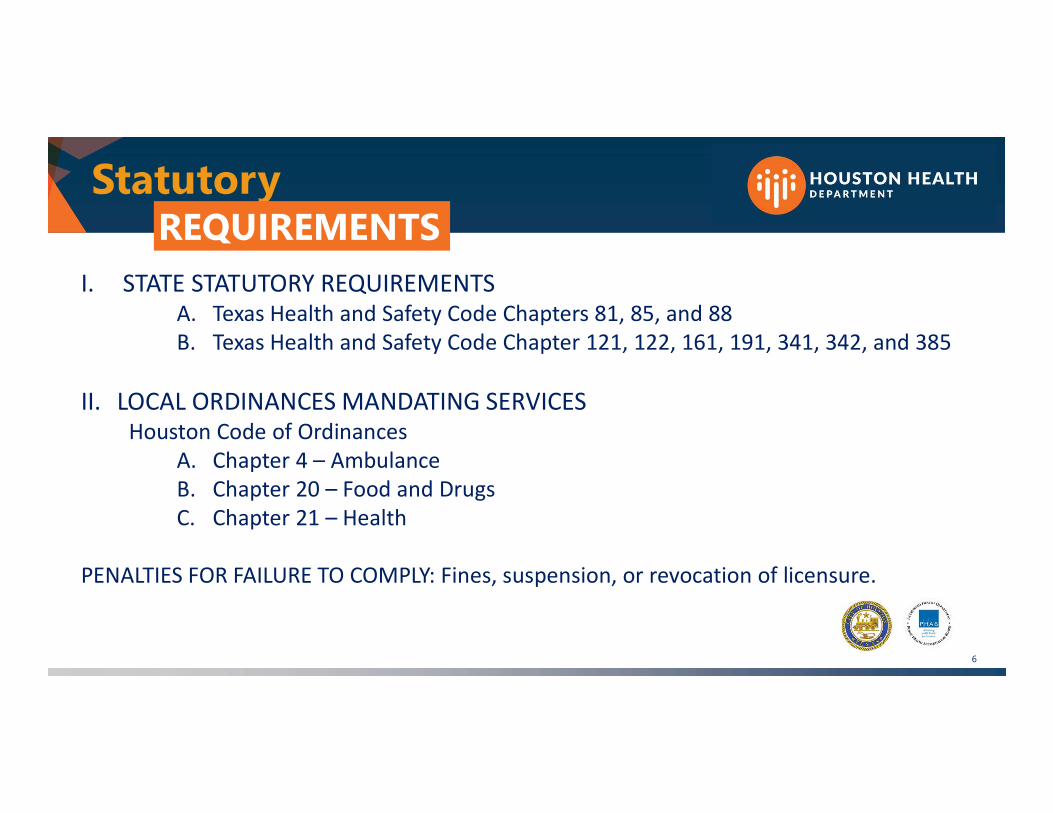
StatutoryREQUIREMENTS
I. STATE STATUTORY REQUIREMENTSA. Texas Health and Safety Code Chapters 81, 85, and 88B. Texas Health and Safety Code Chapter 121, 122, 161, 191, 341, 342, and 385
II. LOCAL ORDINANCES MANDATING SERVICESHouston Code of Ordinances
A. Chapter 4 – AmbulanceB. Chapter 20 – Food and DrugsC. Chapter 21 – Health
PENALTIES FOR FAILURE TO COMPLY: Fines, suspension, or revocation of licensure.
7
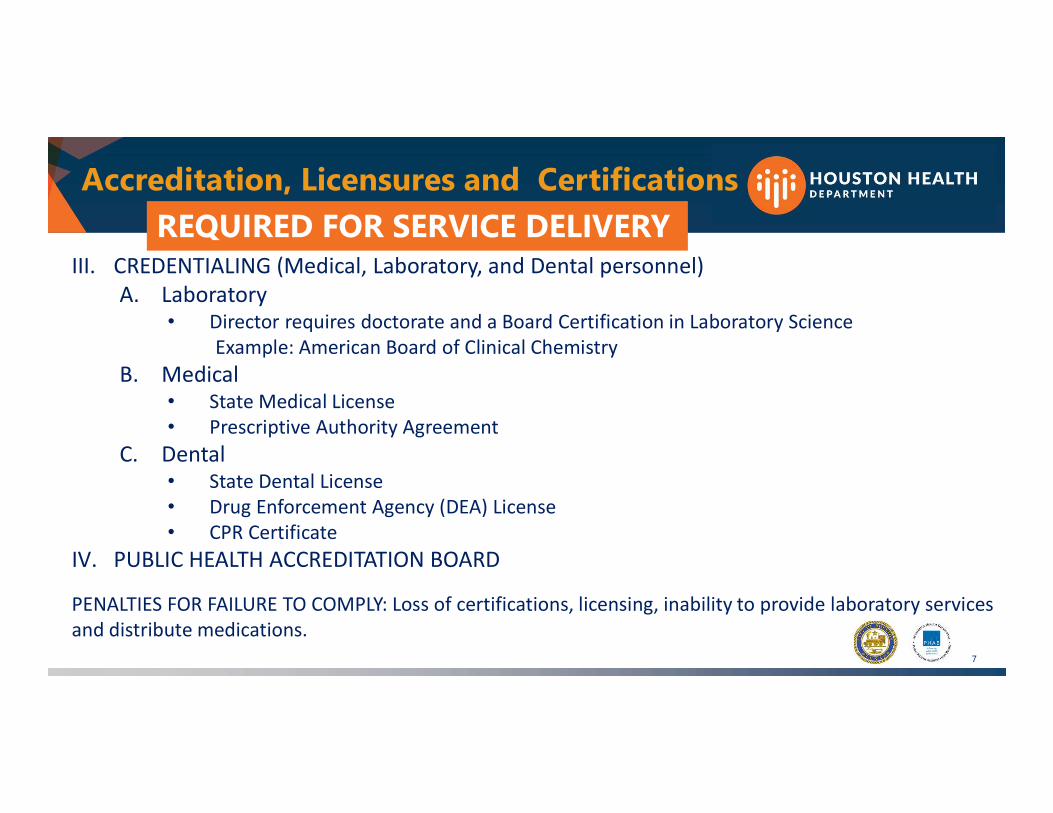
Accreditation, Licensures and CertificationsREQUIRED FOR SERVICE DELIVERY
III. CREDENTIALING (Medical, Laboratory, and Dental personnel)A. Laboratory
• Director requires doctorate and a Board Certification in Laboratory Science Example: American Board of Clinical Chemistry
B. Medical• State Medical License• Prescriptive Authority Agreement
C. Dental• State Dental License• Drug Enforcement Agency (DEA) License• CPR Certificate
IV. PUBLIC HEALTH ACCREDITATION BOARD
PENALTIES FOR FAILURE TO COMPLY: Loss of certifications, licensing, inability to provide laboratory services and distribute medications.

8
Licensures & CertificationsREQUIRED FOR SERVICE DELIVERY
I. LABORATORY• Clinical Laboratory Improvement Amendments (CLIA)• FCDC Federal Select Agent Program Certification• National Environmental Laboratory Accreditation• American Industrial Hygiene Association Accreditation
II. PHARMACY
• Texas State Board of Pharmacy Regulations, Rules and licensing• Health Resources and Services Administration(HRSA) 340B program requirements
• Family Planning, STD and TB

9
Funding RequirementsSTATE, FEDERAL OR THIRD PARTY GRANT/ENDOWMENT SUPPORT$ IN THOUSANDS
FUNDING SOURCE AWARD AMOUNT
CASH MATCH
AMOUNT
CASH MATCHING PROGRAM
FEDERAL – DIRECT $ 40,525
FEDERAL-PASS THROUGH $36,938 $153 $128 – Bioterror Prepared$25 – Bioterror Prepared Lab
STATE $ 6,380
LETTERS OF AGREEMENT WITH THE HOUSING AND COMMUNITY DEVELOPMENT DEPT.
$ 1,933
OTHER NON-GOVERNMENTAL AGENCIES $754
TOTAL GRANT/ENDOWMENT SUPPORT $86,530* $153
*Some grants are funded for multiple years and have start and end dates that differ from the City’s fiscal year end dates. This represents the total awarded amounts.
10
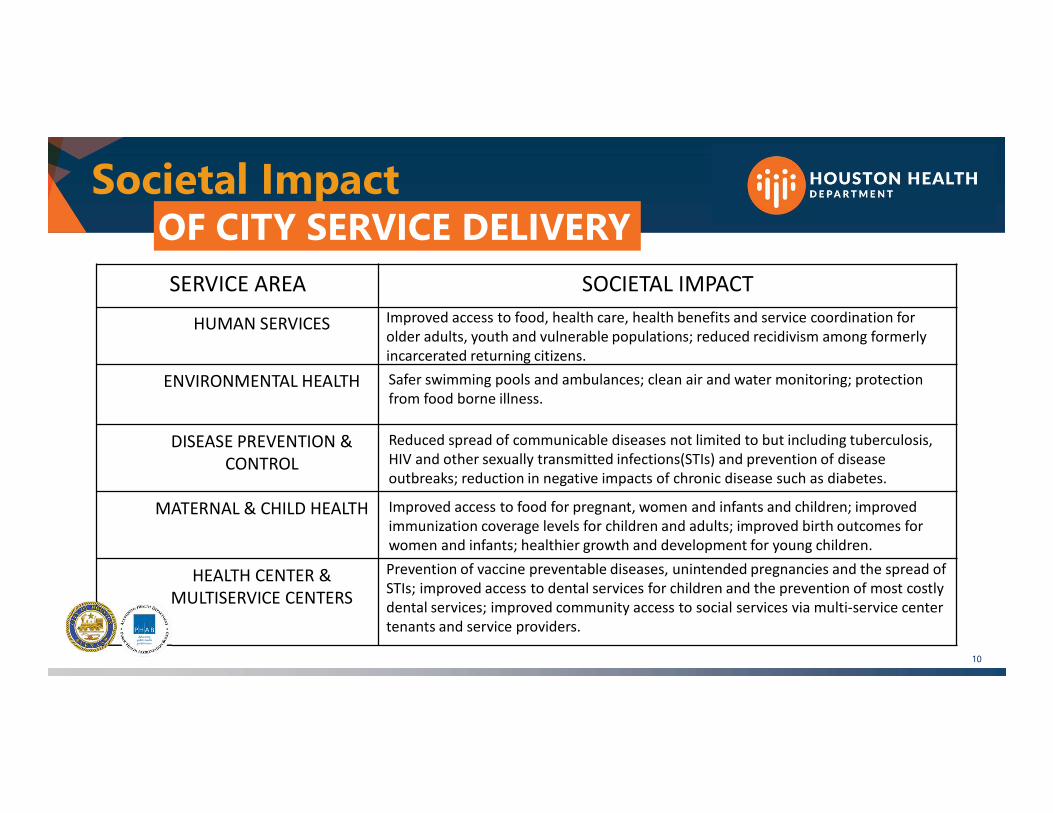
Societal ImpactOF CITY SERVICE DELIVERY
SERVICE AREA SOCIETAL IMPACT
HUMAN SERVICES Improved access to food, health care, health benefits and service coordination for older adults, youth and vulnerable populations; reduced recidivism among formerly incarcerated returning citizens.
ENVIRONMENTAL HEALTH Safer swimming pools and ambulances; clean air and water monitoring; protection from food borne illness.
DISEASE PREVENTION & CONTROL
Reduced spread of communicable diseases not limited to but including tuberculosis, HIV and other sexually transmitted infections(STIs) and prevention of disease outbreaks; reduction in negative impacts of chronic disease such as diabetes.
MATERNAL & CHILD HEALTH Improved access to food for pregnant, women and infants and children; improved immunization coverage levels for children and adults; improved birth outcomes for women and infants; healthier growth and development for young children.
HEALTH CENTER & MULTISERVICE CENTERS
Prevention of vaccine preventable diseases, unintended pregnancies and the spread of STIs; improved access to dental services for children and the prevention of most costly dental services; improved community access to social services via multi-service center tenants and service providers.

11
Anticipated GROWTH
• There is a rising # of adults 60 years and older in Houston/Harris County which will result in a greater demand for health and supportive services. By 2025 there will be 889,567 older adults, up from 736,463 in 2019. (Source: American Community Survey Population Projections. (www.census.gov)
• Rates of diabetes for 20-70 years old are rising*. (From 15.6% in 2017 to a projected 18% in 2025). (Source: Cities changing Diabetes (www.citieschangingdiabetes.com)
• Poverty continues to rise in certain areas of Houston/Harris County• 25% or 1 in 4 children live in poverty. (Source: Houston State of Health portal (www.houstonstateofhealth.com)
• In some zip codes, more than 1/3 of families are living below the poverty level (Source: Houston State of Health portal (www.houstonstateofhealth.com)
• 26.4% of persons under 65 years of age were without health insurance in 2017(Source: Houston State of Health portal (www.houstonstateofhealth.com)
12
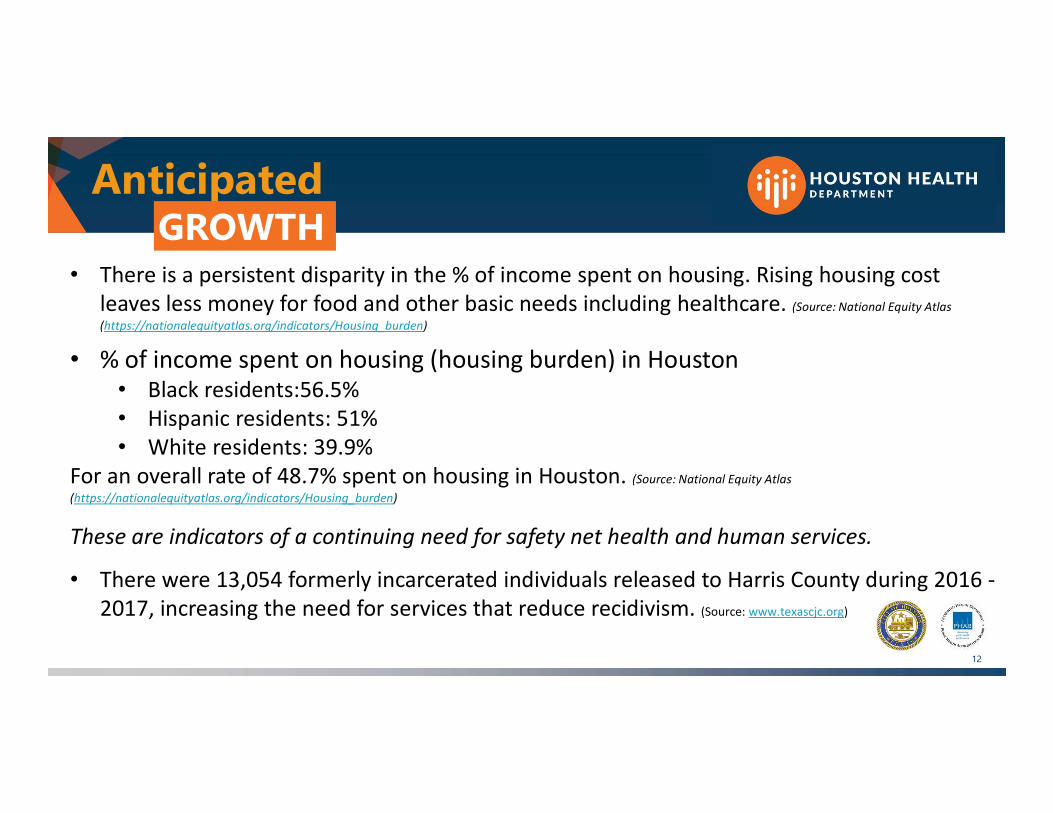
Anticipated GROWTH
• There is a persistent disparity in the % of income spent on housing. Rising housing cost leaves less money for food and other basic needs including healthcare. (Source: National Equity Atlas (https://nationalequityatlas.org/indicators/Housing_burden)
• % of income spent on housing (housing burden) in Houston• Black residents:56.5%• Hispanic residents: 51%• White residents: 39.9%
For an overall rate of 48.7% spent on housing in Houston. (Source: National Equity Atlas (https://nationalequityatlas.org/indicators/Housing_burden)
These are indicators of a continuing need for safety net health and human services.
• There were 13,054 formerly incarcerated individuals released to Harris County during 2016 -2017, increasing the need for services that reduce recidivism. (Source: www.texascjc.org)

13
Public Health INVESTIMENT FY20
$57.3 MillionGeneral Fund
HHD BUDGET HHD REVENUE
$34.9MILLION $22.4 Million
General Fund
NET INVESTMENT IN PUBLIC HEALTH

14
FY20 HHD Budget ALL FUNDS$ IN THOUSANDS
GENERAL FUND, $57,306, 36%
SPECIAL REVENUE FUNDS, $34,100, 21%
GRANT FUNDS, $69,600, …
GENERAL FUND REVENUE($22,372, 41%)
TOTAL BUDGET : $161, 006
NET INVESTMENT($34,934, 61%)

15
FY20 General Fund Budget ExpendituresNET CHANGE TO FY19 CURRENT BUDGET
FY19 CURRENT BUDGETOPERATING BUDGETRESTRICTED BUDGETJAIL HEALTH (delayed transfer)
FY19 CURRENT BUDGET
$42,574$14,862$1,555
$58,991
OPERATING BUDGET ADJUSTMENTSBUDGET REDUCTION INITIATIVESJAIL HEALTH REDUCTION
OPERATING BUDGET ADJUSTMENT% CHANGE FROM FY19 OPERATING BUDGET
($1,458)($1,555)
($3,013)(5.1%)
MANDATED ADJUSTMENTSHEALTH BENEFITS ACTIVE CIVILIANMUNICIPAL PENSIONHOPE CONTRACTUAL AGREEMENTRESTRICTED ACCOUNTSPROGRAM ADJUSTMENT
SUBTOTAL MANDATED INCREASES
($245)$187$679
$1,333($625)
$1,329
FY2020 PROPOSED BUDGETFY19 CURRENT BUDGETOPERATING BUDGET ADJUSTMENTSMANDATED ADJUSTMENTS
FY20 PROPOSED BUDGET% CHANGE FROM FY19 CURRENT BUDGET
$58,991($3,013)
$1,329$57,307
(2.9%)

5
Total RevenuesBY FUND $ IN THOUSANDS
FUNDFY18
REVENUEACTUAL
FY19 REVENUEBUDGET
FY19REVENUEESTIMATE
FY20 REVENUE
PROPOSED
VARIANCE FY20 PROP/ FY19 EST
+/- $% CHANGE
FUND 1000GENERAL FUND 31,130 23,392 23,256 22,372 (884) (3.8%)
FUND 2002HEALTH SPECIAL REVENUE 3,376 3,544 3,740 3,726 (14) (0.4%)
FUND 2008 LABORATORY 487 573 575 525 (50) (8.7%)FUND 2009
SWIMMING POOL SAFETY 1,161 1,161 1,253 1,279 26 2.1%
FUND 2010 ESSENTIAL PUBLIC HEALTH 24,406 15,632 13,911 13,016 (895) (6.4%)
FUND 2020COMMUNITY HEALTH
ASSESSMENT 0 0 50 240 190 N/AFUND 2423
SPECIAL WASTE 4,306 4,346 4,470 4,496 26 0.6%TOTAL 64,868 48,648 47,255 45,654 (1,602) (3.39%)

17
Revenue Highlights
FUND SIGNIFICANT CHANGES AND IMPACT
FUND 1000GENERAL FUND
$884K decrease in the General Fund with approximately $625K of the reduction as a result of the decrease in the 1115 Health Waiver Intergovernmental Transfer (IGT); and reduction of approximately $260K from Environmental Services. (In 2019, licenses and permits increased due to Hurricane Harvey) (Ref. page V-9, V-13)
FUND 2002HEALTH SPECIAL REVENUE
No Significant Budget Changes (Ref. page X-31)
FUND 2008 LABORATORY
No Significant Budget Changes (Ref. page X-37)
FUND 2009 SWIMMING POOL SAFETY No Significant Budget Changes (Ref. page X-49)
FUND 2010 ESSENTIAL PUBLIC HEALTH
The 6.4% reduction in allocation is due to the change in payment schedule and timing of payments. (Ref. page X-25)
FUND 2020COMMUNITY HEALTH
ASSESSMENTRevenue increase generated from the 340B Contract Pharmacy Program. (Ref. page XV-36)
FUND 2423 SPECIAL WASTE
No Significant Budget Changes (Ref. page X-43)
BY FUND $ IN THOUSANDS

5
Total Expenditures
FUNDFY18
EXPENDITURESACTUAL
FY19 EXPENDITURES
BUDGET
FY19EXPENDITURES
ESTIMATE
FY20 EXPENDITURES
PROPOSED
VARIANCE FY20 PROP/ FY19 BUD
+/- $% CHANGE
FUND 1000GENERAL FUND 66,275 58,991 58,645 57,306 (1,685) (2.9%)
FUND 2002HEALTH SPECIAL REVENUE 3,209 5,756 5,227 6,389 633 11%
FUND 2008 LABORATORY 411 569 540 569 0 0.0%FUND 2009
SWIMMING POOL SAFETY 1,228 1,685 1,554 1,475 (210) (12.5%)
FUND 2010 ESSENTIAL PUBLIC HEALTH 21,535 28,982 21,313 20,019 (8,963) (30.9%)
FUND 2020COMMUNITY HEALTH
ASSESSMENT 0 106 15 240 134 61.1%FUND 2423
SPECIAL WASTE 4,126 5,947 5,241 5,359 (588) (9.9%)TOTAL 96,848 99,863 92,535 91,358 (8,506) (8.5%)
BY FUND $ IN THOUSANDS

FUND SIGNIFICANT CHANGES AND IMPACT
FUND 1000GENERAL FUND
Reduction of $1,458,337 for departmental cuts. (Ref. page V-9)Increase due to mandated adjustments totaling approximately $1.3M.(Resulting in an overall reduction of 2.9%)
FUND 2002HEALTH SPECIAL REVENUE
Increases includes $210K to fund personnel transfers (4.8 FTEs) from the General Fund; approximating; $280K to fund a one-time vehicle and capital equipment purchases, and a $300K increase for the service contract with Veteran Affairs.Reduction includes approximately $160K in Other Services and Charges.(Resulting in an overall increase of 11%) (Ref. page X-31)
FUND 2008 LABORATORY No Significant Budget Changes (Ref. page X-37)
FUND 2009 SWIMMING POOL
SAFETYNo Significant Budget Changes (Ref. page X-49)
FUND 2010 ESSENTIAL PUBLIC HEALTH Elimination of 1115 Waiver programs and reduction in remaining programs. (Ref. page X-25)
FUND 2020COMMUNITY HEALTH
ASSESSMENTIncreased due to the expenses related to the 340B Contract Pharmacy Program. (Ref. page XV-36)
FUND 2423 SPECIAL WASTE
Reduction in the number of vehicles purchased; as well as minor changes to personnel to ensure accurate accounting of work performed across programs. (Ref. page X-43)
19
Expenditures HighlightsBY FUND $ IN THOUSANDS
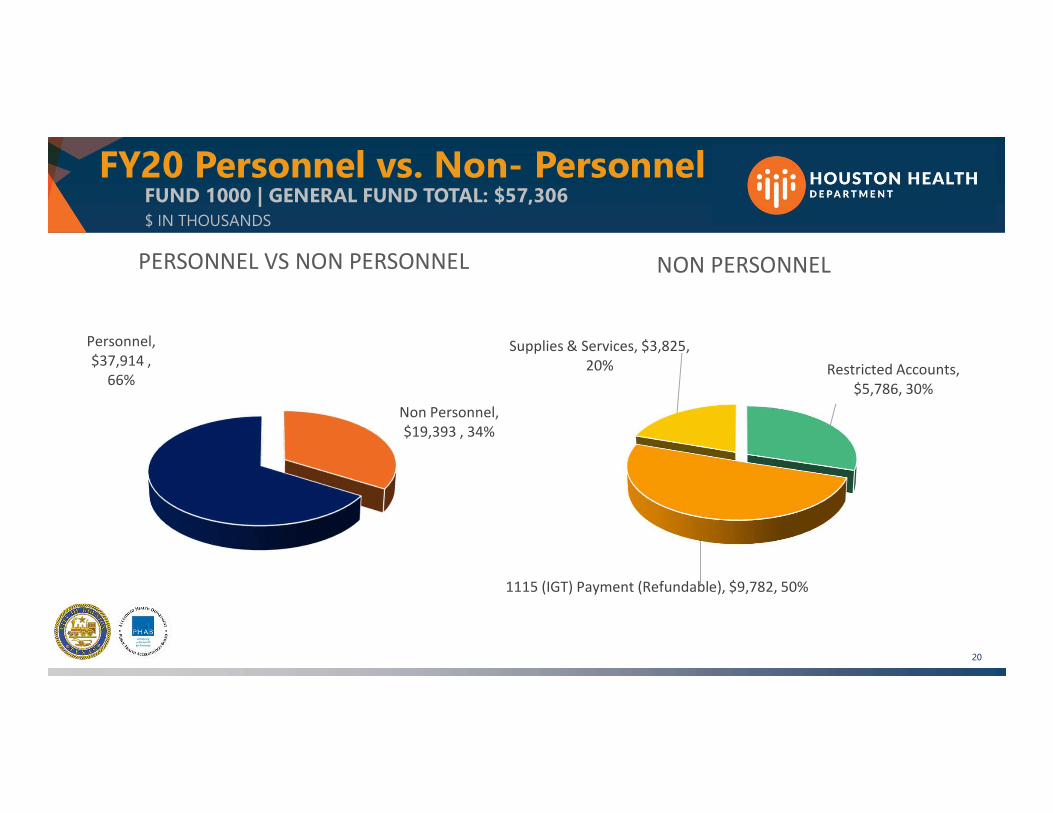
FY20 Personnel vs. Non- PersonnelFUND 1000 | GENERAL FUND TOTAL: $57,306 $ IN THOUSANDS
Non Personnel, $19,393 , 34%
Personnel, $37,914 ,
66%
PERSONNEL VS NON PERSONNEL
Restricted Accounts, $5,786, 30%
1115 (IGT) Payment (Refundable), $9,782, 50%
Supplies & Services, $3,825, 20%
NON PERSONNEL
20

FY20 Personnel vs. Non- PersonnelFUND 2002 | HEALTH SPECIAL TOTAL: $6,389 $ IN THOUSANDS
21
Non Personel,
$3,551 , 56%
Personnel, $2,837 , 44%
PERSONNEL VS NON PERSONNEL
Restricted Accounts, $113, 3%
Non Sub Recipients Contracts, $1,378, 39%
Other Supples & Services, $1,357, 38%
Equipment , $703, 20%
NON PERSONNEL

FY20 Personnel vs. Non- PersonnelFUND 2008 | LABORATORY TOTAL: $569 $ IN THOUSANDS
Personnel, $0 , 0%
Non Personel, $569 , 100%
PERSONNEL VS NON PERSONNELNon Sub Recipient
Contracts, $118 , 21%
Other Supplies , $47 , 8%
Other Services, $405 , 71%
NON PERSONNEL
22
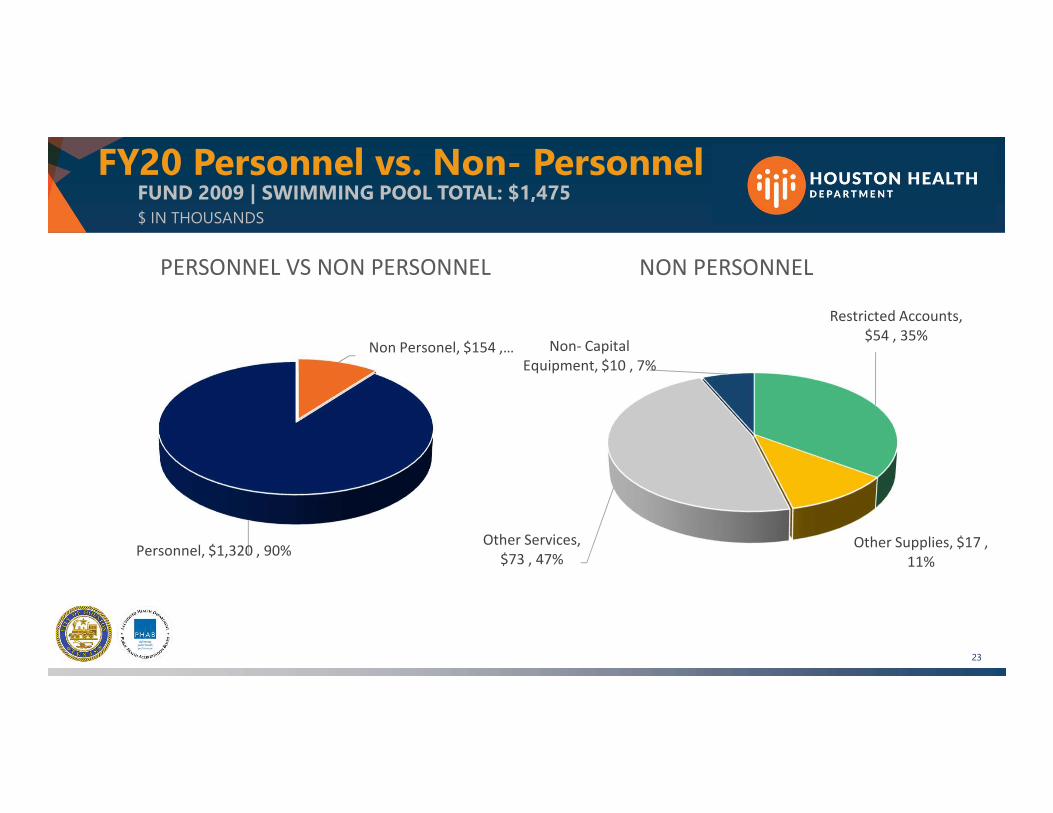
FY20 Personnel vs. Non- PersonnelFUND 2009 | SWIMMING POOL TOTAL: $1,475 $ IN THOUSANDS
Non Personel, $154 , …
Personnel, $1,320 , 90%
PERSONNEL VS NON PERSONNEL
Restricted Accounts, $54 , 35%
Other Supplies, $17 , 11%
Other Services, $73 , 47%
Non- Capital Equipment, $10 , 7%
NON PERSONNEL
23

FY20 Personnel vs. Non- PersonnelFUND 2010 | ESSENTIAL PUBLIC HEALTH TOTAL: $20,019 $ IN THOUSANDS
24
Personnel-Suppl GF, $6,195 , 31%
Personnel-1115 Waiver, $7,821 , 39%
Non Personnel-Suppl GF/R.A., $4,045 , 20%
Non Personnel-1115 Waiver, $1,959 , 10%
PERSONNEL VS NON PERSONNEL
Restricted Accounts, $774 , 13%
Supplement to GF, $3,271 , 54%
1115 Waiver Operations, $1,959 ,
33%
NON PERSONNEL

FY20 Personnel vs. Non- PersonnelFUND 2020 | COMMUNITY HEALTH ASSESSMENT: $240 $ IN THOUSANDS
25
Personnel, $0 , 0%
Non Personnel, $240 , 100%
PERSONNEL VS NON PERSONNEL
Drug/Medical, $240 , 100%
NON PERSONNEL

FY20 Personnel vs. Non- PersonnelFUND 2423 | SPECIAL WASTE TOTAL: $5,359 $ IN THOUSANDS
Non Personel, $470 , 9%
Personnel, $4,889 , 91%
PERSONNEL VS NON PERSONNEL
Restricted Accounts, $178 , 38%
Supplies, $96 , 20%
Services, $169 , 36%
Non Capital Equipment, $27 , 6%
NON PERSONNEL
26

Functional Org. ChartDIRECTOR
PUBLIC HEALTH AUTHORITY
ADMINISTRATION
$22M – 42.3FTEs
Budget & FinanceGrants
Facilities & FleetContracts
Procurement1115 IGT Payment
HRDepartment-Wide Charges
DIRECTOR’S OFFICE
$1.0M – 4.5FTEsAdministrative Support
Special Initiatives
PUBLIC AFFAIRS
$0.5M – 5FTEsPublic Information
Council Liaison Websites
Graphic DesignSocial Media
INFORMATION TECHNOLOGY
$2.6M – 16.1FTEsApplication Development
Desktop SupportOperations
Communications
HUMAN SERVICES
$9.6M – 95.2FTEs
Aging and Disability ServicesCare CoordinationBehavioral HealthAdolescent Health
My Brother’s Keeper
ENVIRONMENTAL HEALTH
$16.5M – 152.6FTEsFood Safety
Air/Water QualityIndoor Air Quality
Non-Smoking OrdinanceLead Hazards
Ambulance PermitsSwimming PoolsSpecial WasteVital Statistics
DISEASE PREVENTION & CONTROL
$8.2M – 78.9FTEsHIV/STD
TB/Hansen’s DiseaseInformaticsSurveillanceLaboratory
PreparednessChronic Disease
DAWN
MATERNAL &CHILD HEALTH
$1.4M – 12.8FTEsImmunizations
Women, Infant & Children
Nurse Family PartnershipHealthy Families
HEALTH & MSC
$19.9M – 187.4FTEsHealth Centers
PharmacyMSC Programming
Client AccessTitle X
Oral HealthVision
*$ and FTEs includes General Fund and Special Revenue only. Grants are excluded. Total FTE shown is 664.1 FTE (388.8 General Fund and 275.3 Special Fund)

5
FY20 BudgetREDUCTIONS
PROGRAM NAME DESCRIPTION FTE AMOUNT CONSEQUENCES
ADMINISTRATIVE SERVICES
DEPARTMENT
Reduction of Deputy Assistant Director Positions 2.0 $333,126 Increase workload for remaining
staff.
ORAL HEALTH Reduction of Dental Assistants and a Sr. Public Health Dentist, DDS 14.0 $915,147
30% Reduction in Patient Encounters
35% Reduction in Project Saving Smiles and Outreach
CONSUMER HEALTH
Reduction of Sanitarians and a Chief Sanitarian
(These positions have been transferred to Special Revenue Fund 2002)
4.8 $210,064 Increased expenditures in Fund 2002.
TOTAL 20.8 $ 1,458,337

FY20 BudgetCONCLUSION
• Since 2011, over $21M reduction in General Fund• Special Revenue Funds used to minimize the impact• 1115 Waiver services eliminated or decreased
• Overdependence on federal government for core public health activities
• Special revenue funds spend rate is too high• Some special revenue funds will be depleted in the next few years• 1115 Waiver funding is uncertain
• HIV Service Linkage• Fall Prevention• ETHAN• Sobering Center
• Colorectal Cancer screenings• Care Transitions for Seniors• Integrated Care for the Homeless (Dec 2019)

Thank you!
APPENDIX
01|DEMOGRAPHICS RACE/ETHNICITY
DEMOGRAPHICS GENDER
ACHIEVEMENTS
02|03|04|
PERFORMANCE MEASURES
31
32
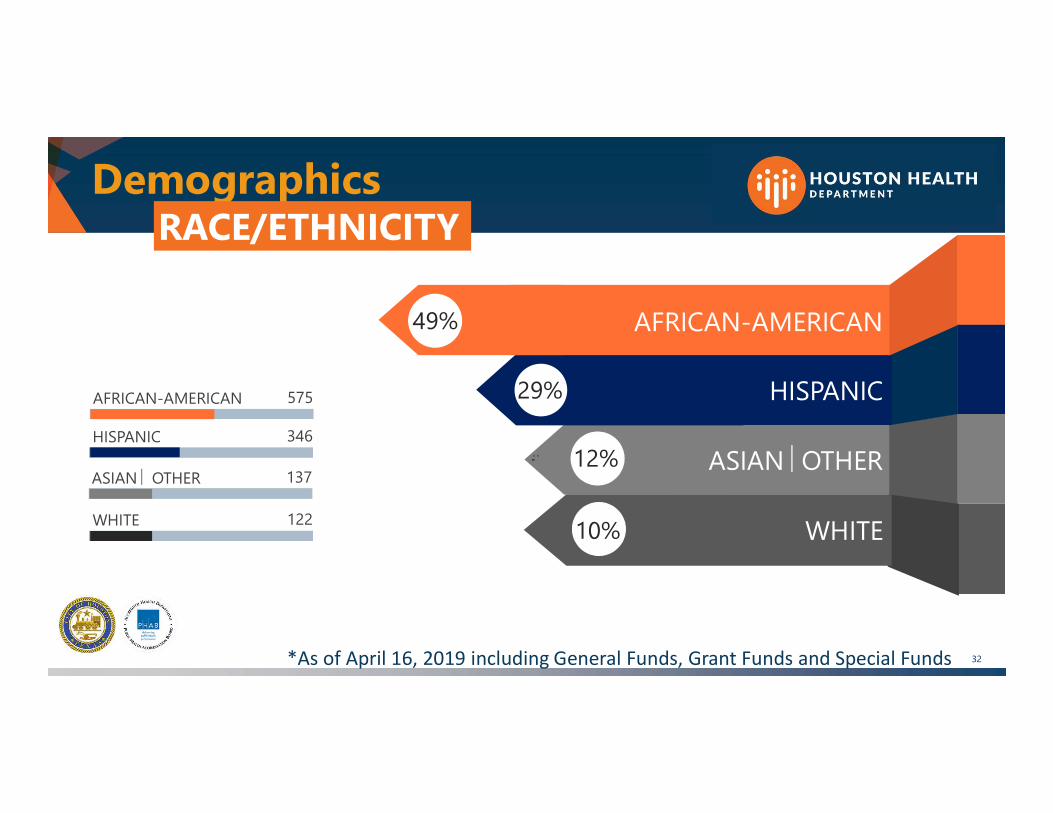
Demographics RACE/ETHNICITY
WHITE
ASIAN OTHER
HISPANIC
AFRICAN-AMERICAN
AFRICAN-AMERICAN 575
49%
29%
12%
10%
HISPANIC 346
WHITE 122
ASIAN OTHER 137
*As of April 16, 2019 including General Funds, Grant Funds and Special Funds

Demographics GENGER
33
FEMALE 859
MALE 321
73%
27%
*As of April 16, 2019 including General Funds, Grant Funds and Special Funds

Budget HistoryGENERAL FUND 1000
34
Expenditure Budget FY15 FY16 FY17 FY18 FY19 FY20
Current Budget Expenditure 60,132 61,441 65,692 66,349 58,991 57,306
Actual / Projection 59,549 61,248 65,631 66,275 58,991 57,306
Surplus/Deficit 583 193 61 74 0 0
Revenue Budget FY15 FY16 FY17 FY18 FY19 FY20
Current Budget 22,466 26,893 31,456 32,352 23,392 22,372
Actual / Projection 25,723 27,625 31,694 31,130 23,256 22,372
Surplus/Deficit 3,257 732 238 (1,222) (136) 0

Budget HistoryHEALTH SPECIAL REVENUE FUND 2002
Expenditure Budget FY15 FY16 FY17 FY18 FY19 FY20
Current Budget 3,796 4,191 5,131 5,805 5,757 6,389
Actual / Projection 3,019 2,758 3,420 3,210 5,227 6,389
Surplus/Deficit777 1,433 1,711 2,595 530
Revenue Budget FY15 FY16 FY17 FY18 FY19 FY20
Current Budget 2,916 3,011 4,023 4,081 3,544 3,726
Actual / Projection 2,869 3,191 3,672 3,376 3,740 3,726
Surplus/Deficit -47 180 -351 -705 196
35
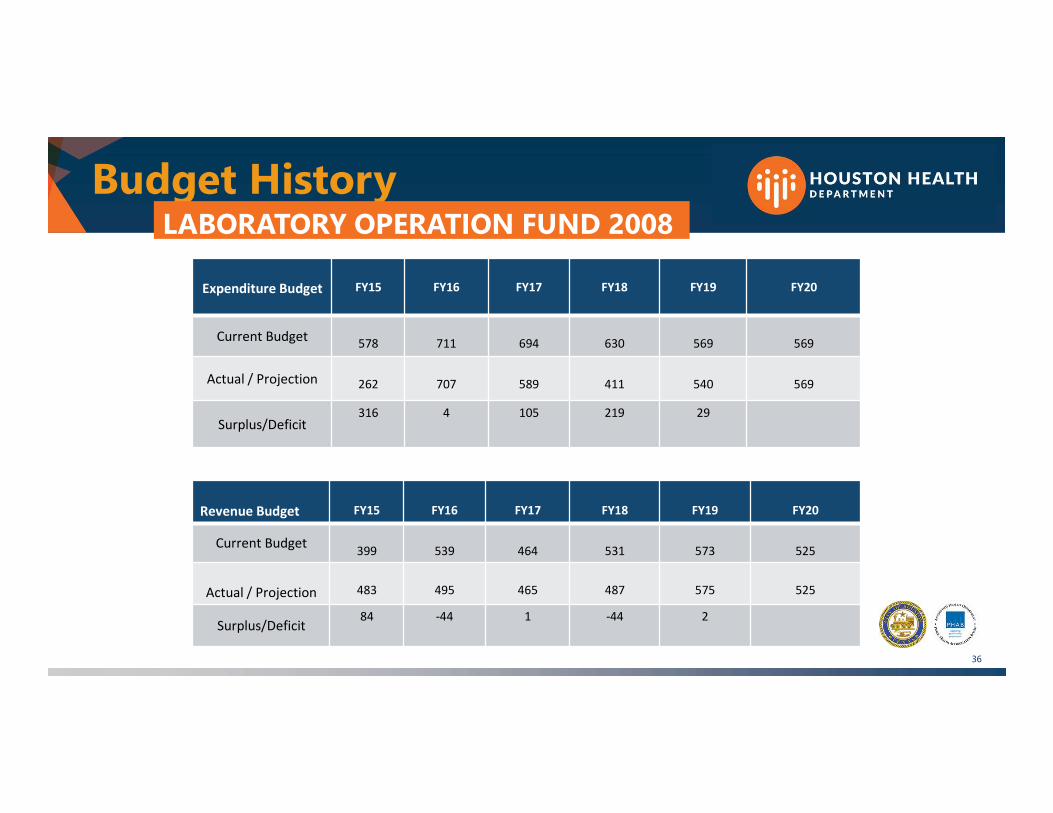
Budget HistoryLABORATORY OPERATION FUND 2008
Expenditure Budget FY15 FY16 FY17 FY18 FY19 FY20
Current Budget 578 711 694 630 569 569
Actual / Projection 262 707 589 411 540 569
Surplus/Deficit316 4 105 219 29
Revenue Budget FY15 FY16 FY17 FY18 FY19 FY20
Current Budget 399 539 464 531 573 525
Actual / Projection 483 495 465 487 575 525
Surplus/Deficit84 -44 1 -44 2
36

Budget HistorySWIMMING POOL SAFETY FUND 2009
Expenditure Budget
FY15 FY16 FY17 FY18 FY19 FY20
Current Budget 1,159 1,223 1,203 1,298 1,685 1,475
Actual / Projection 978 1,105 1,160 1,228 1,554 1,475
Surplus/Deficit181 118 43 70 131
Revenue Budget FY15 FY16 FY17 FY18 FY19 FY20
Current Budget1,053 1,191 1,225 1,118 1,161 1,278
Actual / Projection1,073 1,133 1,098 1,161 1,253 1,278
Surplus/Deficit20 -58 -127 43 92
37

Budget HistoryESSENTIAL PUBLIC HEALTH SERVICES FUND 2010
Expenditure Budget FY15 FY16 FY17 FY18 FY19 FY20
Current Budget 17,458 21,398 26,109 29,149 28,982 20,019
Actual / Projection 12,661 18,192 21,111 21,536 21,313 20,019
Surplus/Deficit4,797 3,206 4,998 7,613 7,669
Revenue Budget FY15 FY16 FY17 FY18 FY19 FY20
Current Budget14,299 19,473 24,694 25,447 15,632 13,016
Actual / Projection17,620 17,231 22,407 24,406 13,911 13,016
Surplus/Deficit3,321 -2,242 -2,287 -1,041 -1,721
38

Budget HistorySPECIAL WASTE FUND 2423
Expenditure Budget FY15 FY16 FY17 FY18 FY19 FY20
Current Budget 5,139 5,350 4,604 4,298 5,947 5,359
Actual / Projection 3,548 4,405 3,972 4,126 5,241 5,359
Surplus/Deficit 1,591 945 632 172 706 0
Revenue Budget FY15 FY16 FY17 FY18 FY19 FY20
Current Budget 2,758 2,809 4,079 4,137 4,346 4,496
Actual / Projection 2,790 3,998 4,088 4,306 4,470 4,496
Surplus/Deficit 32 1,189 9 169 124 0
39

Service ImpactsDUE TO REDUCTIONS
• Decrease in the numbers of clients serviced in health centers • Lack of internal resources contributes to the inability to maximize
reimbursement opportunities.• Recruitment and retention challenges, due difficulty in supporting market
adjustments and competitive hiring practices• Decrease in value added information technology support, affecting real
time data exchange. • Delay in follow up on disease investigations and linkage to treatment cause
potential increase in transmission.• Longer client wait times and next appointment availability, affecting our
ability to generate revenue per funding agreements• Internal Employee Health Services (services provided) causing delinquent
40
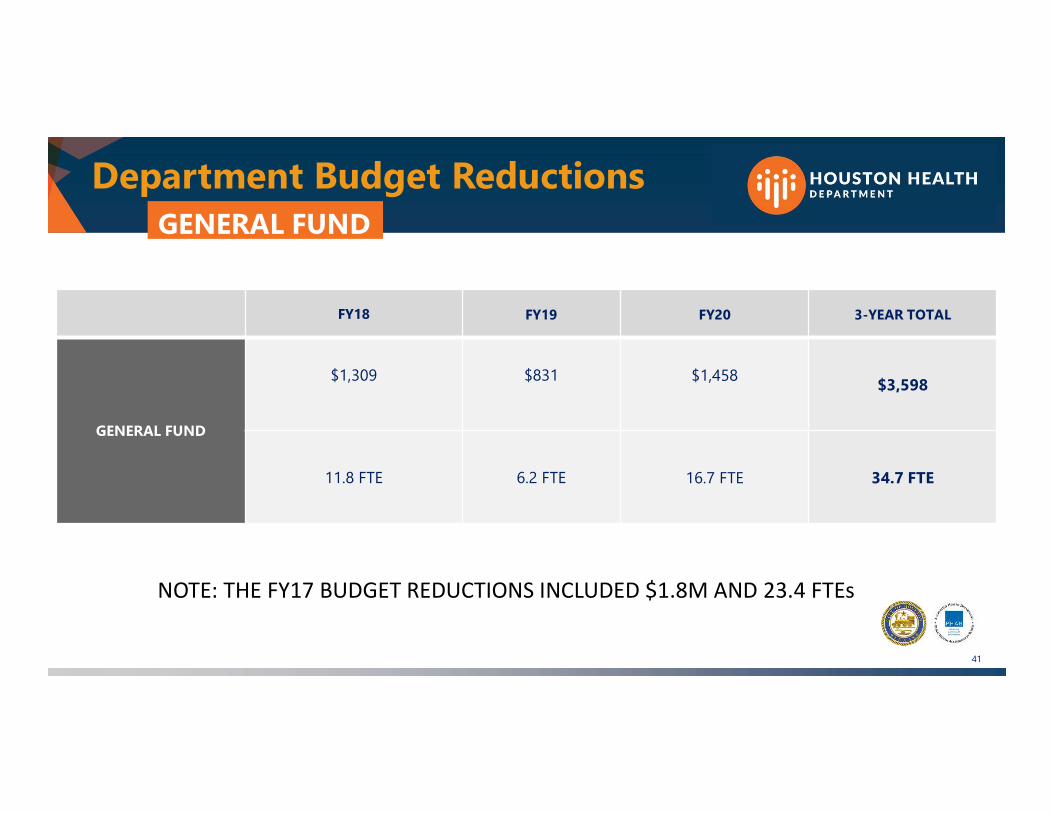
Department Budget ReductionsGENERAL FUND
FY18 FY19 FY20 3-YEAR TOTAL
GENERAL FUND
$1,309 $831 $1,458 $3,598
11.8 FTE 6.2 FTE 16.7 FTE 34.7 FTE
NOTE: THE FY17 BUDGET REDUCTIONS INCLUDED $1.8M AND 23.4 FTEs
41

Customer MeasuresGENERAL FUND
FUND MEASURE PRIORITY FY18 ACTUAL FY19 BUDGET FY19 ESTIMATE FY20 PROJECTED BUDGET
FUND 1000GENERAL FUND
FOOD ESTABLISHMENT
COMPLAINTSPublic Safety 2,402 2,683 2,805 2,610
FUND 1000GENERAL FUND
JAIL HEALTH ENCOUNTERS Public Safety 80,956 N/A 84,231 N/A
FUND 1000 GENERAL FUND
PRIORITY DISEASE INVESTIGATIONS
INITIATED WITHIN 24 HOURS
Public Safety99% 100% 99% 100%

Customer MeasuresGENERAL FUND
FUND MEASURE PRIORITY FY18 ACTUAL FY19 BUDGET FY19 ESTIMATEFY20
PROJECTED BUDGET
FUND 1000GENERAL FUND
Clients with Medical Home (Healthy Families) Public Safety 98% 95% 99% 95%
FUND 1000GENERAL FUND
Emergency Preparedness/ BT/BW Tests Performed Public Safety 123,835 115,000 118,425 115,000
FUND 1000GENERAL Family Planning Clinic Encounters Public Safety 8,449 8,500 9,156 8,500
FUND 1000GENERAL Safety Net Dental Encounters Public Safety 9,000 9,000 9,216 9,000
FUND 1000GENERAL STD Clinic Encounters Public Safety 19,054 17,000 20,303 17,000
FUND 1000GENERAL
Student Vision Program Participants Education 11,000 10,000 11,640 10,000

Business Process MeasuresGENERAL FUND
FUND MEASURE PRIORITY FY18 ACTUAL FY19 BUDGET FY19 ESTIMATE FY20 PROJECTED BUDGET
FUND 1000GENERAL FUND
Air Quality Inspections within 24 Hours of Complaint
Public Safety 96% 100% 90% 100%
FUND 1000GENERAL FUND
Air, Water and WasteInvestigations
Public Safety 3,106 3,002 2,741 3,000
FUND 1000GENERAL FUND Clean River Sites Monitored Public
Safety 1, 234 1,197 1,228 1,197
FUND 1000 GENERAL FUND Food Facility Inspections Public
Safety 37,175 33,020 36,751 33,242
FUND 1000GENERAL FUND
Food Facility Inspections Completed on Time
Public Safety 95% 95% 100% 95%
FUND 1000GENERAL FUND
Home Delivery and Congregate Meals Served
Public Safety 1,380,663 1,400,000 1,362,251 1,400,000
FUND 1000GENERAL FUND Laboratory Tests Performed Public
Safety 355,559 350,000 356,000 350,000

Business Process MeasuresGENERAL FUND
FUND MEASURE PRIORITY FY18ACTUAL
FY19 BUDGET
FY19 ESTIMATE
FY20 PROJECTED
BUDGET
FUND 1000GENERAL FUND
Revenues Projected Budget vs Actual Utilization
Sound Fiscal Management
96.2% 100% 99.4% 100%
FUND 1000GENERAL FUND
Expenditures Projected Budget vs Actual Utilization
Sound Fiscal Management
99.9% 100% 100% 100%

Public Health in Houston
15,307 STD clinic visits
1,167 Tuberculosis clinic visits
22,270 Tuberculosis medication doses
9,618 Immunization clinic visits
41,980 Disease investigations
PROTECTING THECOMMUNITY FROMINFECTIOUS DISEASE
46
Public Health in Houston 47
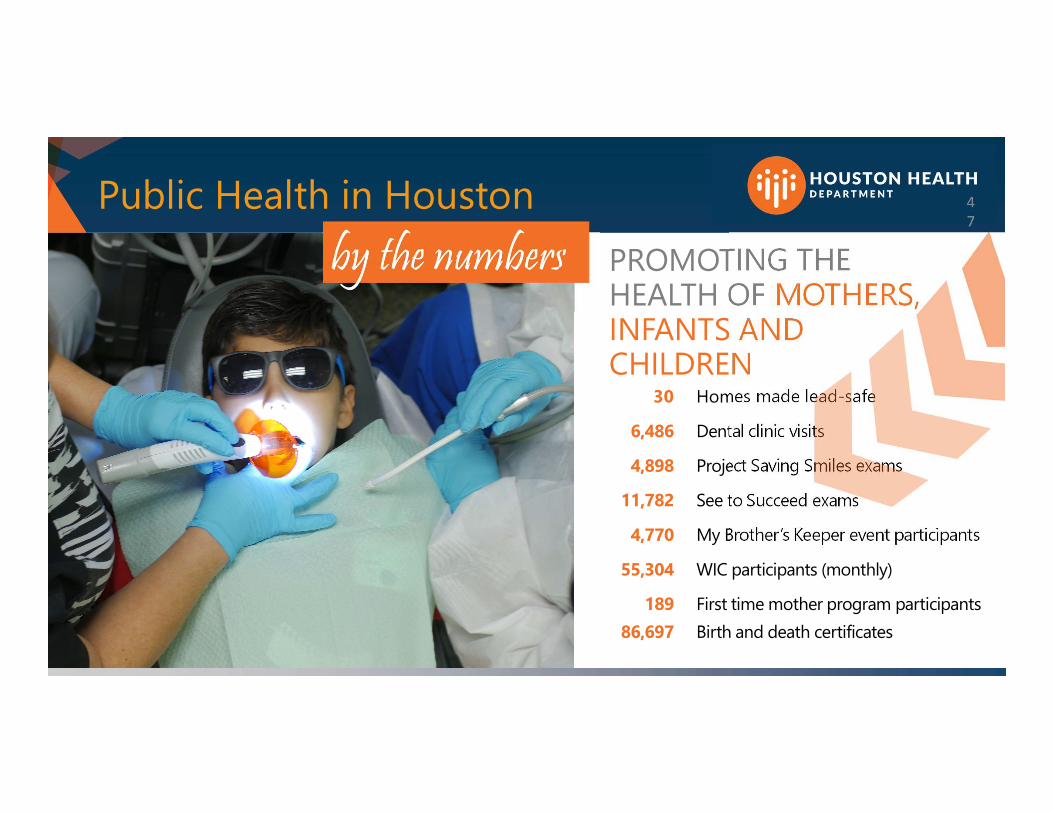
30 Homes made lead-safe
6,486 Dental clinic visits
4,898 Project Saving Smiles exams
11,782 See to Succeed exams
4,770 My Brother’s Keeper event participants
55,304 WIC participants (monthly)
189 First time mother program participants86,697 Birth and death certificates
PROMOTING THE HEALTH OF MOTHERS, INFANTS AND CHILDREN

Public Health in Houston 48
32,989 Client Access screenings
3,410 Care Coordination Clients
6,854 Family Planning visits
53,285 Jail Health medial visits
INCREASING ACCESS TO CARE

Public Health in Houston 49
737,364 Multi-service center visits10,780 Service linkage visits
1,0160,372 Senior congregate meals22,824 Senior information calls
4,047 Senior case management clients162 Re-entry program participants
PROMOTING WELL-BEING THROUGH HUMAN SERVICES
Public Health in Houston 50
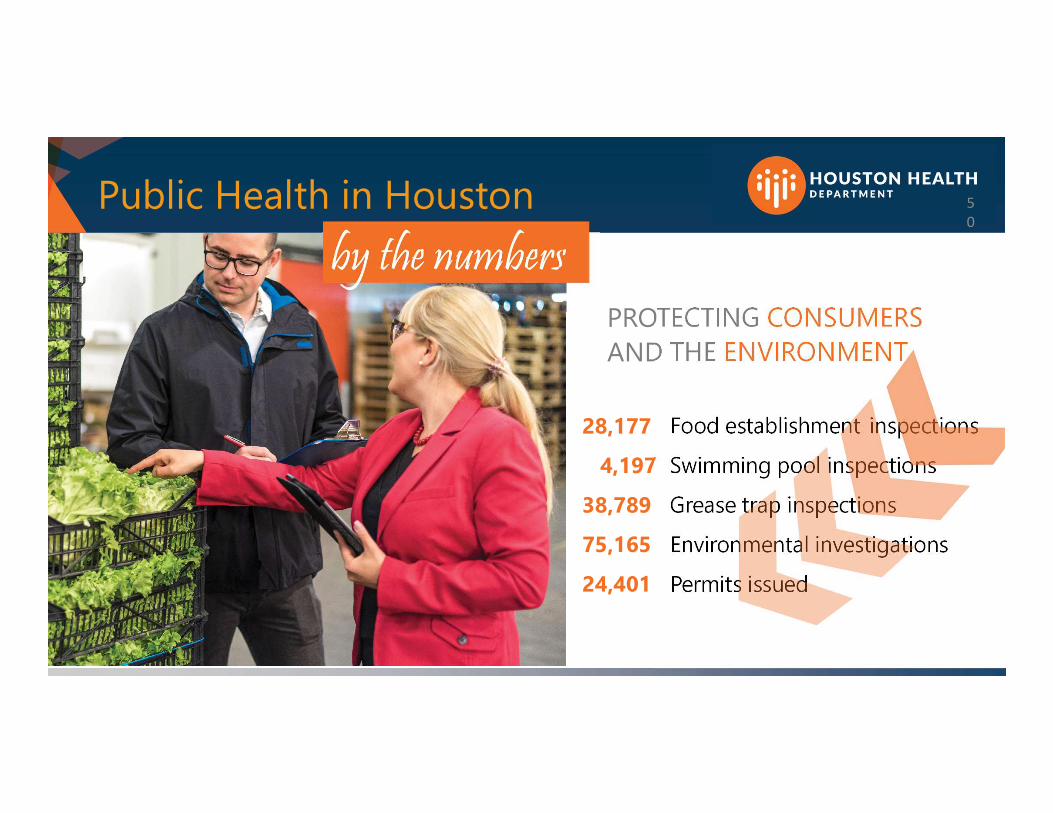
28,177 Food establishment inspections
4,197 Swimming pool inspections
38,789 Grease trap inspections
75,165 Environmental investigations
24,401 Permits issued
PROTECTING CONSUMERSAND THE ENVIRONMENT
Public Health in Houston 51
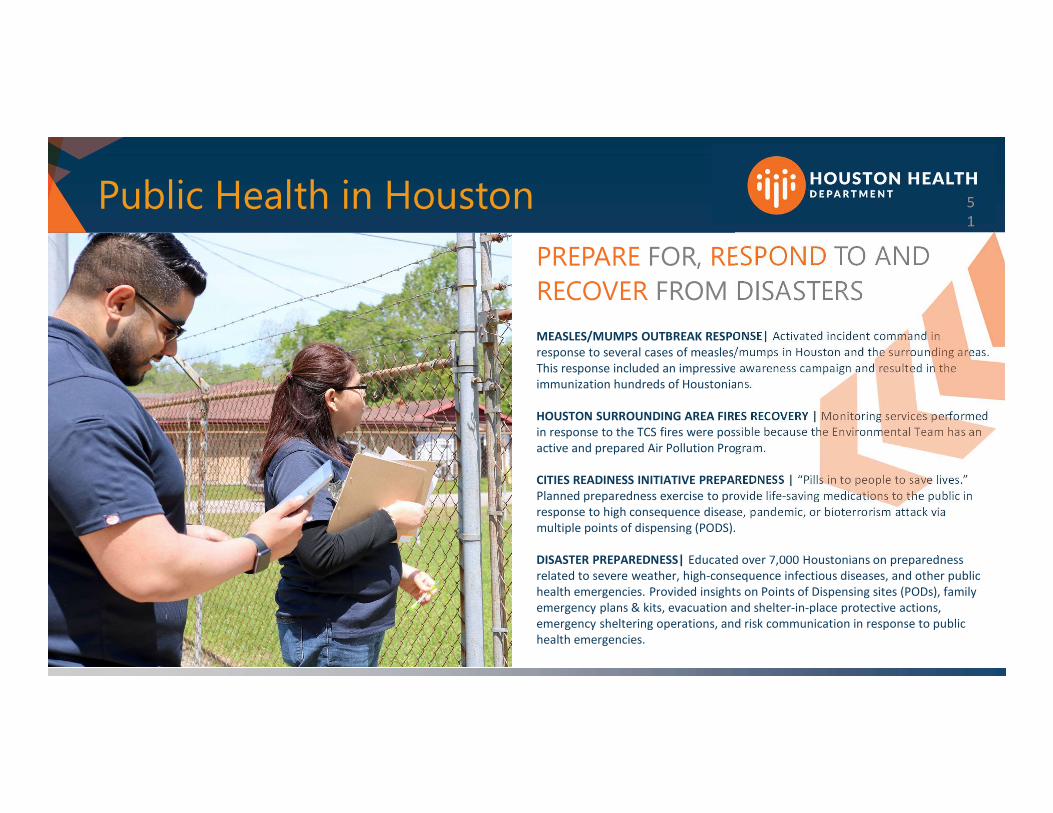
MEASLES/MUMPS OUTBREAK RESPONSE| Activated incident command in response to several cases of measles/mumps in Houston and the surrounding areas. This response included an impressive awareness campaign and resulted in the immunization hundreds of Houstonians.
HOUSTON SURROUNDING AREA FIRES RECOVERY | Monitoring services performed in response to the TCS fires were possible because the Environmental Team has an active and prepared Air Pollution Program.
CITIES READINESS INITIATIVE PREPAREDNESS | “Pills in to people to save lives.” Planned preparedness exercise to provide life-saving medications to the public in response to high consequence disease, pandemic, or bioterrorism attack via multiple points of dispensing (PODS).
DISASTER PREPAREDNESS| Educated over 7,000 Houstonians on preparedness related to severe weather, high-consequence infectious diseases, and other public health emergencies. Provided insights on Points of Dispensing sites (PODs), family emergency plans & kits, evacuation and shelter-in-place protective actions, emergency sheltering operations, and risk communication in response to public health emergencies.
PREPARE FOR, RESPOND TO AND RECOVER FROM DISASTERS
Public Health in Houston 52
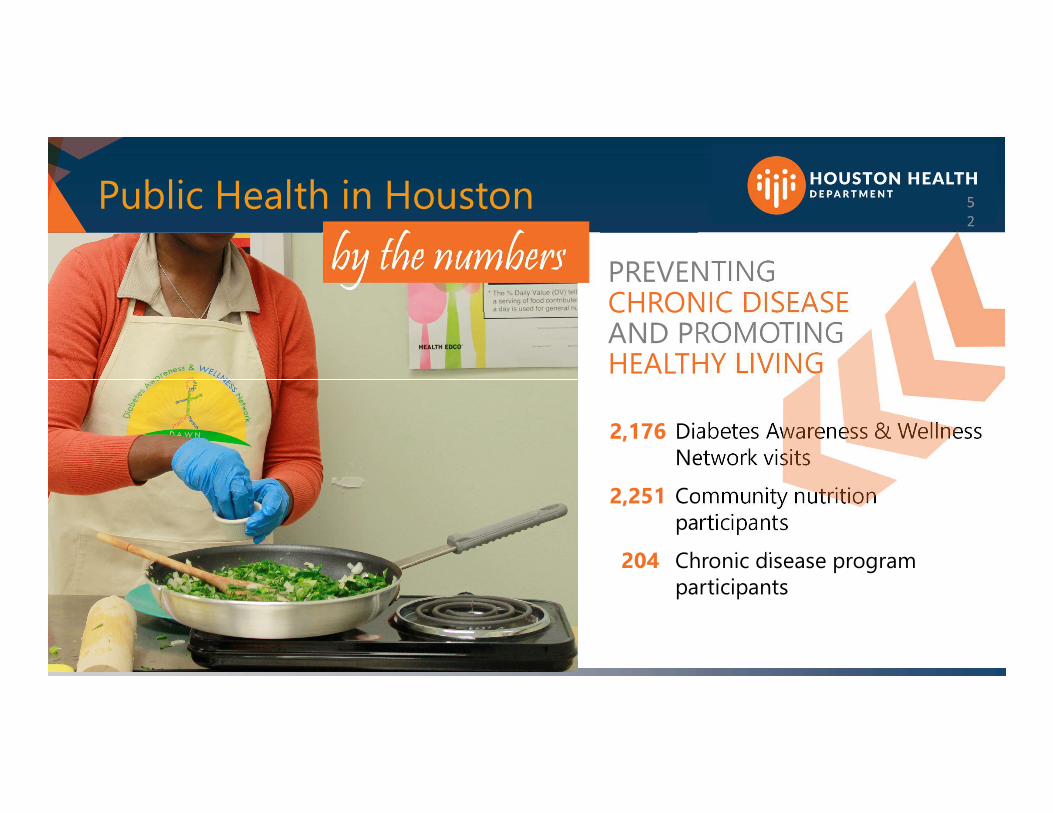
2,176 Diabetes Awareness & Wellness Network visits
2,251 Community nutrition participants
204 Chronic disease program participants
PREVENTING CHRONIC DISEASE AND PROMOTING HEALTHY LIVING

Thank you!
![Richmond - Petition - Rev 6.9...´5LFKPRQGµ 5DP &DSLWDO )XQGLQJ //& ´5DPµ 9LFHUR\ &DSLWDO )XQGLQJ ,QF ´9LFHUR\µ 5REHUW *LDUGLQD -RQDWKDQ %UDXQ 7]YL ´6WHYHµ 5HLFK DQG 0LFKHOOH](https://static.fdocuments.in/doc/165x107/60ebf2cd0320f8219e092164/richmond-petition-rev-69-5lfkprqg-5dp-dslwdo-xqglqj-5dp.jpg)