Fall Budget Forum Projected Fiscal Year 05/06 Budget Fiscal Year 06/07 September 12, 2006.

BUDGET PRESENTATIONFiscal Year 2014
February 2013
DRAFT February 7, 2013
2
Contents
[Updated on: 02/06/2013]
FY13 Accomplishments 3
SPT Consolidated Results 5
SPT Networks 15
U.S. Distribution 19
U.S. Advertising Sales 24
International Distribution 28
International Production 36
U.S. Production 40
Risks & Opportunities 51
Appendix 53
3
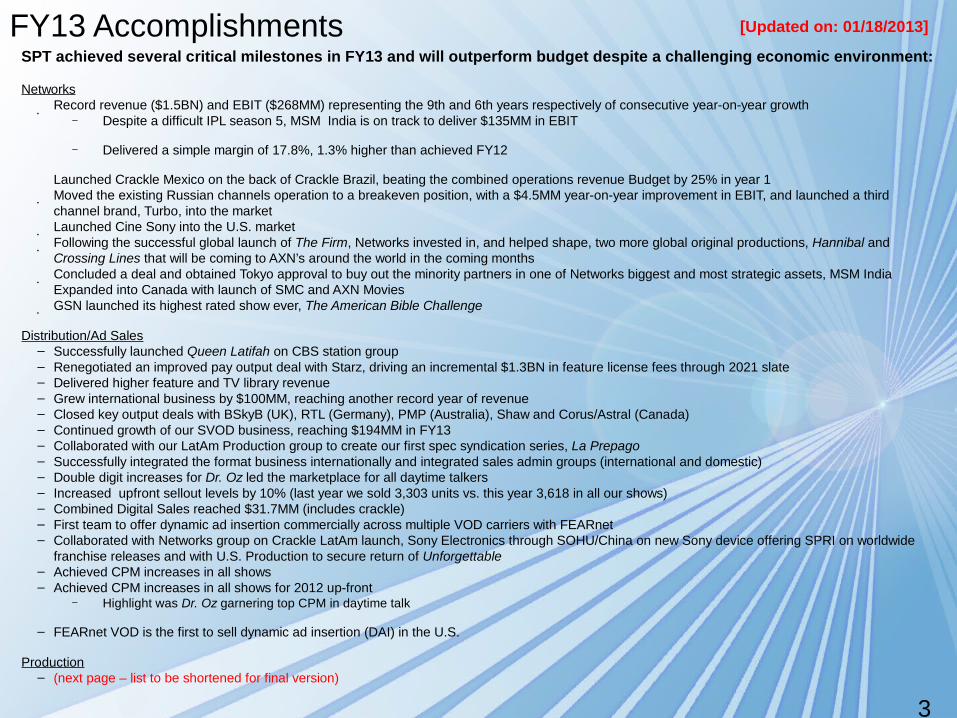
SPT achieved several critical milestones in FY13 and will outperform budget despite a challenging economic environment:
NetworksRecord revenue ($1.5BN) and EBIT ($268MM) representing the 9th and 6th years respectively of consecutive year-on-year growth
– Despite a difficult IPL season 5, MSM India is on track to deliver $135MM in EBIT
– Delivered a simple margin of 17.8%, 1.3% higher than achieved FY12
Launched Crackle Mexico on the back of Crackle Brazil, beating the combined operations revenue Budget by 25% in year 1Moved the existing Russian channels operation to a breakeven position, with a $4.5MM year-on-year improvement in EBIT, and launched a third channel brand, Turbo, into the marketLaunched Cine Sony into the U.S. marketFollowing the successful global launch of The Firm, Networks invested in, and helped shape, two more global original productions, Hannibal and Crossing Lines that will be coming to AXN’s around the world in the coming monthsConcluded a deal and obtained Tokyo approval to buy out the minority partners in one of Networks biggest and most strategic assets, MSM IndiaExpanded into Canada with launch of SMC and AXN MoviesGSN launched its highest rated show ever, The American Bible Challenge
Distribution/Ad Sales– Successfully launched Queen Latifah on CBS station group– Renegotiated an improved pay output deal with Starz, driving an incremental $1.3BN in feature license fees through 2021 slate– Delivered higher feature and TV library revenue– Grew international business by $100MM, reaching another record year of revenue– Closed key output deals with BSkyB (UK), RTL (Germany), PMP (Australia), Shaw and Corus/Astral (Canada)– Continued growth of our SVOD business, reaching $194MM in FY13– Collaborated with our LatAm Production group to create our first spec syndication series, La Prepago– Successfully integrated the format business internationally and integrated sales admin groups (international and domestic)– Double digit increases for Dr. Oz led the marketplace for all daytime talkers – Increased upfront sellout levels by 10% (last year we sold 3,303 units vs. this year 3,618 in all our shows)– Combined Digital Sales reached $31.7MM (includes crackle)– First team to offer dynamic ad insertion commercially across multiple VOD carriers with FEARnet– Collaborated with Networks group on Crackle LatAm launch, Sony Electronics through SOHU/China on new Sony device offering SPRI on worldwide
franchise releases and with U.S. Production to secure return of Unforgettable– Achieved CPM increases in all shows – Achieved CPM increases in all shows for 2012 up-front
– Highlight was Dr. Oz garnering top CPM in daytime talk
– FEARnet VOD is the first to sell dynamic ad insertion (DAI) in the U.S.
Production– (next page – list to be shortened for final version)
FY13 Accomplishments [Updated on: 01/18/2013]

4
FY13 Accomplishments (continued- 2 pages for now; to be
shortened)
[Updated on: 01/31/2013]
Production–Breaking Bad surpasses $100MM profitability mark and continues to grow in ratings and revenue into 6th and final season–SPT is the only studio have both comedy and drama pilot orders at each of the 4 major broadcast networks for the 13-14 season–Received one of two new series orders for Masters of Sex at Showtime despite limited shelf space. Premiering after Homeland in
2013–Justified season 4 had an industry leading 25% ratings growth helping support a 60% increase in EST transactions–SPT had key syndication sales for Community, Rules of Engagement and Justified all sold in multiple platforms–SPT produced the #1 non-sports telecast ever on cable, Hatfields & McCoys with DVD and SVOD sales far exceeding original sales
estimates–SPT's non-scripted hit series Shark Tank on ABC soared to new ratings highs to become Friday night's #1 show
– Worked closely with international sales to continue Unforgettable resulting in record breaking ratings on for France’s TF1 and demonstrating strength worldwide–SPT series and MOWs continue to be recognized for excellence with 16 Emmy and 5 Golden Globe nominations–Wheel of Fortune and Jeopardy! renewed through the 15/16 season
– Int’l Prod TBC with Andrea – Built strong Senior Management Team and created culture of transparency, accountability and proactivity– Int’l Prod TBC with Andrea – Established creative and business collaboration across divisions and countries– Int’l Prod TBC with Andrea – Expanded and strengthened global network of production companies– Int’l Prod TBC with Andrea – Identified acquisition targets for FY14
5
SPT Consolidated Results
[Updated on: 1/18/2012]

6
Gross Revenue Generated by SPT for All Product(figures in millions)
[Updated on: 02/05/2012]
FY13Budget
FY13Forecast
FY14MRP
FY14Budget
0
1000
2000
3000
4000
5000
6000
7000
53485090
59055718

7
Gross Revenue Generated by SPT For All Product(figures in millions)
[Updated on: 02/05/2013]
FY13 FY13 vs FY14 Generated Revenue Budget Q4 Forecast Variance MRP* Budget Variance Variance U.S. Distribution 749 797 48 778 716 (62) (81) Int'l Distribution 1,600 1,665 65 1,712 1,734 22 69 Int'l Production 204 173 (31) 377 321 (56) 148 U.S. Production & Ad Sales 1,120 964 (156) 1,077 1,019 (58) 55 Networks 1,675 1,491 (184) 1,961 1,928 (33) 437
Total 5,348 5,090 (258) 5,905 5,718 (187) 628
*FY14 MRP restated to reflect transfer of Crackle Ad Sales to Networks
FY14

8
SPT Financial Summary(figures in millions)
TV Product/Network Revenue from All Sources
EBIT
Note: EBIT excludes 3Net EBIT of ($8MM )in FY13 Budget and ($5MM) in FY13 forecast , FY14 MRP and FY14 Budget
[Updated on: 02/06/2013]
FY13Budget
FY13Forecast
FY14MRP
FY14Budget
0
500
1000
1500
2000
2500
3000
3500
4000
4500
5000
38233525
4365 4283
FY13Budget
FY13Forecast
FY14MRP
FY14Budget
0
100
200
300
400
500
600
700
553 558625
11 12
0564 570
625600
EBIT Shine Monetization
Total

9
SPT Financial Summary(figures in millions)
[Updated on: 02/06/2013]
FY13 FY13 vs FY14 TV Product / Network Revenue Budget Q4 Forecast Variance MRP Budget Variance Variance U.S. Distribution 48 48 - 47 47 - (1) Int'l Distribution 5 13 8 10 16 6 3 Int'l Production 266 237 (29) 433 381 (52) 144 U.S. Production & Ad Sales 1,814 1,723 (91) 1,914 1,911 (3) 188 Networks 1,690 1,504 (186) 1,961 1,928 (33) 424
Total 3,823 3,525 (298) 4,365 4,283 (82) 758
FY13 FY14 FY13 vs FY14 EBIT Budget Q4 Forecast Variance MRP Budget Q4 vs Budget Variance U.S. Distribution 34 34 - 33 33 - (1) Int'l Distribution (45) (44) 1 (50) (47) 3 (3) Int'l Production 9 5 (4) 13 13 - 8 U.S. Production & Ad Sales 248 295 47 301 263 (38) (32) Networks 307 268 (39) 328 338 10 70
Total 553 558 5 625 600 (25) 42
Shine Monetization 11 12 1 - - - (12)
Total - (Including Monetization) 564 570 6 625 600 (25) 30
3D Networks (8) (5) 3 (5) (5) - -
FY14

10
FY13 Budget EBIT Weaker Network Ad Sales (excl India) Teleset Impairment MOWs (esp. Hatfields & McCoys) Other -
200
400
600
800
1,000
1,200
564
9 39 9
5
570
-
18 30 - 3
- - 5
-
EBIT – FY13 Forecast vs. FY13 Budget (figures in millions)
[Updated on: 2/06/2013]

11
FY14 MRP EBIT 5 New Broadcast Series Est vs. 3 in MRPWeaker Network Ad Sales (excl India) -
100
200
300
400
500
600
700 625
10 20 3 21
600
- - 20
- -
12
47
EBIT – FY14 Budget vs. FY14 MRP(figures in millions)

12
EBIT Before Monetization – FY13 vs. FY14(figures in millions)
[Updated on: 2/06/2013]
FY13 to FY14 EBIT Bridge
FY13 Forecast EBIT GSN Growth (incl. Purchase Price Amort) Final Season of Breaking Bad FY14 Budget EBIT -
200
400
600
800
1,000
1,200
558
21 15 20 15 8
- -
-
600
-
- - - - -
14 21
2

13
Net Overhead(figures in millions)
[Updated on: 02/01/2013]
FY13Budget
FY13Forecast
FY14MRP
FY14Budget
0
100
200
300
400
500
600
456 443
517 514

14
Net Overhead Summary(figures in millions)
[Updated on: 02/07/2013]
FY13 FY14 FY13 vs FY14 Gross Overhead Budget Q4 Forecast Variance MRP Budget Variance Variance US & Int'l Networks -Existing 300 286 (14) 323 323 - 37 US & Int'l Distribution 51 56 5 59 59 - 3 US & Int'l Marketing & Research 18 19 1 20 21 1 2 US Production & Ad Sales 70 72 2 75 78 3 6 Int'l Production 52 54 2 70 64 (6) 10 Subtotal 491 487 (4) 547 545 (2) 58
Networks - New Investment 7 - (7) 22 24 2 24 Total Gross Overhead 498 487 (11) 569 569 - 82
FY13 vs FY14 Net Overhead Budget Q4 Forecast Variance MRP Budget Variance Variance US & Int'l Networks -Existing 300 286 (14) 323 323 - 37 US & Int'l Distribution 63 68 5 71 73 2 5 US Production & Ad Sales 38 40 2 42 40 (2) - Int'l Production 48 49 1 59 54 (5) 5 Subtotal 449 443 (6) 495 490 (5) 47
Networks - New Investment 7 - (7) 22 24 2 24 Total Net Overhead 456 443 (13) 517 514 (3) 71
FY13 vs. FY14 Headcount Budget Q4 Forecast Variance MRP Budget Variance Variance US & Int'l Networks -Existing 2,046 2,073 27 2,159 2,195 36 122 US & Int'l Distribution 167 163 (4) 172 170 (2) 7 US & Int'l Marketing & Research 100 100 - 110 120 10 20 US Production & Ad Sales 197 201 4 210 220 10 19 Int'l Production 224 256 32 340 257 (83) 1 Subtotal 2,734 2,793 59 2,991 2,962 (29) 169
Networks - New Investment 30 45 15 576 574 (2) 529 Total Headcount 2,764 2,838 74 3,567 3,536 (31) 698
FY13 FY14
FY13 FY14
• Unfavorable FX impact in FY14 budget vs. MRP of $(1)MM $(1)MM and $(5)MM for Int’l Distribution, Int’l Production and Int’l Networks, respectively)

15
SPT Networks
[Updated on: 1/18/2012]

16
SPT Networks – FY14 Outlook [Updated on: 1/31/2012]
FY14 will see Networks cross the $300MM EBIT threshold, over a 40% CAGR across seven consecutive years of record earnings
• Major new financial milestones will be achieved by SPT Networks in FY14
– Revenue will surpass $1.9BN
– EBIT will exceed $300MM after breaking $250MM for the first time in FY13
– This represents year-on-year growth of 28% (Revenue) and 26% (EBIT)
• This substantial earnings growth will be achieved while also continuing to invest in the business to help sustain the strong growth profile into the future
– In addition to the nine new operations that were/will be launched/acquired in FY13, funds have been included in the FY14 Budget to invest in several new operations
• Specific growth opportunities factored into the Budget include
– Significantly increasing the ad sales and technical infrastructure resources available to Crackle U.S. to monetize the market opportunity
– Launching Networks first wholly owned channel in Australia
– Launching a female focused Crackle to compliment the strong start made by Crackle in Latin America
– Multiple library movie channel opportunities in Europe
– Acquisition of TV Asia, a Hindi language library channel broadcasting in the U.S.
– Enter Turkey, the next important emerging market
• In addition to seeking out new opportunities, there are significant challenges for the core business globally
– Ad sales continues to need overhead investment to achieve the 20%+ year-on-year growth anticipated across the portfolio
– Content costs continue to climb quickly with new costs often out-stripping revenue increases, increasing margin pressure
– Increasing investment in original content is an important hedge against increasing content acquisition costs and producing more locally is becoming a regulatory requirement in certain parts of the world
– Increasing localization of the channels to maintain a strong relationship with the viewers as markets continue to fragment

17
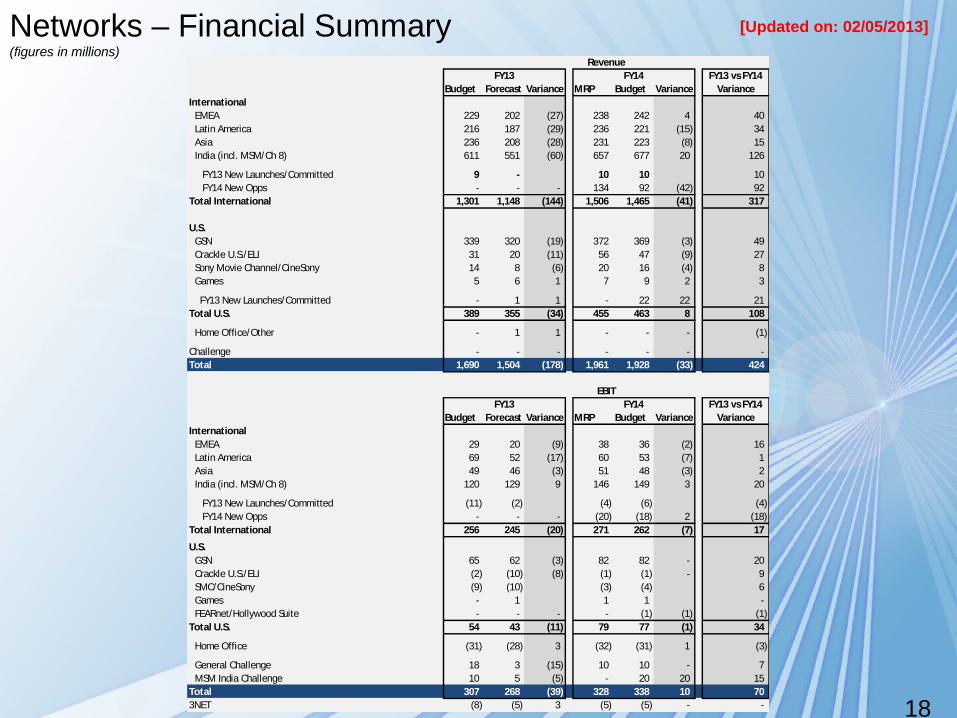
Networks – Financial Summary(figures in millions)
Revenue EBIT
[Updated on: 02/05/2013]
Challenge FY13 Forecast
FY14 MRP
FY14 Budget
0
250
500
750
1000
1250
1500
1750
2000
01
2
3 4
1690
1504
1961 1928
FY13 Budget
FY13 Forecast
FY14 MRP
FY14 Budget
0
50
100
150
200
250
300
350
400
307
268
328338
• FY13 $268MM EBIT represents a 9% growth year-on-year, while revenue will cross the $1.5BN marker for the very first time. Despite difficult ad sales conditions continuing across most of the world, the FY13 EBIT forecast has been kept at the Q2 reforecast level. A ($44MM) IPL EBIT hit and an unfavorable ($18MM) FX impact are the biggest contributors to the Budget EBIT downside
• FY14 is projected to exceed the MRP level for EBIT, which represents a 26% year-on-year increase. Strong projected growth in India, Europe, GSN and Crackle U.S. drives the portfolio upwards. Included in the Budget is a $30MM challenge, two thirds of this expected to be delivered by India
28% GROWTH26% GROWTH
18
Networks – Financial Summary(figures in millions)
[Updated on: 02/05/2013]
RevenueFY13 FY14 FY13 vs FY14
Budget Forecast Variance MRP Budget Variance VarianceInternational
EMEA 229 202 (27) 238 242 4 40 Latin America 216 187 (29) 236 221 (15) 34 Asia 236 208 (28) 231 223 (8) 15 India (incl. MSM/Ch 8) 611 551 (60) 657 677 20 126
FY13 New Launches/Committed 9 - 10 10 10 FY14 New Opps - - - 134 92 (42) 92
Total International 1,301 1,148 (144) 1,506 1,465 (41) 317
U.S.GSN 339 320 (19) 372 369 (3) 49 Crackle U.S./ELI 31 20 (11) 56 47 (9) 27 Sony Movie Channel/CineSony 14 8 (6) 20 16 (4) 8 Games 5 6 1 7 9 2 3
FY13 New Launches/Committed - 1 1 - 22 22 21 Total U.S. 389 355 (34) 455 463 8 108
Home Office/Other - 1 1 - - - (1)
Challenge - - - - - - - Total 1,690 1,504 (178) 1,961 1,928 (33) 424
EBITFY13 FY14 FY13 vs FY14
Budget Forecast Variance MRP Budget Variance VarianceInternational
EMEA 29 20 (9) 38 36 (2) 16 Latin America 69 52 (17) 60 53 (7) 1 Asia 49 46 (3) 51 48 (3) 2 India (incl. MSM/Ch 8) 120 129 9 146 149 3 20
FY13 New Launches/Committed (11) (2) (4) (6) (4) FY14 New Opps - - - (20) (18) 2 (18)
Total International 256 245 (20) 271 262 (7) 17
U.S. GSN 65 62 (3) 82 82 - 20 Crackle U.S./ELI (2) (10) (8) (1) (1) - 9 SMC/CineSony (9) (10) (3) (4) 6 Games - 1 1 1 - FEARnet/Hollywood Suite - - - - (1) (1) (1)
Total U.S. 54 43 (11) 79 77 (1) 34
Home Office (31) (28) 3 (32) (31) 1 (3)
General Challenge 18 3 (15) 10 10 - 7 MSM India Challenge 10 5 (5) - 20 20 15
Total 307 268 (39) 328 338 10 70 3NET (8) (5) 3 (5) (5) - -
19
U.S. Distribution
[Updated on: 1/18/2012]

20
U.S. Distribution – FY14 Outlook [Updated on: 01/15/2013]
• Maximize First-Run and Off-Net series value:– Dr. Oz – 3rd cycle renewals. Sold through 13/14 season– Queen Latifah – sell double runs and launch the show in September 2013 with ratings target of 2.5– Happy Endings – SVOD/Cable/Broadcast– Community – upgrade time periods and secure double runs to ensure we hit target rating– Seinfeld – Sell 5th cycle after current cycle ends September 2014, marking the first time a show has been sold into a 5th cycle
• Expand partnerships with all clients to exploit new revenue opportunities– Pursue diginet space cash and barter opportunities (e.g., Cozi, Bounce TV, Tribune.3)– Negotiate guild waivers to free up residually-locked current and library TV product for monetization in broadcast, cable and diginet space– Broaden business with networks that demand movie volume (e.g., AMC, IFC, HDNet Movies)– Explore First-Run opportunities with station groups who want to own/invest in original programming (e.g., Tribune, NBC, Scripps, Sinclair, Raycom)
• Continue to capitalize on demand for content across premium subscription services (Netflix, Hulu, Amazon)– SVOD services pay highest fees for current TV product with early avails (“catch-up” rights 2-4 weeks prior to broadcast season in coordination with
SPHE to protect DVD/EST) and for exclusivity (includes limiting authenticated and unauthenticated AVOD)– SVOD pricing has leveled off for current TV, library and independent films– Explore arbitrage of SPA titles from Starz to SVOD
• Strategically buy back rights licensed for features and TV series to take advantage of re-license opportunities for incremental fees

21
U.S. Distribution – Financial Summary(figures in millions)
Gross Revenue EBITProfit Contribution
PayDBO*
$1.2BN $1.3BN $1.19BN
$1.08BN
[Updated on: 02/01/2013]
FY13Budget
FY13Forecast
FY14MRP
FY14Budget
0
100
200
300
400
500
600
700
800
900
749 797 778
716
FY13Budget
FY13Forecast
FY14MRP
FY14Budget
0
50
100
150
200
250
300
350
400
332
362
322 311
Chart Title
FY13Budget
FY13Forecast
FY14MRP
FY14Budget
0
5
10
15
20
25
30
35
40
34 34 33 33
Chart Title
• FY13 and FY14 include Starz bonus of $47.5MM and $46.1MM, respectively (remains in U.S. Distribution EBIT)
* Cumulative domestic box office (DBO) for Pay Window feature avails adjusted for rate-card caps under the Starz deal.

22
U.S. Distribution – Financial Summary(figures in millions)
[Updated on: 02/01/2013]
Gross RevenueFY13 FY14 FY13 vs FY14
Budget Forecast Variance MRP Budget Variance Variance2011 to 2013 Major Releases (Pay) 173 199 26 142 137 (5) (62) 2010 to 2012 Major Releases (Free) 131 135 4 86 67 (19) (68) Other Current 70 63 (7) 70 69 (1) 6 Library 61 64 3 67 72 5 8 Total MPG 435 461 26 365 345 (20) (116)
Total WW Acquisitions 34 40 6 46 48 2 8
Starz Bonus 48 48 - 45 47 2 (1) First Run and off-net Syndication 190 204 14 281 228 (53) 24 Library 42 44 2 41 48 7 4 Total TV 280 296 16 367 323 (44) 27 Total 749 797 48 778 716 (62) (81)
Profit ContributionFY13 FY14 FY13 vs FY14
Budget Forecast Variance MRP Budget Variance VarianceMPG 218 235 17 189 183 (6) (52) WW Acquisitions 14 16 2 19 20 1 4 TV 114 125 11 128 122 (6) (3) Total 346 376 30 336 325 (11) (51) G&A (14) (14) - (14) (14) - - Profit Contribution 332 362 30 322 311 (11) (51)
Transfer to Product Owners (298) (328) (30) (289) (278) 11 50
EBIT 34 34 - 33 33 - (1)

23
U.S. Distribution – Library Gross Revenue(figures in millions)
[Updated on: 02/01/2013]
FY13 Budget
FY13 Forecast
FY14 MRP
FY14 Budget
0
20
40
60
80
100
120
42.13 44.12 4148
60.9963.96 67
72.44
103 108 108
120
Total MPG TV

24
U.S. Ad Sales
[Updated on: 1/18/2012]

25
U.S. Ad Sales – FY14 Outlook [Updated on: 01/15/2013]
Current National Advertising MarketStrong up-front has not contributed to a strong scatter market at the end of 2012. Uncertain economy and
lack of a broadcast hit have contributed to current marketplace anemia. First quarter options were very low (single digit percentages) and could indicate improving market strength. Advertiser still demanding of integrations / sponsors to identify partners for spend.
• Maximize First-Run and Off-Net series‒ Use daytime strength to drive volume in Off-Nets‒ Get market share with comedy lineup Seinfeld / Rules / King of Queens / Community / ‘Til Death
• Emphasize the benefits of syndication in the C3 landscape as industry evaluates a shift in measurement
• Continue to look for revenue growth opportunities in digital and emerging businesses ‒ FY14 includes PlayStation Network, FEARnet, Sony Movie Channel and building strategy for Sony
IPTV
• Explore opportunities with distribution in the diginet space
• Create revenue opportunities in Dr. Oz and Queen Latifah by securing integration partnerships‒ Lock in new advertisers and protect against ratings shortfall

26
U.S. Ad Sales – Financial Summary(figures in millions)
Gross Revenue EBITProfit Contribution
[Updated on: 02/06/2013]
FY13Budget
FY13Forecast
FY14MRP
FY14Budget
0
50
100
150
200
250
189
173
215 210
FY13Budget
FY13Forecast
FY14MRP
FY14Budget
0
5
10
15
20
25
30
35
29
26
16
11
Chart Title
FY13Budget
FY13Forecast
FY14MRP
FY14Budget
(12)
(10)
(8)
(6)
(4)
(2)
0
(11)
(10)
(8) (8)
Chart Title
MRP restated to reflect transfer of Crackle ad sales to Networks.

27
U.S. Ad Sales – Financial Summary(figures in millions)
[Updated on: 02/06/2013]
MRP restated to reflect transfer of Crackle ad sales to Networks.
FY13 FY14 FY13 vs FY14Budget Forecast Variance MRP Budget Variance Variance
Gross RevenueKING OF QUEENS 17 17 - 15 15 - (2) TIL DEATH 5 4 (1) 5 4 (1) - RULES OF ENGAGEMENT 13 12 (1) 25 23 (2) 11 COMMUNITY - - - 7 8 1 8 SEINFELD 37 30 (7) 31 30 (1) - DR OZ 60 51 (9) 55 52 (3) 1 NATE BERKUS 7 6 (1) - - - (6) QUEEN LATIFAH - - - 24 25 1 25 WHEEL OF FORTUNE, JEOPARDY! 13 14 1 14 14 - - All Other 1 3 2 3 3 - -
Subtotal 153 137 (16) 179 174 (5) 37
Playstation 12 13 1 25 25 - 12 Fearnet 2 1 (1) 5 3 (2) 2 Other Third Party Distribution 7 9 2 6 8 2 (1)
Crackle 15 13 (2) - - - (13)
Total Gross Revenue 189 173 (16) 215 210 (5) 37
Cost Related to Revenue (145) (132) 13 (183) (183) - (51) Ad Sales Overhead (15) (15) - (16) (16) - (1) Profit Contribution 29 26 (3) 16 11 (5) (15)
Transfer to Product Owner (40) (36) 4 (24) (19) 5 17
SPTAS EBIT (11) (10) 1 (8) (8) - 2

28
International Distribution
[Updated on: 1/18/2012]
29
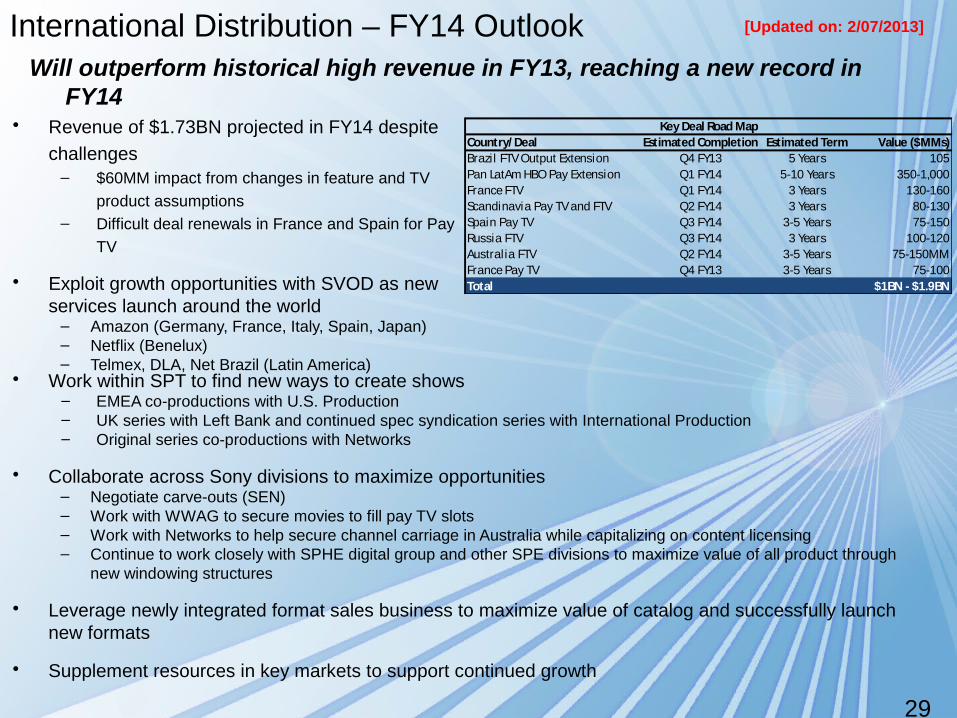
International Distribution – FY14 Outlook
• Work within SPT to find new ways to create shows‒ EMEA co-productions with U.S. Production‒ UK series with Left Bank and continued spec syndication series with International Production‒ Original series co-productions with Networks
• Collaborate across Sony divisions to maximize opportunities– Negotiate carve-outs (SEN)– Work with WWAG to secure movies to fill pay TV slots– Work with Networks to help secure channel carriage in Australia while capitalizing on content licensing– Continue to work closely with SPHE digital group and other SPE divisions to maximize value of all product through
new windowing structures
• Leverage newly integrated format sales business to maximize value of catalog and successfully launch new formats
• Supplement resources in key markets to support continued growth
• Revenue of $1.73BN projected in FY14 despite
challenges– $60MM impact from changes in feature and TV
product assumptions– Difficult deal renewals in France and Spain for Pay
TV
• Exploit growth opportunities with SVOD as new services launch around the world
– Amazon (Germany, France, Italy, Spain, Japan)– Netflix (Benelux)– Telmex, DLA, Net Brazil (Latin America)
Will outperform historical high revenue in FY13, reaching a new record in FY14
[Updated on: 2/07/2013]
Country/ Deal Estimated Completion Estimated Term Value ($MMs)Brazil FTV Output Extension Q4 FY13 5 Years 105Pan LatAm HBO Pay Extension Q1 FY14 5-10 Years 350-1,000France FTV Q1 FY14 3 Years 130-160Scandinavia Pay TV and FTV Q2 FY14 3 Years 80-130Spain Pay TV Q3 FY14 3-5 Years 75-150Russia FTV Q3 FY14 3 Years 100-120Australia FTV Q2 FY14 3-5 Years 75-150MMFrance Pay TV Q4 FY13 3-5 Years 75-100Total $1BN - $1.9BN
Key Deal Road Map
30
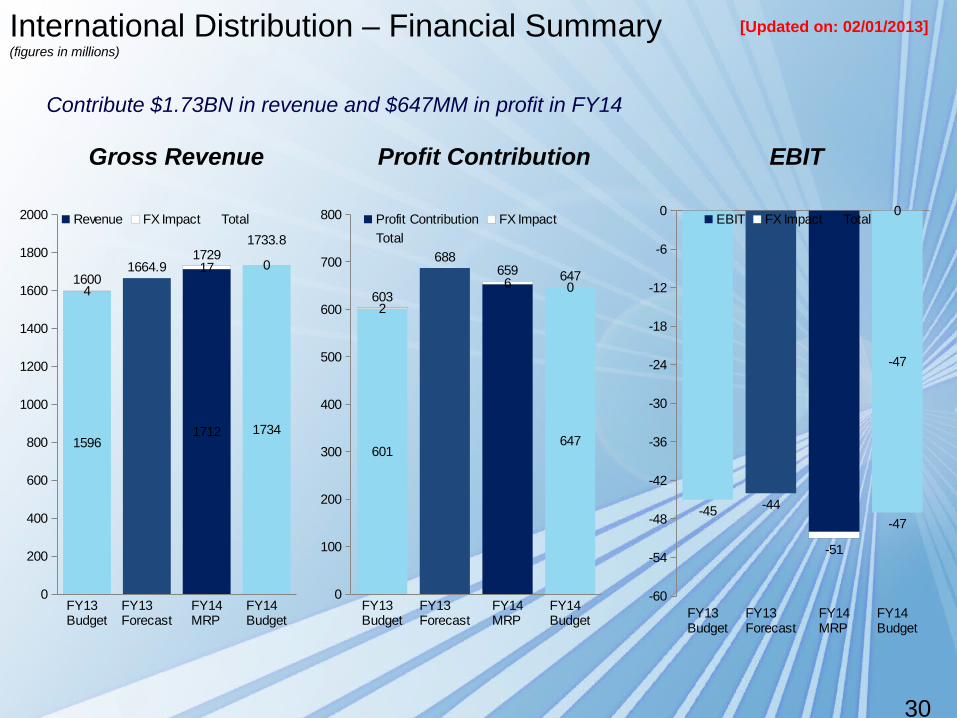
Contribute $1.73BN in revenue and $647MM in profit in FY14
International Distribution – Financial Summary(figures in millions)
Gross Revenue EBITProfit Contribution
[Updated on: 02/01/2013]
FY13Budget
FY13Forecast
FY14MRP
FY14Budget
0
200
400
600
800
1000
1200
1400
1600
1800
2000
15961712 1734
4
17 01600
1664.91729
1733.8
Revenue FX Impact Total
FY13Budget
FY13Forecast
FY14MRP
FY14Budget
0
100
200
300
400
500
600
700
800
601647
2
6 0603
688659 647
Profit Contribution FX Impact
Total
FY13Budget
FY13Forecast
FY14MRP
FY14Budget
-60
-54
-48
-42
-36
-30
-24
-18
-12
-6
0
-45 -44
-51
-47
-47
0EBIT FX Impact Total

31
International Distribution – Financial Summary(figures in millions)
[Updated on: 02/01/2013]
Gross RevenueFY13 FY14 FY13 vs FY14
Budget Forecast Variance MRP Budget Variance VarianceMPG Current 580 569 (11) 598 564 (35) (6) MPG Flow 180 226 46 187 197 10 (29) MPG Library 180 200 20 190 200 10 0 Total MPG 940 995 55 975 961 (14) (34)
WW Acquisitions 135 178 43 170 178 8 0
TV Current 386 342 (44) 419 437 18 95 TV Library 70 70 0 75 75 - 5 TV Int'l Production 60 65 5 59 61 2 (4) TV Int'l Acquired/Other 9 15 6 14 22 8 7 Total TV 525 492 (33) 567 595 28 103 Total 1,600 1,665 65 1,712 1,734 22 69
Profit ContributionFY13 FY14 FY13 vs FY14
Budget Forecast Variance MRP Budget Variance VarianceMPG 502 537 35 517 513 (4) (24) WW Acquisitions 59 79 20 76 78 2 (1) TV 91 126 35 117 115 (2) (11) Total 652 742 90 710 706 (4) (36) G&A (49) (54) (5) (57) (59) (2) (5) Profit Contribution 603 688 85 653 647 (6) (41)
Transfer to Product Owners (648) (732) (84) (703) (694) 9 38
EBIT (45) (44) 1 (50) (47) 3 (3)
32
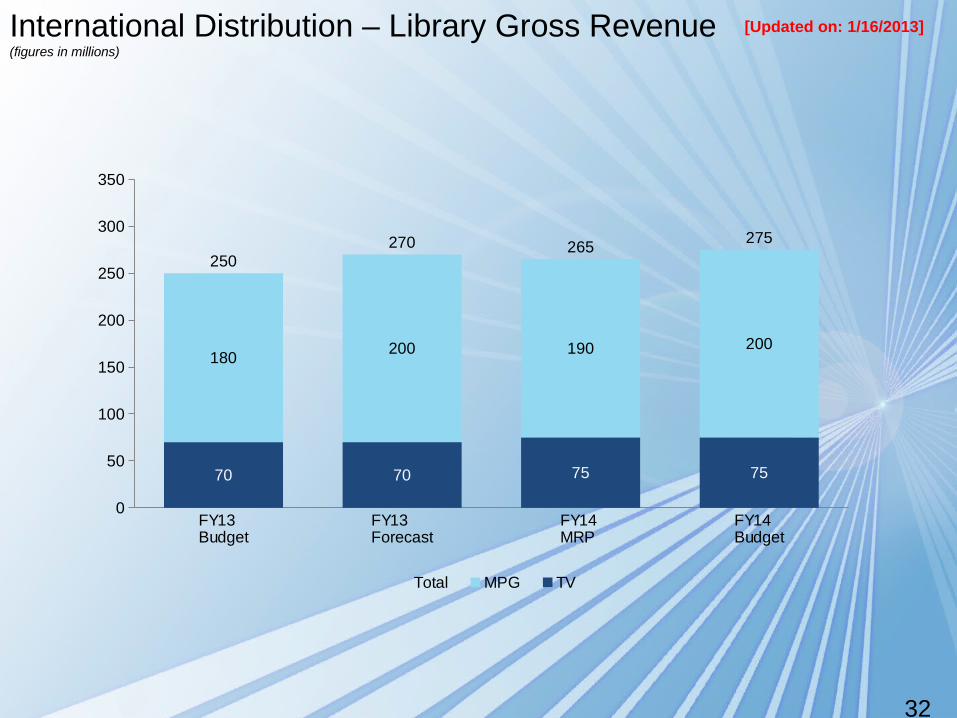
International Distribution – Library Gross Revenue(figures in millions)
[Updated on: 1/16/2013]
FY13 Budget
FY13 Forecast
FY14 MRP
FY14 Budget
0
50
100
150
200
250
300
350
70 70 75 75
180200 190 200
250270 265
275
Total MPG TV

33
Key Feature and TV Drivers – FY13 [Updated on: 01/18/2013]
Int’l DistributionU.S. Distribution
(figures in thousands)
Total
Title FY13 Rev Title FY13 RevKARATE KID 20,200 RULES OF ENGAGEMENT 71,800 GROWN UPS 18,700 DR OZ 61,300 GIRL WITH THE DRAGON TATTOO 16,700 JUSTIFIED 18,500 21 JUMP STREET 14,700 QUEEN LATIFAH 14,600 THE VOW 14,700 Y&R/Days of Our Lives 10,700 SPIDER-MAN 2012 14,700 All others individually < $9M 27,300 MEN IN BLACK 3 14,700 THE OTHER GUYS 13,700 SALT 13,600 JACK & JILL 13,500 MONEYBALL 13,400 THINK LIKE A MAN 13,300 JUST GO WITH IT 11,800 SOCIAL NETWORK 11,700 GREEN HORNET 11,300 HOPE SPRINGS 10,900 UNDERWORLD 4 [3D] 10,500 ARTHUR'S CHRISTMAS (AARDMAN) 10,100 TOTAL RECALL 10,000 GHOST RIDER 2 [3D] 9,400 All others individually < 9M 129,700 Starz Bonus 47,500 Feature Library 64,000 TV Library 44,100
Subtotal Features 461,300
WW Acquisitions (all individually < 9M) 39,900
Total 501,200 295,800 797,000
Feature Films/ WW Acquisitions Television Total
Title FY13 Rev Title FY13 RevMEN IN BLACK 3 25,000 Y&R/Days of Our Lives 49,200 KARATE KID 24,500 UNFORGETTABLE 25,900 SMURFS 23,800 DROP DEAD DIVA 20,400 GROWN UPS 23,800 LAST RESORT 18,100 AMAZING SPIDER-MAN, THE 21,300 BREAKING BAD 17,200 2012 19,100 MOB DOCTOR 15,900 SALT 16,600 JUSTIFIED 15,600 ADVENTURES OF TINTIN, THE 15,700 HOUSE OF CARDS 15,100 ARTHUR CHRISTMAS 15,200 DAMAGES 14,600 PIRATES! BAND OF MISFITS, THE 14,600 NECESSARY ROUGHNESS 14,200 GIRL WITH THE DRAGON TATTOO, THE (2011)14,500 DR. OZ 13,900 JACK AND JILL 13,300 WHO WANTS TO BE A MILLIONAIRE 13,800 FRIENDS WITH BENEFITS 13,000 COMMUNITY 13,100 RESIDENT EVIL: AFTERLIFE 12,900 FRANKLIN AND BASH 11,100 EAT PRAY LOVE 11,800 HAPPY TOGETHER (RUSSIA) 10,300 MONEYBALL 11,700 CLIENT LIST 10,000 BAD TEACHER 11,400 EVERYBODY LOVES RAYMOND (RUSSIA) 9,800 BOUNTY HUNTER, THE 10,800 THE BIG C 9,400 UNDERWORLD AWAKENING 10,200 All others individually < $9M 139,400 SOCIAL NETWORK, THE 9,700 CLOUDY WITH A CHANCE OF MEATBALLS 9,200 OTHER GUYS, THE 9,100 All others individually < 9M 458,300 Feature Library 200,000 WW Acquisitions (all individually < 9M) 162,500 TV Library 70,000
Total 1,158,000 507,000 1,665,000
Feature Films/ WW Acquisitions Television

34
Key Feature and TV Drivers – FY14
Int’l DistributionU.S. Distribution
[Updated on: 02/05/2013]
(figures in thousands)
Total
Title FY14 Rev Title FY14 RevGROWN UPS 2 14,700 DR OZ 60,400 WHITE HOUSE DOWN 14,700 HAPPY ENDINGS 45,600 SMURFS 2 14,700 COMMUNITY 44,300 AFTER EARTH 14,700 QUEEN LATIFAH 14,600 ELYSIUM 14,700 RULES OF ENGAGEMENT 10,700 HOTEL TRANSYLVANIA 14,700 Y&R/Days of Our Lives 10,400 ZERO DARK THIRTY 14,600 BREAKING BAD 9,600 THE VOW 14,400 All others individually < $9M 32,100 GIRL WITH THE DRAGON TATTOO 11,800 END OF THE WORLD 11,600 MORTAL INSTRUMENTS 10,100 All others individually < $9M 122,400 Starz Bonus 47,100 Feature Library 72,400 TV Library 47,500
Subtotal Features 345,500
EVIL DEAD (2013) 9,100 WW Acquisitions (all individually < 9M) 38,700
Subtotal WW Acquisitions 47,800
Total 393,300 322,300 715,600
Feature Films/ WW Acquisitions Television Total
Title FY14 Rev Title FY14 RevSMURFS, THE (2011) 26,900 13/14 Net Dramas 52,000 HOTEL TRANSYLVANIA 20,000 Y&R/Days of Our Lives 50,500 DJANGO UNCHAINED 17,900 Unforgettable 31,600 AFTER EARTH 17,700 Necessary Roughness 18,600 BAD TEACHER 15,700 House of Cards 16,700 AMAZING SPIDER-MAN, THE 15,100 Masters of Sex 16,200 GIRL WITH THE DRAGON TATTOO, THE (2011)15,100 Who Wants to be a Millionaire 16,200 ELYSIUM 13,900 Client List 13,700 FRIENDS WITH BENEFITS 13,800 Justified 13,100 TOTAL RECALL (2012) 11,200 Drop Dead Diva 12,100 ADVENTURES OF TINTIN, THE 10,400 13/14 Net Comedies 15,800 HERE COMES THE BOOM 10,300 Dr. Oz 11,500 SOCIAL NETWORK, THE 9,200 Franklin and Bash 11,300 All others individually < $9M 563,400 Breaking Bad 10,900 Feature Library 200,000 Community 10,800 WW Acquisitions (all individually < 9M) 161,500 13/14 Cable Dramas 14,800
All others individually < $9M 221,000 TV Library 75,000
Total 1,122,100 611,800 1,733,900
Feature Films/ WW Acquisitions Television
35
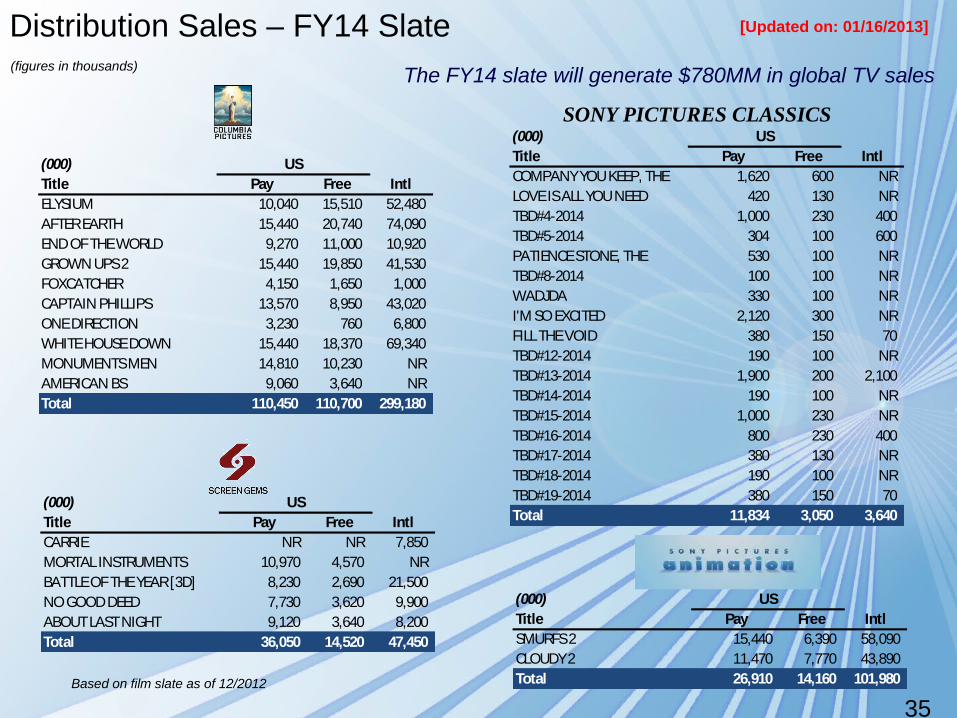
Distribution Sales – FY14 Slate
The FY14 slate will generate $780MM in global TV sales
Based on film slate as of 12/2012
[Updated on: 01/16/2013]
SONY PICTURES CLASSICS
(000)Title Pay Free IntlELYSIUM 10,040 15,510 52,480 AFTER EARTH 15,440 20,740 74,090 END OF THE WORLD 9,270 11,000 10,920 GROWN UPS 2 15,440 19,850 41,530 FOXCATCHER 4,150 1,650 1,000 CAPTAIN PHILLIPS 13,570 8,950 43,020 ONE DIRECTION 3,230 760 6,800 WHITE HOUSE DOWN 15,440 18,370 69,340 MONUMENTS MEN 14,810 10,230 NRAMERICAN BS 9,060 3,640 NRTotal 110,450 110,700 299,180
US
(000)Title Pay Free IntlCARRIE NR NR 7,850 MORTAL INSTRUMENTS 10,970 4,570 NRBATTLE OF THE YEAR [3D] 8,230 2,690 21,500 NO GOOD DEED 7,730 3,620 9,900 ABOUT LAST NIGHT 9,120 3,640 8,200 Total 36,050 14,520 47,450
US
(000)Title Pay Free IntlCOMPANY YOU KEEP, THE 1,620 600 NRLOVE IS ALL YOU NEED 420 130 NRTBD#4-2014 1,000 230 400 TBD#5-2014 304 100 600 PATIENCE STONE, THE 530 100 NRTBD#8-2014 100 100 NRWADJDA 330 100 NRI'M SO EXCITED 2,120 300 NRFILL THE VOID 380 150 70 TBD#12-2014 190 100 NRTBD#13-2014 1,900 200 2,100 TBD#14-2014 190 100 NRTBD#15-2014 1,000 230 NRTBD#16-2014 800 230 400 TBD#17-2014 380 130 NRTBD#18-2014 190 100 NRTBD#19-2014 380 150 70 Total 11,834 3,050 3,640
US
(000)Title Pay Free IntlSMURFS 2 15,440 6,390 58,090 CLOUDY 2 11,470 7,770 43,890 Total 26,910 14,160 101,980
US
(figures in thousands)

36
International Production
[Updated on: 1/18/2012]

37
• Built strong Senior Management Team and created culture of transparency, accountability and proactivity
• Drove focus on creation/acquisition of IP that travels • You’re Booked, Raid The Cage, 5 minutes to A Fortune• Strategic deployment of central development fund• Reformatted creative retreats • Took operational burden off Creative• Aggressively maximized benefits of U.S. studio ownership to operating companies
• Established creative and business collaboration across divisions and countries• AXN Pilot competition• Launched new business model for Spanish speaking Latin America with SPT Distribution• Strong collaboration with Sony Music in developing new IP
• Expanded and strengthened global network of production companies• Majority investments in UK companies Left Bank and Silver River • Restructured Toro (Italy) • In process of divesting interest in Tuvalu• Brought production in house in Russia• Launched Egyptian Telenovela unit• Extended Gogglebox principal deals for up to 5 years
• Indentified acquisition targets for FY14
International Production – FY13 Achievements [Updated on: 01/22/2013]

38
International Production – FY14 Outlook [Updated on: 01/22/2013]
• Create IP that travels
• Continue expansion in IP creation territories and high growth markets
• Continue to increase collaboration across regions and SPT divisions
• Succession planning for key leaders across division

39
International Production – Financial Summary(figures in millions)
• Lower than expected volume of FY13 commissions, primarily in Italy, Silver River and Tuvalu; productions delayed in the Middle East due to political unrest
• Lower than expected volumes was partially offset by unbudgeted relicensing of programs in Russia and lower central development fund spend
Revenue EBIT
[Updated on: 2/06/2013]
FY12Actual
FY13 Budget
FY13 Forecast
FY14 MRP
FY14 Budget
0
100
200
300
400
500
206
266
237
433
380.6
Teleset Impairment FY13 Forecast
FY14 Budget
0
5
10
15
20
25
11
12
0
01
2
3
4 51
20
17
1313
9
5
13 13
Total Shine Monetization Shine Monetization
Incl. ($3MM) impairment for Teleset

40
U.S. Production
[Updated on: 1/18/2012]

41
U.S. Production – FY14 Outlook [Updated on: 1/31/2013]
Content will continue to be created and sold across all platforms• Digital / Online – Capitalize on growth opportunities in emerging platforms (Amazon, Netflix,
Hulu)
• Cable – Consistently profitable with some of the most critically acclaimed and respected series in the industry
• Broadcast • Leverage the strength of our international partners to increase global demand and extend life of series
on air in the U.S. • Continue to invest in top tier creative talent
Further Strengthen Portfolio by Creating and Selling Content of all Genres• Drama – Maximize value of worldwide appetite for quality drama across all platforms with
emphasis on broadcast and cable
• Comedy – Maintain and support a strong comedy strategy as part of our overall portfolio business as comedy is currently experiencing significant growth, increased network demand, and sustained value in the syndicated marketplace
• First Run Syndication – Successfully launch the new Queen Latifah daytime series for the 13/14 broadcast season
• Long Form – Continue to be the industry leader in MOW and limited series production, expanding our partners to include networks like FX, SyFy, Starz and Cinemax
• Non – Scripted – Capitalize on growth opportunities in cable (USA, TBS, AMC, WE) and continue to strengthen our foothold in broadcast

42
U.S. Production Assumptions [Updated on: 02/06/2013]
12/ 13 13/ 14 ChangesSeason Season since MRP
Community 4th 5th 13 vs 22 episodesRules Of Engagement 7thHappy Endings 3rd 4th
NETWORK Unforgettable 2nd Production shift to FY14Mob Doctor 1st Not returningLast Resort 1st Not returningMade In Jersey 1stSave Me 1st
13/14 New Comedy 3 3 new vs 2 assumed13/14 New Drama 2 2 new vs 1 assumed
13/14 Pilots 13 13 vs 9 assumed14/15 Pilots 9
The Young and the Restless 41st 42ndDays of Our Lives 48th 49th
Dr. Oz 4th 5thQueen Latifah 1stWheel of Fortune 30th 31stJeopardy! 29th 30th
FY13 FY14Big C 3rdBoondocks 4th No 5th season and production shift to FY14Breaking Bad 6th
CABLE Drop Dead Diva 4th 5thFranklin and Bash 3rd 4thJustified 4th 5thNecessary Roughness 2nd 3rd 38 vs 44 episodesClient List 2nd 3rd 3rd season addedMen at Work 1st / 2nd 3rd Accelerated order of 2nd & 3rdMasters of Sex 1st 2nd
Pilots 1 3
New Drama Series 2
Shark Tank 4th 5th 85 vs 73 episodesPyramid 1st 2nd
NON-SCRIPTED Pilots 3 3
New Cable Series 1 1 new cable vs 2 assumedNew Network Series 1Work-For-Hire / Distribution 1 2 Not previously assumed
Movie 9 9Mini-Series 1 1
SYNDICATED SERIES
MADE-FOR-TV MOVIES
43
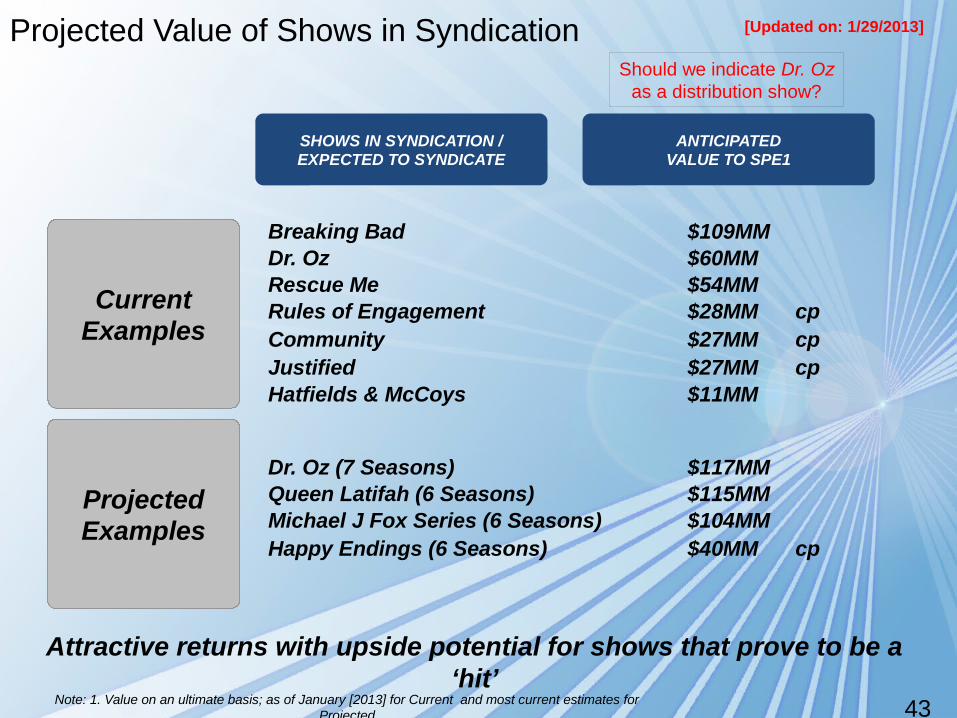
Projected Value of Shows in Syndication
SHOWS IN SYNDICATION / EXPECTED TO SYNDICATE
ANTICIPATEDVALUE TO SPE1
Current Examples
Projected Examples
Breaking Bad $109MM
Attractive returns with upside potential for shows that prove to be a ‘hit’
Note: 1. Value on an ultimate basis; as of January [2013] for Current and most current estimates for Projected
[Updated on: 1/29/2013]
Dr. Oz $60MMRescue Me $54MMRules of Engagement $28MM cpCommunity $27MM cp
Dr. Oz (7 Seasons) $117MMQueen Latifah (6 Seasons) $115MMMichael J Fox Series (6 Seasons) $104MMHappy Endings (6 Seasons) $40MM cp
Justified $27MM cpHatfields & McCoys $11MM
Should we indicate Dr. Oz as a distribution show?

44
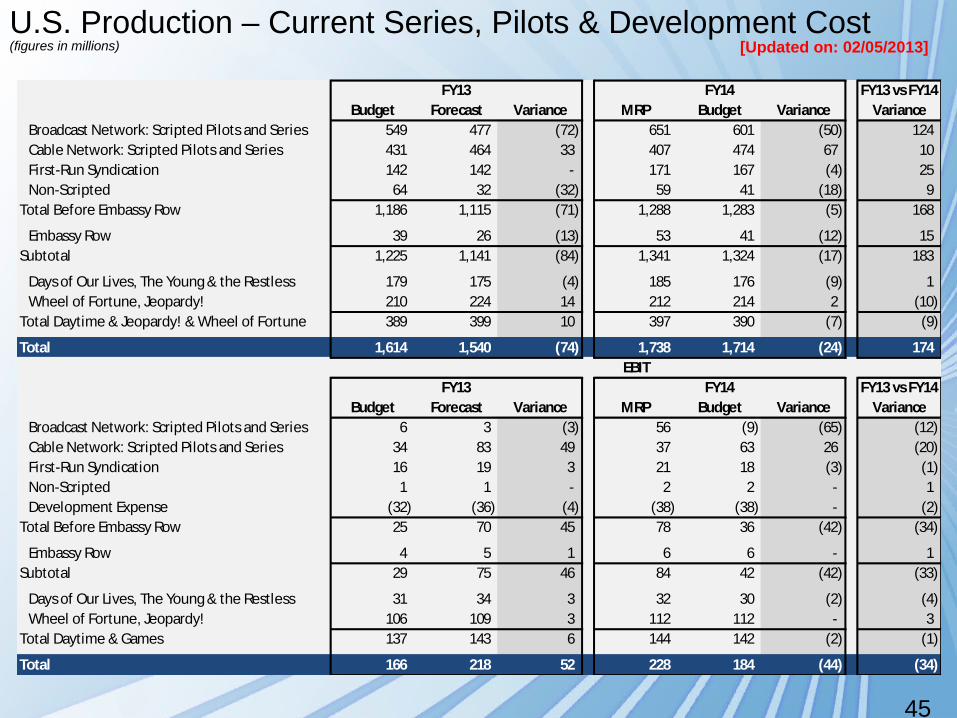
U.S. Production – Current Series, Pilots & Development Cost(figures in millions)
Revenue EBIT
[Updated on: 02/05/2013]
FY13 Budget
FY13 Forecast
FY14 MRP
FY14 Budget
0
250
500
750
1000
1250
1500
17501614
1540
1738 1714
FY13 Budget
FY13 Forecast
FY14 MRP
FY14 Budget
0
25
50
75
100
125
150
175
200
225
250
166
218228
184
45
U.S. Production – Current Series, Pilots & Development Cost(figures in millions) [Updated on: 02/05/2013]
FY13 FY14 FY13 vs FY14Budget Forecast Variance MRP Budget Variance Variance
Broadcast Network: Scripted Pilots and Series 549 477 (72) 651 601 (50) 124 Cable Network: Scripted Pilots and Series 431 464 33 407 474 67 10 First-Run Syndication 142 142 - 171 167 (4) 25 Non-Scripted 64 32 (32) 59 41 (18) 9
Total Before Embassy Row 1,186 1,115 (71) 1,288 1,283 (5) 168 - Embassy Row 39 26 (13) 53 41 (12) 15
Subtotal 1,225 1,141 (84) 1,341 1,324 (17) 183
Days of Our Lives, The Young & the Restless 179 175 (4) 185 176 (9) 1 Wheel of Fortune, Jeopardy! 210 224 14 212 214 2 (10)
Total Daytime & Jeopardy! & Wheel of Fortune 389 399 10 397 390 (7) (9)
Total 1,614 1,540 (74) 1,738 1,714 (24) 174 EBIT
FY13 FY14 FY13 vs FY14Budget Forecast Variance MRP Budget Variance Variance
Broadcast Network: Scripted Pilots and Series 6 3 (3) 56 (9) (65) (12) Cable Network: Scripted Pilots and Series 34 83 49 37 63 26 (20) First-Run Syndication 16 19 3 21 18 (3) (1) Non-Scripted 1 1 - 2 2 - 1 Development Expense (32) (36) (4) (38) (38) - (2)
Total Before Embassy Row 25 70 45 78 36 (42) (34) - Embassy Row 4 5 1 6 6 - 1
Subtotal 29 75 46 84 42 (42) (33)
Days of Our Lives, The Young & the Restless 31 34 3 32 30 (2) (4) Wheel of Fortune, Jeopardy! 106 109 3 112 112 - 3
Total Daytime & Games 137 143 6 144 142 (2) (1)
Total 166 218 52 228 184 (44) (34)

46
U.S. Production – FY13 Q4 New Series Investment & Development
[Updated on: 02/06/2013](figures in millions)
New Series Investment Pool - FY13 Budget ($86) 12/ 13 B'cast Pilot Slate 13/ 14 B'cast Pilot Slate13/14 Network Pilots - 8 in the year vs 3 assumed (5) FY13 Budget FY13 Q4 FY13 Budget FY13 Q4Boondocks - no 5th season. Higher production costs (4) 4 FY12 7 FY12 3 FY13 8 FY13Save Me - wholly-owned series vs coproduction in Budget (5) 5 FY13 1 FY13 6 FY14 5 FY14Increased Development (D. Shore, B. Luhrmann) (4) 9 Total 8 Total 9 Total 13 TotalMade in Jersey - incremental deficit series (3) Franklin and Bash - increased domestic off-net ultimate 1 Necessary Roughness - primarily early order of ssn3 3 Counter Culture pilot not produced 2 Happy Endings - increased domestic off-net ultimate 5 Cable Pilots - 1 vs 3 assumed 5 Other 1 Net Variances (4)
Total Investment Pool - Q4 Forecast ($90)
FY13 VarianceFY13 Budget Economic Volume Timing Total Q4 Forecast
Network:Happy Endings (9) 5 5 (4) Breaking In (2) - - (2) Save Me (3) (5) (5) (8) Mob Doctor (1) 1 1 - Last Resort - (1) (1) (1) Made In Jersey - (3) (3) (3) 12/13 Network Pilots (14) 1 3 6 10 (4) 13/14 Network Pilots (11) 4 (9) (6) (11) (22) Subtotal Network (40) 5 (9) - (4) (44)
Cable:Boondocks - (4) (4) (4) Franklin and Bash (1) 1 1 - Client List - (1) (1) (2) (2) Necessary Roughness (4) - 3 - 3 (1) Men at Work (2) - - (2) TBD Cable (1) 1 1 - Cable Pilots (6) 5 5 (1) Subtotal Cable (14) (2) 7 (1) 4 (10)
Development (32) (4) (4) (36) Total (86) $3 ($6) ($1) ($4) ($90)
*Includes Allocation of Departmental Overhead
47
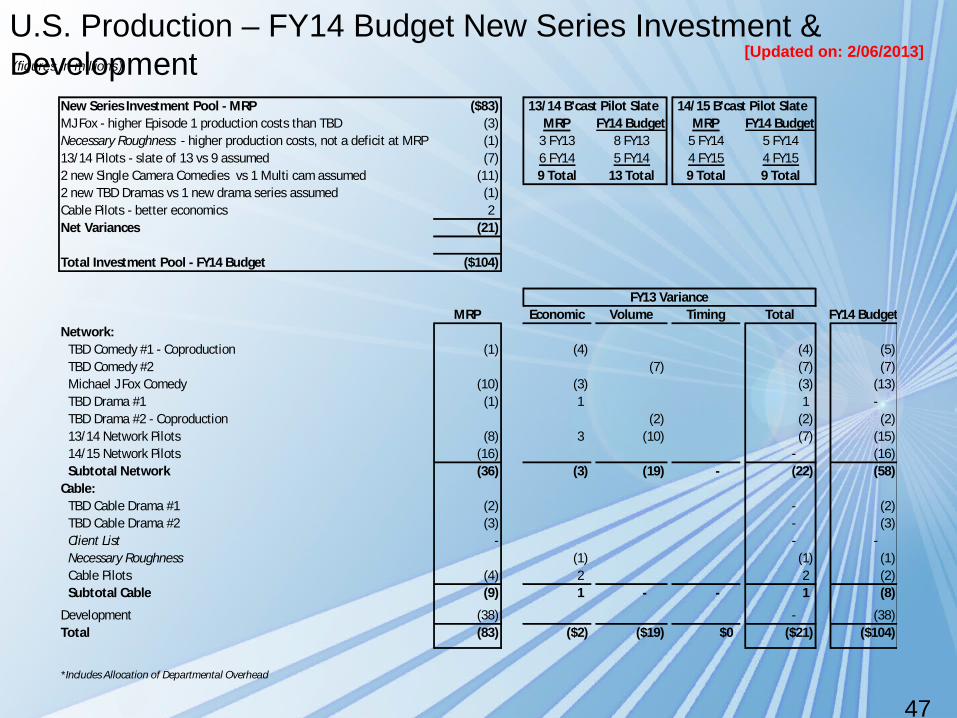
U.S. Production – FY14 Budget New Series Investment & Development
[Updated on: 2/06/2013](figures in millions)
New Series Investment Pool - MRP ($83) 13/ 14 B'cast Pilot Slate 14/ 15 B'cast Pilot SlateMJ Fox - higher Episode 1 production costs than TBD (3) MRP FY14 Budget MRP FY14 BudgetNecessary Roughness - higher production costs, not a deficit at MRP (1) 3 FY13 8 FY13 5 FY14 5 FY1413/14 Pilots - slate of 13 vs 9 assumed (7) 6 FY14 5 FY14 4 FY15 4 FY152 new Single Camera Comedies vs 1 Multi cam assumed (11) 9 Total 13 Total 9 Total 9 Total2 new TBD Dramas vs 1 new drama series assumed (1) Cable Pilots - better economics 2 Net Variances (21)
Total Investment Pool - FY14 Budget ($104)
FY13 VarianceMRP Economic Volume Timing Total FY14 Budget
Network:TBD Comedy #1 - Coproduction (1) (4) (4) (5) TBD Comedy #2 (7) (7) (7) Michael J Fox Comedy (10) (3) (3) (13) TBD Drama #1 (1) 1 1 - TBD Drama #2 - Coproduction (2) (2) (2) 13/14 Network Pilots (8) 3 (10) (7) (15) 14/15 Network Pilots (16) - (16) Subtotal Network (36) (3) (19) - (22) (58)
Cable:TBD Cable Drama #1 (2) - (2) TBD Cable Drama #2 (3) - (3) Client List - - - Necessary Roughness (1) (1) (1) Cable Pilots (4) 2 2 (2) Subtotal Cable (9) 1 - - 1 (8)
Development (38) - (38) Total (83) ($2) ($19) $0 ($21) ($104)
*Includes Allocation of Departmental Overhead

48
FY13Budget
FY13Forecast
FY14MRP
FY14Budget
0
10
20
30
40
50
60
70
80
90
100 93
87 81
87
Chart Title
FY13Budget
FY13Forecast
FY14MRP
FY14Budget
0
50
100
150
200 196
177 168
189
Chart Title
U.S. Production – Library, Net Overhead & Challenge(figures in millions)
EBITRevenue
[Updated on: 02/05/2013]
49
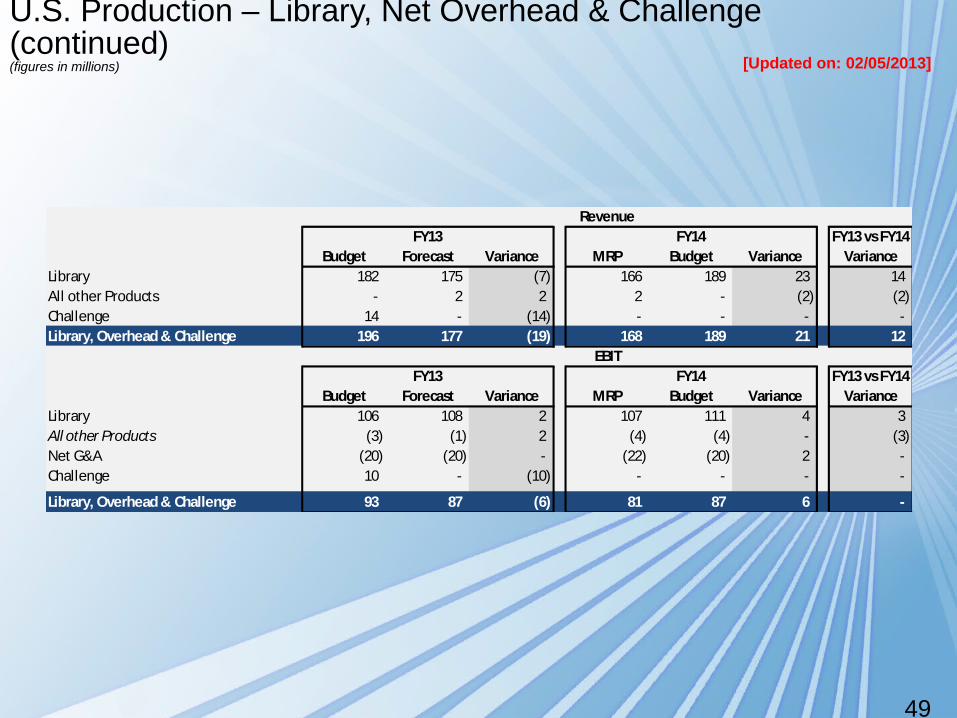
U.S. Production – Library, Net Overhead & Challenge (continued)(figures in millions) [Updated on: 02/05/2013]
RevenueFY13 FY14 FY13 vs FY14
Budget Forecast Variance MRP Budget Variance VarianceLibrary 182 175 (7) 166 189 23 14 All other Products - 2 2 2 - (2) (2) Challenge 14 - (14) - - - - Library, Overhead & Challenge 196 177 (19) 168 189 21 12
EBITFY13 FY14 FY13 vs FY14
Budget Forecast Variance MRP Budget Variance VarianceLibrary 106 108 2 107 111 4 3 All other Products (3) (1) 2 (4) (4) - (3) Net G&A (20) (20) - (22) (20) 2 - Challenge 10 - (10) - - - - - Library, Overhead & Challenge 93 87 (6) 81 87 6 -

50
FY13Budget
FY13Forecast
FY14MRP
FY14Budget
0
20
40
60
80
100
120
106 108 107 111
U.S. Production – Product Library(figures in millions)
EBITRevenue
[Updated on: 02/06/2013]
FY13 Budget
FY13 Forecast
FY14 MRP
FY14Budget
0
50
100
150
200
71 68 74 72
14 1314 14
3027 15
35
11
1
1
4042
38
44
2624
24
23182
175166
189
Total Ad Sales U.S. Dist. Merch/Other SPHE U.S. TVInt'l TV

51
Risks & Opportunities
[Updated on: 1/22/2012]
52
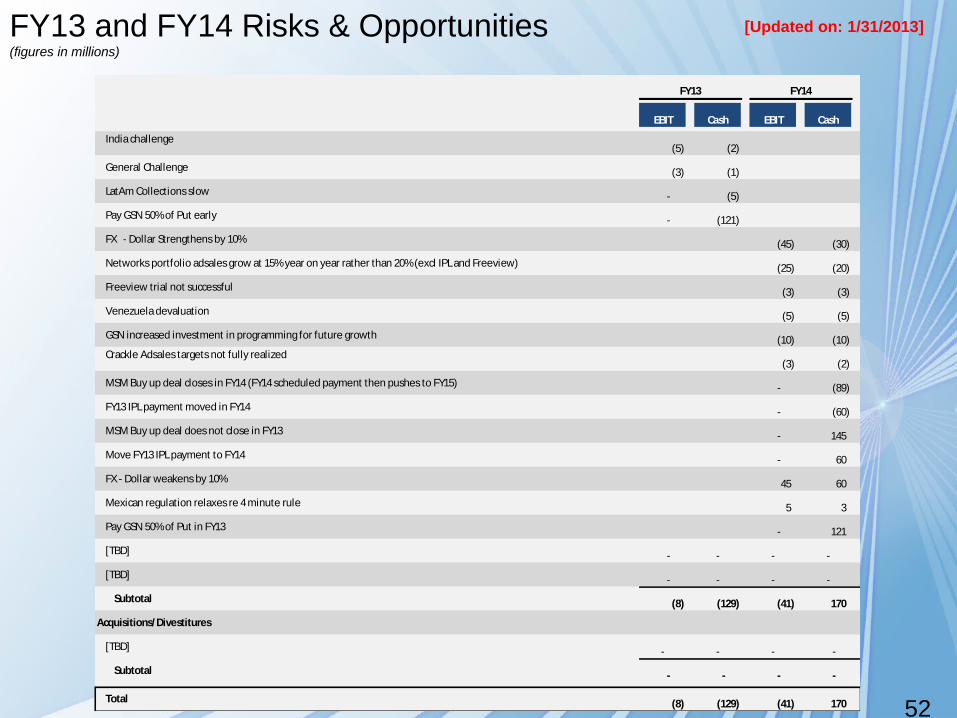
FY13 and FY14 Risks & Opportunities(figures in millions)
[Updated on: 1/31/2013]
EBIT Cash EBIT Cash
India challenge(5) (2)
General Challenge (3) (1)
LatAm Collections slow - (5)
Pay GSN 50% of Put early - (121)
FX - Dollar Strengthens by 10% (45) (30)
Networks portfolio adsales grow at 15% year on year rather than 20% (excl IPL and Freeview) (25) (20)
Freeview trial not successful (3) (3)
Venezuela devaluation (5) (5)
GSN increased investment in programming for future growth (10) (10) Crackle Adsales targets not fully realized
(3) (2)
MSM Buy up deal closes in FY14 (FY14 scheduled payment then pushes to FY15) - (89)
FY13 IPL payment moved in FY14 - (60)
MSM Buy up deal does not close in FY13 - 145
Move FY13 IPL payment to FY14 - 60
FX - Dollar weakens by 10% 45 60
Mexican regulation relaxes re 4 minute rule 5 3
Pay GSN 50% of Put in FY13 - 121
[TBD] - - - -
[TBD] - - - -
Subtotal (8) (129) (41) 170
Acquisitions/Divestitures
[TBD] - - - -
Subtotal - - - -
Total (8) (129) (41) 170
FY13 FY14

53
APPENDIX
[Updated on: 12/6/2012]

54
EBIT – Cause of Change vs. FY13 Budget and FY14 MRP(figures in millions)
[Updated on: 02/01/2013]
FY13 FY14
FY13 Budget / FY14 MRP -$ -$
Networks
FX (18) 10
Europe weaker economic environment than expected impacting revenues, mostly ad sales (10) (6)
Latam region lower than expected due to mostly weaker ad sales and cost inflation (11) (7)
Asia region (excl India) seeing revenue pressure especially in Japan with subscribers growth stalling - (3)
India strong BAU growth more than offset IPL issues 19 (3)
Crackle - Adsales shorftall in FY13 to be addressed by augmented sales force in FY14 (7) -
New Launch fund variances 10 -
General challenges (20) 20
Other (2) (1)
Distribution
Higher acquired product revenue for International Distribution 6 3
[TBD] - -
[TBD] - -
[TBD] - -
[TBD] - -
U.S. Production
[TBD] - -
[TBD] - -
[TBD] - -
[TBD] - -
[TBD] - -
International Production
[TBD] - -
[TBD] - -
[TBD] - -
[TBD] - -
[TBD] - -
[TBD] - -
[TBD] - -
[TBD] - -
Total Variance - -
FY13 Forecast / FY14 Budget -$ -$
55
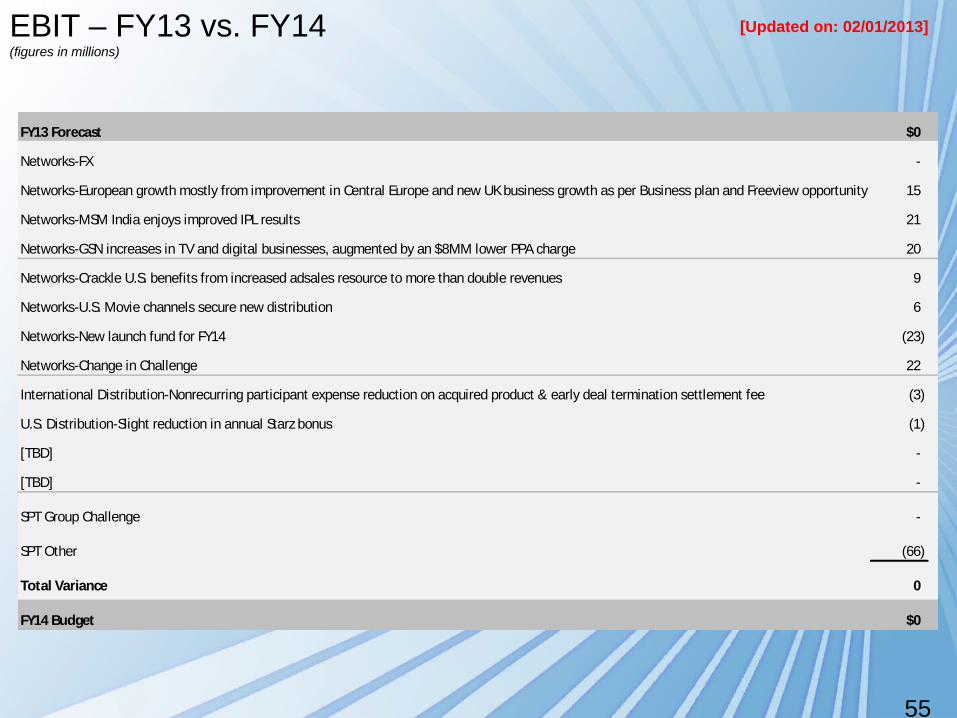
EBIT – FY13 vs. FY14(figures in millions)
[Updated on: 02/01/2013]
FY13 Forecast $0
Networks-FX -
Networks-European growth mostly from improvement in Central Europe and new UK business growth as per Business plan and Freeview opportunity 15
Networks-MSM India enjoys improved IPL results 21
Networks-GSN increases in TV and digital businesses, augmented by an $8MM lower PPA charge 20
Networks-Crackle U.S. benefits from increased adsales resource to more than double revenues 9
Networks-U.S. Movie channels secure new distribution 6
Networks-New launch fund for FY14 (23)
Networks-Change in Challenge 22
International Distribution-Nonrecurring participant expense reduction on acquired product & early deal termination settlement fee (3)
U.S. Distribution-Slight reduction in annual Starz bonus (1)
[TBD] -
[TBD] -
SPT Group Challenge -
SPT Other (66)
Total Variance 0
FY14 Budget $0

56
International Production – Variances to Budget & MRP(figures in millions)
[Updated on: 2/6/2012]
FY13 FY14
FY13 Budget / FY14 MRP 9 13
Volume of Commissions/ Deliveries:Less shows commissioned versus budget (Toro, Silver River, Tuvalu, Floresta, Arabia) (9) (2)
Other:Russia - higher than budgeted re-license for Happy Together, The Nanny & Raymond 8 - Teleset - write off due to impairment (3)
Tuvalu - assumed exit of partnership (2)
TV Licensing - higer revenue on library IP 2
IGT Advance WWTBAM 1
Total Variance (4) -
FY13 Forecast / FY14 Budget 5 13

57
International Production – Detailed Revenue(figures in millions)
[Updated on: 2/06/2013]
RevenueFY13 FY14 FY13 vs FY14
Budget Forecast Variance MRP Budget Variance VarianceTV Licensing - WWTBAM 14 13 (1) 16 15 (1) 2 TV Licensing - Other Formats 12 13 1 11 19 8 6
France (SPT + Starling) 20 19 (1) 36 26 (10) 7 Russia (SPT + Lean-M) 63 57 (6) 53 74 21 17 Germany 28 25 (3) 32 25 (7) - UK (Gogglebox + Victory + Silver River) 36 23 (13) 47 40 (7) 17 Left Bank - 18 18 76 65 (11) 47 Tuvalu 19 18 (1) 20 3 (17) (15) Toro JV 24 9 (15) 15 11 (4) 2
Europe 190 169 (21) 279 244 (35) 75
Latin America 26 20 (6) 86 59 (27) 39
Asia/Middle East 24 19 (5) 41 39 (2) 20
Other - 3 3 - 5 5 2 Total Other 50 42 (8) 127 103 (24) 61
Total Revenue 266 237 (29) 433 381 (52) 144
58
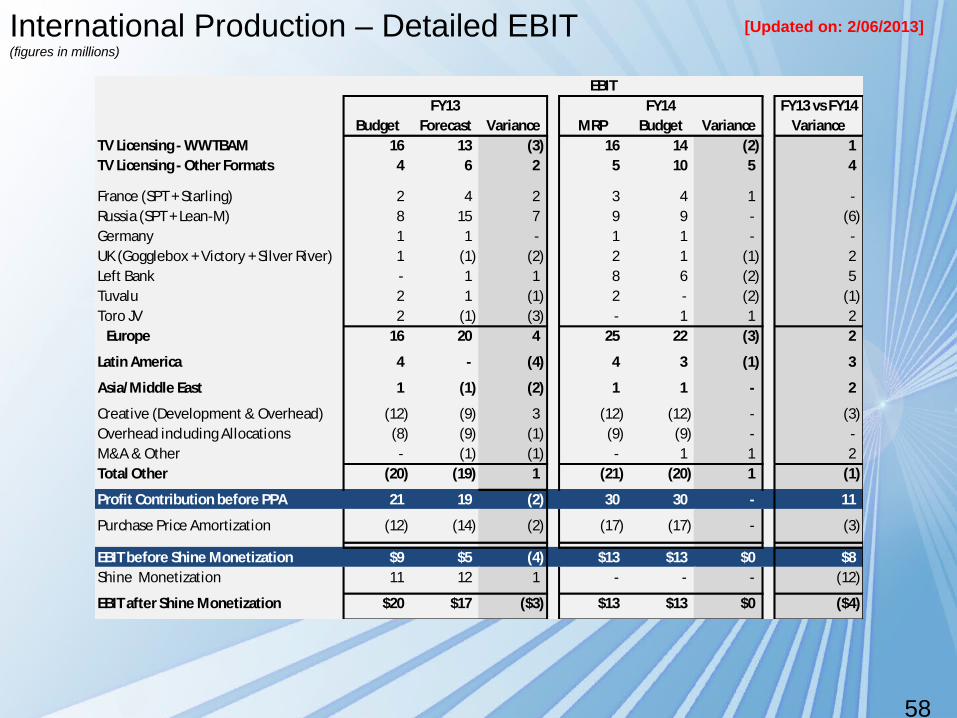
International Production – Detailed EBIT(figures in millions)
[Updated on: 2/06/2013]
EBITFY13 FY14 FY13 vs FY14
Budget Forecast Variance MRP Budget Variance VarianceTV Licensing - WWTBAM 16 13 (3) 16 14 (2) 1 TV Licensing - Other Formats 4 6 2 5 10 5 4
France (SPT + Starling) 2 4 2 3 4 1 - Russia (SPT + Lean-M) 8 15 7 9 9 - (6) Germany 1 1 - 1 1 - - UK (Gogglebox + Victory + Silver River) 1 (1) (2) 2 1 (1) 2 Left Bank - 1 1 8 6 (2) 5 Tuvalu 2 1 (1) 2 - (2) (1) Toro JV 2 (1) (3) - 1 1 2
Europe 16 20 4 25 22 (3) 2
Latin America 4 - (4) 4 3 (1) 3
Asia/Middle East 1 (1) (2) 1 1 - 2
Creative (Development & Overhead) (12) (9) 3 (12) (12) - (3) Overhead including Allocations (8) (9) (1) (9) (9) - - M&A & Other - (1) (1) - 1 1 2 Total Other (20) (19) 1 (21) (20) 1 (1)
Profit Contribution before PPA 21 19 (2) 30 30 - 11
Purchase Price Amortization (12) (14) (2) (17) (17) - (3)
EBIT before Shine Monetization $9 $5 (4) $13 $13 $0 $8Shine Monetization 11 12 1 - - - (12)
EBIT after Shine Monetization $20 $17 ($3) $13 $13 $0 ($4)

59
SPT Financial Summary – Detailed Cash Flow(figures in millions)
[Updated on: 02/06/2013]
FY13
Cashflow Budget Q4 Forecast Variance MRP Budget Variance Distribution* 2,020 2,070 50 2,147 2,085 (62) 15 Production & Ad Sales (396) (432) (36) (484) (522) (38) (90) Networks 214 167 (47) 199 179 (20) 12
Sub-Total 1,838 1,805 (33) 1,862 1,742 (120) (63)
Networks - Uncommitted Investment Funds (56) (17) 39 (87) (81) 6 (64) Int'l Production - Uncommitted Investment Funds (16) (2) 14 (50) (64) (14) (62)
Total Before Monetization and Acquisitions 1,766 1,786 20 1,725 1,597 (128) (189)
Shine Monetization 11 12 1 - (12) IPL Installment (delayed until April 2013) (65) - 65 (58) (61) (3) (61) Accelerated A/R collections in FY13/FY14 - - - - - - - Maa - Operational/Purchase Price - - - 2 (106) (108) (106) MSM Buy Up (144) (145) (1) (56) (56) - 89 IPL Payment/WSG Cash 60 60 60 GSN Dividend to DTV (30) (24) 6 (54) (54) - (30) GSN Put Option Payment/ Interest (126) (122) 4 (122)
Total After Monetization and Acquisitions 1,538 1,629 91 1,433 1,258 (175) (371)
3D Networks (8) (3) 5 (5) (5) - (2)
*For comparative & presentation purposes, Budget has been restated by $11m to include AMAZON
FY13 vs FY14Variance
FY14