BUCKNELL UNIVERSITY FACT BOOK 2019-20
76
Institutional Research & Planning bucknell.edu 2019-20 FACT BOOK
Transcript of BUCKNELL UNIVERSITY FACT BOOK 2019-20

BUCKNELL UNIVERSITY FACT BOOK 2019-20
LEWISBURG, PA 17837
Institutional Research & Planning
bucknell.edu
2019-20 FACT BOOK

INSTITUTIONAL RESEARCH & PLANNING | www.bucknell.edu/IR
FACT BOOK 2019 - 20Table of Contents
Introduction . . . . . . . . . . . . . . . . . . . . . . . . . . . . . . . . . . . . . . . . . . . . . . . . . . . . . .1 Foreword . . . . . . . . . . . . . . . . . . . . . . . . . . . . . . . . . . . . . . . . . . . . . . . . . . .1 Mission of Bucknell University . . . . . . . . . . . . . . . . . . . . . . . . . . . . . . . .2 Vision of Bucknell University . . . . . . . . . . . . . . . . . . . . . . . . . . . . . . . . . .2 Brief History . . . . . . . . . . . . . . . . . . . . . . . . . . . . . . . . . . . . . . . . . . . . . . . .3 Trustees . . . . . . . . . . . . . . . . . . . . . . . . . . . . . . . . . . . . . . . . . . . . . . . . . . . .4 Senior Leadership Team . . . . . . . . . . . . . . . . . . . . . . . . . . . . . . . . . . . . . .6 Academic Divisions . . . . . . . . . . . . . . . . . . . . . . . . . . . . . . . . . . . . . . . . . .6 Accreditation . . . . . . . . . . . . . . . . . . . . . . . . . . . . . . . . . . . . . . . . . . . . . . . .7 University Organizational Chart . . . . . . . . . . . . . . . . . . . . . . . . . . . . . . .8 Provost Area Organizational Chart . . . . . . . . . . . . . . . . . . . . . . . . . . . .9
Admissions . . . . . . . . . . . . . . . . . . . . . . . . . . . . . . . . . . . . . . . . . . . . . . . . . . . . . 11
Enrollment . . . . . . . . . . . . . . . . . . . . . . . . . . . . . . . . . . . . . . . . . . . . . . . . . . . . . . 19
Completions by Field of Study . . . . . . . . . . . . . . . . . . . . . . . . . . . . . . . . . . . . 31
Academics, Co-Curricular and Extracurricular Activities . . . . . . . . . . . . 35
Student Success . . . . . . . . . . . . . . . . . . . . . . . . . . . . . . . . . . . . . . . . . . . . . . . . . 45
Faculty & Staff . . . . . . . . . . . . . . . . . . . . . . . . . . . . . . . . . . . . . . . . . . . . . . . . . . 51
Finance . . . . . . . . . . . . . . . . . . . . . . . . . . . . . . . . . . . . . . . . . . . . . . . . . . . . . . . . . 61
Definitions . . . . . . . . . . . . . . . . . . . . . . . . . . . . . . . . . . . . . . . . . . . . . . . . . . . . . . 65

BUCKNELL UNIVERSITY FACT BOOK | INSTITUTIONAL RESEARCH & PLANNING | INTRODUCTION | 1
BUCKNELL UNIVERSITY FACT BOOK
FOREWORD
The Office of Institutional Research & Planning is pleased to present the 2019-2020 Bucknell University Fact Book. This book is intended as a single, comprehensive, readily accessible and accurate source of information about Bucknell University, and it provides answers to many commonly asked questions about our institution and the people who are part of it, including trends over time.
The 2019-2020 Fact Book reflects Bucknell’s commitment to transparency and accountability, as well as our continuing effort to improve the quality and accessibility of information about our university to internal and external stakeholders. Given the increasing external demand for accurate and readily accessible information, as well as the internal shift in culture toward data-informed decision making at all levels of our institution, we continued to update the existing dashboards and created several new ones that complement the print edition of the Fact Book. The dashboards have added functionality, essentially allowing the stakeholders to conduct real-time analyses to answer specific questions, and it is our hope that they will make the information both more accessible and easier to use. Both the print Fact Book and the dashboards are available at https://www.bucknell.edu/azdirectory/institutional-research-planning.
As in the previous years, we would like to extend our sincere appreciation to all offices that contributed to the creation of the Fact Book by providing us with the requested data as well as sharing their expertise in other ways. We hope that you will find the Fact Book informative and useful. Please let us know if you have any comments or suggestions about how we could improve either the print version or the new dashboard edition in the future.
All the best, Kevork Horissian
INSTITUTIONAL RESEARCH & PLANNING STAFF
Kevork Horissian, Assistant Provost of Institutional Research & AssessmentRita Liu, Associate Director of Institutional ResearchLaura Winger, Reports Coordinator/AnalystWei You, Assessment Coordinator
BUCKNELL UNIVERSITY FACT BOOK | INSTITUTIONAL RESEARCH & PLANNING | INTRODUCTION | 2
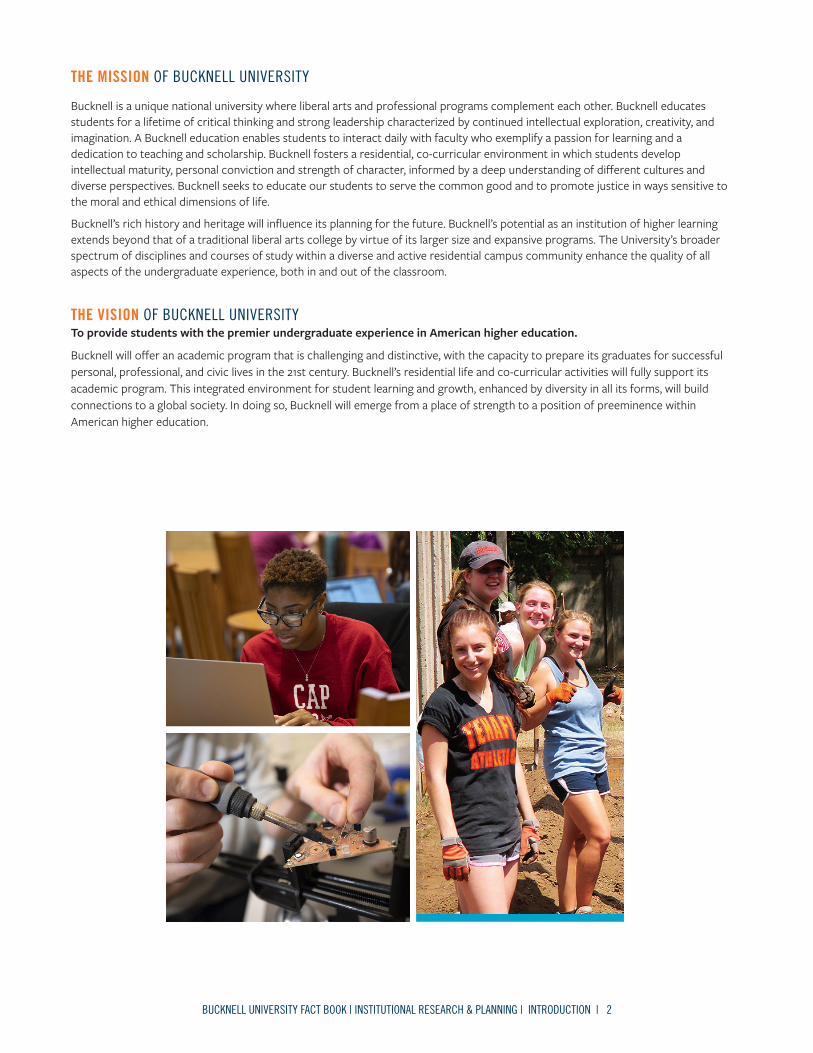
THE MISSION OF BUCKNELL UNIVERSITY
Bucknell is a unique national university where liberal arts and professional programs complement each other. Bucknell educates students for a lifetime of critical thinking and strong leadership characterized by continued intellectual exploration, creativity, and imagination. A Bucknell education enables students to interact daily with faculty who exemplify a passion for learning and a dedication to teaching and scholarship. Bucknell fosters a residential, co-curricular environment in which students develop intellectual maturity, personal conviction and strength of character, informed by a deep understanding of different cultures and diverse perspectives. Bucknell seeks to educate our students to serve the common good and to promote justice in ways sensitive to the moral and ethical dimensions of life.
Bucknell’s rich history and heritage will influence its planning for the future. Bucknell’s potential as an institution of higher learning extends beyond that of a traditional liberal arts college by virtue of its larger size and expansive programs. The University’s broader spectrum of disciplines and courses of study within a diverse and active residential campus community enhance the quality of all aspects of the undergraduate experience, both in and out of the classroom.
THE VISION OF BUCKNELL UNIVERSITY To provide students with the premier undergraduate experience in American higher education.
Bucknell will offer an academic program that is challenging and distinctive, with the capacity to prepare its graduates for successful personal, professional, and civic lives in the 21st century. Bucknell’s residential life and co-curricular activities will fully support its academic program. This integrated environment for student learning and growth, enhanced by diversity in all its forms, will build connections to a global society. In doing so, Bucknell will emerge from a place of strength to a position of preeminence within American higher education.

BUCKNELL UNIVERSITY FACT BOOK | INSTITUTIONAL RESEARCH & PLANNING | INTRODUCTION | 3
Bucknell University was founded in 1846 by a group of Baptists who deemed it “desirable that a Literary Institution should be established in Central Pennsylvania, embracing a High School for male pupils, another for females, a College and also a Theological Institution.”
The charter for the University at Lewisburg was granted by the Legislature of Pennsylvania and approved by the governor on Feb. 5, 1846. Classes were held in the basement of the First Baptist Church in Lewisburg.
In 1850, the University moved into Taylor Hall, the first building completed on campus, which housed both women and men’s studies until the opening of the Female Institute in 1852. The school’s first commencement was held Aug. 20, 1851, for a graduation class of seven men.
The Female Institute began instruction in 1852, with college courses being opened to women in 1883. The first woman graduate was Chella Scott, who received a bachelor’s degree with honors in 1885, and spoke at her commencement.
In 1875, Edward McKnight Brawley was Bucknell’s first African-American graduate, receiving a bachelor’s and master’s degree. He served as president of what became Selma University and Morris College, which he helped to found. Bucknell’s first international student was Maung Shaw Loo, who came from what is now called Myanmar as the first Burmese native to study in the United States; he graduated in 1864 and served many years as a physician in his home country.
The University at Lewisburg was renamed in 1886 in honor of William Bucknell, a charter member of the Board of Trustees and a major benefactor who challenged the board to match his donation. Mr. Bucknell also funded the University’s first scholarship, the first prizes for female students and the building of Commencement Hall, a chapel now named Bucknell Hall and home to the Stadler Center for Poetry.
Today, Bucknell is the nation’s largest private liberal arts university with 3,500 undergraduates on a 450-acre campus. As a highly selective private university, Bucknell offers a personalized and comprehensive liberal arts education to exceptionally talented students from across the U.S. and around the world. It offers academic programs in the arts, engineering, humanities, management, and social and natural sciences as well as the creative and performing arts; facilities for professional-grade instrumentation and spaces for digital and collaborative learning; and broad opportunities outside of class.
Bucknell University is now much more than a literary institution: It is a place that prepares students for success in an increasingly complex and interconnected global society.
A brief history ofBUCKNELL UNIVERSITY

BUCKNELL UNIVERSITY FACT BOOK | INSTITUTIONAL RESEARCH & PLANNING | INTRODUCTION | 4
NAME AFFILIATIONS
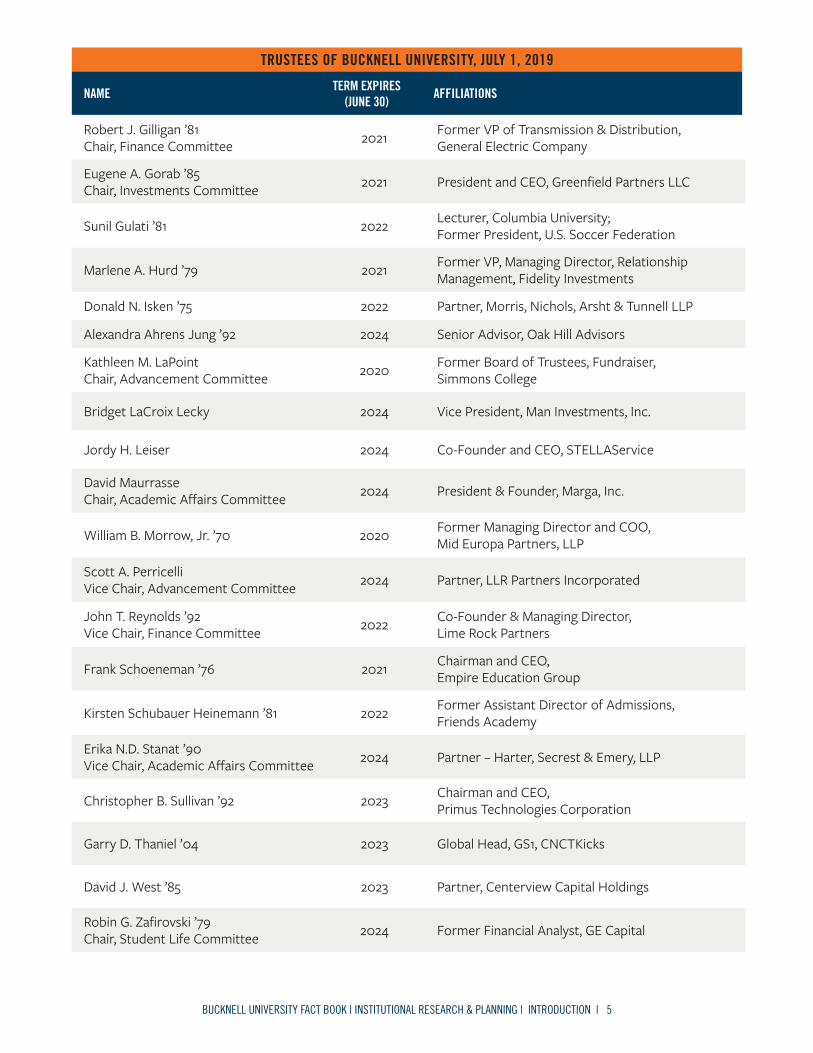
TRUSTEES OF BUCKNELL UNIVERSITY, JULY 1, 2019
TERM EXPIRES(JUNE 30)
Christopher J. O’Brien ’80Chair, Board of TrusteesChair, Executive Committee
2022 President, O’Brien Capital Advisors
Stephen P. Holmes ’79Vice Chair, Board of TrusteesChair, Executive Resources SubcommitteeVice Chair, Human Resources Special Committee
2022 Chairman, Wyndham Hotels & Resorts & Wyndham Destinations
Harriet Edelman ’77Vice Chair, Board of Trustees 2021 Vice Chairman, Emigrant Savings Bank
Steven A. Kohn ’81Secretary, Board of Trustees 2020 President and Vice Chairman, Cushman and
Wakefield Equity, Debt & Structured Finance
Dawn M. Becker ’85Vice Chair, Audit, Compliance & Risk Manage-ment committee
2021 EVP – General Counsel & Secretary, Federal Realty Investment Trust
John C. Bravman President, Bucknell University
Juanita Ora Luckett Brown 2020 President, Brown Business Consulting, LLC
Robert A. Chrencik ’73Currently on Leave of Absence as Bucknell Trustee
2023 Former President and CEO, University of Maryland Medical Center
Laureen R. Costa ’90 2023 Managing Director, Private Equity Group
Frank A. Davis ’82 2024 President and CEO, Horizon Services Corporation
Lisa Cadette Detwiler Vice Chair, Student Life Committee 2022 Realtor, The Corcoran Group
Annie Seibold Drapeau ’88Chair, Human Resources Special CommitteeVice Chair, Executive Resources Subcommittee
2024 Toast, Inc.
Brenda Earl ’81Vice Chair, Investments Committee 2024 Principal, Earl Investments
Jane Taylor Elfers ’83 Chair, Nominating & Governance Committee 2023 President and CEO, The Children’s Place, Inc.
Michael E. Flowers ’76Chair, Audit, Compliance & Risk Management Committee
2022 Attorney, Steptoe & Johnson, PLLC
Makoto Fujimura ’83 2020 Director, Fuller Theological Seminary Brehm Center for Worship, Theology & Arts
BUCKNELL UNIVERSITY FACT BOOK | INSTITUTIONAL RESEARCH & PLANNING | INTRODUCTION | 5
TRUSTEES OF BUCKNELL UNIVERSITY, JULY 1, 2019
NAME AFFILIATIONSTERM EXPIRES(JUNE 30)
Robert J. Gilligan ’81Chair, Finance Committee 2021 Former VP of Transmission & Distribution,
General Electric Company
Eugene A. Gorab ’85Chair, Investments Committee 2021 President and CEO, Greenfield Partners LLC
Sunil Gulati ’81 2022 Lecturer, Columbia University;Former President, U.S. Soccer Federation
Marlene A. Hurd ’79 2021 Former VP, Managing Director, Relationship Management, Fidelity Investments
Donald N. Isken ’75 2022 Partner, Morris, Nichols, Arsht & Tunnell LLP
Alexandra Ahrens Jung ’92 2024 Senior Advisor, Oak Hill Advisors
Kathleen M. LaPoint Chair, Advancement Committee 2020 Former Board of Trustees, Fundraiser,
Simmons College
Bridget LaCroix Lecky 2024 Vice President, Man Investments, Inc.
Jordy H. Leiser 2024 Co-Founder and CEO, STELLAService
David MaurrasseChair, Academic Affairs Committee 2024 President & Founder, Marga, Inc.
William B. Morrow, Jr. ’70 2020 Former Managing Director and COO, Mid Europa Partners, LLP
Scott A. PerricelliVice Chair, Advancement Committee 2024 Partner, LLR Partners Incorporated
John T. Reynolds ’92Vice Chair, Finance Committee 2022 Co-Founder & Managing Director,
Lime Rock Partners
Frank Schoeneman ’76 2021 Chairman and CEO, Empire Education Group
Kirsten Schubauer Heinemann ’81 2022 Former Assistant Director of Admissions,Friends Academy
Erika N.D. Stanat ’90Vice Chair, Academic Affairs Committee 2024 Partner – Harter, Secrest & Emery, LLP
Christopher B. Sullivan ’92 2023 Chairman and CEO, Primus Technologies Corporation
Garry D. Thaniel ’04 2023 Global Head, GS1, CNCTKicks
David J. West ’85 2023 Partner, Centerview Capital Holdings
Robin G. Zafirovski ’79Chair, Student Life Committee 2024 Former Financial Analyst, GE Capital

BUCKNELL UNIVERSITY FACT BOOK | INSTITUTIONAL RESEARCH & PLANNING | INTRODUCTION | 6
SENIOR LEADERSHIP TEAMJohn Bravman, PresidentElisabeth Mermann-Jozwiak, ProvostRaquel Alexander, Dean of the Freeman College of ManagementAmy Badal, Dean of StudentsParam Bedi, Vice President for Library & Information TechnologyHeather Johns, Interim Chief of Communications (concludes 12/31/19)Gail Glover, Vice President for Communications (effect. 1/1/20)Bill Conley, Vice President for Enrollment ManagementPierre Joanis, Vice President for Human Resources and Chief Human Resources OfficerCarol M. Kennedy, Executive Director of the President’s Office and University SecretaryPat Mather, Dean of the College of EngineeringRobert Midkiff, Vice President for Strategic InitiativesKen Ogawa, Associate Vice President for Facilities & SustainabilityKarin Rilley, General CounselScott Rosevear, Vice President for University AdvancementDavid J. Surgala, Vice President for Finance & Administration Jermaine Truax, Director of Athletics & RecreationKarl Voss, Dean of the College of Arts & Sciences
ACADEMIC DIVISIONSThe College of Arts & SciencesThe College of Arts & Sciences has 2,332 degree seeking undergraduate students and 290 full-time faculty members. The College of Arts & Sciences offers programs of study leading to four degrees: the Bachelor of Arts, the Bachelor of Science, the Bachelor of Science in Education, and the Bachelor of Music. The programs are designed to carry out the educational objectives of the University through courses in the arts and humanities, the social sciences, the natural sciences and mathematics.
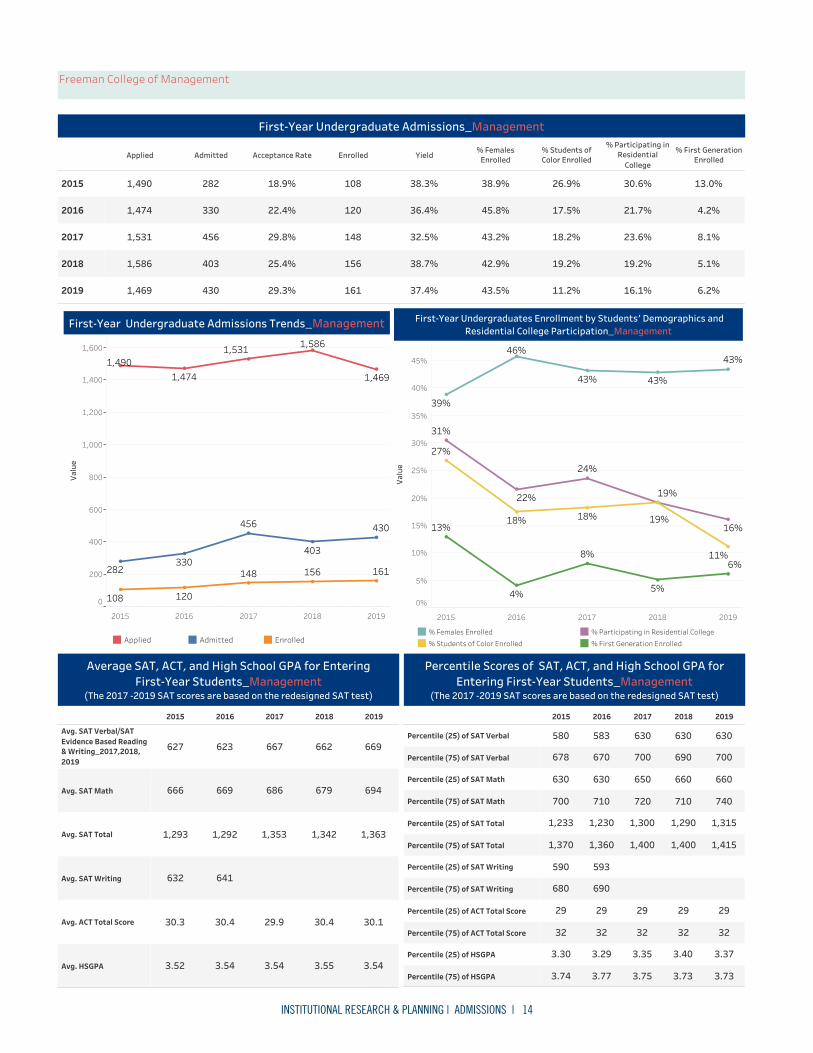
The Freeman College of ManagementThe Freeman College of Management comprises 571 degree seeking undergraduate students and 29 full-time faculty. The College of Management at Bucknell University offers innovative professional education in the context of one of the nation’s leading liberal arts universities. A Bucknell education, combining technical skills and deep intellectual exploration, is preparation for thoughtful and capable leaders. In the classroom, students have the opportunity to follow their passions and develop expertise in sustainable commerce, innovative design thinking, global leadership, and accounting & financial management. The College of Management offers programs of study leading to the degree of Bachelor of Science in Business Administration.
The College of EngineeringThe College of Engineering comprises 705 degree seeking undergraduate students and 71 full-time faculty. The College of Engineering is dedicated to providing outstanding educational opportunities in engineering to a predominantly undergraduate student body of talented men and women. The faculty and courses are organized in six distinct departments: Biomedical Engineering, Chemical Engineering, Civic and Environmental Engineering, Computer Science, Electrical & Computer Engineering, and Mechanical Engineering.
Graduate StudiesBucknell offers three different master’s degrees across seven different programs in the College of Arts & Sciences, and masters of Science degrees in five programs in the College of Engineering. The role of graduate education is to provide “a deepening of the student’s knowledge and experience base in the discipline by building on the increased commitment that graduate students bring to their work.”

BUCKNELL UNIVERSITY FACT BOOK | INSTITUTIONAL RESEARCH & PLANNING | INTRODUCTION | 7
ACCREDITATIONMiddle States AccreditationBucknell was first accredited by the Middle States in 1921. In 2014, Bucknell University completed its decennial reaccreditation with the Middle States Commission on Higher Education. The institution is fully accredited until 2024.
Specialized Programmatic Accreditation and Licensure
• AACSB International – The Association for the Advancement of Collegiate Schools of Business. Less than 5% of the world’s 13,000 business programs have earned AACSB Accreditation.
• ABET - the Accrediting Board for Engineering and Technology, accredits the programs within the College of Engineering.
• ACS - the American Chemical Society is an industry-wide agency that certifies programs within the Department of Chemistry.
• CSAB - the Computer Science Accreditation Board, accredits the Bachelor of Science degree within the College of Arts & Sciences.
• NASM - the National Association of Schools of Music, accredits degree programs within the Department of Music.
• NCAA - the National Collegiate Athletic Association, conducts periodic certification reviews of Bucknell’s athletic programs.
• The Pennsylvania Department of Education oversees teaching certification within the Department of Education.

BUCKNELL UNIVERSITY FACT BOOK | INSTITUTIONAL RESEARCH & PLANNING | INTRODUCTION | 8
John
Bra
vman
Pres
iden
t
Para
m B
edi
Vice
Pre
siden
t Lib
rary
&
Info
rmat
ion
Tech
nolo
gy
Will
iam
Con
ley
Vice
Pre
siden
tEn
rollm
ent M
anag
emen
t
Scot
t Ros
evea
rVP
, Uni
vers
ity A
dvan
cem
ent
Pier
re J
oani
sVP
for H
uman
Res
ourc
esJe
rmai
ne T
ruax
Dir,
Ath
letic
s & R
ecre
atio
n
Elis
abet
hM
erm
ann-
Jozw
iak
Prov
ost
Dav
id S
urga
laVP
, Fin
ance
& A
dmin
istra
tion
Eliz
abet
h St
ewar
tAs
soci
ate
VP,
Trea
sure
r & C
ontr
olle
r
Kenn
eth
Oga
wa
Asso
ciat
e VP
for F
acili
ties
and
Sust
aina
bilit
y
Step
hen
Bari
lar
Chie
f of P
ublic
Saf
ety
John
Lut
hiD
ir, In
vest
men
ts
Karl
Vos
sD
ean
Colle
ge o
f Art
s & S
cien
ces
Patr
ick
Mat
her
Dea
n Co
llege
of E
ngin
eerin
g
Raqu
el A
lexa
nder
Dea
n Fr
eem
an C
olle
ge
of M
anag
emen
t
Amy
Bada
lD
ean
of S
tude
nts
Kath
leen
Gra
ham
Asso
ciat
e VP
for U
nive
rsity
Adva
ncem
ent,
Serv
ices
&
Cam
paig
n
Josh
Gri
llEx
ec D
ir, A
lum
ni R
elat
ions
Gre
gory
Am
aran
teD
ir, A
dvan
cem
ent S
ervi
ces
Pam
ela
Keis
erEx
ec D
ir, C
aree
r Ser
vice
s
Ann
DiS
tefa
noD
ir, P
aren
ts F
und
&
Fam
ily P
rogr
ams
Patr
ick
Flan
nery
Sr A
dviso
r for
Uni
vers
ityAd
vanc
emen
t
Nan
cy W
oodh
ead
Asst
Dir,
Bus
ines
s Ope
ratio
nsUn
iver
sity
Adva
ncem
ent
Mar
cia
Coon
eyD
ir, H
uman
Res
ourc
es S
ervi
ces
Cind
y Bi
lger
Dir,
HRI
S &
Ben
efits
Robe
rt H
euer
Hea
d of
Disc
over
y &
Ac
cess
Ser
vice
s
Clin
t Wev
odau
Dir,
Risk
Man
agem
ent &
In
sura
nce
Caro
l Ken
nedy
Exec
Dir,
Offi
ce o
f the
Pre
siden
t &
Uni
vers
ity S
ecre
tary
Tim
othy
Pav
lech
ko D
eput
y D
irect
or o
f Ath
letic
s
Mai
sha
Kelly
Sr A
ssoc
iate
Dir,
Ath
letic
sSr
Wom
en’s
Adm
inist
rato
r
Todd
New
com
bSr
Ass
ocia
te A
thle
tics
Dir,
Biso
n Cl
ub
Terr
ie G
rieb
Asso
ciat
e D
ir, A
thle
tics
Busin
ess S
ervi
ces
Tre
vor W
oodr
uffH
ead
Wom
en’s
Bask
etba
ll Co
ach
Nat
han
Dav
isH
ead
Men
’s Ba
sket
ball
Coac
h
Kath
erin
e Fu
rlon
gEx
ec D
ir, R
esea
rch
Serv
ices
&
Dig
ital S
chol
arsh
ip
Vaca
ntCh
ief I
nfor
mat
ion
Secu
rity
Offi
cer
Step
hen
O’H
ara
Dir,
Tec
hnol
ogy
Serv
ices
Isab
ella
O’N
eill
Hea
d of
Spe
cial
Col
lect
ions
&
Univ
ersit
y Ar
chiv
ist
Kevi
n M
athe
sD
ean
of A
dmiss
ions
And
rea
Leith
ner
Stau
ffer
Dir,
Fin
anci
al A
id
Lisa
Sco
ttSr
Dir,
Cre
ativ
e Se
rvic
es
Mic
hael
Fer
lazz
oD
ir, M
edia
Rel
atio
ns
Pam
ela
Benf
erD
ir, B
usin
ess O
pera
tions
,Pr
ovos
t’s O
ffice
Kare
n M
orin
Asso
ciat
e Pr
ovos
t
Kevo
rk H
oris
sian
Asst
Pro
vost
, Ins
titut
iona
l Re
sear
ch &
Ass
essm
ent
Hea
ther
Joh
nsSr
Dir,
Con
tent
Str
ateg
y
Kari
n Ri
lley
Gen
eral
Cou
nsel
Gai
l Glo
ver
VP C
omm
unic
atio
ns
Dav
id C
ecch
ini
Hea
d Fo
otba
ll Co
ach
Jenn
ifer K
ente
raSr
Ass
ocia
te A
thle
tics
Dir,
Lea
ders
hip
Dev
elop
men
t
Robe
rt M
idki
ffVi
ce P
rovo
st
Vaca
ntAs
soci
ate
Prov
ost
Div
ersit
y, E
quity
& In
clus
ion
Jam
ie J
orda
nD
ir, A
dvan
cem
ent M
arke
ting
& R
esea
rch
Stra
tegy
Luci
lle T
arin
Ex D
ir, A
dvan
cem
ent
Stra
tegy
Inte
grat
ion
Vaca
ntSr
Ex
Dir,
Str
ateg
ic
Proc
urem
ent,
Cont
ract
M
anag
emen
t &
Com
mun
ity R
elat
ions
Dan
a M
ims
Exec
Dire
ctor
Even
ts M
anag
emen
t Offi
ce
Lori
Wils
onD
ir, B
usin
ess
Serv
ices
Vaca
ntAs
sista
nt C
ouns
el
Lisa
Vel
ozD
ir, P
roje
ct &
Initi
ativ
e M
anag
emen
t
Kevi
n W
illey
Ex D
irEn
terp
rise
Tech
nolo
gies
Upd
ated
: Jun
e, 2
019
BUCK
NELL
UNI
VERS
ITY
Org
aniz
atio
nal C
hart

BUCKNELL UNIVERSITY FACT BOOK | INSTITUTIONAL RESEARCH & PLANNING | INTRODUCTION | 9
Elis
abet
h M
erm
ann-
Jozw
iak
Prov
ost
Kare
n Ca
stle
Asso
c D
ean
of
Nat
ural
Sci
ence
s &
Mat
hem
atic
s
Mic
hael
Jam
esAs
soc
Dea
n of
Soc
ial
Scie
nces
Kim
Cou
ncill
Asso
c D
ean
of A
rts
& H
uman
ities
Erin
Jab
lons
kiAs
soc
Dea
n of
En
gine
erin
g
Lois
Eng
leEn
gine
erin
g O
pera
tions
Ad
min
& M
gr; E
ngin
eerin
gEx
tern
al R
elat
ions
Dan
Joh
nson
Dir
PDL
Mon
ica
Hoo
ver
Dir
Envi
ron
Eng
& S
cien
ce L
ab
Stev
e St
umbr
isD
ir SB
DC
6 ac
adem
icde
part
men
ts
Jane
Gra
ssad
onia
Asso
c D
ean
of S
tude
nts
for L
ivin
g, L
earn
ing
& L
eade
rshi
p
Kath
leen
Gri
mes
Title
IX C
oord
inat
or
Robe
rt G
utie
rrez
Ex
ec D
ir O
ffice
of
Spon
sore
d Pr
ojec
ts
Rich
ard
Rine
hart
Dir
Sam
ek A
rt
Gal
lery
Kath
ryn
Mag
uet
Exec
Dir
Wei
s Cen
ter
Suza
nne
Gui
odD
ir Bu
ckne
ll Un
iver
sity
Pres
s
Pete
r Jan
sson
Facu
lty D
ir Ce
nter
for
Sust
aina
bilit
y &
th
e En
viro
nmen
t
Mel
issa
Web
er /
Tim
Kra
cker
Asso
c Re
gist
rars
Vinc
e Pe
llegr
ini
Asst
Reg
istra
r for
Acad
emic
Sch
edul
ing
Rich
Rob
bins
Asso
c D
ean
of A
rts
& S
cien
ces
Step
hen
Appi
ah-P
adi
Dir
Glo
bal &
O
ff-ca
mpu
s Edu
catio
n
Rita
Liu
Asso
c D
ir In
stitu
tiona
l Re
sear
ch
Lynn
Bre
yfog
leAs
soc
Dea
n of
Art
s &
Sci
ence
s
Robe
rt M
idki
ff J
r.Vi
ce P
resid
ent f
or
Stra
tegi
c In
itiat
ives
Nik
ki Y
oung
Inte
rim A
ssoc
Pro
vost
fo
r Div
ersit
y, Eq
uity
&
Incl
usio
n
Kevo
rk H
oris
sian
Asst
Pro
vost
for
Inst
itutio
nal R
esea
rch
& A
sses
smen
t
Pam
ela
Benf
erD
ir Bu
sines
s O
pera
tions
Kare
n M
orin
Asso
c Pr
ovos
tfo
r Sch
olar
ship
Amy
Bada
lD
ean
of S
tude
nts
Patr
ick
Mat
her
Dea
n, C
olle
ge o
f En
gine
erin
g
Karl
Vos
sD
ean,
Col
lege
of
Art
s & S
cien
ces
Joe
Tran
quill
oD
ir Te
achi
ng &
Le
arni
ng C
ente
r
Cym
one
Four
shey
Actin
gD
ir G
riot I
nstit
ute
Ther
esa
Cusi
man
o
Jan
Knoe
dler
Kat W
akab
ayas
hiCo
-Dir
Resid
entia
l Col
lege
s
25 d
epar
tmen
ts;
6 pr
ogra
ms
Mar
gare
t Mar
rD
ir Un
derg
radu
ate
Fello
wsh
ips &
Res
earc
h
Laur
a W
inge
rRe
port
s Co
ordi
nato
r/Ana
lyst
Wei
You
Asse
ssm
ent
Coor
dina
tor
LTC
Nic
hola
sG
riffi
ths
ROTC
Nic
ole
Pers
unO
pera
tions
M
anag
er
Hea
ther
LeB
lanc
Life
long
Lea
rnin
g O
ffice
Ass
istan
t
Raqu
el A
lexa
nder
Dea
n, F
reem
an C
olle
ge
of M
anag
emen
t
Mih
ai B
anci
uAs
soc
Dea
n of
Fa
culty
Ivy
Kepn
erAs
st D
ean
of
Man
agem
ent
Kari
Con
rad
Asso
c D
ean
of S
tude
nts f
or
Activ
ities
& P
rogr
ams
Jeff
rey
Van
Lone
Asso
c D
ean
of
Stud
ents
for H
ealth
&
Wel
lnes
s
Den
elle
Bro
wn
Asso
c D
ean
of S
tude
nts
Div
ersit
y &
Incl
usio
n
Upd
ated
: Oct
ober
30,
201
9
Terr
i Nor
ton
Asso
c D
ean
for S
tude
nts
& S
trat
egic
Initi
ativ
es
Angè
le K
ingu
éSp
ecia
l Adv
iser t
o th
ePr
ovos
t for
Fac
ulty
Dev
elop
men
t
4 ac
adem
icde
part
men
ts
Hea
ther
Fow
ler
Dir
Acce
ssib
ility
Re
sour
ces
Dir
Civi
c En
gage
men
t &
Ser
vice
Lea
rnin
g
Dei
rdre
O’C
onno
r D
ir W
ritin
g Ce
nter
PROV
OST
AREA
Org
aniz
atio
nal C
hart

FACT BOOK BUCKNELL UNIVERSITY
ADMISSIONS

INSTITUTIONAL RESEARCH & PLANNING | ADMISSIONS | 11
ADMISSIONS BUCKNELL UNIVERSITYAdmissions Bucknell University
Applied Admitted Acceptance Rate Enrolled Yield% Females
Enrolled% Students ofColor Enrolled
% Participating inResidential
College
% First GenerationEnrolled
2015
2016
2017
2018
2019 9.8%
10.8%
10.5%
9.3%
11.7%
37.3%
36.3%
38.7%
35.4%
36.0%
16.9%
20.7%
21.7%
17.7%
23.3%
52.4%
52.9%
51.3%
50.1%
51.4%
28.6%
29.1%
30.5%
30.3%
34.5%
964
974
973
950
938
34.2%
33.0%
31.1%
29.9%
24.8%
3,370
3,352
3,187
3,138
2,718
9,845
10,144
10,253
10,487
10,967
First-Year Undergraduate Admissions
2015 2016 2017 2018 2019
Avg. SAT Verbal/SATEvidence Based Reading& Writing_2017,2018,2019
Avg. SAT Math
Avg. SAT Total
Avg. SAT Writing
Avg. ACT Total Score
Avg. HSGPA 3.58
29.9
1,340
682
658
3.56
30.0
1,336
680
657
3.55
29.5
1,332
675
657
3.52
29.9
637
1,292
663
629
3.54
29.7
636
1,299
664
635
Average SAT, ACT, and High School GPA for EnteringFirst-Year Students
(The 2017 -2019 SAT scores are based on the redesigned SAT test)
2015 2016 2017 2018 2019
Percentile (25) of SAT Verbal
Percentile (75) of SAT Verbal
Percentile (25) of SAT Math
Percentile (75) of SAT Math
Percentile (25) of SAT Total
Percentile (75) of SAT Total
Percentile (25) of SAT Writing
Percentile (75) of SAT Writing
Percentile (25) of ACT Total Score
Percentile (75) of ACT Total Score
Percentile (25) of HSGPA
Percentile (75) of HSGPA 3.82
3.37
32
28
1,410
1,280
730
640
700
620
3.83
3.35
32
28
1,420
1,260
730
630
690
620
3.80
3.33
31
28
1,410
1,260
720
630
700
620
3.79
3.29
32
28
690
590
1,380
1,220
710
610
670
590
3.82
3.29
32
28
690
590
1,380
1,230
705
620
680
590
Percentile Scores of SAT, ACT, and High School GPA forEntering First-Year Students
(The 2017 -2019 SAT scores are based on the redesigned SAT test)
All Undergraduate CollegesAll
2015 2016 2017 2018 2019
0
2,000
4,000
6,000
8,000
10,000
Valu
e
10,967
10,25310,487
3,138
3,187
10,144
2,718
9,845
3,352 3,370
964938 950 973
974
First-Year Undergraduate Admissions Trends
Applied Admitted Enrolled
2015 2016 2017 2018 2019
0%
10%
20%
30%
40%
50%Va
lue
21%22%
36%
10%
51%
51%
37%39%36%
11%
23%
17%
50%
12%18%
10%
52%53%
9%
35%
First-Year Undergraduates Enrollment by Students' Demographics andResidential College Participation
% Females Enrolled% Students of Color Enrolled
% Participating in Residential College% First Generation Enrolled

INSTITUTIONAL RESEARCH & PLANNING | ADMISSIONS | 12
Applied Admitted Acceptance Rate Enrolled Yield% Females
Enrolled% Students ofColor Enrolled
% Participating inResidential
College
% First GenerationEnrolled
2015
2016
2017
2018
2019 9.6%
10.9%
11.1%
11.0%
11.0%
31.8%
39.5%
39.5%
33.1%
32.0%
19.9%
21.1%
22.9%
17.8%
22.1%
61.9%
62.9%
58.5%
56.4%
58.9%
30.1%
30.4%
32.0%
32.5%
35.5%
604
631
638
635
643
35.9%
36.6%
34.8%
32.9%
29.2%
2,008
2,077
1,994
1,955
1,812
5,600
5,671
5,727
5,945
6,207
First-Year Undergraduate Admissions_A&S
2015 2016 2017 2018 2019
Avg. SAT Verbal/SATEvidence Based Reading& Writing_2017,2018,2019
Avg. SAT Math
Avg. SAT Total
Avg. SAT Writing
Avg. ACT Total Score
Avg. HSGPA 3.54
29.3
1,316
665
651
3.53
29.6
1,315
664
651
3.51
29.0
1,311
660
651
3.48
29.5
633
1,273
649
624
3.49
29.3
638
1,283
649
634
Average SAT, ACT, and High School GPA for EnteringFirst-Year Students_A&S
(The 2017 -2019 SAT scores are based on the redesigned SAT test)
2015 2016 2017 2018 2019
Percentile (25) of SAT Verbal
Percentile (75) of SAT Verbal
Percentile (25) of SAT Math
Percentile (75) of SAT Math
Percentile (25) of SAT Total
Percentile (75) of SAT Total
Percentile (25) of SAT Writing
Percentile (75) of SAT Writing
Percentile (25) of ACT Total Score
Percentile (75) of ACT Total Score
Percentile (25) of HSGPA
Percentile (75) of HSGPA 3.80
3.31
31
28
1,390
1,250
710
610
690
620
3.81
3.31
32
28
1,400
1,240
720
610
690
610
3.78
3.29
31
27
1,400
1,230
710
600
700
610
3.75
3.26
31
28
690
590
1,360
1,180
700
600
670
580
3.75
3.26
31
28
690
590
1,360
1,210
690
610
680
583
Percentile Scores of SAT, ACT, and High School GPA forEntering First-Year Students_A&S
(The 2017 -2019 SAT scores are based on the redesigned SAT test)
College of Arts & Sciences
2015 2016 2017 2018 2019
0
1,000
2,000
3,000
4,000
5,000
6,000
Valu
e
6,207
5,7275,945
5,671
1,955
1,994 2,0081,812
5,600
631
604635
2,077
638643
First-Year Undergraduate Admissions Trends_A&S
Applied Admitted Enrolled
2015 2016 2017 2018 2019
0%
10%
20%
30%
40%
50%
60%
Valu
e
59%
33%
21%
58%
20%18%
32%
56%
22%
32%
63%
10%
62%
11%
11%
39%
11%
39%
11%
23%
First-Year Undergraduates Enrollment by Students' Demographics andResidential College Participation_A&S
% Females Enrolled% Students of Color Enrolled
% Participating in Residential College% First Generation Enrolled

INSTITUTIONAL RESEARCH & PLANNING | ADMISSIONS | 13
Applied Admitted Acceptance Rate Enrolled Yield% Females
Enrolled% Students ofColor Enrolled
% Participating inResidential
College
% First GenerationEnrolled
2015
2016
2017
2018
2019 13.1%
15.0%
10.2%
6.7%
13.4%
71.4%
40.1%
48.1%
51.3%
52.9%
12.6%
20.9%
20.3%
17.4%
25.7%
30.7%
27.3%
33.2%
32.3%
32.6%
21.4%
21.4%
25.4%
22.9%
30.0%
199
187
187
195
187
33.6%
30.2%
24.6%
27.8%
19.1%
932
872
737
853
624
2,776
2,887
2,995
3,068
3,270
First-Year Undergraduate Admissions_Engineering
2015 2016 2017 2018 2019
Avg. SAT Verbal/SATEvidence Based Reading& Writing_2017,2018,2019
Avg. SAT Math
Avg. SAT Total
Avg. SAT Writing
Avg. ACT Total Score
Avg. HSGPA 3.70
31.9
1,388
719
669
3.68
31.0
1,398
728
670
3.66
31.2
1,381
715
669
3.64
31.0
648
1,363
710
653
3.70
31.0
634
1,353
709
644
Average SAT, ACT, and High School GPA for EnteringFirst-Year Students_Engineering
(The 2017 -2019 SAT scores are based on the redesigned SAT test)
2015 2016 2017 2018 2019
Percentile (25) of SAT Verbal
Percentile (75) of SAT Verbal
Percentile (25) of SAT Math
Percentile (75) of SAT Math
Percentile (25) of SAT Total
Percentile (75) of SAT Total
Percentile (25) of SAT Writing
Percentile (75) of SAT Writing
Percentile (25) of ACT Total Score
Percentile (75) of ACT Total Score
Percentile (25) of HSGPA
Percentile (75) of HSGPA 3.91
3.55
34
31
1,460
1,320
760
680
710
640
3.93
3.52
33
29
1,460
1,350
770
700
710
640
3.89
3.50
33
30
1,450
1,310
760
680
713
620
3.88
3.45
33
29
690
610
1,420
1,318
760
670
700
600
3.94
3.48
33
30
670
595
1,420
1,290
750
670
680
600
Percentile Scores of SAT, ACT, and High School GPA forEntering First-Year Students_Engineering
(The 2017 -2019 SAT scores are based on the redesigned SAT test)
College of Engineering
2015 2016 2017 2018 2019
0
500
1,000
1,500
2,000
2,500
3,000
Valu
e
3,2702,995
3,068 2,887
853
624737
872
2,776
932
199187187195187
First-Year Undergraduate Admissions Trends_Engineering
Applied Admitted Enrolled
2015 2016 2017 2018 2019
0%
10%
20%
30%
40%
50%
60%
70%
Valu
e53% 51%
71%
48%
20% 21%
17%
13%
13%
31%
10%7%
13%
27%26% 32%
40%33% 33%
15%
First-Year Undergraduates Enrollment by Students' Demographics andResidential College Participation_Engineering
% Females Enrolled% Students of Color Enrolled
% Participating in Residential College% First Generation Enrolled
INSTITUTIONAL RESEARCH & PLANNING | ADMISSIONS | 14
Applied Admitted Acceptance Rate Enrolled Yield% Females
Enrolled% Students ofColor Enrolled
% Participating inResidential
College
% First GenerationEnrolled
2015
2016
2017
2018
2019 6.2%
5.1%
8.1%
4.2%
13.0%
16.1%
19.2%
23.6%
21.7%
30.6%
11.2%
19.2%
18.2%
17.5%
26.9%
43.5%
42.9%
43.2%
45.8%
38.9%
37.4%
38.7%
32.5%
36.4%
38.3%
161
156
148
120
108
29.3%
25.4%
29.8%
22.4%
18.9%
430
403
456
330
282
1,469
1,586
1,531
1,474
1,490
First-Year Undergraduate Admissions_Management
2015 2016 2017 2018 2019
Avg. SAT Verbal/SATEvidence Based Reading& Writing_2017,2018,2019
Avg. SAT Math
Avg. SAT Total
Avg. SAT Writing
Avg. ACT Total Score
Avg. HSGPA 3.54
30.1
1,363
694
669
3.55
30.4
1,342
679
662
3.54
29.9
1,353
686
667
3.54
30.4
641
1,292
669
623
3.52
30.3
632
1,293
666
627
Average SAT, ACT, and High School GPA for EnteringFirst-Year Students_Management
(The 2017 -2019 SAT scores are based on the redesigned SAT test)
2015 2016 2017 2018 2019
Percentile (25) of SAT Verbal
Percentile (75) of SAT Verbal
Percentile (25) of SAT Math
Percentile (75) of SAT Math
Percentile (25) of SAT Total
Percentile (75) of SAT Total
Percentile (25) of SAT Writing
Percentile (75) of SAT Writing
Percentile (25) of ACT Total Score
Percentile (75) of ACT Total Score
Percentile (25) of HSGPA
Percentile (75) of HSGPA 3.73
3.37
32
29
1,415
1,315
740
660
700
630
3.73
3.40
32
29
1,400
1,290
710
660
690
630
3.75
3.35
32
29
1,400
1,300
720
650
700
630
3.77
3.29
32
29
690
593
1,360
1,230
710
630
670
583
3.74
3.30
32
29
680
590
1,370
1,233
700
630
678
580
Percentile Scores of SAT, ACT, and High School GPA forEntering First-Year Students_Management
(The 2017 -2019 SAT scores are based on the redesigned SAT test)
Freeman College of Management
2015 2016 2017 2018 2019
0
200
400
600
800
1,000
1,200
1,400
1,600
Valu
e
1,490
403
1,531 1,586
282
430
330148
1,474 1,469
108
156
120
456
161
First-Year Undergraduate Admissions Trends_Management
Applied Admitted Enrolled
2015 2016 2017 2018 2019
0%
5%
10%
15%
20%
25%
30%
35%
40%
45%
Valu
e
19%18%
22%
18%
24%
31%
8%
27%
43%
19%
6%
13%
43%
43%
11%
39%
5%
16%
46%
4%
First-Year Undergraduates Enrollment by Students' Demographics andResidential College Participation_Management
% Females Enrolled% Students of Color Enrolled
% Participating in Residential College% First Generation Enrolled
INSTITUTIONAL RESEARCH & PLANNING | ADMISSIONS | 15
Applied AdmittedAcceptance
RateEnrolled Yield
2015
2016
2017
2018
2019 25.1%
29.1%
32.6%
31.7%
30.4%
54
65
59
69
51
16.6%
16.1%
14.2%
16.3%
12.7%
215
223
181
218
168
1,296
1,381
1,274
1,341
1,326
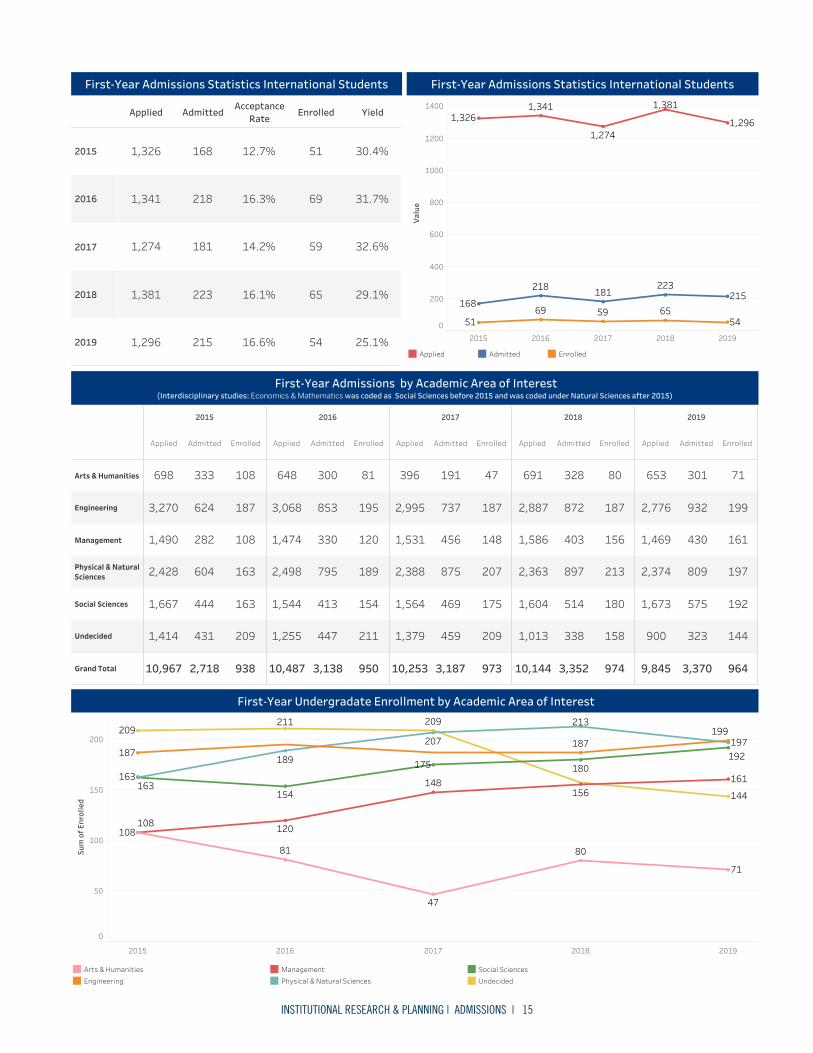
First-Year Admissions Statistics International Students
2015 2016 2017 2018 20190
200
400
600
800
1000
1200
1400
Valu
e
1,3261,341 1,381
1,296
215
1,274
168
218
59
181223
65695451
First-Year Admissions Statistics International Students
Applied Admitted Enrolled
2015
Applied Admitted Enrolled
2016
Applied Admitted Enrolled
2017
Applied Admitted Enrolled
2018
Applied Admitted Enrolled
2019
Applied Admitted Enrolled
Arts & Humanities
Engineering
Management
Physical & NaturalSciences
Social Sciences
Undecided
Grand Total 938
209
163
163
108
187
108
2,718
431
444
604
282
624
333
10,967
1,414
1,667
2,428
1,490
3,270
698
950
211
154
189
120
195
81
3,138
447
413
795
330
853
300
10,487
1,255
1,544
2,498
1,474
3,068
648
973
209
175
207
148
187
47
3,187
459
469
875
456
737
191
10,253
1,379
1,564
2,388
1,531
2,995
396
974
158
180
213
156
187
80
3,352
338
514
897
403
872
328
10,144
1,013
1,604
2,363
1,586
2,887
691
964
144
192
197
161
199
71
3,370
323
575
809
430
932
301
9,845
900
1,673
2,374
1,469
2,776
653
First-Year Admissions by Academic Area of Interest(Interdisciplinary studies: Economics & Mathematics was coded as Social Sciences before 2015 and was coded under Natural Sciences after 2015)
2015 2016 2017 2018 2019
0
50
100
150
200
Sum
of E
nrol
led
8081
197
71
189
148
175163
209209
144
108
47
211
180
108
207
156163
120
192
154
199187
187
161
213
First-Year Undergradate Enrollment by Academic Area of Interest
Arts & HumanitiesEngineering
ManagementPhysical & Natural Sciences
Social SciencesUndecided
INSTITUTIONAL RESEARCH & PLANNING | ADMISSIONS | 16
Year2015 2016 2017 2018 2019
Mid-Atlantic D.C.
Delaware
Maryland
New Jersey
New York
Pennsylvania
Midwest Illinois
Indiana
Iowa
Michigan
Minnesota
Missouri
Ohio
Wisconsin
NewEngland
Connecticut
Maine
Massachusetts
New Hampshire
Rhode Island
Vermont
South Alabama
Florida
Georgia
Kentucky
Louisiana
North Carolina
South Carolina
Tennessee
Virginia
Southwest Arkansas
New Mexico
Texas
West Arizona
California
Colorado
Hawaii
Idaho
Nevada
Oregon
Utah
Washington
Grand Total
1971251727266
1911581795558
1901341706536
1501541865236
1821421865013
220522
115
212
45
217
213131
218
213322
320
1103441
16
242
673
73
561
621
80
459
707
78
154
606
77
41
695
75
262
7
3181
18
10
21291
27
11143
15
25
28126
111
23337
412
16171110
1
51
1111
5432
212
1
534
2
1
16
532
5
411
5452
1
221
7542
903907918879884
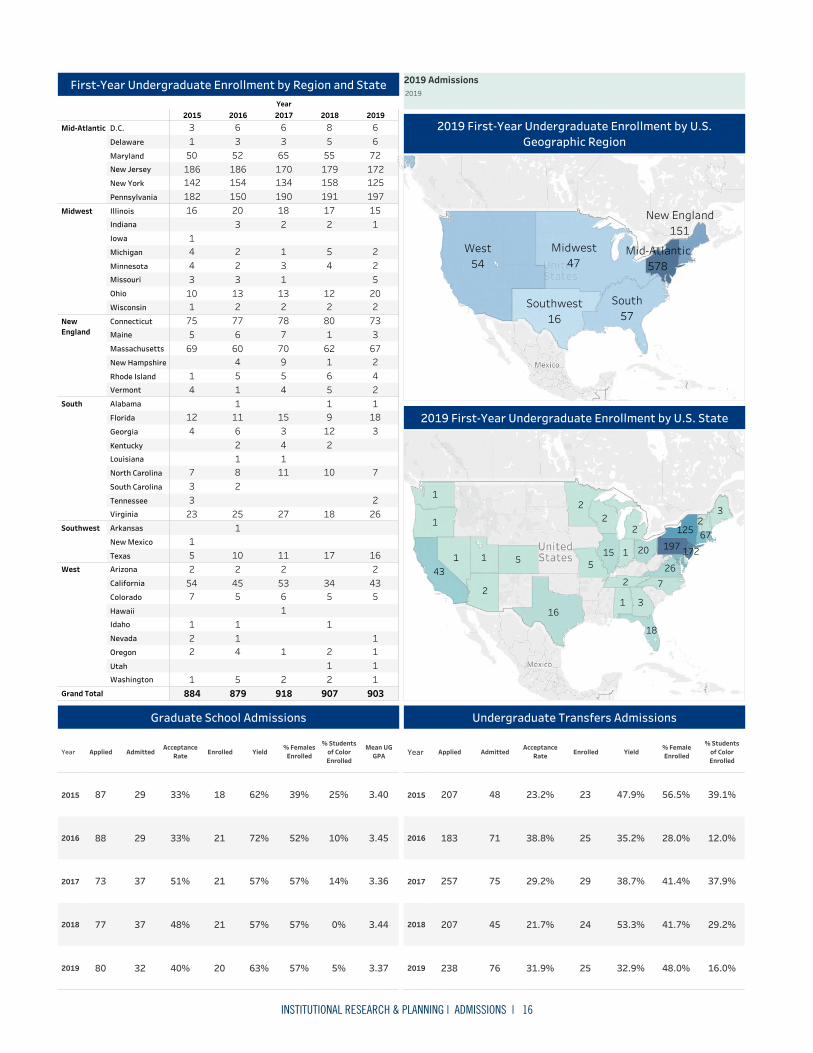
First-Year Undergraduate Enrollment by Region and State
West54
New England151
Mid-Atlantic578
Southwest16
Midwest47
South57
2019 First-Year Undergraduate Enrollment by U.S.Geographic Region
172
125
197
18
43
67
15 20
16
261
3
2
2
51
12
7
5
1
2
1
2
3
1
2
2019 First-Year Undergraduate Enrollment by U.S. State
2019 Admissions2019
Year Applied AdmittedAcceptance
Rate Enrolled Yield% Females
Enrolled
% Studentsof ColorEnrolled
Mean UGGPA
2015
2016
2017
2018
2019 3.37
3.44
3.36
3.45
3.40
5%
0%
14%
10%
25%
57%
57%
57%
52%
39%
63%
57%
57%
72%
62%
20
21
21
21
18
40%
48%
51%
33%
33%
32
37
37
29
29
80
77
73
88
87
Graduate School Admissions
Year Applied AdmittedAcceptance
Rate Enrolled Yield% FemaleEnrolled
% Studentsof ColorEnrolled
2015
2016
2017
2018
2019 16.0%
29.2%
37.9%
12.0%
39.1%
48.0%
41.7%
41.4%
28.0%
56.5%
32.9%
53.3%
38.7%
35.2%
47.9%
25
24
29
25
23
31.9%
21.7%
29.2%
38.8%
23.2%
76
45
75
71
48
238
207
257
183
207
Undergraduate Transfers Admissions

INSTITUTIONAL RESEARCH & PLANNING | ADMISSIONS | 17
1United Arab Emirates
1Nigeria
1United Kingdom
3South Korea
3South Korea
1Zimbabwe
1Romania
2Pakistan
6Vietnam
6Vietnam
1Lebanon
1Jamaica
1Sweden
1Norway1
Canada
1Taiwan
1Taiwan
1Poland
1France
3Ghana
1Egypt
29China
29China
2India
© 2020 Mapbox © OpenStreetMap
2019 First-Year Undergraduate Enrollment by Global Geographic (United States is Excluded)
0 2 4 6 8 10 12 14 16 18 20 22 24 26 28 30 32
Students
China
Vietnam
South Korea
Ghana
Pakistan
India
Zimbabwe
United Kingdom
United Arab Emirates
Taiwan
Sweden
Romania
Poland
Norway
Nigeria
Lebanon
Jamaica
France
Egypt
Canada 1
1
1
1
1
1
1
1
1
1
1
1
1
1
2
2
3
3
6
29
2019 First-year Undergraduate Enrollment by Global Nations(United States is Excluded)

FACT BOOK BUCKNELL UNIVERSITY
ENROLLMENT
INSTITUTIONAL RESEARCH & PLANNING | ENROLLMENT | 19
ENROLLMENT BUCKNELL UNIVERSITYEnrollment Bucknell University
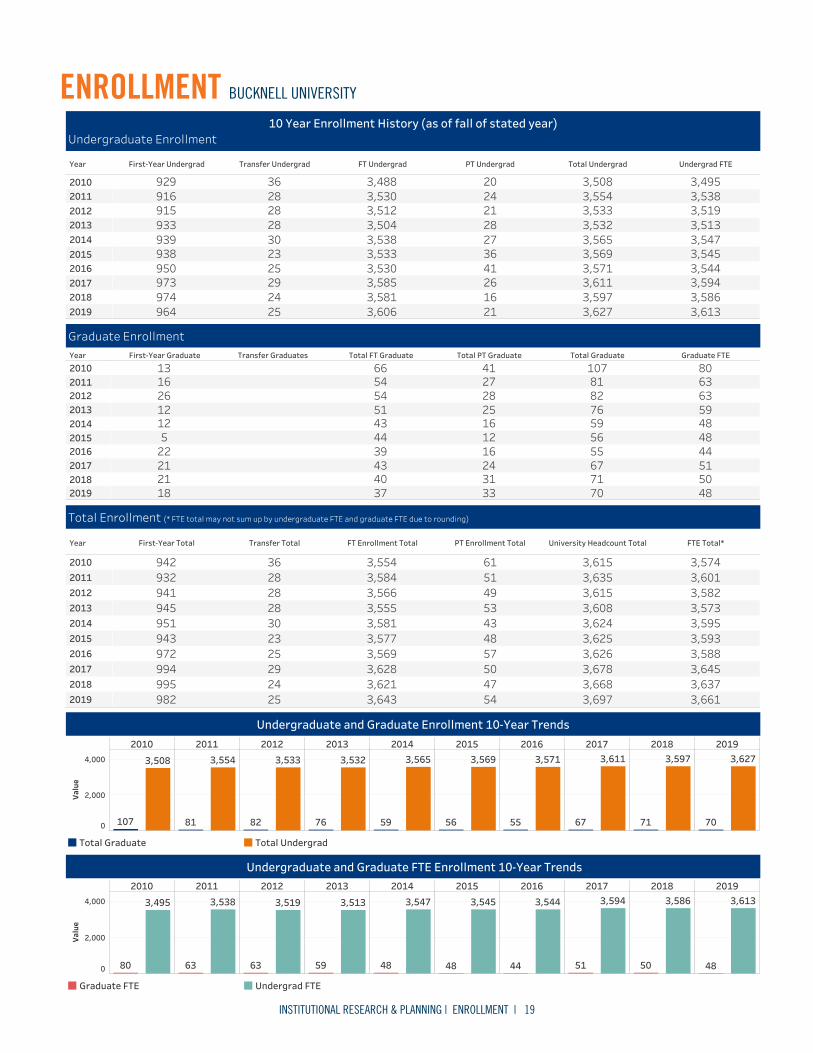
Year First-Year Undergrad Transfer Undergrad FT Undergrad PT Undergrad Total Undergrad Undergrad FTE
2010201120122013201420152016201720182019 3,613
3,5863,5943,5443,5453,5473,5133,5193,5383,495
3,6273,5973,6113,5713,5693,5653,5323,5333,5543,508
21162641362728212420
3,6063,5813,5853,5303,5333,5383,5043,5123,5303,488
25242925233028282836
964974973950938939933915916929
10 Year Enrollment History (as of fall of stated year)Undergraduate Enrollment
Year First-Year Graduate Transfer Graduates Total FT Graduate Total PT Graduate Total Graduate Graduate FTE
2010201120122013201420152016201720182019 48
505144484859636380
707167555659768281
107
33312416121625282741
37404339444351545466
182121225
1212261613
Graduate Enrollment
Year First-Year Total Transfer Total FT Enrollment Total PT Enrollment Total University Headcount Total FTE Total*
2010201120122013201420152016201720182019 3,661
3,6373,6453,5883,5933,5953,5733,5823,6013,574
3,6973,6683,6783,6263,6253,6243,6083,6153,6353,615
54475057484353495161
3,6433,6213,6283,5693,5773,5813,5553,5663,5843,554
25242925233028282836
982995994972943951945941932942
Total Enrollment (* FTE total may not sum up by undergraduate FTE and graduate FTE due to rounding)
2010 2011 2012 2013 2014 2015 2016 2017 2018 2019
0
2,000
4,000
Value
3,495
80
3,538
63
3,519
63
3,513
59
3,547
48
3,545
48
3,544
44
3,594
51
3,586
50
3,613
48
Undergraduate and Graduate FTE Enrollment 10-Year Trends
Graduate FTE Undergrad FTE
2010 2011 2012 2013 2014 2015 2016 2017 2018 2019
0
2,000
4,000
Value
3,508
107
3,554
81
3,533
82
3,532
76
3,565
59
3,569
56
3,571
55
3,611
67
3,597
71
3,627
70
Undergraduate and Graduate Enrollment 10-Year Trends
Total Graduate Total Undergrad
INSTITUTIONAL RESEARCH & PLANNING | ENROLLMENT | 20
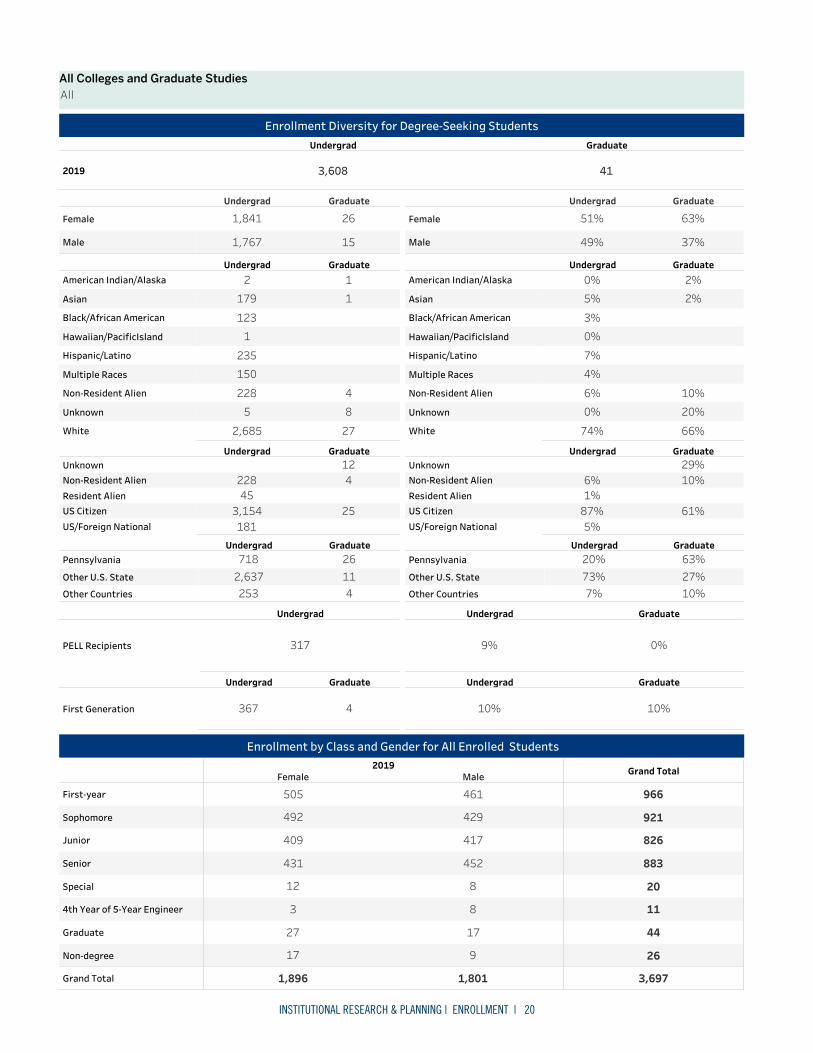
Undergrad Graduate
Female
Male 15
26
1,767
1,841
Undergrad GraduateAmerican Indian/Alaska
Asian
Black/African American
Hawaiian/PacificIsland
Hispanic/Latino
Multiple Races
Non-Resident Alien
Unknown
White 27
84
11
2,685
5228
150235
1123
1792
Undergrad GraduateUnknownNon-Resident AlienResident AlienUS CitizenUS/Foreign National
25
412
1813,15445228
Undergrad Graduate
First Generation 4367
Undergrad Graduate
2019 413,608
Enrollment Diversity for Degree-Seeking Students
All Colleges and Graduate StudiesAll
2019Female Male Grand Total
First-year
Sophomore
Junior
Senior
Special
4th Year of 5-Year Engineer
Graduate
Non-degree
Grand Total 1,801
9
17
8
8
452
417
429
461
1,896
17
27
3
12
431
409
492
505
3,697
26
44
11
20
883
826
921
966
Enrollment by Class and Gender for All Enrolled Students
Undergrad Graduate
Female
Male 37%
63%
49%
51%
Undergrad GraduateAmerican Indian/Alaska
Asian
Black/African American
Hawaiian/PacificIsland
Hispanic/Latino
Multiple Races
Non-Resident Alien
Unknown
White 66%
20%10%
2%2%
74%
0%6%
4%7%
0%3%
5%0%
Undergrad GraduateUnknownNon-Resident AlienResident AlienUS CitizenUS/Foreign National
61%
10%29%
5%87%1%6%
Undergrad GraduatePennsylvania
Other U.S. State
Other Countries 10%27%63%
7%73%20%
Undergrad
PELL Recipients 317
Undergrad Graduate
0%9%
Undergrad GraduatePennsylvania
Other U.S. State
Other Countries 41126
2532,637718
Undergrad Graduate
10%10%

INSTITUTIONAL RESEARCH & PLANNING | ENROLLMENT | 21
Undergrad
Female
Male 965
1,367
Undergrad
American Indian/Alaska
Asian
Black/African American
Hispanic/Latino
Multiple Races
Non-Resident Alien
Unknown
White 1,706
2
138
114
170
97
104
1
Undergrad
Non-Resident Alien
Resident Alien
US Citizen
US/Foreign National 129
2,041
24
138
Undergrad
First Generation 256
Undergrad
2019 2,332
Enrollment Diversity for Degree-Seeking Students_A&S
A&SCollege of Arts & Sciences
2019Female Male Grand Total
First-year
Sophomore
Junior
Senior
Special
Grand Total 973
8
276
232
226
231
1,378
12
313
307
372
374
2,351
20
589
539
598
605
Enrollment by Class and Gender for All Enrolled Students_A&S
Undergrad
Female
Male 41%
59%
Undergrad
American Indian/Alaska
Asian
Black/African American
Hispanic/Latino
Multiple Races
Non-Resident Alien
Unknown
White 73%
0%
6%
5%
7%
4%
4%
0%
Undergrad
Non-Resident Alien
Resident Alien
US Citizen
US/Foreign National 6%
88%
1%
6%
UndergradPennsylvania
Other U.S. State
Other Countries 7%74%20%
Undergrad
PELL Recipients 209
Undergrad
9%
UndergradPennsylvania
Other U.S. State
Other Countries 1541,719
459
Undergrad
11%

INSTITUTIONAL RESEARCH & PLANNING | ENROLLMENT | 22
Undergrad
Female
Male 483
222
Undergrad
Asian
Black/African American
Hawaiian/PacificIsland
Hispanic/Latino
Multiple Races
Non-Resident Alien
Unknown
White 520
2
72
21
36
1
11
42
Undergrad
Non-Resident Alien
Resident Alien
US Citizen
US/Foreign National 33
585
15
72
Undergrad
First Generation 75
Undergrad
2019 705
Enrollment Diversity for Degree-Seeking Students_Engineering
EngineeringCollege of Engineering
2019Female Male Grand Total
First-year
Sophomore
Junior
Senior
4th Year of 5-Year Engineer
Grand Total 483
8
113
107
118
137
222
3
53
49
56
61
705
11
166
156
174
198
Enrollment by Class and Gender for All Enrolled Students_Engineering
Undergrad
Female
Male 69%
31%
Undergrad
Asian
Black/African American
Hawaiian/PacificIsland
Hispanic/Latino
Multiple Races
Non-Resident Alien
Unknown
White 74%
0%
10%
3%
5%
0%
2%
6%
Undergrad
Non-Resident Alien
Resident Alien
US Citizen
US/Foreign National 5%
83%
2%
10%
UndergradPennsylvania
Other U.S. State
Other Countries 11%65%24%
Undergrad
PELL Recipients 64
Undergrad
9%
UndergradPennsylvania
Other U.S. State
Other Countries 80458167
Undergrad
11%

INSTITUTIONAL RESEARCH & PLANNING | ENROLLMENT | 23
Undergrad
Female
Male 319
252
Undergrad
American Indian/Alaska
Asian
Black/African American
Hispanic/Latino
Multiple Races
Non-Resident Alien
Unknown
White 459
1
18
15
29
15
33
1
Undergrad
Non-Resident Alien
Resident Alien
US Citizen
US/Foreign National 19
528
6
18
Undergrad
First Generation 36
Undergrad
2019 571
Enrollment Diversity for Degree-Seeking Students_Management
ManagementFreeman College of Management
2019Female Male Grand Total
First-year
Sophomore
Junior
Senior
Grand Total 319
63
78
85
93
252
65
53
64
70
571
128
131
149
163
Enrollment by Class and Gender for All Enrolled Students_Management
Undergrad
Female
Male 56%
44%
Undergrad
American Indian/Alaska
Asian
Black/African American
Hispanic/Latino
Multiple Races
Non-Resident Alien
Unknown
White 80%
0%
3%
3%
5%
3%
6%
0%
Undergrad
Non-Resident Alien
Resident Alien
US Citizen
US/Foreign National 3%
92%
1%
3%
UndergradPennsylvania
Other U.S. State
Other Countries 3%81%16%
Undergrad
PELL Recipients 44
Undergrad
8%
UndergradPennsylvania
Other U.S. State
Other Countries 1946092
Undergrad
6%
INSTITUTIONAL RESEARCH & PLANNING | ENROLLMENT | 24
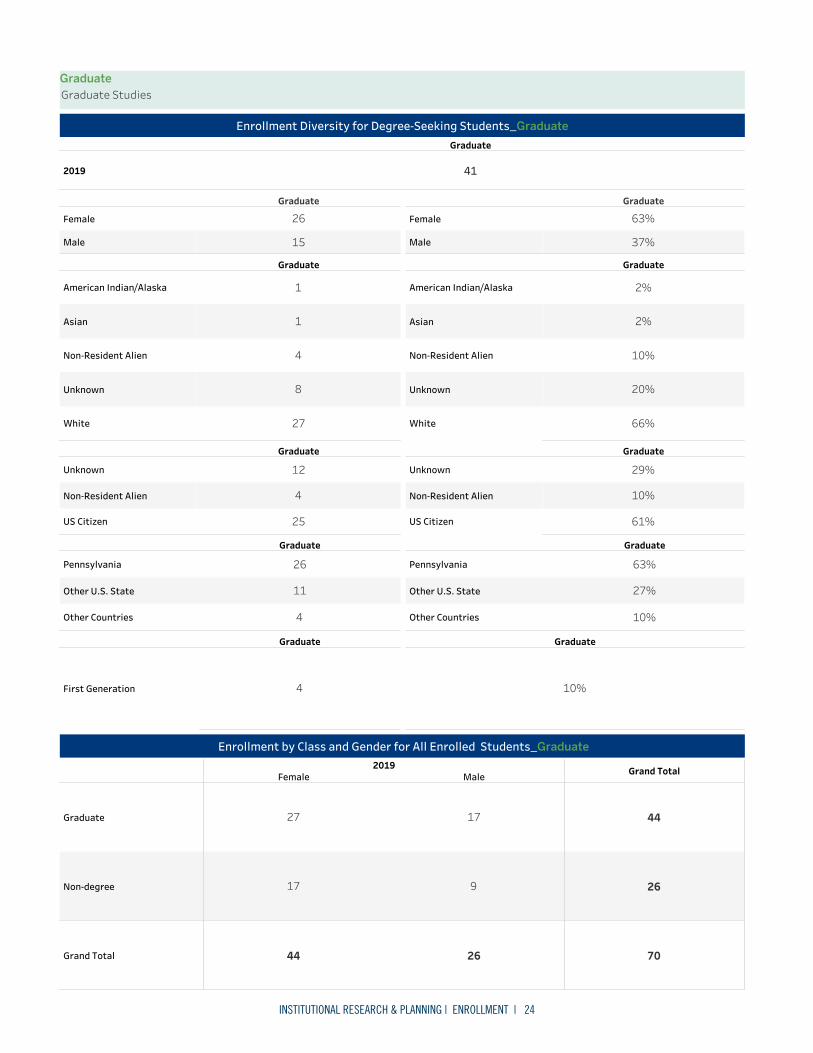
Graduate
Female
Male 15
26
Graduate
American Indian/Alaska
Asian
Non-Resident Alien
Unknown
White 27
8
4
1
1
Graduate
Unknown
Non-Resident Alien
US Citizen 25
4
12
Graduate
First Generation 4
Graduate
2019 41
Enrollment Diversity for Degree-Seeking Students_Graduate
GraduateGraduate Studies
2019Female Male Grand Total
Graduate
Non-degree
Grand Total 26
9
17
44
17
27
70
26
44
Enrollment by Class and Gender for All Enrolled Students_Graduate
Graduate
Female
Male 37%
63%
Graduate
American Indian/Alaska
Asian
Non-Resident Alien
Unknown
White 66%
20%
10%
2%
2%
Graduate
Unknown
Non-Resident Alien
US Citizen 61%
10%
29%
Graduate
Pennsylvania
Other U.S. State
Other Countries 10%
27%
63%
Graduate
Pennsylvania
Other U.S. State
Other Countries 4
11
26
Graduate
10%

INSTITUTIONAL RESEARCH & PLANNING | ENROLLMENT | 25
Undergrad Graduate TotalMid-Atlantic D.C.
Delaware
Maryland
New Jersey
New York
Pennsylvania
Total
Midwest Illinois
Indiana
Michigan
Minnesota
Missouri
Ohio
Wisconsin
Total
NewEngland
Connecticut
Maine
Massachusetts
New Hampshire
Rhode Island
Vermont
Total
South Alabama
Florida
Georgia
Kentucky
Louisiana
North Carolina
South Carolina
Tennessee
Virginia
Total
Southwest Arkansas
Texas
Total
West Arizona
California
Colorado
Hawaii
Idaho
Montana
Nevada
Oregon
Utah
Washington
Total
Total with U.S. Address
2,227
771
526
658
227
17
28
46
43
2
1
2,181
728
526
656
226
17
28
155
5
54
8
9
9
8
62
1
1
154
5
53
8
9
9
8
62
587
9
17
12
248
17
284
3
2
1
584
9
17
12
246
17
283
208
90
3
4
32
3
6
22
47
1
3
2
1
205
88
3
4
32
2
6
22
47
1
51
50
1
51
50
1
190
7
3
7
2
2
1
1
17
142
8
1
1
189
7
3
7
2
1
1
1
17
142
8
3,418543,364
Student Enrollment By U.S. Region and State, 2019(Non-resident Aliens who had U.S. addresses are counted by U.S. region too)
2227Mid-Atlantic
587New England
190West
51Southwest
155Midwest
208South
West
Geographic Origins of Enrolled Undergraduate and GraduateStudents, by U.S. Region, 2019
248
142
227658
526
77162
17
17
47
22
12
32
54
50
90
9
8
2
2
18 1
1
17
8
6
43
3
3
99
7
5
U.S. States of Enrolled Undergraduate and Graduate Students,2019
Undergrad Graduate Total
Non-Resident Alien 25116235
Undergrad Graduate Total
2019 3,697703,627

INSTITUTIONAL RESEARCH & PLANNING | ENROLLMENT | 26
1Zambia
18Viet Nam
18Viet Nam
1United Republic of Tanzania
5United Kingdom (Great Britain)
1Taiwan
1Taiwan
2Rwanda
1Romania
4Nepal
3Myanmar
1Lithuania
1Japan
1Japan
1Hungary
2Hong Kong
2Hong Kong
1Burundi
1Bhutan
1Austria
1Zimbabwe
1Venezuela
3United Arab Emirates
1Thailand
1Sweden
2Singapore
1Serbia
8Republic of Korea
8Republic of Korea
1Poland
6Pakistan
1Norway
2Nigeria
1Malawi
1Lebanon2
Jordan
3India
6Ghana
2Georgia
2France
2Egypt
1Denmark
127China
127China
1Chile
3Cambodia
1Afghanistan
2019 Degree Seeking Students Enrollment by Global Geographic (United States is Excluded)
Rank Nation
1 China
2 Viet Nam
3 Republic of Korea
4 Ghana
5 Pakistan
6 Canada
7United Kingdom(Great Britain)
8 Nepal
9 Cambodia
10 India
127
18
8
6
6
5
5
4
3
3
2019 Degree Seeking Students Enrollment by Top Ten Global Nations (United States is Excluded)

INSTITUTIONAL RESEARCH & PLANNING | ENROLLMENT | 27
MajorDescription STEM2019
Female MaleAnimal Behavior
Applied Mathematical Sciences
Biology
Biomedical Engineering
Biophysics
Cell Biology/Biochemistry
Chemical Engineering
Chemistry
Civil Engineering
Computer Engineering
Computer Sci. & Engineering
Computer Science
Electrical Engineering
Environmental Geosciences
Geology
Interdisc Studies Econ & Math
Mathematical Economics
Mathematics
Mechanical Engineering
Neuroscience
Physics
Grand Total 733
232111420331664474876357718512852864154
618
5653320177649162612243939394431631730
Undergraduate Students Majoring in STEM DisciplinesBy Gender
MajorDescription STEM2019
First Generation Non First GenerationAnimal Behavior
Applied Mathematical Sciences
Biology
Biomedical Engineering
Biophysics
Cell Biology/Biochemistry
Chemical Engineering
Chemistry
Civil Engineering
Computer Engineering
Computer Sci. & Engineering
Computer Science
Electrical Engineering
Environmental Geosciences
Geology
Interdisc Studies Econ & Math
Mathematical Economics
Mathematics
Mechanical Engineering
Neuroscience
Physics
Grand Total 1,198
257913436461912647579040954777619641972730
153
3713444
297127610136
73054
Undergraduate Students Majoring in STEM DisciplinesBy First Generation
MajorDescription STEM
2019
International Race Unknown Students of Color WhiteGrand Total
Animal Behavior
Applied Mathematical Sciences
Biology
Biomedical Engineering
Biophysics
Cell Biology/Biochemistry
Chemical Engineering
Chemistry
Civil Engineering
Computer Engineering
Computer Sci. & Engineering
Computer Science
Electrical Engineering
Environmental Geosciences
Geology
Interdisc Studies Econ & Math
Mathematical Economics
Mathematics
Mechanical Engineering
Neuroscience
Physics
Grand Total 958196911125341210834385832834672428581621225
249415224542
13172371361219175889
3
1
1
1
141521411117
992084566
6612
1,3512886
147405023128
5664
10247
1015790679
712273234
Undergraduate Students Majoring in STEM DisciplinesBy Race/Ethnicity
INSTITUTIONAL RESEARCH & PLANNING | ENROLLMENT | 28
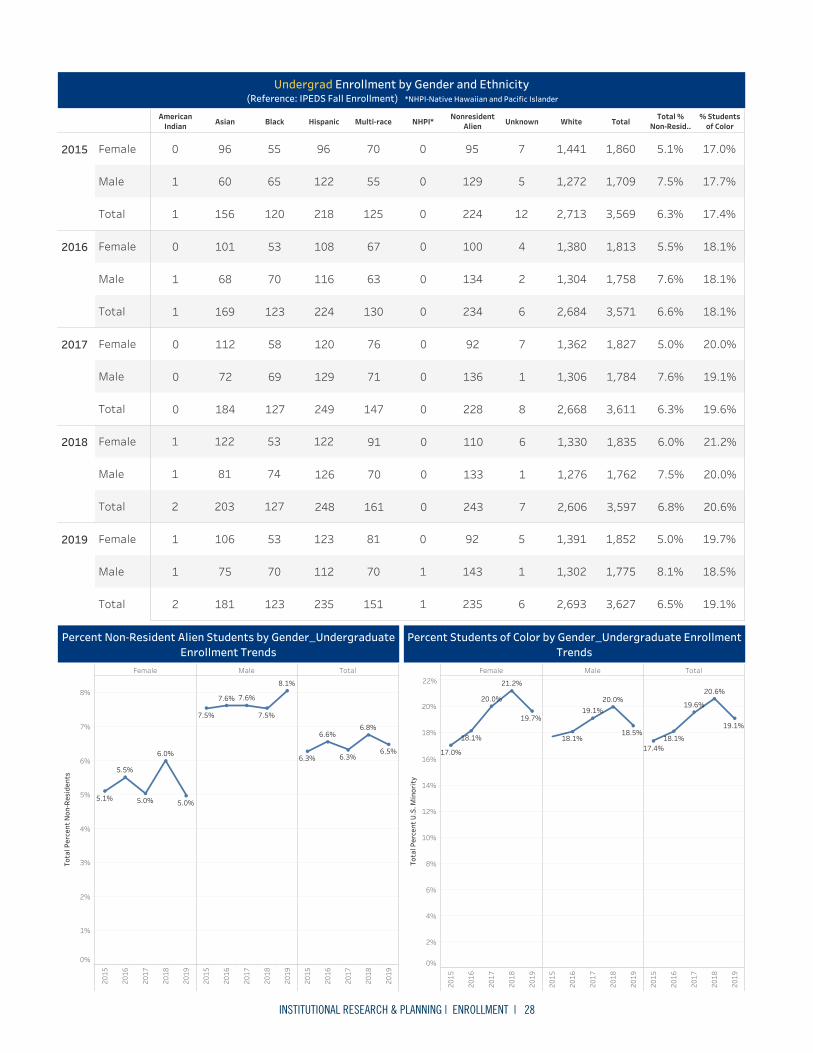
AmericanIndian Asian Black Hispanic Multi-race NHPI*
NonresidentAlien Unknown White Total
Total %Non-Resid..
% Studentsof Color
2015 Female
Male
Total
2016 Female
Male
Total
2017 Female
Male
Total
2018 Female
Male
Total
2019 Female
Male
Total
17.4%
17.7%
17.0%
6.3%
7.5%
5.1%
3,569
1,709
1,860
2,713
1,272
1,441
12
5
7
224
129
95
0
0
0
125
55
70
218
122
96
120
65
55
156
60
96
1
1
0
18.1%
18.1%
18.1%
6.6%
7.6%
5.5%
3,571
1,758
1,813
2,684
1,304
1,380
6
2
4
234
134
100
0
0
0
130
63
67
224
116
108
123
70
53
169
68
101
1
1
0
19.6%
19.1%
20.0%
6.3%
7.6%
5.0%
3,611
1,784
1,827
2,668
1,306
1,362
8
1
7
228
136
92
0
0
0
147
71
76
249
129
120
127
69
58
184
72
112
0
0
0
20.6%
20.0%
21.2%
6.8%
7.5%
6.0%
3,597
1,762
1,835
2,606
1,276
1,330
7
1
6
243
133
110
0
0
0
161
70
91
248
126
122
127
74
53
203
81
122
2
1
1
19.1%
18.5%
19.7%
6.5%
8.1%
5.0%
3,627
1,775
1,852
2,693
1,302
1,391
6
1
5
235
143
92
1
1
0
151
70
81
235
112
123
123
70
53
181
75
106
2
1
1
Undergrad Enrollment by Gender and Ethnicity (Reference: IPEDS Fall Enrollment) *NHPI-Native Hawaiian and Pacific Islander
Female Male Total
2015
2016
2017
2018
2019
2015
2016
2017
2018
2019
2015
2016
2017
2018
2019
0%
1%
2%
3%
4%
5%
6%
7%
8%
Tota
l Per
cent
Non
-Res
iden
ts
5.5%
6.0%
5.1% 5.0% 5.0%
8.1%
7.6%7.6%
7.5% 7.5%
6.5%
6.6%6.8%
6.3%6.3%
Percent Non-Resident Alien Students by Gender_UndergraduateEnrollment Trends
Female Male Total
2015
2016
2017
2018
2019
2015
2016
2017
2018
2019
2015
2016
2017
2018
2019
0%
2%
4%
6%
8%
10%
12%
14%
16%
18%
20%
22%
Tota
l Per
cent
U.S
. Min
orit
y
19.7%
20.0%
18.1%
17.0%
21.2%
18.5%
19.1%20.0%
18.1%
19.1%
19.6%
18.1%
20.6%
17.4%
Percent Students of Color by Gender_Undergraduate EnrollmentTrends

INSTITUTIONAL RESEARCH & PLANNING | ENROLLMENT | 29
AmericanIndian Asian Black Hispanic Multi-race NHPI*
NonresidentAlien Unknown White Total
Total % Non-Residents
% Studentsof Color
2015 Female
Male
Total
2016 Female
Male
Total
2017 Female
Male
Total
2018 Female
Male
Total
2019 Female
Male
Total
7.1%
0.0%
13.3%
16.1%
19.2%
13.3%
56
26
30
42
20
22
1
1
0
9
5
4
0
0
0
2
0
2
2
0
2
0
0
0
0
0
0
0
0
0
10.9%
10.7%
11.1%
21.8%
28.6%
14.8%
55
28
27
36
17
19
1
0
1
12
8
4
0
0
0
2
0
2
2
1
1
1
1
0
1
1
0
0
0
0
44.8%
37.0%
50.0%
35.8%
29.6%
40.0%
67
27
40
34
16
18
3
1
2
24
8
16
0
0
0
3
2
1
1
0
1
1
0
1
1
0
1
0
0
0
38.0%
25.8%
47.5%
33.8%
25.8%
40.0%
71
31
40
38
20
18
6
3
3
24
8
16
0
0
0
0
0
0
1
0
1
1
0
1
1
0
1
0
0
0
34.3%
26.9%
38.6%
22.9%
23.1%
22.7%
70
26
44
38
16
22
8
3
5
16
6
10
0
0
0
1
0
1
2
0
2
1
1
0
3
0
3
1
0
1
Graduate Enrollment by Gender and Ethnicity(Reference: IPEDS Fall Enrollment) *NHPI-Native Hawaiian and Pacific Islander
AmericanIndian Asian Black Hispanic Multi-race NHPI*
NonresidentAlien Unknown White Total
Total % Non-Residents
% Studentsof Color
2015 Female
Male
Total
2016 Female
Male
Total
2017 Female
Male
Total
2018 Female
Male
Total
2019 Female
Male
Total
17.2%
17.5%
17.0%
6.4%
7.7%
5.2%
3,625
1,735
1,890
2,755
1,292
1,463
13
6
7
233
134
99
0
0
0
127
55
72
220
122
98
120
65
55
156
60
96
1
1
0
18.0%
18.0%
18.0%
6.8%
8.0%
5.7%
3,626
1,786
1,840
2,720
1,321
1,399
7
2
5
246
142
104
0
0
0
132
63
69
226
117
109
124
71
53
170
69
101
1
1
0
19.4%
18.9%
19.8%
6.9%
8.0%
5.8%
3,678
1,811
1,867
2,702
1,322
1,380
11
2
9
252
144
108
0
0
0
150
73
77
250
129
121
128
69
59
185
72
113
0
0
0
20.3%
19.6%
20.9%
7.3%
7.9%
6.7%
3,668
1,793
1,875
2,644
1,296
1,348
13
4
9
267
141
126
0
0
0
161
70
91
249
126
123
128
74
54
204
81
123
2
1
1
19.0%
18.3%
19.6%
6.8%
8.3%
5.4%
3,697
1,801
1,896
2,731
1,318
1,413
14
4
10
251
149
102
1
1
0
152
70
82
237
112
125
124
71
53
184
75
109
3
1
2
Total Enrollment by Gender and Ethnicity(Reference: IPEDS Fall Enrollment) *NHPI-Native Hawaiian and Pacific Islander

FACT BOOK BUCKNELL UNIVERSITY
COMPLETIONS BY FIELD OF STUDY

INSTITUTIONAL RESEARCH & PLANNING | COMPLETIONS BY FIELD OF STUDY | 31
COMPLETIONS BY FIELD OF STUDY BUCKNELL UNIVERSITYCompletions by Field of Study Bucknell University
2014-15Undergraduate Graduate
2015-16Undergraduate Graduate
2016-17Undergraduate Graduate
2017-18Undergraduate Graduate
2018-19Undergraduate Graduate
Area and ethnic studies
Biological/life sciences
Business/marketing
Computer and info. Sciences
Education
Engineering/engineering technologies
English
Foreign languages and literature
History
Interdisciplinary studies
Liberal arts/general studies
Mathematics
Natural resources/Envir. science
Philosophy, religion, theology
Physical sciences
Psychology
Social sciences
Visual and performing arts
Grand Total 22
1
5
2
8
3
3
868
14
225
51
30
10
11
10
1
6
17
31
30
147
25
15
131
108
6
36
3
4
1
4
9
10
5
851
15
192
60
22
7
15
9
2
6
16
15
48
156
32
17
128
102
9
21
2
5
4
6
1
3
867
19
202
64
30
16
16
2
14
9
15
30
167
20
14
126
115
8
16
1
1
5
3
5
1
852
18
205
53
24
6
14
11
11
14
15
31
167
31
18
138
92
4
18
3
1
5
5
4
864
16
191
59
18
11
19
16
2
19
14
25
24
154
24
14
144
105
9
Completions by Field of Study For First MajorBy Category
2014-15Undergraduate
2015-16Undergraduate
2016-17Undergraduate
2017-18Undergraduate
2018-19Undergraduate
Area and ethnic studies
Biological/life sciences
Business/marketing
Computer and info. Sciences
Education
English
Foreign languages and literature
History
Interdisciplinary studies
Liberal arts/general studies
Mathematics
Natural resources/Envir. science
Philosophy, religion, theology
Physical sciences
Psychology
Social sciences
Visual and performing arts
Grand Total 181
10
73
13
1
9
6
1
1
5
31
12
2
8
4
5
186
6
55
33
5
9
5
1
8
29
8
3
4
2
18
173
4
66
7
2
9
8
5
10
34
9
3
7
2
7
170
8
57
12
4
2
9
1
3
1
10
25
8
2
8
4
16
170
4
60
16
4
5
7
7
26
15
4
6
2
14
Completions by Field of Study For Second MajorBy Category

INSTITUTIONAL RESEARCH & PLANNING | COMPLETIONS BY FIELD OF STUDY | 32
2014-15Undergraduate Graduate
2015-16Undergraduate Graduate
2016-17Undergraduate Graduate
2017-18Undergraduate Graduate
2018-19Undergraduate Graduate
Female
Male
Grand Total 22
13
9
868
423
445
36
16
20
851
370
481
21
13
8
867
405
462
16
6
10
852
407
445
18
9
9
864
416
448
Completions by Field of Study For First MajorBy Gender and Race/Ethnicity
Undergraduate Graduate Undergraduate Graduate Undergraduate Graduate Undergraduate Graduate Undergraduate Graduate
American Indian/AlaskaAsianBlack/African AmericanHispanic/LatinoMultiple RacesNon-Resident AlienUnknownWhiteGrand Total 22
1613
11
86868684327463028
3628221111
85168114034402233
2118
21
867673347295031331
169
421
85268224129412730
181016
1
86460915635753652
2014-15Undergraduate
2015-16Undergraduate
2016-17Undergraduate
2017-18Undergraduate
2018-19Undergraduate
FemaleMaleGrand Total 181
77104
18651135
17363110
17064106
17060110
Completions by Field of Study For Second MajorBy Gender and Race/Ethnicity
Undergraduate Undergraduate Undergraduate Undergraduate Undergraduate
AsianBlack/African AmericanHispanic/LatinoMultiple RacesNon-Resident AlienUnknownWhiteGrand Total 181
1422731863
186149
66799
173133
761746
170134
99864
170124
861787
2014-15Undergraduate Graduate
2015-16Undergraduate Graduate
2016-17Undergraduate Graduate
2017-18Undergraduate Graduate
2018-19Undergraduate Graduate
Arts & HumanitiesEngineeringInterdepartmentalManagementNatural Sciences & MathematicsSocial SciencesGrand Total 22
48
82
8683011741317
147108
361310
94
8512841651288
156110
2138
64
8672861911261616781
1662
35
8522891591381116788
1857
51
8642741721442115499
Completions by Broad Disciplinary Category For First Major
2014-15Undergraduate
2015-16Undergraduate
2016-17Undergraduate
2017-18Undergraduate
2018-19Undergraduate
Arts & Humanities
Interdepartmental
Management
Natural Sciences & Mathematics
Social Sciences
Grand Total 181
88
12
8
1
72
186
91
12
4
1
78
173
76
17
7
73
170
69
20
8
4
69
170
76
17
6
71
Completions by Broad Disciplinary Category For Second Major
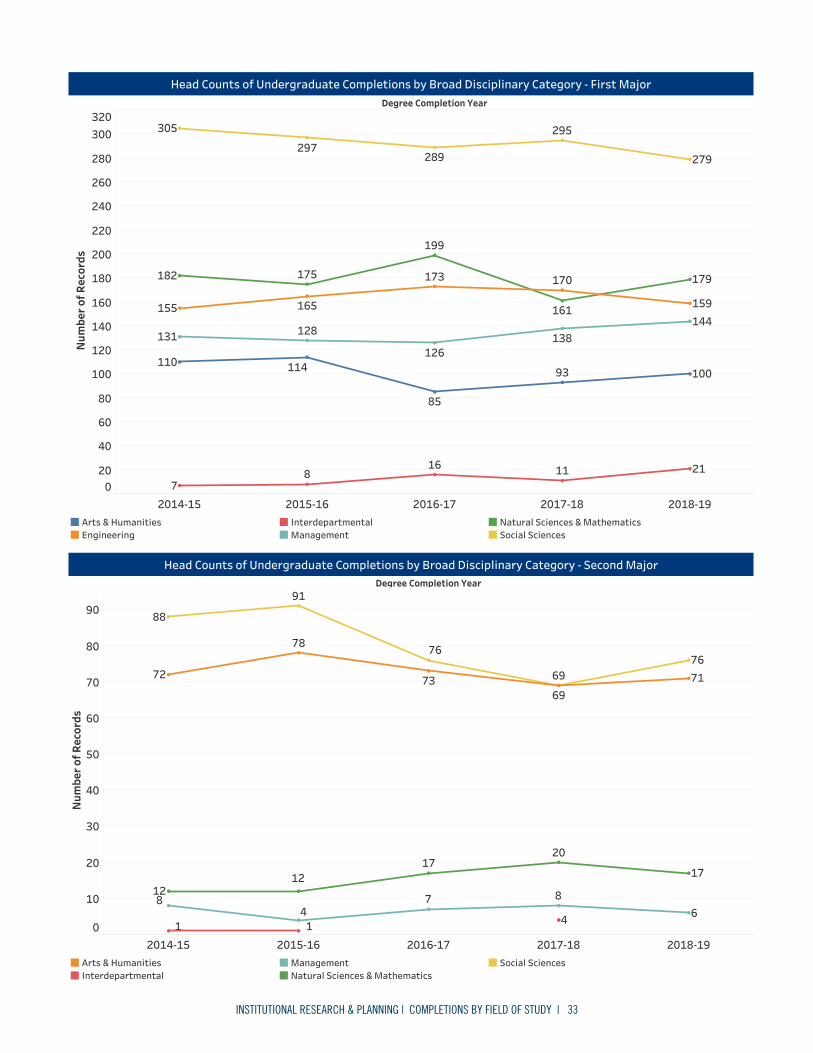
INSTITUTIONAL RESEARCH & PLANNING | COMPLETIONS BY FIELD OF STUDY | 33
Degree Completion Year
2014-15 2015-16 2016-17 2017-18 2018-190
20
40
60
80
100
120
140
160
180
200
220
240
260
280
300320
Num
ber o
f Rec
ords
179
100
182 175
295
165
199
297289
131
93
161
279
11
85
144138
2116
110
305
128
159155
170
114
8
173
7
126
Head Counts of Undergraduate Completions by Broad Disciplinary Category - First Major
Degree Completion Year
2014-15 2015-16 2016-17 2017-18 2018-190
10
20
30
40
50
60
70
80
90
Num
ber o
f Rec
ords
12
84
1 1
7676
7372
1717
78
69
91
71
7
88
6
20
8
4
69
12
Head Counts of Undergraduate Completions by Broad Disciplinary Category - Second Major
Arts & HumanitiesEngineering
InterdepartmentalManagement
Natural Sciences & MathematicsSocial Sciences
Arts & HumanitiesInterdepartmental
ManagementNatural Sciences & Mathematics
Social Sciences

FACT BOOK BUCKNELL UNIVERSITY
ACADEMICS, CO-CURRICULAR AND EXTRACURRICULAR ACTIVITIES
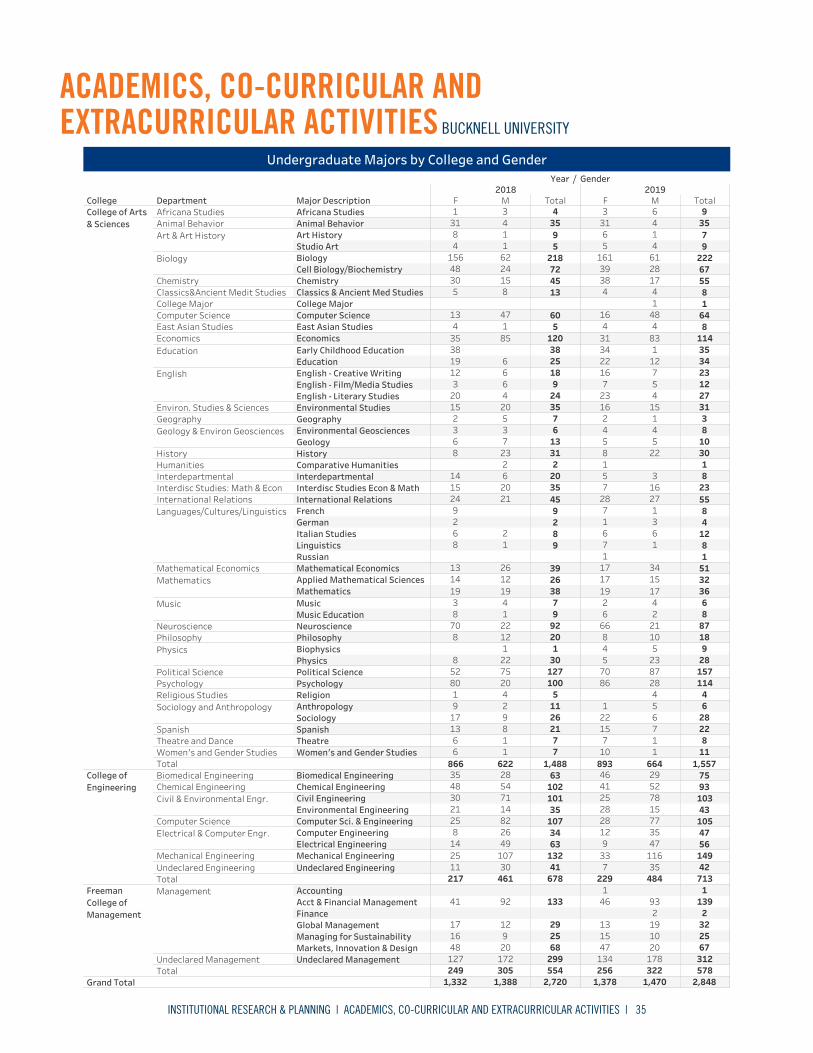
INSTITUTIONAL RESEARCH & PLANNING | ACADEMICS, CO-CURRICULAR AND EXTRACURRICULAR ACTIVITIES | 35
ACADEMICS, CO-CURRICULAR AND EXTRACURRICULAR ACTIVITIES BUCKNELL UNIVERSITY
Academics, Co-Curricular and Extracurricular Activities Bucknell University
College Department Major Description
Year / Gender2018
F M Total2019
F M TotalCollege of Arts& Sciences
Africana Studies Africana StudiesAnimal Behavior Animal BehaviorArt & Art History Art History
Studio ArtBiology Biology
Cell Biology/BiochemistryChemistry ChemistryClassics&Ancient Medit Studies Classics & Ancient Med StudiesCollege Major College MajorComputer Science Computer ScienceEast Asian Studies East Asian StudiesEconomics EconomicsEducation Early Childhood Education
EducationEnglish English - Creative Writing
English - Film/Media StudiesEnglish - Literary Studies
Environ. Studies & Sciences Environmental StudiesGeography GeographyGeology & Environ Geosciences Environmental Geosciences
GeologyHistory HistoryHumanities Comparative HumanitiesInterdepartmental InterdepartmentalInterdisc Studies: Math & Econ Interdisc Studies Econ & MathInternational Relations International RelationsLanguages/Cultures/Linguistics French
GermanItalian StudiesLinguisticsRussian
Mathematical Economics Mathematical EconomicsMathematics Applied Mathematical Sciences
MathematicsMusic Music
Music EducationNeuroscience NeurosciencePhilosophy PhilosophyPhysics Biophysics
PhysicsPolitical Science Political SciencePsychology PsychologyReligious Studies ReligionSociology and Anthropology Anthropology
SociologySpanish SpanishTheatre and Dance TheatreWomen's and Gender Studies Women's and Gender StudiesTotal
College ofEngineering
Biomedical Engineering Biomedical EngineeringChemical Engineering Chemical EngineeringCivil & Environmental Engr. Civil Engineering
Environmental EngineeringComputer Science Computer Sci. & EngineeringElectrical & Computer Engr. Computer Engineering
Electrical EngineeringMechanical Engineering Mechanical EngineeringUndeclared Engineering Undeclared EngineeringTotal
FreemanCollege ofManagement
Management AccountingAcct & Financial ManagementFinanceGlobal ManagementManaging for SustainabilityMarkets, Innovation & Design
Undeclared Management Undeclared ManagementTotal
Grand Total
431 96335431 35431
59
11
48
97
41
56
72218
2462
48156
67222
2861
39161
451530 5517381385 844
11604713 644816514 844
1208535 1148331
2538
61938
3435
121
2234
24918
466
203
12
271223
457
237
16
352015 311516752 312
136
73
63
108
54
54
31238 3022822 1120614 835352015 23167452124 552728
9829
12
8629
181248
1631
17617
392613 513417
3826
1912
1914
3632
1715
1917
97
14
83
86
24
62
922270 87216620128 18108
301
221
8 289
235
54
1277552 15787701002080 1142886541 44
2611
92
179
286
65
221
21813 22715716 817716 11110
1,488622866 1,557664893632835 7529461025448 935241
35101
1471
2130
43103
1578
2825
1078225 1057728
6334
4926
148
5647
4735
912
13210725 14911633413011 42357678461217 713484229
682529
133
209
12
92
481617
41
67253221391
2010192
93
471513
461
299172127 312178134554305249 5783222562,7201,3881,332 2,8481,4701,378
Undergraduate Majors by College and Gender

INSTITUTIONAL RESEARCH & PLANNING | ACADEMICS, CO-CURRICULAR AND EXTRACURRICULAR ACTIVITIES | 36
Undergraduate Class SizeTo calculate class sizes, we used the Common Data Set (CDS) definition which is used for our external reports to college guides and rankings.
A class section is an organized course offered for credit, identified by discipline and number, meeting at a stated time or times in a classroom or similarsetting, and not a subsection such as a laboratory or discussion session. Undergraduate class sections are defined as any sections in which at least onedegree-seeking undergraduate student is enrolled for credit. Exclude distance learning classes and noncredit classes and individual instruction such asdissertation or thesis research, music instruction, or one-to-one readings. Exclude students in independent study, co-operative programs, internships,foreign language taped tutor sessions, practicums, and all students in one-on-one classes. Each class section should be counted only once and should not beduplicated because of course catalog cross-listings.
SizeCollege of Arts & Sciences
Count %College of Engineering
Count %Freeman College of Management
Count %Grand Total
Count %2-910-1920-2930-3940-4950-99100+Grand Total 100%
1%1%0%
13%31%39%17%
584341
7318022697
100%1%
5%31%52%10%
961
5305010
100%1%
1%54%39%4%
701
138273
100%1%1%0%11%33%40%15%
75054179248303110
Number of Class Sections with Undergraduates Enrolled by College in the Fall of 2019
SizeArts and Humanit..
Count %Engineering
Count %Management
Count %Natural SciencesCount %
Social SciencesCount %
UnassignedCount %
Grand TotalCount %
2-9
10-19
20-29
30-39
40-49
50-99
100+
Grand Total 100%
0%
8%
27%
39%
25%
211
1
16
58
83
53
100%
1%
5%
31%
52%
10%
96
1
5
30
50
10
100%
1%
1%
54%
39%
4%
70
1
1
38
27
3
100%
2%
3%
8%
50%
24%
12%
129
3
4
10
65
31
16
100%
22%
29%
37%
13%
198
43
57
73
25
100%
9%
85%
7%
46
4
39
3
100%
1%
1%
0%
11%
33%
40%
15%
750
5
4
1
79
248
303
110
Number of Class Sections with Undergraduates Enrolled by Division in the Fall of 2019
Class SizeYear
2016-17 2017-18 2018-19 2019-20 Grand Total
2-9
10-19
20-29
30-39
40-49
50-99
100+
Grand Total 2,937
16
26
17
360
934
1,123
461
750
5
4
1
79
248
303
110
710
4
5
4
92
237
273
95
733
3
8
6
101
234
258
123
744
4
9
6
88
215
289
133
Number of Class Sections with Undergraduates Enrolled in the Fall of 2016-2019
YearClass Size
2-9 10-19 20-29 30-39 40-49 50-99 100+
2016-17
2017-18
2018-19
2019-20
133
123
110
95
289
258
273
303
215
234
237
248
101
88
92
79
6
6
4
1
9
8
5
4
4
3
4
5
Class Size2-9 10-19 20-29 30-39 40-49 50-99 100+

INSTITUTIONAL RESEARCH & PLANNING | ACADEMICS, CO-CURRICULAR AND EXTRACURRICULAR ACTIVITIES | 37
ProgramAY
2014-2015Fall
AY2014-2015
Spring
AY2014-2015
Summer
AY2015-2016
Fall
AY2015-2016
Spring
AY2015-2016
Summer
AY2016-2017
Fall
AY2016-2017
Spring
AY2016-2017
Summer
AY2017-2018
Fall
AY2017-2018
Spring
AY2017-2018
Summer
AY2018-2019
Fall
AY2018-2019
Spring
AY2018-2019
Summer
Associated KyotoProgram
Bucknell en Espana(Granada)
Bucknell en France
Bucknell in Athens
Bucknell in Barbados
Bucknell in D.C.
Bucknell in Ghana
Bucknell in Nicaragua
Bucknell in South Africa
Bucknell LondonSemester
Camino de Santiago
Caribbean
Denmark Program
ENGR 290
Hong Kong ExchangeProgram
Ivory Coast (Africa)
Japan
London InternshipProgram
New Orleans
Northern Ireland Program
Nottingham ExchangeProgram
Off Campus Study
Taste of France Program
Virgin Islands Program
Total 178
13
69
7
8
27
12
10
20
1
11
273
218
1
1
15
2
3
14
19
90
68
10
10
2
157
12
69
7
11
17
13
8
20
260
189
14
10
11
13
21
2
95
62
19
6
6
2
216
27
12
67
9
36
13
7
20
15
10
237
184
16
4
15
18
121
90
10
12
8
1
165
27
22
15
12
8
33
11
6
17
14
227
160
13
11
2
1
13
25
2
122
80
1
14
13
10
4
162
24
21
13
9
11
45
11
11
17
202
150
15
7
6
9
13
2
106
63
1
19
9
12
2
Undergraduate Off Campus Experience by ProgramData Source: From Bucknell Data Warehouse pulled by Cognos as of 11/4/2019
Off-Campus Study numbers were retrieved from the student record system named Horizons. The big increase of off-campus study in 2017 and 2018 summer was tied totwo factors: Freeman College of Management and ECON students taking part in the LSE summer school program and a very large number of Chinese International
Students taking courses on summer programs at home in China.

INSTITUTIONAL RESEARCH & PLANNING | ACADEMICS, CO-CURRICULAR AND EXTRACURRICULAR ACTIVITIES | 38
Program
0 50 100
Academic Year 2014-2015 Fall
0 50 100 150
Academic Year 2015-2016 Fall
0 50 100 150
Academic Year 2016-2017 Fall
0 50 100
Academic Year 2017-2018 Fall
0 50 100
Academic Year 2018-2019 Fall
Associated Kyoto Program
Bucknell en Espana (Granada)
Bucknell en France
Bucknell in Athens
Bucknell in Barbados
Bucknell in D.C.
Bucknell in Ghana
Bucknell in Nicaragua
Bucknell in South Africa
Bucknell London Semester
Camino de Santiago
Caribbean
Denmark Program
ENGR 290
Hong Kong Exchange Program
Ivory Coast (Africa)
Japan
London Internship Program
New Orleans
Northern Ireland Program
Nottingham Exchange Program
Off Campus Study
Taste of France Program
Virgin Islands Program
Total 106
12
19
63
2
9
1
122
10
13
14
80
4
1
121
12
10
90
1
8
19
62
95
2
6
6 10
10
68
90
2
Undergraduate Off Campus Experience by ProgramFall Term (2014-2018)
Program
0 100 200
Academic Year 2014-2015 Spring
0 100 200
Academic Year 2015-2016 Spring
0 100 200
Academic Year 2016-2017 Spring
0 100 200 300
Academic Year 2017-2018 Spring
0 100 200 300
Academic Year 2018-2019 Spri..
Associated Kyoto Program
Bucknell en Espana (Granada)
Bucknell en France
Bucknell in Athens
Bucknell in Barbados
Bucknell in D.C.
Bucknell in Ghana
Bucknell in Nicaragua
Bucknell in South Africa
Bucknell London Semester
Camino de Santiago
Caribbean
Denmark Program
ENGR 290
Hong Kong Exchange Program
Ivory Coast (Africa)
Japan
London Internship Program
New Orleans
Northern Ireland Program
Nottingham Exchange Program
Off Campus Study
Taste of France Program
Virgin Islands Program
Total
150
202
13
15
2
9
6
7
160
227
25
13
11
13
2
1
2
184
237
18
15
16
4
189
260
21
13
11
10
14
2
218
273
19
14
15
3
2
1
1
Undergraduate Off Campus Experience by ProgramSpring Term (2014-2018)

INSTITUTIONAL RESEARCH & PLANNING | ACADEMICS, CO-CURRICULAR AND EXTRACURRICULAR ACTIVITIES | 39
Program
0 50 100 150 200
Academic Year 2014-2015 Summer
0 50 100 150 200
Academic Year 2015-2016 Summer
0 100 200
Academic Year 2016-2017 Summer
0 50 100 150
Academic Year 2017-2018 Summer
0 100 200
Academic Year 2018-2019 Sum..
Associated Kyoto Program
Bucknell en Espana (Granada)
Bucknell en France
Bucknell in Athens
Bucknell in Barbados
Bucknell in D.C.
Bucknell in Ghana
Bucknell in Nicaragua
Bucknell in South Africa
Bucknell London Semester
Camino de Santiago
Caribbean
Denmark Program
ENGR 290
Hong Kong Exchange Program
Ivory Coast (Africa)
Japan
London Internship Program
New Orleans
Northern Ireland Program
Nottingham Exchange Program
Off Campus Study
Taste of France Program
Virgin Islands Program
Total 162
17
11
11
45
11
13
21
24
9
165
14
17
11
33
12
15
22
27
6
8
216
10
15
20
13
36
67
12
27
7
9
157
20
13
17
11
69
12
8
7
178
11
20
10
12
27
69
13
1
8
7
Undergraduate Off Campus Experience by ProgramSummer Term (2014-2018)
Seniors with Off Campus Experiences* Sum of Total Graduated Seniors** Participation Rate
2013-14
2014-15
2015-16
2016-17
2017-18
2018-19
6 year Average 46%
49%
50%
49%
46%
41%
43%
859
864
852
867
851
868
853
397
426
425
422
395
352
363
Participation Rate of Off Campus Experience by Graduating Senior Class* Off campus experiences exclude main campus study and non traditional study. This is an unduplicated count . Since some summer off campus programs do not require registration, listed
number may not include students who had those summer experiences.** Total number of graduated seniors is based on a 12-month time period beginning July 1 of the previous calendar year and ending June 30 of the current calendar year, which is consistent
with IPEDS reporting. The total number indicates seniors who graduated in July, January, and May at Bucknell.

INSTITUTIONAL RESEARCH & PLANNING | ACADEMICS, CO-CURRICULAR AND EXTRACURRICULAR ACTIVITIES | 40
Group YearNumber of Greek
Organizations (Active)
Number of Students in ActiveGreek Organizations (includes
fall rush)
% of All Undergraduates (all 4classes)
% of ELIGIBLEUndergraduates (sophomores
to seniors)Men 2015-16
2016-17
2017-182018-19
2019-20Women 2015-16
2016-17
2017-182018-19
2019-20Total 2015-16
2016-17
2017-182018-19
2019-20
48%48%46%53%55%
35%35%33%38%39%
621623593664668
99898
58%56%63%67%67%
42%40%45%48%49%
776727831875913
98998
53%52%55%60%61%
39%38%39%43%44%
1,3971,3501,4241,5391,581
1817171816
Student Greek ParticipationData source: from OIR&P frozen fall enrollment files
Kappa Sigma Fraternity was excluded since 2017 fall; Four classes were included as eligible students: sophomore, junior, senior, and 4th year of 5-year Engineering.
Group Year
2015-16 2016-17 2017-18 2018-19 2019-20
Men
Women
Total
35% 35%39% 33%38%
48% 48%55% 53% 46%
45% 42%40%48%49%
63% 56% 58%67%67%
39%39%44% 43% 38%
53%55%61% 60% 52%
Student Greek Participation Trend Over Five Years
% of All Undergraduates (all 4 classes) % of ELIGIBLE Undergraduates (sophomores to seniors)
Group Year Intercollegiate Sports Intramural SportsMen 2015-16
2016-17
2017-18
2018-19
2019-20
Women 2015-16
2016-17
2017-18
2018-19
2019-20
Overall 2015-16
2016-17
2017-18
2018-19
2019-20
52%
56%
60%
68%
55%
21%
21%
21%
21%
22%
20%
22%
27%
27%
20%
19%
20%
23%
23%
23%
36%
39%
43%
47%
37%
20%
20%
22%
22%
22%
Student Athletic ParticipationData source: from College Guide Survey reported by the Athletic office
GroupYear
2015-16 2016-17 2017-18 2018-19 2019-20
Men
Women
Overall
22%
55%
21%
68%
21%
60%
21%
56%
21%
52%
23% 20% 23% 27% 23% 27%20% 22% 19% 20%
22%37%
22%
47%
22%
43%
20%
39%
20%36%
Student Athletic Participation Trend Over Five Years
Intercollegiate Sports Intramural Sports
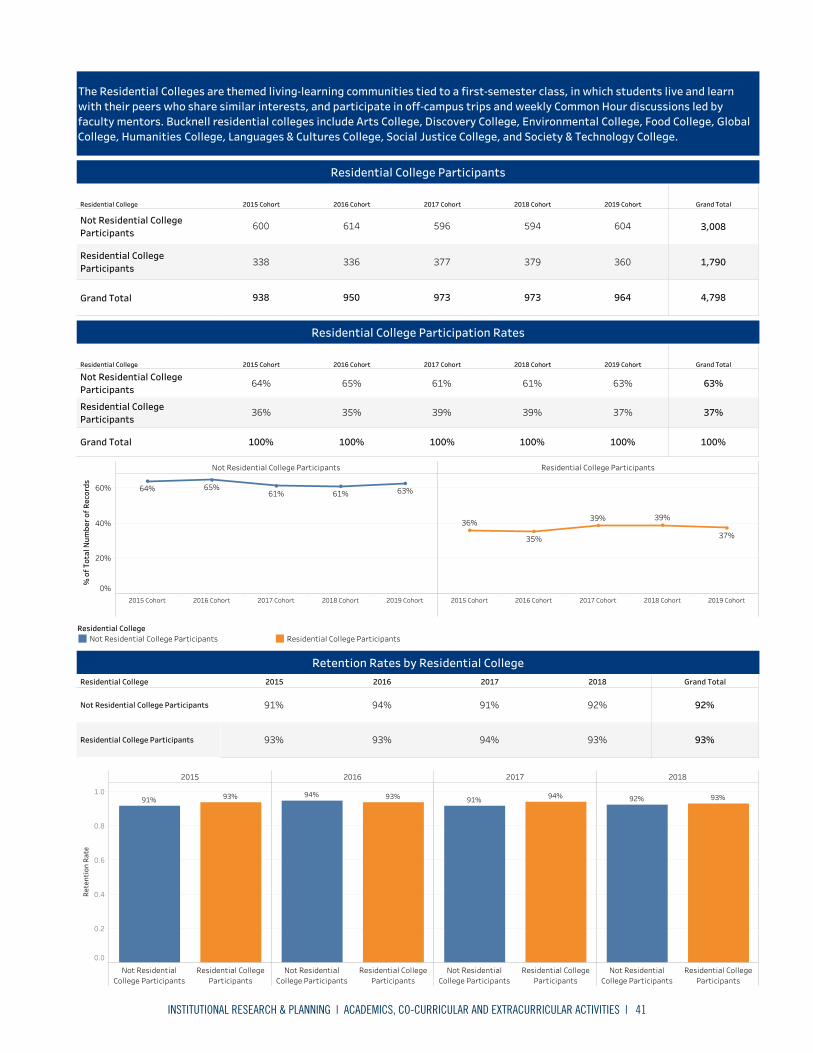
INSTITUTIONAL RESEARCH & PLANNING | ACADEMICS, CO-CURRICULAR AND EXTRACURRICULAR ACTIVITIES | 41
The Residential Colleges are themed living-learning communities tied to a first-semester class, in which students live and learnwith their peers who share similar interests, and participate in off-campus trips and weekly Common Hour discussions led byfaculty mentors. Bucknell residential colleges include Arts College, Discovery College, Environmental College, Food College, GlobalCollege, Humanities College, Languages & Cultures College, Social Justice College, and Society & Technology College.
Residential College 2015 Cohort 2016 Cohort 2017 Cohort 2018 Cohort 2019 Cohort Grand Total
Not Residential CollegeParticipants
Residential CollegeParticipants
Grand Total 4,798
1,790
3,008
964
360
604
973
379
594
973
377
596
950
336
614
938
338
600
Residential College Participants
Residential College 2015 2016 2017 2018 Grand Total
Not Residential College Participants
Residential College Participants 93%
92%
93%
92%
94%
91%
93%
94%
93%
91%
Retention Rates by Residential College
Residential College 2015 Cohort 2016 Cohort 2017 Cohort 2018 Cohort 2019 Cohort Grand Total
Not Residential CollegeParticipants
Residential CollegeParticipants
Grand Total 100%
37%
63%
100%
37%
63%
100%
39%
61%
100%
39%
61%
100%
35%
65%
100%
36%
64%
Residential College Participation Rates
Not Residential College Participants Residential College Participants
2015 Cohort 2016 Cohort 2017 Cohort 2018 Cohort 2019 Cohort 2015 Cohort 2016 Cohort 2017 Cohort 2018 Cohort 2019 Cohort
0%
20%
40%
60%
% o
f Tot
al N
umbe
r of R
ecor
ds 63%64% 65%61% 61%
37%36%
35%
39% 39%
Residential CollegeNot Residential College Participants Residential College Participants
2015 2016 2017 2018
Not ResidentialCollege Participants
Residential CollegeParticipants
Not ResidentialCollege Participants
Residential CollegeParticipants
Not ResidentialCollege Participants
Residential CollegeParticipants
Not ResidentialCollege Participants
Residential CollegeParticipants
0.0
0.2
0.4
0.6
0.8
1.0
Rete
ntio
n Ra
te
91% 93% 94% 93% 91% 94% 92% 93%
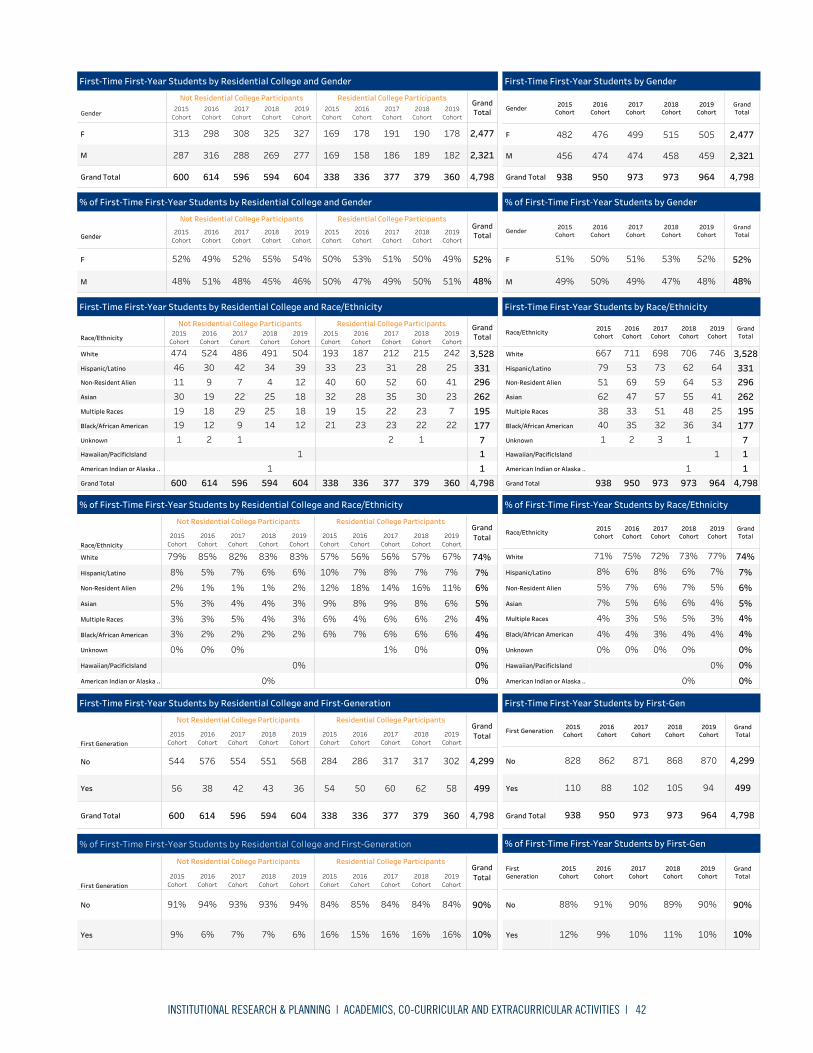
INSTITUTIONAL RESEARCH & PLANNING | ACADEMICS, CO-CURRICULAR AND EXTRACURRICULAR ACTIVITIES | 42
Gender 2015Cohort
2016Cohort
2017Cohort
2018Cohort
2019Cohort
GrandTotal
F
M
Grand Total 4,798
2,321
2,477
964
459
505
973
458
515
973
474
499
950
474
476
938
456
482
First-Time First-Year Students by Gender
Gender
Not Residential College Participants2015
Cohort2016
Cohort2017
Cohort2018
Cohort2019
Cohort
Residential College Participants2015
Cohort2016
Cohort2017
Cohort2018
Cohort2019
Cohort
GrandTotal
F
M
Grand Total 604
277
327
594
269
325
596
288
308
614
316
298
600
287
313
360
182
178
379
189
190
377
186
191
336
158
178
338
169
169
4,798
2,321
2,477
First-Time First-Year Students by Residential College and Gender
Gender
Not Residential College Participants
2015Cohort
2016Cohort
2017Cohort
2018Cohort
2019Cohort
Residential College Participants
2015Cohort
2016Cohort
2017Cohort
2018Cohort
2019Cohort
GrandTotal
F
M 46%
54%
45%
55%
48%
52%
51%
49%
48%
52%
51%
49%
50%
50%
49%
51%
47%
53%
50%
50%
48%
52%
% of First-Time First-Year Students by Residential College and Gender
Gender 2015Cohort
2016Cohort
2017Cohort
2018Cohort
2019Cohort
GrandTotal
F
M 48%
52%
48%
52%
47%
53%
49%
51%
50%
50%
49%
51%
% of First-Time First-Year Students by Gender
Race/Ethnicity
Not Residential College Participants2015
Cohort2016
Cohort2017
Cohort2018
Cohort2019
Cohort
Residential College Participants2015
Cohort2016
Cohort2017
Cohort2018
Cohort2019
Cohort
GrandTotal
White
Hispanic/Latino
Non-Resident Alien
Asian
Multiple Races
Black/African American
Unknown
Hawaiian/PacificIsland
American Indian or Alaska ..
Grand Total 604
1
1218181239
504
5941
1425254
34491
596
19
29227
42486
614
21218199
30524
600
11919301146
474
360
227
234125
242
379
12223306028
215
377
22322355231
212
336
2315286023
187
338
2119324033
193
4,798117
177195262296331
3,528
First-Time First-Year Students by Residential College and Race/Ethnicity
Race/Ethnicity 2015Cohort
2016Cohort
2017Cohort
2018Cohort
2019Cohort
GrandTotal
White
Hispanic/Latino
Non-Resident Alien
Asian
Multiple Races
Black/African American
Unknown
Hawaiian/PacificIsland
American Indian or Alaska ..
Grand Total 4,798117
177195262296331
3,528
964
1
3425415364
746
9731
13648556462
706
973
33251575973
698
950
23533476953
711
938
14038625179
667
First-Time First-Year Students by Race/Ethnicity
Race/Ethnicity
Not Residential College Participants
2015Cohort
2016Cohort
2017Cohort
2018Cohort
2019Cohort
Residential College Participants
2015Cohort
2016Cohort
2017Cohort
2018Cohort
2019Cohort
GrandTotal
White
Hispanic/Latino
Non-Resident Alien
Asian
Multiple Races
Black/African American
Unknown
Hawaiian/PacificIsland
American Indian or Alaska ..
0%
2%3%
3%
2%
6%
83%
0%
2%4%
4%
1%
6%
83%
0%
2%5%
4%
1%
7%
82%
0%
2%3%
3%
1%
5%
85%
0%
3%3%
5%
2%
8%
79%
6%2%
6%
11%
7%
67%
0%
6%6%
8%
16%
7%
57%
1%
6%6%
9%
14%
8%
56%
7%4%
8%
18%
7%
56%
6%6%
9%
12%
10%
57%
0%
0%0%
4%
4%
5%
6%7%
74%
% of First-Time First-Year Students by Residential College and Race/Ethnicity
Race/Ethnicity 2015Cohort
2016Cohort
2017Cohort
2018Cohort
2019Cohort
GrandTotal
White
Hispanic/Latino
Non-Resident Alien
Asian
Multiple Races
Black/African American
Unknown
Hawaiian/PacificIsland
American Indian or Alaska .. 0%
0%
0%
4%
4%5%
6%
7%
74%
0%
4%
3%
4%
5%
7%
77%
0%
0%
4%
5%
6%
7%
6%
73%
0%
3%
5%
6%
6%
8%
72%
0%
4%
3%
5%
7%
6%
75%
0%
4%
4%
7%
5%
8%
71%
% of First-Time First-Year Students by Race/Ethnicity
First Generation
Not Residential College Participants
2015Cohort
2016Cohort
2017Cohort
2018Cohort
2019Cohort
Residential College Participants
2015Cohort
2016Cohort
2017Cohort
2018Cohort
2019Cohort
GrandTotal
No
Yes
Grand Total 604
36
568
594
43
551
596
42
554
614
38
576
600
56
544
360
58
302
379
62
317
377
60
317
336
50
286
338
54
284
4,798
499
4,299
First-Time First-Year Students by Residential College and First-Generation
First Generation 2015Cohort
2016Cohort
2017Cohort
2018Cohort
2019Cohort
GrandTotal
No
Yes
Grand Total 4,798
499
4,299
964
94
870
973
105
868
973
102
871
950
88
862
938
110
828
First-Time First-Year Students by First-Gen
First Generation
Not Residential College Participants
2015Cohort
2016Cohort
2017Cohort
2018Cohort
2019Cohort
Residential College Participants
2015Cohort
2016Cohort
2017Cohort
2018Cohort
2019Cohort
GrandTotal
No
Yes 6%
94%
7%
93%
7%
93%
6%
94%
9%
91%
16%
84%
16%
84%
16%
84%
15%
85%
16%
84%
10%
90%
% of First-Time First-Year Students by Residential College and First-Generation
FirstGeneration
2015Cohort
2016Cohort
2017Cohort
2018Cohort
2019Cohort
GrandTotal
No
Yes 10%
90%
10%
90%
11%
89%
10%
90%
9%
91%
12%
88%
% of First-Time First-Year Students by First-Gen

INSTITUTIONAL RESEARCH & PLANNING | ACADEMICS, CO-CURRICULAR AND EXTRACURRICULAR ACTIVITIES | 43
Region
Not Residential College Participants
2015Cohort
2016Cohort
2017Cohort
2018Cohort
2019Cohort
Residential College Participants
2015Cohort
2016Cohort
2017Cohort
2018Cohort
2019Cohort
GrandTotal
Mid-Atlantic
New England
International
West
South
Midwest
Southwest
Grand Total 604
9
32
43
30
16
108
366
594
10
29
38
22
6
116
373
596
7
26
42
30
7
115
369
614
8
25
36
31
9
111
394
600
5
25
36
43
14
107
370
360
7
15
14
24
45
43
212
379
7
13
14
23
60
39
223
377
4
14
19
35
49
57
199
336
3
20
20
32
62
42
157
338
1
14
16
26
40
47
194
4,798
61
213
278
296
308
785
2,857
First-Time First-Year Students by Residential College and Region
Region 2015Cohort
2016Cohort
2017Cohort
2018Cohort
2019Cohort
GrandTotal
Mid-Atlantic
New England
International
West
South
Midwest
Southwest
Grand Total 4,798
61
213
278
296
308
785
2,857
964
16
47
57
54
61
151
578
973
17
42
52
45
66
155
596
973
11
40
61
65
56
172
568
950
11
45
56
63
71
153
551
938
6
39
52
69
54
154
564
First-Time First-Year Students by Region
Region
Not Residential College Participants
2015Cohort
2016Cohort
2017Cohort
2018Cohort
2019Cohort
Residential College Participants
2015Cohort
2016Cohort
2017Cohort
2018Cohort
2019Cohort
GrandTotal
Mid-Atlantic
New England
International
West
South
Midwest
Southwest 1%
5%
7%
5%
3%
18%
61%
2%
5%
6%
4%
1%
20%
63%
1%
4%
7%
5%
1%
19%
62%
1%
4%
6%
5%
1%
18%
64%
1%
4%
6%
7%
2%
18%
62%
2%
4%
4%
7%
13%
12%
59%
2%
3%
4%
6%
16%
10%
59%
1%
4%
5%
9%
13%
15%
53%
1%
6%
6%
10%
18%
13%
47%
0%
4%
5%
8%
12%
14%
57%
1%
4%
6%
6%
6%
16%
60%
% of First-Time First-Year Students by Residential College and Region
Region 2015Cohort
2016Cohort
2017Cohort
2018Cohort
2019Cohort
GrandTotal
Mid-Atlantic
New England
International
West
South
Midwest
Southwest 1%
4%
6%
6%
6%
16%
60%
2%
5%
6%
6%
6%
16%
60%
2%
4%
5%
5%
7%
16%
61%
1%
4%
6%
7%
6%
18%
58%
1%
5%
6%
7%
7%
16%
58%
1%
4%
6%
7%
6%
16%
60%
% of First-Time First-Year Students by Region
BucknellGrant
Not Residential College Participants
2015Cohort
2016Cohort
2017Cohort
2018Cohort
2019Cohort
Residential College Participants
2015Cohort
2016Cohort
2017Cohort
2018Cohort
2019Cohort
GrandTotal
No
Yes
Grand Total 604
241
363
594
263
331
596
257
339
614
250
364
600
272
328
360
222
138
379
217
162
377
233
144
336
195
141
338
219
119
4,798
2,369
2,429
First-Time First-Year Students by Residential College and Bucknell GrantBucknell Grant includes any merit or need-based Bucknell funding.
BucknellGrant
2015Cohort
2016Cohort
2017Cohort
2018Cohort
2019Cohort
GrandTotal
No
Yes
Grand Total 4,798
2,369
2,429
964
463
501
973
480
493
973
490
483
950
445
505
938
491
447
First-Time First-Year Students by Bucknell GrantBucknell Grant includes any merit or need-based Bucknell funding.
BucknellGrant
Not Residential College Participants
2015Cohort
2016Cohort
2017Cohort
2018Cohort
2019Cohort
Residential College Participants
2015Cohort
2016Cohort
2017Cohort
2018Cohort
2019Cohort
GrandTotal
No
Yes 40%
60%
44%
56%
43%
57%
41%
59%
45%
55%
62%
38%
57%
43%
62%
38%
58%
42%
65%
35%
49%
51%
% of First-Time First-Year Students by Residential College and Bucknell GrantBucknell Grant includes any merit or need-based Bucknell funding.
BucknellGrant
2015Cohort
2016Cohort
2017Cohort
2018Cohort
2019Cohort
GrandTotal
No
Yes 49%
51%
48%
52%
49%
51%
50%
50%
47%
53%
52%
48%
% of First-Time First-Year Students by Bucknell GrantBucknell Grant includes any merit or need-based Bucknell funding.

INSTITUTIONAL RESEARCH & PLANNING | ACADEMICS, CO-CURRICULAR AND EXTRACURRICULAR ACTIVITIES | 44
Not Residential College Participants
2015 Cohort 2016 Cohort 2017 Cohort 2018 Cohort 2019 Cohort
Residential College Participants
2015 Cohort 2016 Cohort 2017 Cohort 2018 Cohort 2019 Cohort
Avg. ACT Total
Avg. SAT Total
Avg. SAT Verbal/SATEvidence BasedReading &Writing_2017-2019
Avg. SAT Math
Avg. SAT Writing
Avg. High SchoolGPA
Avg. First Year GPA
3.52
674
656
1,331
30
3.23
3.54
672
654
1,326
30
3.28
3.50
670
657
1,327
29
3.24
3.48
632
649
624
1,273
30
3.27
3.50
633
655
627
1,282
29
3.66
692
661
1,353
31
3.29
3.60
689
661
1,350
30
3.28
3.61
679
656
1,336
30
3.27
3.60
644
683
637
1,319
30
3.26
3.60
642
678
647
1,325
30
Average Test Scores by Residential College(The 2017 - 2019 SAT scores are based on the redesigned SAT test)
Not Residential College Participants
2015 Cohort 2016 Cohort 2017 Cohort 2018 Cohort 2019 Cohort
Residential College Participants
2015 Cohort 2016 Cohort 2017 Cohort 2018 Cohort 2019 Cohort
Median ACT Total
Median SAT Total
Median SAT Verbal/SATEvidence BasedReading &Writing_2017-2019
Median SAT Math
Median SAT Writing
Median High SchoolGPA
Median First YearGPA
3.55
680
660
1,330
30
3.29
3.54
680
650
1,330
30
3.33
3.52
670
660
1,330
30
3.33
3.50
640
650
620
1,280
30
3.37
3.52
630
650
630
1,290
30
3.73
700
660
1,360
31
3.43
3.65
700
660
1,370
30
3.41
3.63
680
660
1,350
30
3.41
3.65
650
690
640
1,345
30
3.41
3.65
640
680
650
1,330
31
Median Test Scores by Residential College(The 2017-2019 SAT scores are based on the redesigned SAT test)

FACT BOOK BUCKNELL UNIVERSITY
STUDENT SUCCESS

INSTITUTIONAL RESEARCH & PLANNING | STUDENT SUCCESS | 45
STUDENT SUCCESS BUCKNELL UNIVERSITYStudent Sucess Bucknell University
Class of Entered Fall First-Year CohortReturned
Sophomore Year Retention RateGraduated
Within 4 YearsGraduation
Rate in 4 YrsGraduated
Within 6 YearsGraduation
Rate in 6 yrs
2003 1999 889 836
2004 2000 914 862
2005 2001 913 863
2006 2002 914 859
2007 2003 906 864
2008 2004 906* 867
2009 2005 920 883
2010 2006 922* 868
2011 2007 887 843
2012 2008 956* 896
2013 2009 920 865
2014 2010 929 870*
2015 2011 916 873
2016 2012 915* 861
2017 2013 933 869
2018 2014 938* 877
2019 2015 938 864
2020 2016 950 894
2021 2017 973 898
2022 2018 973 899
90%79785%75694%
89%81685%77394%
89%81786%78495%
89%81485%77994%
90%81588%79495%
92%83689%81795%
91%83787%80496%
90%83486%79394%
91%80587%77495%
89%84785%81494%
90%82785%78094%
88%81984%78294%
90%82886%79095%
88%80985%77494%
90%84086%80793%
84%78493%
83%78092%
94%
92%
92%
Cohort Retention and Graduation Rates*Adjusted for permissible omissions or changes in Banner data

INSTITUTIONAL RESEARCH & PLANNING | STUDENT SUCCESS | 46
2014 2015 2016 2017 2018 Grand Total
# of Initial Entering Cohort
# of Returning Students
Fall to Fall Retention Rate 93%
4,431
4,772
92%
899
973
92%
898
973
94%
894
950
92%
864
938
93%
876
938
A Summary of Retention Data _First-Time First-Year Students among Cohorts Entering in ---
Citizenship 2014 2015 2016 2017 2018 Grand Total
Dual Citizenship (UF)
Nonresident Alien (NA)
Resident Alien (RA)
US 93%
94%
96%
91%
92%
100%
94%
92%
93%
86%
92%
90%
94%
100%
96%
93%
91%
100%
100%
94%
93%
88%
98%
89%
College 2014 2015 2016 2017 2018 Grand Total
College of Arts & Sciences
College of Engineering
Freeman College of Management 93%
95%
92%
96%
95%
91%
95%
93%
92%
89%
98%
94%
87%
97%
92%
97%
95%
92%
Race/Ethnicity 2014 2015 2016 2017 2018 Grand Total
American Indian or Alaska Native
Asian
Black/African American
Hispanic/Latino
Multiple Races
Non-Resident Alien
Unknown
White 92%
100%
96%
93%
94%
94%
94%
100%
92%
100%
94%
90%
95%
92%
91%
100%
92%
100%
92%
94%
92%
94%
95%
94%
100%
96%
94%
98%
94%
94%
91%
100%
100%
95%
92%
95%
95%
93%
100%
98%
93%
92%
93%
93%
First Generation 2014 2015 2016 2017 2018 Grand Total
No
Yes 92%
93%
90%
93%
91%
92%
93%
94%
93%
92%
93%
93%
Posse 2014 2015 2016 2017 2018 Grand Total
Not POSSE
POSSE 98%
93%
100%
92%
97%
92%
100%
94%
97%
92%
97%
93%
Pell 2014 2015 2016 2017 2018 Grand Total
No PELL
Pell 92%
93%
92%
92%
90%
93%
94%
94%
93%
92%
89%
94%
Gender 2014 2015 2016 2017 2018 Grand Total
Female
Male 92%
93%
91%
93%
92%
92%
95%
93%
91%
93%
92%
95%
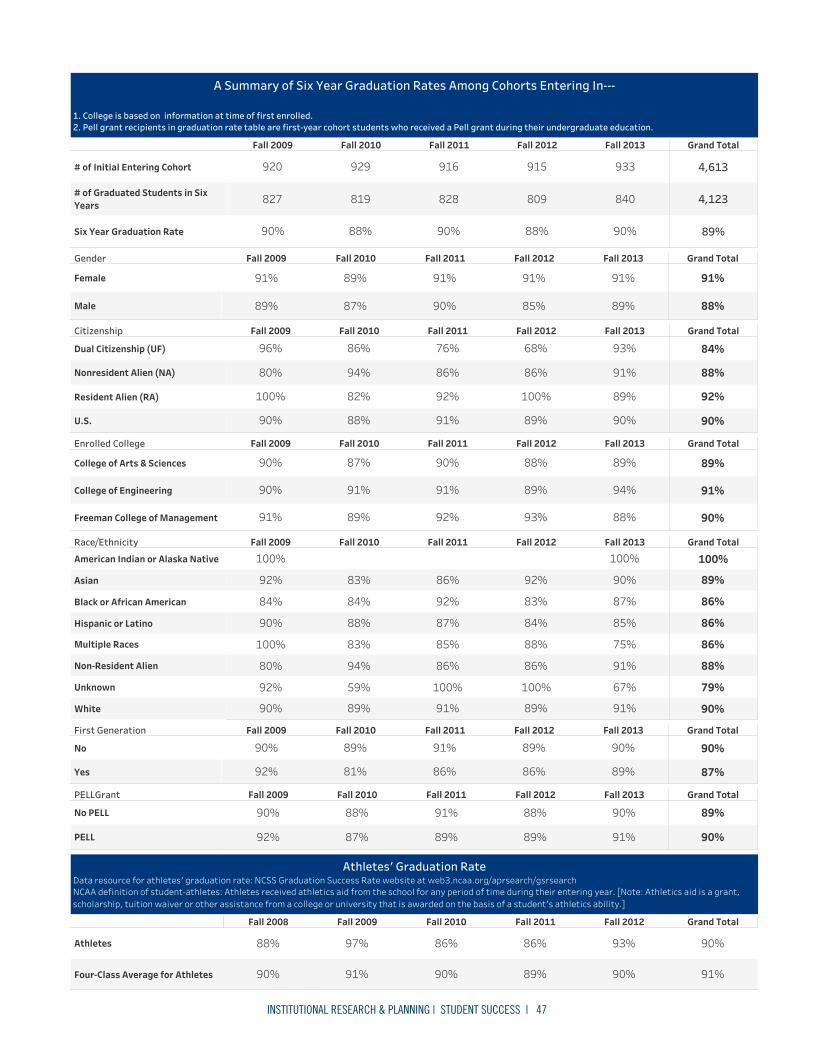
INSTITUTIONAL RESEARCH & PLANNING | STUDENT SUCCESS | 47
Fall 2009 Fall 2010 Fall 2011 Fall 2012 Fall 2013 Grand Total
# of Initial Entering Cohort
# of Graduated Students in SixYears
Six Year Graduation Rate 89%
4,123
4,613
90%
840
933
88%
809
915
90%
828
916
88%
819
929
90%
827
920
A Summary of Six Year Graduation Rates Among Cohorts Entering In---
1. College is based on information at time of first enrolled.2. Pell grant recipients in graduation rate table are first-year cohort students who received a Pell grant during their undergraduate education.
Gender Fall 2009 Fall 2010 Fall 2011 Fall 2012 Fall 2013 Grand Total
Female
Male 88%
91%
89%
91%
85%
91%
90%
91%
87%
89%
89%
91%
Citizenship Fall 2009 Fall 2010 Fall 2011 Fall 2012 Fall 2013 Grand Total
Dual Citizenship (UF)
Nonresident Alien (NA)
Resident Alien (RA)
U.S. 90%
92%
88%
84%
90%
89%
91%
93%
89%
100%
86%
68%
91%
92%
86%
76%
88%
82%
94%
86%
90%
100%
80%
96%
Enrolled College Fall 2009 Fall 2010 Fall 2011 Fall 2012 Fall 2013 Grand Total
College of Arts & Sciences
College of Engineering
Freeman College of Management 90%
91%
89%
88%
94%
89%
93%
89%
88%
92%
91%
90%
89%
91%
87%
91%
90%
90%
Race/Ethnicity Fall 2009 Fall 2010 Fall 2011 Fall 2012 Fall 2013 Grand Total
American Indian or Alaska Native
Asian
Black or African American
Hispanic or Latino
Multiple Races
Non-Resident Alien
Unknown
White 90%
79%
88%
86%
86%
86%
89%
100%
91%
67%
91%
75%
85%
87%
90%
100%
89%
100%
86%
88%
84%
83%
92%
91%
100%
86%
85%
87%
92%
86%
89%
59%
94%
83%
88%
84%
83%
90%
92%
80%
100%
90%
84%
92%
100%
First Generation Fall 2009 Fall 2010 Fall 2011 Fall 2012 Fall 2013 Grand Total
No
Yes 87%
90%
89%
90%
86%
89%
86%
91%
81%
89%
92%
90%
PELLGrant Fall 2009 Fall 2010 Fall 2011 Fall 2012 Fall 2013 Grand Total
No PELL
PELL 90%
89%
91%
90%
89%
88%
89%
91%
87%
88%
92%
90%
Fall 2008 Fall 2009 Fall 2010 Fall 2011 Fall 2012 Grand Total
Athletes
Four-Class Average for Athletes 91%
90%
90%
93%
89%
86%
90%
86%
91%
97%
90%
88%
Athletes' Graduation RateData resource for athletes' graduation rate: NCSS Graduation Success Rate website at web3.ncaa.org/aprsearch/gsrsearchNCAA definition of student-athletes: Athletes received athletics aid from the school for any period of time during their entering year. [Note: Athletics aid is a grant,scholarship, tuition waiver or other assistance from a college or university that is awarded on the basis of a student's athletics ability.]
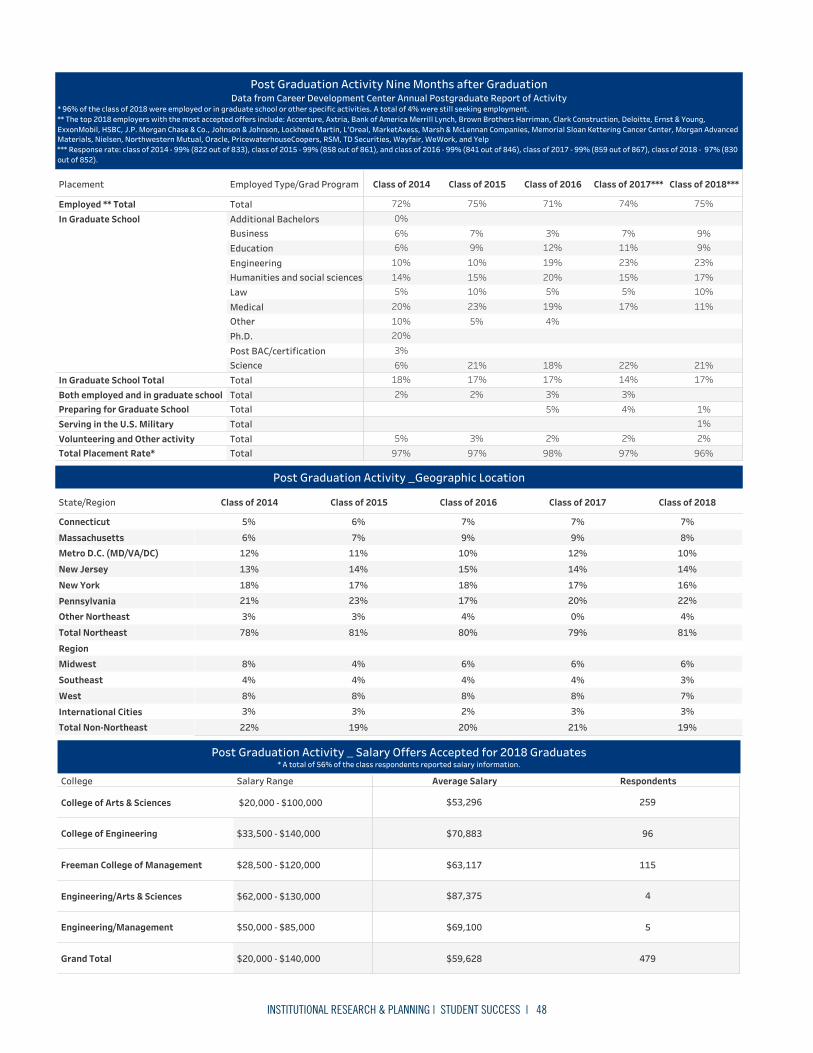
INSTITUTIONAL RESEARCH & PLANNING | STUDENT SUCCESS | 48
Placement Employed Type/Grad Program Class of 2014 Class of 2015 Class of 2016 Class of 2017*** Class of 2018***
Employed ** Total TotalIn Graduate School Additional Bachelors
BusinessEducationEngineeringHumanities and social sciencesLawMedicalOtherPh.D.Post BAC/certificationScience
In Graduate School Total TotalBoth employed and in graduate school TotalPreparing for Graduate School TotalServing in the U.S. Military TotalVolunteering and Other activity TotalTotal Placement Rate* Total
75%74%71%75%72%
21%
11%10%17%23%9%9%
22%
17%5%15%23%11%7%
18%
4%19%5%20%19%12%3%
21%
5%23%10%15%10%9%7%
6%3%20%10%20%5%14%10%6%6%0%
17%14%17%17%18%3%3%2%2%
1%4%5%1%2%2%2%3%5%96%97%98%97%97%
Post Graduation Activity Nine Months after GraduationData from Career Development Center Annual Postgraduate Report of Activity
* 96% of the class of 2018 were employed or in graduate school or other specific activities. A total of 4% were still seeking employment.** The top 2018 employers with the most accepted offers include: Accenture, Axtria, Bank of America Merrill Lynch, Brown Brothers Harriman, Clark Construction, Deloitte, Ernst & Young,ExxonMobil, HSBC, J.P. Morgan Chase & Co., Johnson & Johnson, Lockheed Martin, L'Oreal, MarketAxess, Marsh & McLennan Companies, Memorial Sloan Kettering Cancer Center, Morgan AdvancedMaterials, Nielsen, Northwestern Mutual, Oracle, PricewaterhouseCoopers, RSM, TD Securities, Wayfair, WeWork, and Yelp*** Response rate: class of 2014 - 99% (822 out of 833), class of 2015 - 99% (858 out of 861), and class of 2016 - 99% (841 out of 846), class of 2017 - 99% (859 out of 867), class of 2018 - 97% (830out of 852).
State/Region Class of 2014 Class of 2015 Class of 2016 Class of 2017 Class of 2018
Connecticut
Massachusetts
Metro D.C. (MD/VA/DC)
New Jersey
New York
Pennsylvania
Other Northeast
Total Northeast
Region
Midwest
Southeast
West
International Cities
Total Non-Northeast 19%
3%7%
3%
6%
81%
4%
22%16%
14%
10%8%
7%
21%
3%8%
4%
6%
79%
0%
20%17%
14%
12%9%
7%
20%
2%8%
4%
6%
80%
4%
17%18%
15%
10%9%
7%
19%
3%8%
4%
4%
81%
3%
23%17%
14%
11%7%
6%
22%
3%8%
4%
8%
78%
3%
21%18%
13%
12%6%
5%
Post Graduation Activity _Geographic Location
College Salary Range Average Salary Respondents
College of Arts & Sciences $20,000 - $100,000
College of Engineering $33,500 - $140,000
Freeman College of Management $28,500 - $120,000
Engineering/Arts & Sciences $62,000 - $130,000
Engineering/Management $50,000 - $85,000
Grand Total $20,000 - $140,000
259$53,296
96$70,883
115$63,117
4$87,375
5$69,100
479$59,628
Post Graduation Activity _ Salary Offers Accepted for 2018 Graduates* A total of 56% of the class respondents reported salary information.

INSTITUTIONAL RESEARCH & PLANNING | STUDENT SUCCESS | 49
2015 2016 2017 2018 2019Africana StudiesAnimal BehaviorArt & Art HistoryBiologyChemistryClassicsComparative HumanitiesEconomicsEducationEnglishEnvironmental StudiesGeographyGeology & Environmental GeosciencesHistoryInternational RelationsLanguages, Cultures & LinguisticsMathematicsMusicNeurosciencePhilosophyPhysics/ AstronomyReligionPsychologySociology & AnthropologyTheatreWomen's & Gender StudiesManagementBiomedical EngineeringChemical EngineeringCivil EngineeringElectrical EngineeringUndeclared EngineeringMechanical EngineeringAction Research/A&SAction Research/ENGRAction Research/MGMTBucknell Geisinger Research InitiativeBucknell Institute for Public PolicyBucknell Center for Sustainability & The EnvironmentBrawley Fund (Multicultural Students)Cell Bio/ BIO ChemClare Boothe LuceJamie Hendry FundHumanities CenterInstitute for Leadership in Sustainable TechnologyLibrary & Information Technology*McKenna FundProvostSTEM ScholarsGriot InstituteComputer ScienceInstitute for Leadership in Technology & ManagementHourly Wage**Total 261
770412700500090158000011111219101204081102200610021002125101
28001910127059913091095000071676137000511241124004333143102032210
268022902815312700008140000129158177100310042113012700355002021020
242001803438013010003740001412510710000290111010002400350012131200
25700902917011050001298243104710165100115060110201800322212532020
Undergraduate Summer Research Participation in 2015-2019 by Discipline and/or Funding Source* L&IT supported UG research long before 2017.
** Headcounts by discipline from 2015-2018 include students received both stipend and hourly wages. The data for discipline of wage earners in 2019 isunavailable.
2015 2016 2017 2018 2019Arts & SciencesEngineeringInterdisciplinary FundingManagementHourly WageInstitutional Total 261
770564979
280
010666108
268
11007790
242
0737693
257
19161104
Undergraduate Summer Research Participation in 2015-2019 by College
Arts & Sciences EngineeringInterdisciplinary
FundingManagement Hourly Wage Institutional Total
2015
2016
2017
2018
2019
2015
2016
2017
2018
2019
2015
2016
2017
2018
2019
2015
2016
2017
2018
2019
2015
2016
2017
2018
2019
2015
2016
2017
2018
2019
0100
200
300
Value
104 10893 90 79 61 76 77 66 4910010691 73 56
1 0 1 0 077
257242268280261
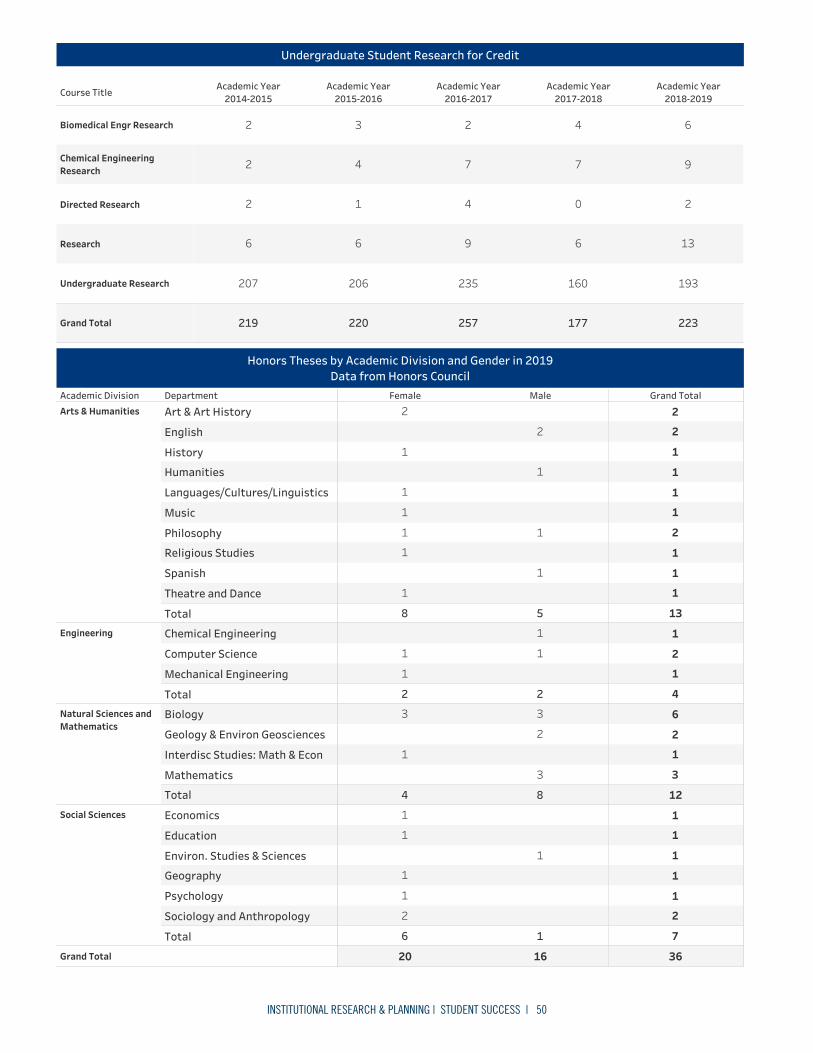
INSTITUTIONAL RESEARCH & PLANNING | STUDENT SUCCESS | 50
Biomedical Engr R.. Chemical Engineer.. Directed Research Research Undergraduate Re..
Undergraduate Student Research for Credit
Academic Division Department Female Male Grand TotalArts & Humanities Art & Art History
English
History
Humanities
Languages/Cultures/Linguistics
Music
Philosophy
Religious Studies
Spanish
Theatre and Dance
TotalEngineering Chemical Engineering
Computer Science
Mechanical Engineering
TotalNatural Sciences andMathematics
Biology
Geology & Environ Geosciences
Interdisc Studies: Math & Econ
Mathematics
Total
Social Sciences Economics
Education
Environ. Studies & Sciences
Geography
Psychology
Sociology and Anthropology
Total
Grand Total
13
1
1
1
2
1
1
1
1
2
2
5
1
1
1
2
8
1
1
1
1
1
1
2
4
1
2
1
2
1
1
2
1
1
12
3
1
2
6
8
3
2
3
4
1
3
7
2
1
1
1
1
1
1
1
6
2
1
1
1
1
361620
Honors Theses by Academic Division and Gender in 2019Data from Honors Council
Course TitleAcademic Year
2014-2015Academic Year
2015-2016Academic Year
2016-2017Academic Year
2017-2018Academic Year
2018-2019
Biomedical Engr Research
Chemical EngineeringResearch
Directed Research
Research
Undergraduate Research
Grand Total 223
193
13
2
9
6
177
160
6
0
7
4
257
235
9
4
7
2
220
206
6
1
4
3
219
207
6
2
2
2

FACT BOOK BUCKNELL UNIVERSITY
FACULTY & STAFF

INSTITUTIONAL RESEARCH & PLANNING | FACULTY & STAFF | 51
FACULTY & STAFF BUCKNELL UNIVERSITYFaculty and Staff Bucknell University
Gender Tenured Tenure Track Visiting Other Replacement Grand Total
F
M
Grand Total 423246177
332013
523
231112
1135954
24915495
Full-Time Faculty Head Counts by Faculty Type and Gender as of Fall 2019
Race/Ethnicity Description Tenured Tenure Track Visiting Other Replacement Grand Total
American Indian or Alaska NativeAsianBlack or African AmericanHispanic or LatinoMultiple RacesNon-Resident AlienUnknownWhiteGrand Total 423
32812682015232
3325
3
1
4
55
2318
311
113681
174878
249212
33
108
112
Full-Time Faculty Head Counts by Faculty Type and Race/Ethnicity as of Fall 2019
Recoded Race/Ethinicity Tenured Tenure Track Visiting Other Replacement Grand Total
Faculty of ColorNon-Resident AlienUnknownWhiteGrand Total 423
32812668
3325
35
55
2318
32
113681
1727
249212
334
Full-Time Faculty Head Counts by Faculty Type and Recoded Race/Ethnicity as of Fall 2019
Current Rank Tenured Tenure Track Visiting Other Replacement Grand Total
Assistant Professor
Associate Professor
Professor
Instructor
Grand Total 4234
127131161
33
33
51121
2331
19
113
32
108
249
122127
Full-Time Faculty Head Counts by Faculty Type and Rank as of Fall 2019
Terminal Degree Tenured Tenure Track Visiting Other Replacement Grand Total
No
Yes
Grand Total 423
398
25
33
26
7
5
5
23
16
7
113
107
6
249
249
Full-Time Faculty Head Counts by Faculty Type and Terminal Degree as of Fall 2019
College Tenured Tenure Track Visiting Other Replacement Grand Total
College of Arts & Sciences
College of Engineering
Freeman College of Management
Grand Total 423
31
74318
33
2
3
28
5
2
3
23
4
4
15
113
10
23
80
249
13
44
192
Full-Time Faculty Head Counts by Faculty Type and College as of Fall 2019

INSTITUTIONAL RESEARCH & PLANNING | FACULTY & STAFF | 52
College Gender Tenured Tenure Track Visiting Other Replacement Grand Total
College of Arts & Sciences FMTotal
College of Engineering FMTotal
Freeman College ofManagement
FMTotal
Grand Total
318175143
281810
3
3
1569
803842
19211379
745321
312
431
23167
443311
311813
211
22
422
1055
1385
42333523113249
Full-Time Faculty Head Counts by Faculty Type, College, and Gender as of Fall 2019
College Race/Ethnicity Description Tenured Tenure Track Visiting Other Replacement Grand Total
College of Arts & Sciences American Indian or Alaska Native
Asian
Black or African American
Hispanic or Latino
Multiple Races
Non-Resident Alien
Unknown
White
Total
College of Engineering American Indian or Alaska Native
Asian
Hispanic or Latino
Multiple Races
Non-Resident Alien
White
Total
Freeman College ofManagement
Asian
Non-Resident Alien
White
Total
Grand Total
318248
1167
1615141
2823
2
1
2
33
1513
11
80461
103776
192163
338861
745661461
321
412
1
23173111
4436
251
312443
2
2
22
44
10541
1313
42333523113249
Full-Time Faculty Head Counts by Faculty Type, College, and Race/Ethnicity as of Fall 2019
College Current Rank Tenured Tenure Track Visiting Other Replacement Grand Total
College of Arts & Sciences Assistant ProfessorAssociate ProfessorInstructorProfessorTotal
College of Engineering Assistant ProfessorAssociate ProfessorProfessorTotal
Freeman College ofManagement
Assistant ProfessorAssociate ProfessorProfessorTotal
Grand Total
318974
100117
28
28
3111
1513
11
801
178
19294
98
74222329
3
3
4
4
23
122
442222
3188
15
2
2
2
11
4
4
102
8
1367
42333523113249
Full-Time Faculty Head Counts by Faculty Type, College, and Rank as of Fall 2019
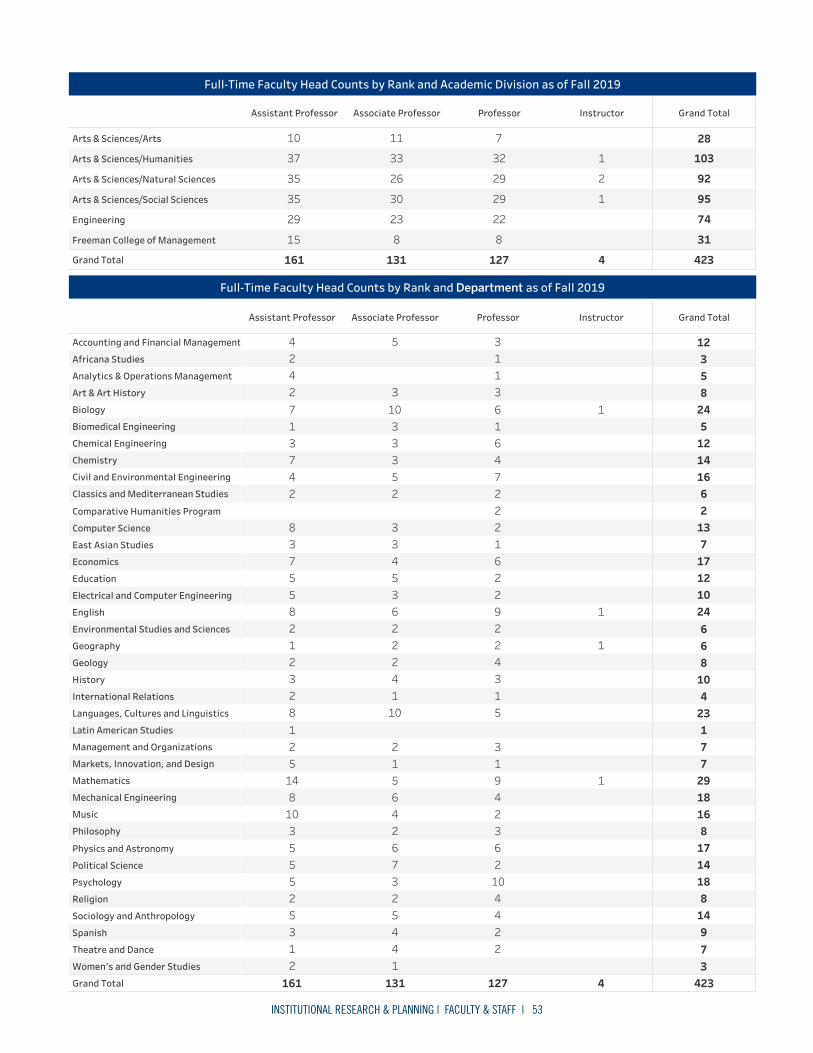
INSTITUTIONAL RESEARCH & PLANNING | FACULTY & STAFF | 53
Assistant Professor Associate Professor Professor Instructor Grand Total
Arts & Sciences/Arts
Arts & Sciences/Humanities
Arts & Sciences/Natural Sciences
Arts & Sciences/Social Sciences
Engineering
Freeman College of Management
Grand Total 423
31
74
95
92
103
28
4
1
2
1
127
8
22
29
29
32
7
131
8
23
30
26
33
11
161
15
29
35
35
37
10
Full-Time Faculty Head Counts by Rank and Academic Division as of Fall 2019
Assistant Professor Associate Professor Professor Instructor Grand Total
Accounting and Financial Management
Africana Studies
Analytics & Operations Management
Art & Art History
Biology
Biomedical Engineering
Chemical Engineering
Chemistry
Civil and Environmental Engineering
Classics and Mediterranean Studies
Comparative Humanities Program
Computer Science
East Asian Studies
Economics
Education
Electrical and Computer Engineering
English
Environmental Studies and Sciences
Geography
Geology
History
International Relations
Languages, Cultures and Linguistics
Latin American Studies
Management and Organizations
Markets, Innovation, and Design
Mathematics
Mechanical Engineering
Music
Philosophy
Physics and Astronomy
Political Science
Psychology
Religion
Sociology and Anthropology
Spanish
Theatre and Dance
Women's and Gender Studies
Grand Total 423379148181417816182977123410866241012177132616141252485312
4
1
1
1
1
127
22441026324913
51342292261222746163113
13114452376246512
1014222635433
25333103
5
16121352555310814521823212855738
2473172424
Full-Time Faculty Head Counts by Rank and Department as of Fall 2019
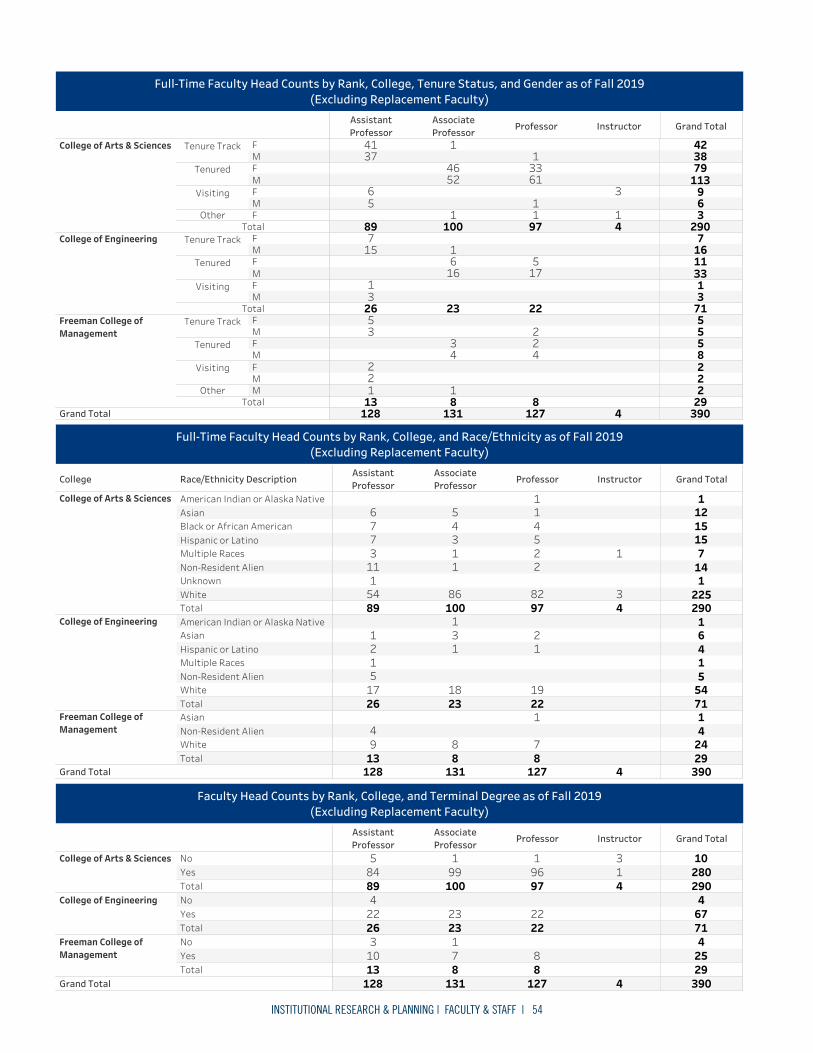
INSTITUTIONAL RESEARCH & PLANNING | FACULTY & STAFF | 54
AssistantProfessor
AssociateProfessor
Professor Instructor Grand Total
College of Arts & Sciences Tenure Track FM
Tenured FM
Visiting FM
Other FTotal
College of Engineering Tenure Track FM
Tenured FM
Visiting FM
TotalFreeman College ofManagement
Tenure Track FM
Tenured FM
Visiting FM
Other MTotal
Grand Total
3842
11
3741
11379
6133
5246
693
156
311129049710089
167
1157
3311
175
166
31
31
71222326
55
235
85
42
43
22
22
211298813
3904127131128
Full-Time Faculty Head Counts by Rank, College, Tenure Status, and Gender as of Fall 2019(Excluding Replacement Faculty)
College Race/Ethnicity DescriptionAssistantProfessor
AssociateProfessor
Professor Instructor Grand Total
College of Arts & Sciences American Indian or Alaska NativeAsianBlack or African AmericanHispanic or LatinoMultiple RacesNon-Resident AlienUnknownWhiteTotal
College of Engineering American Indian or Alaska NativeAsianHispanic or LatinoMultiple RacesNon-Resident AlienWhiteTotal
Freeman College ofManagement
AsianNon-Resident AlienWhiteTotal
Grand Total
290225
1147
1515121
43
1
9782
225411
10086
11345
89541
113776
715451461
2219
12
2318
131
26175121
292441
87
1
88
1394
3904127131128
Full-Time Faculty Head Counts by Rank, College, and Race/Ethnicity as of Fall 2019(Excluding Replacement Faculty)
AssistantProfessor
AssociateProfessor
Professor Instructor Grand Total
College of Arts & Sciences NoYesTotal
College of Engineering NoYesTotal
Freeman College ofManagement
NoYesTotal
Grand Total
29028010
413
97961
100991
89845
71674
2222
2323
26224
29254
88
871
13103
3904127131128
Faculty Head Counts by Rank, College, and Terminal Degree as of Fall 2019(Excluding Replacement Faculty)

INSTITUTIONAL RESEARCH & PLANNING | FACULTY & STAFF | 55
Academic Division 2015 2016 2017 2018 2019 Grand Total
Arts & Sciences/Arts
Arts & Sciences/Humanities
Arts & Sciences/Natural Sciences
Arts & Sciences/Social Sciences
Engineering
Freeman College of Management
Grand Total 1,911
127
359
422
395
469
139
390
29
71
86
82
94
28
384
27
70
86
78
95
28
384
23
72
86
78
96
29
378
23
74
83
79
92
27
375
25
72
81
78
92
27
Full-Time Faculty Head Counts by Academic Division from 2015 to 2019(Excluding Replacement Faculty)
Academic Division 2015 2016 2017 2018 2019 Grand Total
Arts & Sciences/Arts
Arts & Sciences/Humanities
Arts & Sciences/Natural Sciences
Arts & Sciences/Social Sciences
Engineering
Freeman College of Management
Grand Total 312
7
55
71
35
115
29
63
1
12
14
7
23
6
59
1
10
14
7
21
6
65
2
10
15
7
25
6
63
1
11
13
7
25
6
62
2
12
15
7
21
5
Full-Time Faculty of Color Head Counts by Academic Division from 2015 to 2019(Excluding Replacement Faculty)
Academic Division 2015 2016 2017 2018 2019 Grand Total
Arts & Sciences/Arts
Arts & Sciences/Humanities
Arts & Sciences/Natural Sciences
Arts & Sciences/Social Sciences
Engineering
Freeman College of Management
Grand Total 16%
6%
15%
17%
9%
25%
21%
16%
3%
17%
16%
9%
24%
21%
15%
4%
14%
16%
9%
22%
21%
17%
9%
14%
17%
9%
26%
21%
17%
4%
15%
16%
9%
27%
22%
17%
8%
17%
19%
9%
23%
19%
% of Full-Time Faculty of Color by Academic Division from 2015 to 2019(Excluding Replacement Faculty)
2015 2016 2017 2018 2019
0%
5%
10%
15%
20%
25%
% o
f Fac
ulty
of C
olor
24%
21%
4%
15%
19%
21%21%
26%
16%16%
4%
9%
17%
27%
23%
14%
3%
22%
17%
9%8% 9%9%9%9%
22%
14%
17% 16%
Academic DivisionArts & Sciences/ArtsArts & Sciences/HumanitiesArts & Sciences/Natural Sciences
Arts & Sciences/Social SciencesEngineeringFreeman College of Management

INSTITUTIONAL RESEARCH & PLANNING | FACULTY & STAFF | 56
College of Arts & Sciences College of Engineering Freeman College of Management
2015 2016 2017 2018 2019 2015 2016 2017 2018 2019 2015 2016 2017 2018 2019
0
10
20
30
40
Num
ber o
f Rec
ords 31
37
3134 35
119
57
41
3 35
7
Newly Hired Faculty Head Counts by College from 2015 to 2019
College Recoded Race/Ethinicity GenderYear Date
2015 2016 2017 2018 2019 Grand TotalCollege of Arts &Sciences
Faculty of Color FM
Non-Resident Alien FM
White FM
Unknown FM
College ofEngineering
Faculty of Color FM
Non-Resident Alien FM
White FM
Unknown FM
Freeman College ofManagement
Faculty of Color FM
Non-Resident Alien FM
White FM
Unknown FGrand Total
2123
53
13
37
55
75
1310
11
41
23
42
23
4548
169
712
88
1010
49
35
3311
51
11121
73
11
32
3
116
122
432
12
21
21
33
21
111
12
111
62
21
11
21222234650414541
Newly Hired Faculty Head Counts by College, Race/Ethnicity, and Gender from 2015 to 2019
College Current Rank Tenure Desc GenderYear Date
2015 2016 2017 2018 2019 Grand TotalCollege of Arts &Sciences
Assistant Professor Non-Tenured FM
On Track FM
Associate Professor On Track FM
Tenured MProfessor Non-Tenured M
On Track FInstructor Non-Tenured FOther Non-Tenured F
MCollege ofEngineering
Assistant Professor Non-Tenured FM
On Track FM
Associate Professor On Track MProfessor Non-Tenured M
Freeman College ofManagement
Assistant Professor Non-Tenured FM
On Track FM
Associate Professor Non-Tenured FProfessor On Track M
Grand Total
4544
166
89
711
109
49
2932
55
79
65
68
55
321
121
1111113111
342
122
129
11
52
32
22
12
112
131
2141
1111
75
313
221
13
1111
112112234650414541
Newly Hired Faculty Head Counts by College, Rank, Tenure Status, and Gender from 2015 to 2019

INSTITUTIONAL RESEARCH & PLANNING | FACULTY & STAFF | 57
Full-Time Faculty Highest Degrees Earned Conferring InstitutionsFall 2019
Institution
American University
Arizona State University
Bloomsburg University of Pennsylvania
Börsen und Finanzakademie Frankfurt
Boston University
Brandeis University
Brown University
California Institute of Technology
Cambridge College
Carnegie Mellon University
Claremont Graduate University
Clark University
Clemson University
College of William and Mary
Colorado School of Mines
Colorado State University
Columbia University in the City of New York
Cornell University
Dartmouth College
Delaware State University
Duke University
Emory University
Fachhochschule Mainz
Fordham University
Georgetown University
Hanken School of Economics
Harvard University
Henley Business School University of Reading
Illinois Institute of Technology
Indiana University of Pennsylvania-Main Campus
Indiana University-Bloomington
Iowa State University
Johns Hopkins University
Lehigh University
London School of Economics and Political Science
Louisiana State University
Massachusetts Institute of Technology
McGill University
McMaster University
Michigan State University
Middlebury College
Moscow State University of Culture and Arts
New England College
New Mexico State University-Main Campus
New School
New York University
North Carolina State University at Raleigh
North Dakota State University-Main Campus
Northeastern University
Northwestern College
Northwestern University
Ohio State University-Main Campus
Oregon State University
Pennsylvania State University-College of Medicine
Pennsylvania State University-Main Campus
Pratt Institute-Main
Princeton University
Purdue University-Main Campus
Queens University
Rensselaer Polytechnic Institute
Rice University
Rutgers University-New Brunswick
Rutgers University-Newark
10
14
30
2
1
1
2
1
6
1
1
4
1
2
1
1
1
2
7
3
1
1
1
1
1
1
5
1
1
1
6
2
2
1
1
1
3
1
1
5
1
1
1
1
1
3
3
1
1
1
2
8
2
1
2
1
6
1
2
1
1
5
1
Institution
Smith College
Stanford University
Stony Brook University
SUNY at Albany
Syracuse University
Texas A & M University-Corpus Christi
The University of Tennessee
The University of Texas at Austin
Tufts University
Universität Otto Friedrich Universität Bamberg
University of Arizona
University of British Columbia
University of California-Berkeley
University of California-Davis
University of California-Irvine
University of California-Los Angeles
University of California-Riverside
University of California-San Diego
University of California-Santa Barbara
University of Chicago
University of Cincinnati-Main Campus
University of Colorado at Boulder
University of Connecticut
University of Denver
University of Florida
University of Georgia
University of Illinois at Chicago
University of Illinois at Urbana-Champaign
University of Iowa
University of Manitoba
University of Maryland-College Park
University of Massachusetts Amherst
University of Melbourne
University of Memphis
University of Miami
University of Michigan-Ann Arbor
University of Minnesota-Twin Cities
University of Missouri
University of Missouri-Columbia
University of Missouri-St Louis
University of Nebraska at Omaha
University of New Mexico-Main Campus
University of North Carolina at Chapel Hill
University of Pennsylvania
University of Pittsburgh-Pittsburgh Campus
University of Rhode Island
University of Rochester
University of South Carolina-Columbia
University of Southern California
University of Utah
University of Virginia-Main Campus
University of Washington-Seattle Campus
University of Washington-Tacoma Campus
University of Western Ontario
University of Wisconsin-Madison
Vanderbilt University
Villanova University
Virginia Commonwealth University
Virginia Polytechnic Institute and State University
Washington State University
Washington University in St Louis
Worcester Polytechnic Institute
Yale University
York University
10
10
12
13
11
1
2
7
1
1
2
1
3
5
2
3
2
4
5
5
3
6
2
1
2
5
1
6
5
1
4
3
1
1
2
7
2
1
2
1
1
1
1
5
3
1
3
2
2
2
2
6
1
1
2
2
1
1
1
2
4
1
4
1
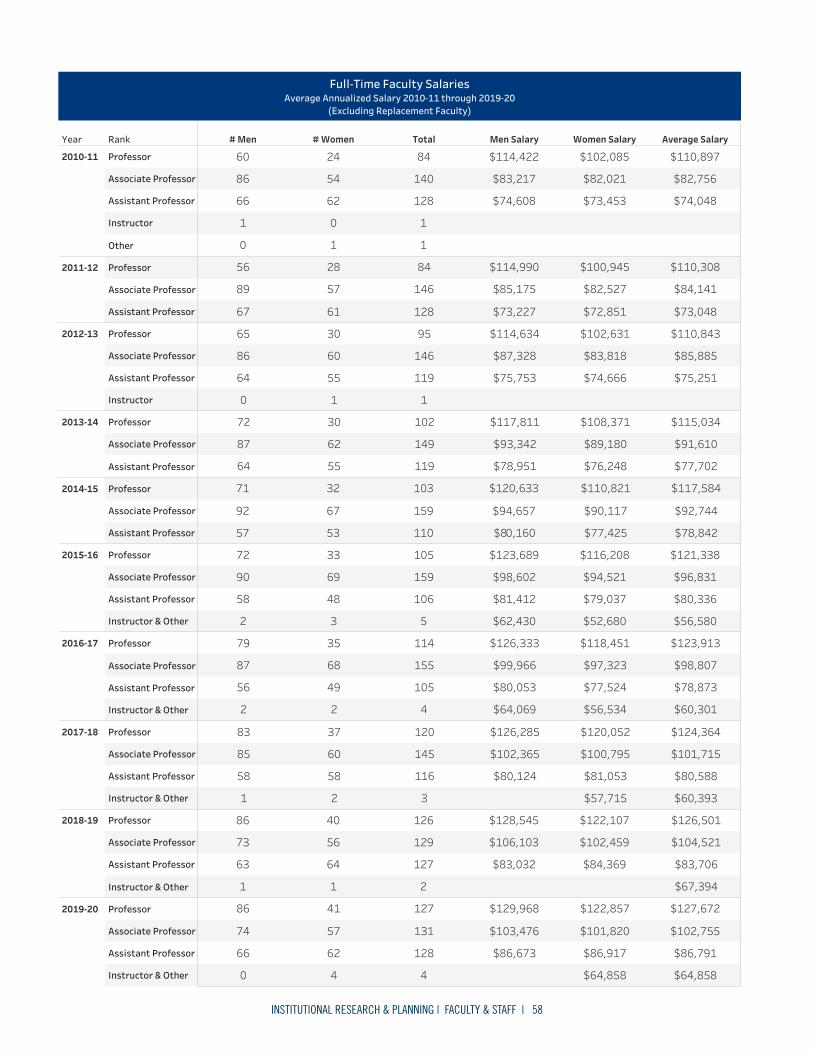
INSTITUTIONAL RESEARCH & PLANNING | FACULTY & STAFF | 58
Year Rank # Men # Women Total Men Salary Women Salary Average Salary
2010-11 Professor
Associate Professor
Assistant Professor
Instructor
Other
2011-12 Professor
Associate Professor
Assistant Professor
2012-13 Professor
Associate Professor
Assistant Professor
Instructor
2013-14 Professor
Associate Professor
Assistant Professor
2014-15 Professor
Associate Professor
Assistant Professor
2015-16 Professor
Associate Professor
Assistant Professor
Instructor & Other
2016-17 Professor
Associate Professor
Assistant Professor
Instructor & Other
2017-18 Professor
Associate Professor
Assistant Professor
Instructor & Other
2018-19 Professor
Associate Professor
Assistant Professor
Instructor & Other
2019-20 Professor
Associate Professor
Assistant Professor
Instructor & Other
$74,048
$82,756
$110,897
$73,453
$82,021
$102,085
$74,608
$83,217
$114,422
1
1
128
140
84
1
0
62
54
24
0
1
66
86
60
$73,048
$84,141
$110,308
$72,851
$82,527
$100,945
$73,227
$85,175
$114,990
128
146
84
61
57
28
67
89
56
$75,251
$85,885
$110,843
$74,666
$83,818
$102,631
$75,753
$87,328
$114,634
1
119
146
95
1
55
60
30
0
64
86
65
$77,702
$91,610
$115,034
$76,248
$89,180
$108,371
$78,951
$93,342
$117,811
119
149
102
55
62
30
64
87
72
$78,842
$92,744
$117,584
$77,425
$90,117
$110,821
$80,160
$94,657
$120,633
110
159
103
53
67
32
57
92
71
$56,580
$80,336
$96,831
$121,338
$52,680
$79,037
$94,521
$116,208
$62,430
$81,412
$98,602
$123,689
5
106
159
105
3
48
69
33
2
58
90
72
$60,301
$78,873
$98,807
$123,913
$56,534
$77,524
$97,323
$118,451
$64,069
$80,053
$99,966
$126,333
4
105
155
114
2
49
68
35
2
56
87
79
$60,393
$80,588
$101,715
$124,364
$57,715
$81,053
$100,795
$120,052
$80,124
$102,365
$126,285
3
116
145
120
2
58
60
37
1
58
85
83
$67,394
$83,706
$104,521
$126,501
$84,369
$102,459
$122,107
$83,032
$106,103
$128,545
2
127
129
126
1
64
56
40
1
63
73
86
$64,858
$86,791
$102,755
$127,672
$64,858
$86,917
$101,820
$122,857
$86,673
$103,476
$129,968
4
128
131
127
4
62
57
41
0
66
74
86
Full-Time Faculty SalariesAverage Annualized Salary 2010-11 through 2019-20
(Excluding Replacement Faculty)

INSTITUTIONAL RESEARCH & PLANNING | FACULTY & STAFF | 59
2015FT PT Total
2016FT PT Total
2017FT PT Total
2018FT PT Total
2019FT PT Total
GrandTotal
Female
Male
Grand Total 890
398
492
19
2
17
871
396
475
922
414
508
20
2
18
902
412
490
945
421
524
21
4
17
924
417
507
943
427
516
28
7
21
915
420
495
946
412
534
26
6
20
920
406
514
4,646
2,072
2,574
Staff Head Counts by GenderFT Full-Time, PT Part-Time
2015
FT PT Total
2016
FT PT Total
2017
FT PT Total
2018
FT PT Total
2019
FT PT TotalGrandTotal
American Indian or Alaska NativeAsian
Black or African American
Hispanic or Latino
Multiple RacesNon-Resident Alien
Two or More Races
UnknownWhite
Grand Total 8908169
581027123
1915
112
8718019
57925123
92284411
2101425133
2019
1
90282511
2101425123
94585124
2111925112
2119
11
92483224
2111924102
94382642
3112128102
28242
11
91580240
3112027102
9468542183
2127111
2625
1
9208292183
2126111
4,6464,19110781540851325711
Staff Head Counts by Race/Ethnicity
2015FT PT Total
2016FT PT Total
2017FT PT Total
2018FT PT Total
2019FT PT Total
GrandTotal
Exempt
Non-exempt
Grand Total 890
407
483
19
15
4
871
392
479
922
428
494
20
16
4
902
412
490
945
431
514
21
15
6
924
416
508
943
430
513
28
22
6
915
408
507
946
422
524
26
21
5
920
401
519
4,646
2,118
2,528
Staff Head Counts by Position Type
2015FT PT Total
2016FT PT Total
2017FT PT Total
2018FT PT Total
2019FT PT Total
GrandTotal
Female American Indian or Alaska Native ExemptAsian Exempt
Non-exemptBlack or African American Exempt
Non-exemptHispanic or Latino Exempt
Non-exemptMultiple Races Exempt
Non-exemptNon-Resident Alien ExemptTwo or More Races Exempt
Non-exemptUnknown Exempt
Non-exemptWhite Exempt
Non-exemptMale American Indian or Alaska Native Exempt
Asian ExemptBlack or African American Exempt
Non-exemptHispanic or Latino Exempt
Non-exemptMultiple Races Exempt
Non-exemptNon-Resident Alien ExemptTwo or More Races Non-exemptUnknown Exempt
Non-exemptWhite Exempt
Non-exemptGrand Total
11 11 11 11 11 5
26
26
271
26
251
24
23
23
24
24
1025
291
28
28
28
29
29
111
111
113
113
850
321
31
34
34
39
39
3101
39
48
48
1633
42
132
62
62
43
43
44
44
1811
33 22 22 22 33 12
33
33
33
22
22
34
34
59
59
813
2613
48
48
2236
227227
122
215225
232232
152
217230
238232
133
225229
231223
153
216220
234246
164
218242
1,1621,160
22 22 11 11 644 44 44 55 55 22
115
115
114
114
1131
112
1151
114
1121
111
569
14
14
16
16
16
16
26
26
27
27
729
11
11
11
11
22
22
21
21
65
22 11 322 2
41
41
31
31
46
46
912
912
54
54
2524
160202
1159202
174206
11
173205
169212
21
167211
167205
51
162204
164210
5159210
8341,035
89019871 92220902 94521924 94328915 94626920 4,646
Staff Head Counts by Gender, Race/Ethnicity, and Position Type
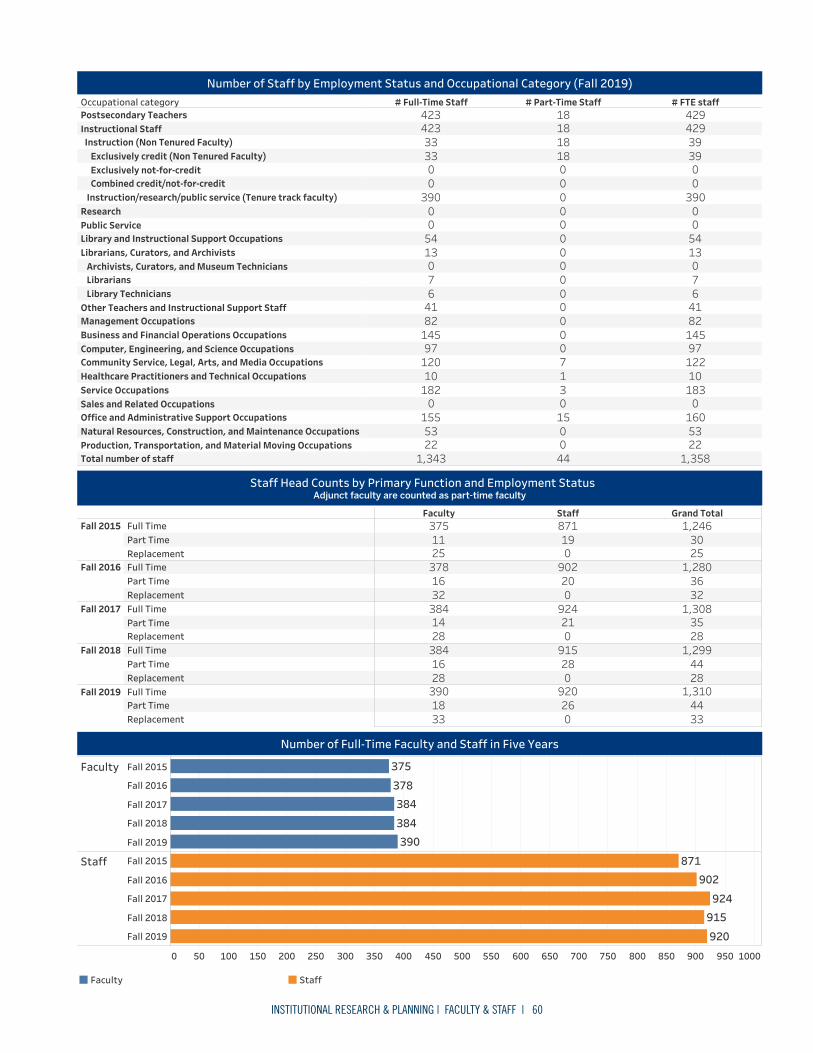
INSTITUTIONAL RESEARCH & PLANNING | FACULTY & STAFF | 60
Occupational category # Full-Time Staff # Part-Time Staff # FTE staffPostsecondary TeachersInstructional Staff Instruction (Non Tenured Faculty) Exclusively credit (Non Tenured Faculty) Exclusively not-for-credit Combined credit/not-for-credit Instruction/research/public service (Tenure track faculty)ResearchPublic ServiceLibrary and Instructional Support OccupationsLibrarians, Curators, and Archivists Archivists, Curators, and Museum Technicians Librarians Library TechniciansOther Teachers and Instructional Support StaffManagement OccupationsBusiness and Financial Operations OccupationsComputer, Engineering, and Science OccupationsCommunity Service, Legal, Arts, and Media OccupationsHealthcare Practitioners and Technical OccupationsService OccupationsSales and Related OccupationsOffice and Administrative Support OccupationsNatural Resources, Construction, and Maintenance OccupationsProduction, Transportation, and Material Moving OccupationsTotal number of staff 1,358
22531600
18310122971458241670135400
390003939429429
44001503170000000000000018181818
1,34322531550
18210120971458241670135400
390003333423423
Number of Staff by Employment Status and Occupational Category (Fall 2019)
Faculty Staff Grand TotalFall 2015 Full Time
Part TimeReplacement
Fall 2016 Full TimePart TimeReplacement
Fall 2017 Full TimePart TimeReplacement
Fall 2018 Full TimePart TimeReplacement
Fall 2019 Full TimePart TimeReplacement
2530
1,246
019871
2511375
3236
1,280
020902
3216378
2835
1,308
021924
2814384
2844
1,299
028915
2816384
3344
1,310
026920
3318390
Staff Head Counts by Primary Function and Employment StatusAdjunct faculty are counted as part-time faculty
0 50 100 150 200 250 300 350 400 450 500 550 600 650 700 750 800 850 900 950 1000
Faculty Fall 2015
Fall 2016
Fall 2017
Fall 2018
Fall 2019
Staff Fall 2015
Fall 2016
Fall 2017
Fall 2018
Fall 2019
375
378384
384390
871902
924915
920
Number of Full-Time Faculty and Staff in Five Years
Faculty Staff

FACT BOOK BUCKNELL UNIVERSITY
FINANCE
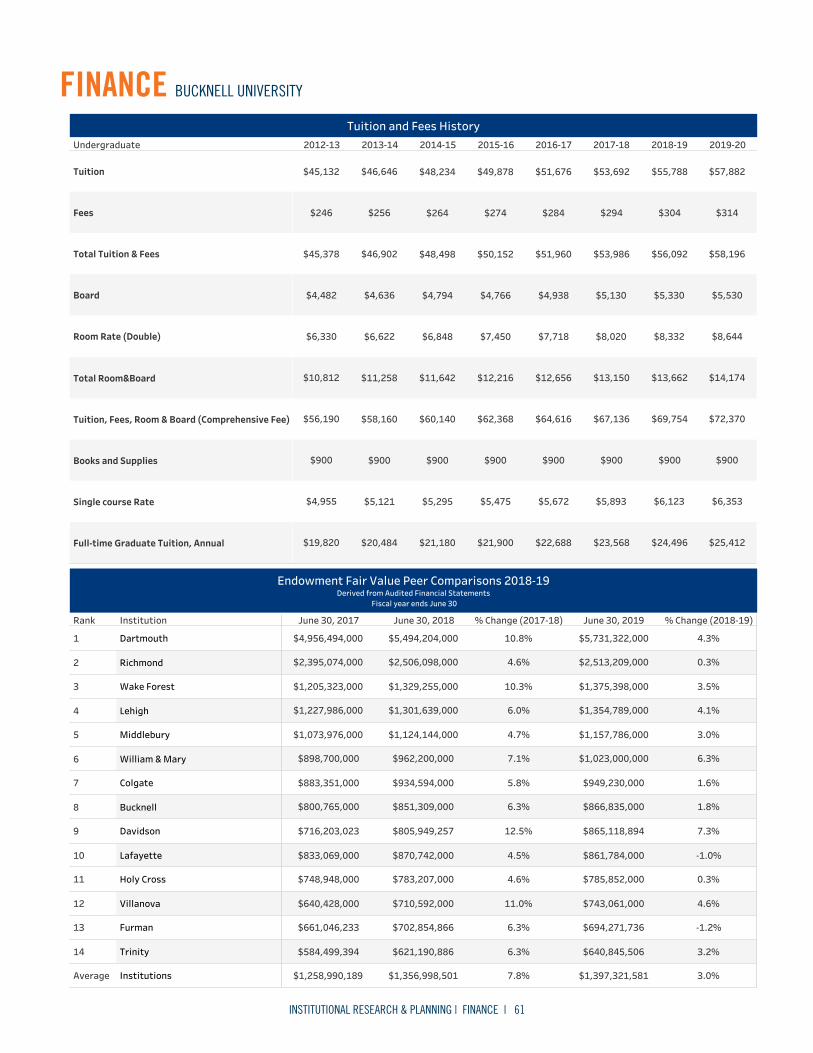
INSTITUTIONAL RESEARCH & PLANNING | FINANCE | 61
FINANCE BUCKNELL UNIVERSITYFinance Bucknell University
Undergraduate 2012-13 2013-14 2014-15 2015-16 2016-17 2017-18 2018-19 2019-20
Tuition
Fees
Total Tuition & Fees
Board
Room Rate (Double)
Total Room&Board
Tuition, Fees, Room & Board (Comprehensive Fee)
Books and Supplies
Single course Rate
Full-time Graduate Tuition, Annual $25,412
$6,353
$900
$72,370
$14,174
$8,644
$5,530
$58,196
$314
$57,882
$24,496
$6,123
$900
$69,754
$13,662
$8,332
$5,330
$56,092
$304
$55,788
$23,568
$5,893
$900
$67,136
$13,150
$8,020
$5,130
$53,986
$294
$53,692
$22,688
$5,672
$900
$64,616
$12,656
$7,718
$4,938
$51,960
$284
$51,676
$21,900
$5,475
$900
$62,368
$12,216
$7,450
$4,766
$50,152
$274
$49,878
$21,180
$5,295
$900
$60,140
$11,642
$6,848
$4,794
$48,498
$264
$48,234
$20,484
$5,121
$900
$58,160
$11,258
$6,622
$4,636
$46,902
$256
$46,646
$19,820
$4,955
$900
$56,190
$10,812
$6,330
$4,482
$45,378
$246
$45,132
Tuition and Fees History
Rank Institution June 30, 2017 June 30, 2018 % Change (2017-18) June 30, 2019 % Change (2018-19)
1 Dartmouth
2 Richmond
3 Wake Forest
4 Lehigh
5 Middlebury
6 William & Mary
7 Colgate
8 Bucknell
9 Davidson
10 Lafayette
11 Holy Cross
12 Villanova
13 Furman
14 Trinity
Average Institutions
4.3%$5,731,322,00010.8%$5,494,204,000$4,956,494,000
0.3%$2,513,209,0004.6%$2,506,098,000$2,395,074,000
3.5%$1,375,398,00010.3%$1,329,255,000$1,205,323,000
4.1%$1,354,789,0006.0%$1,301,639,000$1,227,986,000
3.0%$1,157,786,0004.7%$1,124,144,000$1,073,976,000
6.3%$1,023,000,0007.1%$962,200,000$898,700,000
1.6%$949,230,0005.8%$934,594,000$883,351,000
1.8%$866,835,0006.3%$851,309,000$800,765,000
7.3%$865,118,89412.5%$805,949,257$716,203,023
-1.0%$861,784,0004.5%$870,742,000$833,069,000
0.3%$785,852,0004.6%$783,207,000$748,948,000
4.6%$743,061,00011.0%$710,592,000$640,428,000
-1.2%$694,271,7366.3%$702,854,866$661,046,233
3.2%$640,845,5066.3%$621,190,886$584,499,394
3.0%$1,397,321,5817.8%$1,356,998,501$1,258,990,189
Endowment Fair Value Peer Comparisons 2018-19Derived from Audited Financial Statements
Fiscal year ends June 30
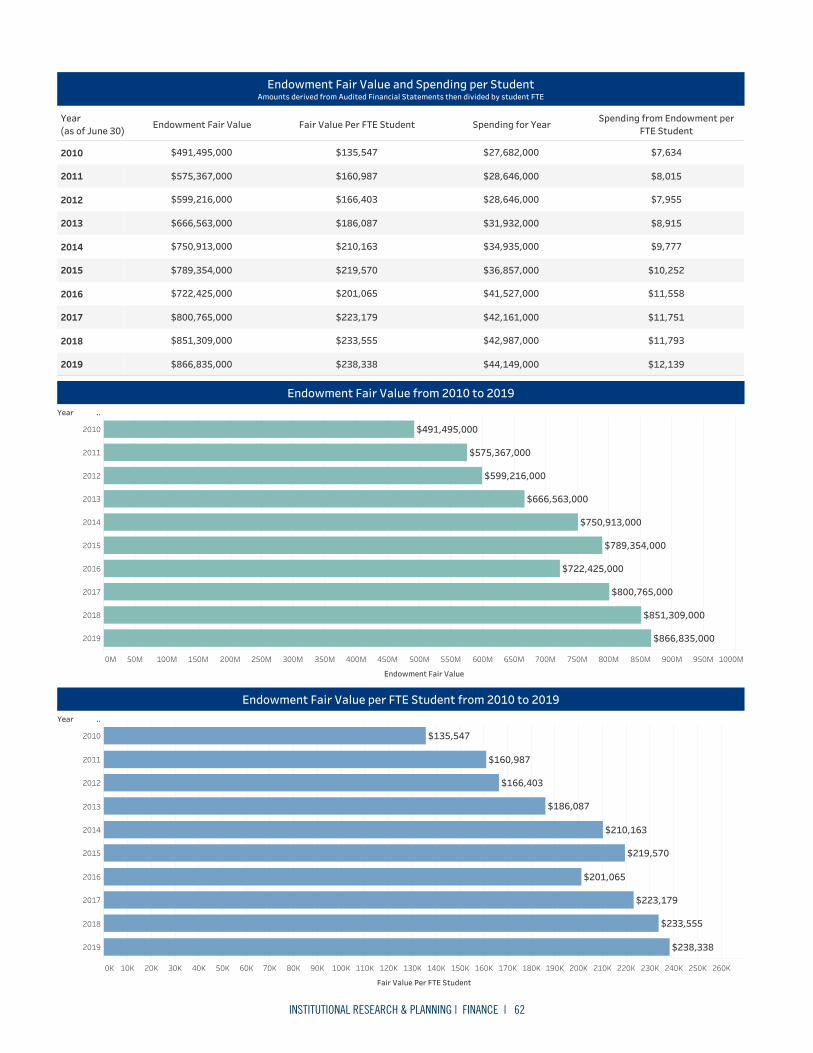
INSTITUTIONAL RESEARCH & PLANNING | FINANCE | 62
Year(as of June 30)
Endowment Fair Value Fair Value Per FTE Student Spending for YearSpending from Endowment per
FTE Student
2010
2011
2012
2013
2014
2015
2016
2017
2018
2019 $12,139
$11,793
$11,751
$11,558
$10,252
$9,777
$8,915
$7,955
$8,015
$7,634
$44,149,000
$42,987,000
$42,161,000
$41,527,000
$36,857,000
$34,935,000
$31,932,000
$28,646,000
$28,646,000
$27,682,000
$238,338
$233,555
$223,179
$201,065
$219,570
$210,163
$186,087
$166,403
$160,987
$135,547
$866,835,000
$851,309,000
$800,765,000
$722,425,000
$789,354,000
$750,913,000
$666,563,000
$599,216,000
$575,367,000
$491,495,000
Endowment Fair Value and Spending per StudentAmounts derived from Audited Financial Statements then divided by student FTE
Year ..
0M 50M 100M 150M 200M 250M 300M 350M 400M 450M 500M 550M 600M 650M 700M 750M 800M 850M 900M 950M 1000M
Endowment Fair Value
2010
2011
2012
2013
2014
2015
2016
2017
2018
2019
$491,495,000
$575,367,000
$599,216,000
$666,563,000
$750,913,000
$789,354,000
$722,425,000
$800,765,000
$851,309,000
$866,835,000
Endowment Fair Value from 2010 to 2019
Year ..
0K 10K 20K 30K 40K 50K 60K 70K 80K 90K 100K 110K 120K 130K 140K 150K 160K 170K 180K 190K 200K 210K 220K 230K 240K 250K 260K
Fair Value Per FTE Student
2010
2011
2012
2013
2014
2015
2016
2017
2018
2019
$135,547
$160,987
$166,403
$186,087
$210,163
$219,570
$201,065
$223,179
$233,555
$238,338
Endowment Fair Value per FTE Student from 2010 to 2019
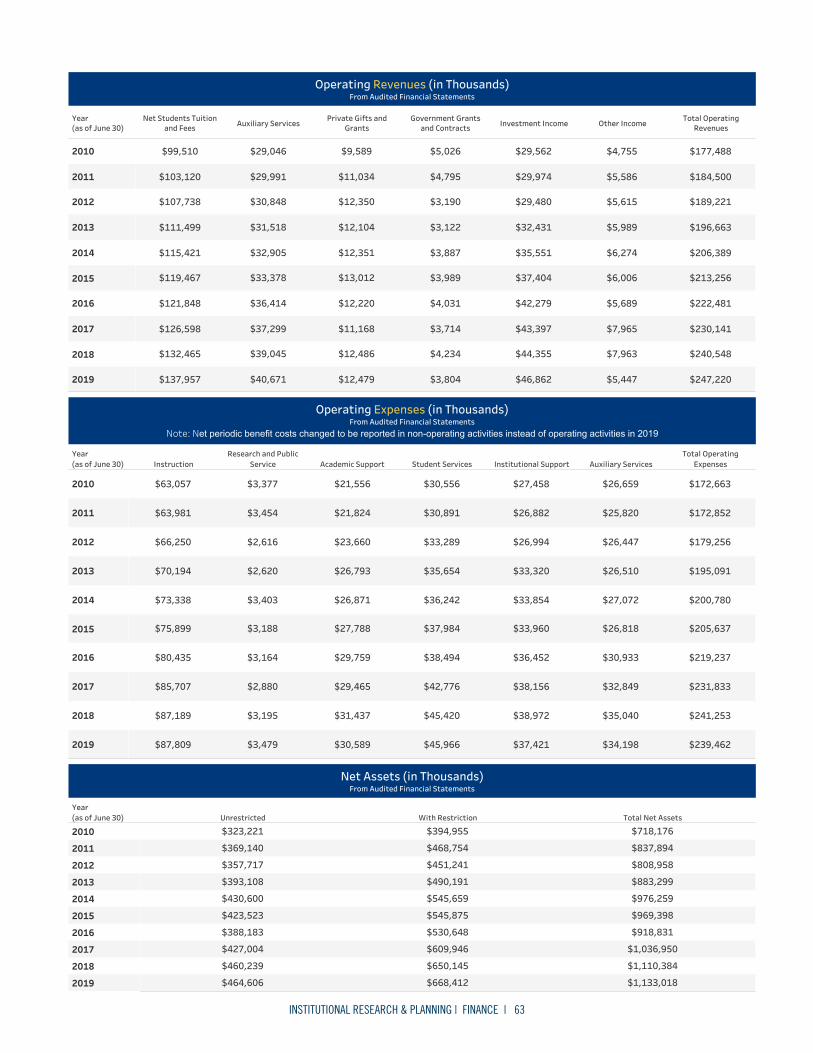
INSTITUTIONAL RESEARCH & PLANNING | FINANCE | 63
Year(as of June 30)
Net Students Tuitionand Fees Auxiliary Services
Private Gifts andGrants
Government Grantsand Contracts Investment Income Other Income
Total OperatingRevenues
2010
2011
2012
2013
2014
2015
2016
2017
2018
2019 $247,220
$240,548
$230,141
$222,481
$213,256
$206,389
$196,663
$189,221
$184,500
$177,488
$5,447
$7,963
$7,965
$5,689
$6,006
$6,274
$5,989
$5,615
$5,586
$4,755
$46,862
$44,355
$43,397
$42,279
$37,404
$35,551
$32,431
$29,480
$29,974
$29,562
$3,804
$4,234
$3,714
$4,031
$3,989
$3,887
$3,122
$3,190
$4,795
$5,026
$12,479
$12,486
$11,168
$12,220
$13,012
$12,351
$12,104
$12,350
$11,034
$9,589
$40,671
$39,045
$37,299
$36,414
$33,378
$32,905
$31,518
$30,848
$29,991
$29,046
$137,957
$132,465
$126,598
$121,848
$119,467
$115,421
$111,499
$107,738
$103,120
$99,510
Operating Revenues (in Thousands)From Audited Financial Statements
Year(as of June 30) Instruction
Research and PublicService Academic Support Student Services Institutional Support Auxiliary Services
Total OperatingExpenses
2010
2011
2012
2013
2014
2015
2016
2017
2018
2019 $239,462
$241,253
$231,833
$219,237
$205,637
$200,780
$195,091
$179,256
$172,852
$172,663
$34,198
$35,040
$32,849
$30,933
$26,818
$27,072
$26,510
$26,447
$25,820
$26,659
$37,421
$38,972
$38,156
$36,452
$33,960
$33,854
$33,320
$26,994
$26,882
$27,458
$45,966
$45,420
$42,776
$38,494
$37,984
$36,242
$35,654
$33,289
$30,891
$30,556
$30,589
$31,437
$29,465
$29,759
$27,788
$26,871
$26,793
$23,660
$21,824
$21,556
$3,479
$3,195
$2,880
$3,164
$3,188
$3,403
$2,620
$2,616
$3,454
$3,377
$87,809
$87,189
$85,707
$80,435
$75,899
$73,338
$70,194
$66,250
$63,981
$63,057
Operating Expenses (in Thousands)From Audited Financial Statements
Note: Net periodic benefit costs changed to be reported in non-operating activities instead of operating activities in 2019
Year(as of June 30) Unrestricted With Restriction Total Net Assets
2010
2011
2012
2013
2014
2015
2016
2017
2018
2019 $1,133,018
$1,110,384
$1,036,950
$918,831
$969,398
$976,259
$883,299
$808,958
$837,894
$718,176
$668,412
$650,145
$609,946
$530,648
$545,875
$545,659
$490,191
$451,241
$468,754
$394,955
$464,606
$460,239
$427,004
$388,183
$423,523
$430,600
$393,108
$357,717
$369,140
$323,221
Net Assets (in Thousands)From Audited Financial Statements
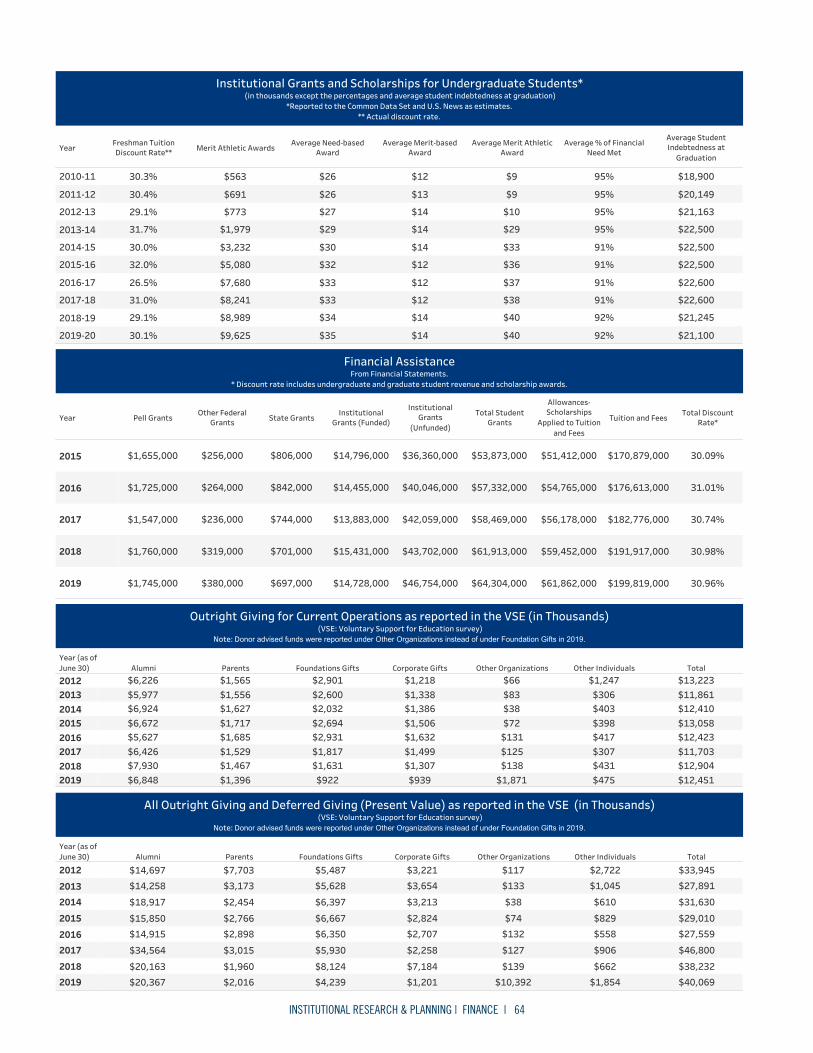
INSTITUTIONAL RESEARCH & PLANNING | FINANCE | 64
YearFreshman TuitionDiscount Rate** Merit Athletic Awards
Average Need-basedAward
Average Merit-basedAward
Average Merit AthleticAward
Average % of FinancialNeed Met
Average StudentIndebtedness at
Graduation
2010-11
2011-12
2012-13
2013-14
2014-15
2015-16
2016-17
2017-18
2018-19
2019-20 $21,100
$21,245
$22,600
$22,600
$22,500
$22,500
$22,500
$21,163
$20,149
$18,900
92%
92%
91%
91%
91%
91%
95%
95%
95%
95%
$40
$40
$38
$37
$36
$33
$29
$10
$9
$9
$14
$14
$12
$12
$12
$14
$14
$14
$13
$12
$35
$34
$33
$33
$32
$30
$29
$27
$26
$26
$9,625
$8,989
$8,241
$7,680
$5,080
$3,232
$1,979
$773
$691
$563
30.1%
29.1%
31.0%
26.5%
32.0%
30.0%
31.7%
29.1%
30.4%
30.3%
Institutional Grants and Scholarships for Undergraduate Students* (in thousands except the percentages and average student indebtedness at graduation)
*Reported to the Common Data Set and U.S. News as estimates.** Actual discount rate.
Year Pell GrantsOther Federal
Grants State GrantsInstitutional
Grants (Funded)
InstitutionalGrants
(Unfunded)
Total StudentGrants
Allowances-Scholarships
Applied to Tuitionand Fees
Tuition and FeesTotal Discount
Rate*
2015
2016
2017
2018
2019 30.96%
30.98%
30.74%
31.01%
30.09%
$199,819,000
$191,917,000
$182,776,000
$176,613,000
$170,879,000
$61,862,000
$59,452,000
$56,178,000
$54,765,000
$51,412,000
$64,304,000
$61,913,000
$58,469,000
$57,332,000
$53,873,000
$46,754,000
$43,702,000
$42,059,000
$40,046,000
$36,360,000
$14,728,000
$15,431,000
$13,883,000
$14,455,000
$14,796,000
$697,000
$701,000
$744,000
$842,000
$806,000
$380,000
$319,000
$236,000
$264,000
$256,000
$1,745,000
$1,760,000
$1,547,000
$1,725,000
$1,655,000
Financial AssistanceFrom Financial Statements.
* Discount rate includes undergraduate and graduate student revenue and scholarship awards.
Year (as ofJune 30) Alumni Parents Foundations Gifts Corporate Gifts Other Organizations Other Individuals Total
20122013201420152016201720182019 $12,451
$12,904$11,703$12,423$13,058$12,410$11,861$13,223
$475$431$307$417$398$403$306
$1,247
$1,871$138$125$131$72$38$83$66
$939$1,307$1,499$1,632$1,506$1,386$1,338$1,218
$922$1,631$1,817$2,931$2,694$2,032$2,600$2,901
$1,396$1,467$1,529$1,685$1,717$1,627$1,556$1,565
$6,848$7,930$6,426$5,627$6,672$6,924$5,977$6,226
Outright Giving for Current Operations as reported in the VSE (in Thousands) (VSE: Voluntary Support for Education survey)
Note: Donor advised funds were reported under Other Organizations instead of under Foundation Gifts in 2019.
Year (as ofJune 30) Alumni Parents Foundations Gifts Corporate Gifts Other Organizations Other Individuals Total
2012
2013
2014
2015
2016
2017
2018
2019 $40,069$38,232
$46,800
$27,559$29,010
$31,630
$27,891$33,945
$1,854$662
$906
$558$829
$610
$1,045$2,722
$10,392$139
$127
$132$74
$38
$133$117
$1,201$7,184
$2,258
$2,707$2,824
$3,213
$3,654$3,221
$4,239$8,124
$5,930
$6,350$6,667
$6,397
$5,628$5,487
$2,016$1,960
$3,015
$2,898$2,766
$2,454
$3,173$7,703
$20,367$20,163
$34,564
$14,915$15,850
$18,917
$14,258$14,697
All Outright Giving and Deferred Giving (Present Value) as reported in the VSE (in Thousands) (VSE: Voluntary Support for Education survey)
Note: Donor advised funds were reported under Other Organizations instead of under Foundation Gifts in 2019.

FACT BOOK BUCKNELL UNIVERSITY
DEFINITIONS
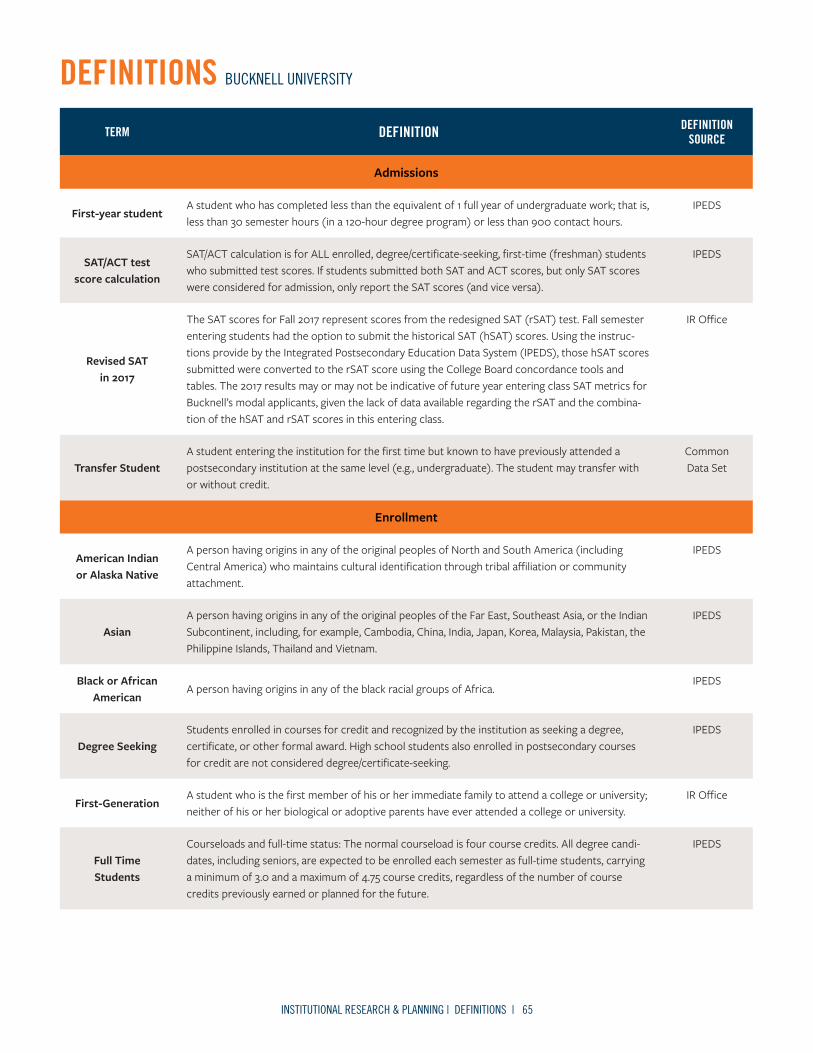
INSTITUTIONAL RESEARCH & PLANNING | DEFINITIONS | 65
DEFINITIONS BUCKNELL UNIVERSITY
TERM DEFINITION DEFINITION SOURCE
Admissions
First-year studentA student who has completed less than the equivalent of 1 full year of undergraduate work; that is, less than 30 semester hours (in a 120-hour degree program) or less than 900 contact hours.
IPEDS
SAT/ACT test score calculation
SAT/ACT calculation is for ALL enrolled, degree/certificate-seeking, first-time (freshman) students who submitted test scores. If students submitted both SAT and ACT scores, but only SAT scores were considered for admission, only report the SAT scores (and vice versa).
IPEDS
Revised SAT in 2017
The SAT scores for Fall 2017 represent scores from the redesigned SAT (rSAT) test. Fall semester entering students had the option to submit the historical SAT (hSAT) scores. Using the instruc-tions provide by the Integrated Postsecondary Education Data System (IPEDS), those hSAT scores submitted were converted to the rSAT score using the College Board concordance tools and tables. The 2017 results may or may not be indicative of future year entering class SAT metrics for Bucknell’s modal applicants, given the lack of data available regarding the rSAT and the combina-tion of the hSAT and rSAT scores in this entering class.
IR Office
Transfer StudentA student entering the institution for the first time but known to have previously attended a postsecondary institution at the same level (e.g., undergraduate). The student may transfer with or without credit.
Common Data Set
Enrollment
American Indianor Alaska Native
A person having origins in any of the original peoples of North and South America (including Central America) who maintains cultural identification through tribal affiliation or community attachment.
IPEDS
AsianA person having origins in any of the original peoples of the Far East, Southeast Asia, or the Indian Subcontinent, including, for example, Cambodia, China, India, Japan, Korea, Malaysia, Pakistan, the Philippine Islands, Thailand and Vietnam.
IPEDS
Black or African American
A person having origins in any of the black racial groups of Africa.IPEDS
Degree Seeking Students enrolled in courses for credit and recognized by the institution as seeking a degree, certificate, or other formal award. High school students also enrolled in postsecondary courses for credit are not considered degree/certificate-seeking.
IPEDS
First-GenerationA student who is the first member of his or her immediate family to attend a college or university; neither of his or her biological or adoptive parents have ever attended a college or university.
IR Office
Full Time Students
Courseloads and full-time status: The normal courseload is four course credits. All degree candi-dates, including seniors, are expected to be enrolled each semester as full-time students, carrying a minimum of 3.0 and a maximum of 4.75 course credits, regardless of the number of course credits previously earned or planned for the future.
IPEDS
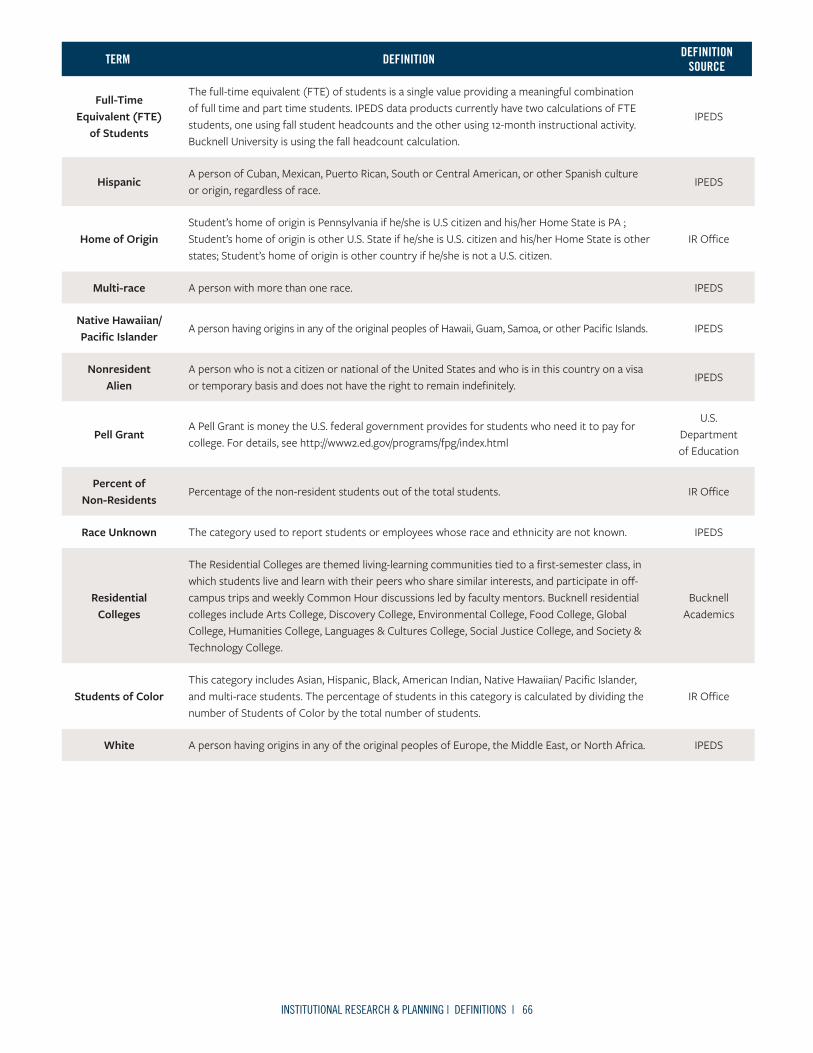
INSTITUTIONAL RESEARCH & PLANNING | DEFINITIONS | 66
TERM DEFINITION DEFINITION SOURCE
Full-Time Equivalent (FTE)
of Students
The full-time equivalent (FTE) of students is a single value providing a meaningful combination of full time and part time students. IPEDS data products currently have two calculations of FTE students, one using fall student headcounts and the other using 12-month instructional activity. Bucknell University is using the fall headcount calculation.
IPEDS
HispanicA person of Cuban, Mexican, Puerto Rican, South or Central American, or other Spanish culture or origin, regardless of race.
IPEDS
Home of OriginStudent’s home of origin is Pennsylvania if he/she is U.S citizen and his/her Home State is PA ; Student’s home of origin is other U.S. State if he/she is U.S. citizen and his/her Home State is other states; Student’s home of origin is other country if he/she is not a U.S. citizen.
IR Office
Multi-race A person with more than one race. IPEDS
Native Hawaiian/ Pacific Islander
A person having origins in any of the original peoples of Hawaii, Guam, Samoa, or other Pacific Islands. IPEDS
Nonresident Alien
A person who is not a citizen or national of the United States and who is in this country on a visa or temporary basis and does not have the right to remain indefinitely.
IPEDS
Pell GrantA Pell Grant is money the U.S. federal government provides for students who need it to pay for college. For details, see http://www2.ed.gov/programs/fpg/index.html
U.S. Department of Education
Percent of Non-Residents
Percentage of the non-resident students out of the total students. IR Office
Race Unknown The category used to report students or employees whose race and ethnicity are not known. IPEDS
Residential Colleges
The Residential Colleges are themed living-learning communities tied to a first-semester class, in which students live and learn with their peers who share similar interests, and participate in off-campus trips and weekly Common Hour discussions led by faculty mentors. Bucknell residential colleges include Arts College, Discovery College, Environmental College, Food College, Global College, Humanities College, Languages & Cultures College, Social Justice College, and Society & Technology College.
Bucknell Academics
Students of ColorThis category includes Asian, Hispanic, Black, American Indian, Native Hawaiian/ Pacific Islander, and multi-race students. The percentage of students in this category is calculated by dividing the number of Students of Color by the total number of students.
IR Office
White A person having origins in any of the original peoples of Europe, the Middle East, or North Africa. IPEDS
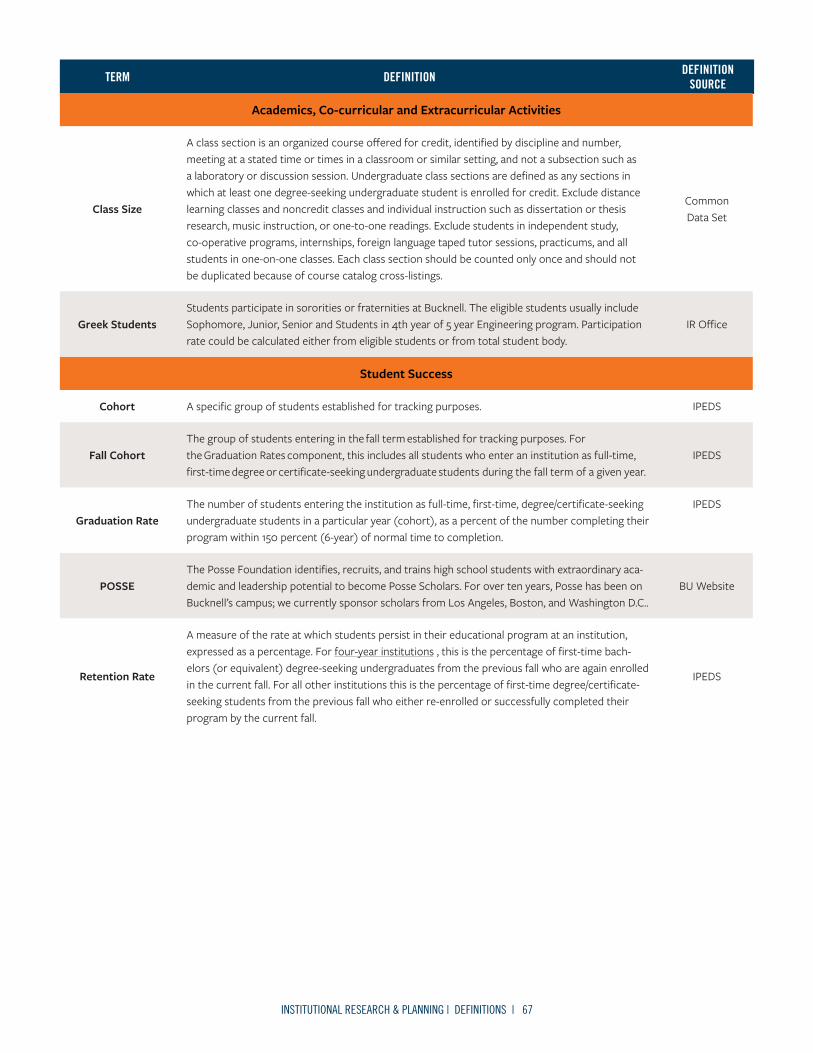
INSTITUTIONAL RESEARCH & PLANNING | DEFINITIONS | 67
TERM DEFINITION DEFINITION SOURCE
Academics, Co-curricular and Extracurricular Activities
Class Size
A class section is an organized course offered for credit, identified by discipline and number, meeting at a stated time or times in a classroom or similar setting, and not a subsection such as a laboratory or discussion session. Undergraduate class sections are defined as any sections in which at least one degree-seeking undergraduate student is enrolled for credit. Exclude distance learning classes and noncredit classes and individual instruction such as dissertation or thesis research, music instruction, or one-to-one readings. Exclude students in independent study, co-operative programs, internships, foreign language taped tutor sessions, practicums, and all students in one-on-one classes. Each class section should be counted only once and should not be duplicated because of course catalog cross-listings.
Common Data Set
Greek StudentsStudents participate in sororities or fraternities at Bucknell. The eligible students usually include Sophomore, Junior, Senior and Students in 4th year of 5 year Engineering program. Participation rate could be calculated either from eligible students or from total student body.
IR Office
Student Success
Cohort A specific group of students established for tracking purposes. IPEDS
Fall CohortThe group of students entering in the fall term established for tracking purposes. For the Graduation Rates component, this includes all students who enter an institution as full-time, first-time degree or certificate-seeking undergraduate students during the fall term of a given year.
IPEDS
Graduation RateThe number of students entering the institution as full-time, first-time, degree/certificate-seeking undergraduate students in a particular year (cohort), as a percent of the number completing their program within 150 percent (6-year) of normal time to completion.
IPEDS
POSSEThe Posse Foundation identifies, recruits, and trains high school students with extraordinary aca-demic and leadership potential to become Posse Scholars. For over ten years, Posse has been on Bucknell’s campus; we currently sponsor scholars from Los Angeles, Boston, and Washington D.C..
BU Website
Retention Rate
A measure of the rate at which students persist in their educational program at an institution, expressed as a percentage. For four-year institutions , this is the percentage of first-time bach-elors (or equivalent) degree-seeking undergraduates from the previous fall who are again enrolled in the current fall. For all other institutions this is the percentage of first-time degree/certificate-seeking students from the previous fall who either re-enrolled or successfully completed their program by the current fall.
IPEDS
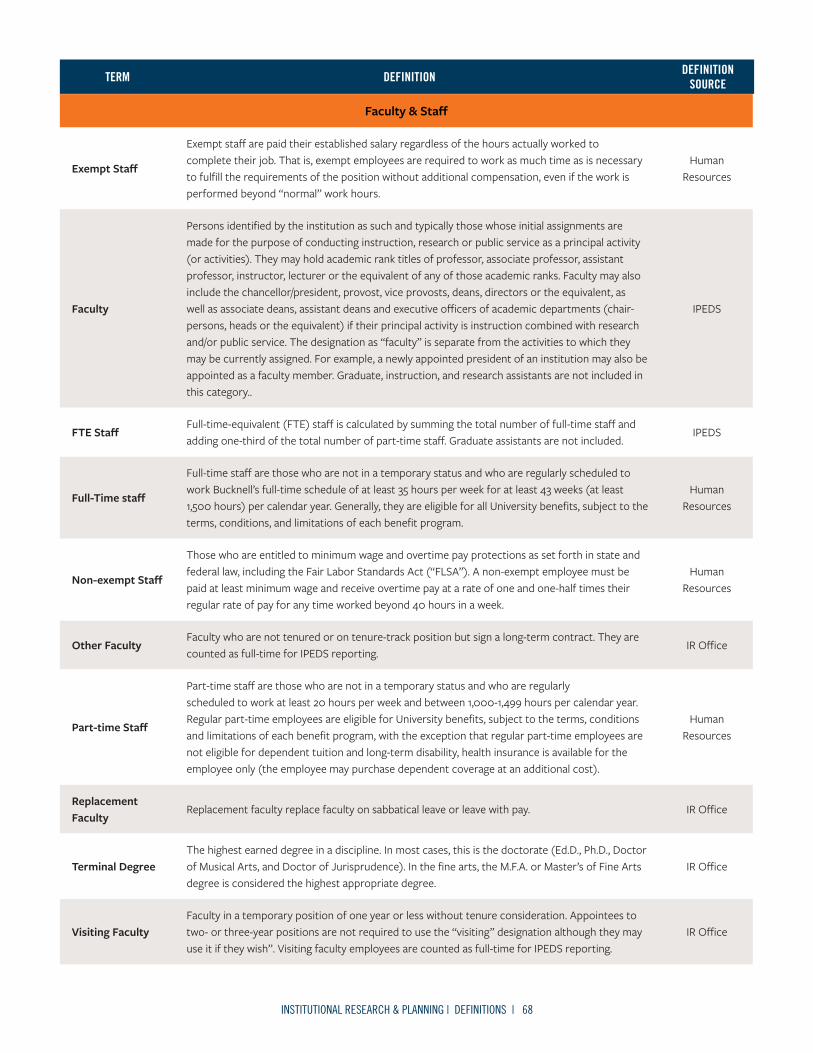
INSTITUTIONAL RESEARCH & PLANNING | DEFINITIONS | 68
Faculty & Staff
Exempt Staff
Exempt staff are paid their established salary regardless of the hours actually worked tocomplete their job. That is, exempt employees are required to work as much time as is necessary to fulfill the requirements of the position without additional compensation, even if the work is performed beyond “normal” work hours.
Human Resources
Faculty
Persons identified by the institution as such and typically those whose initial assignments are made for the purpose of conducting instruction, research or public service as a principal activity (or activities). They may hold academic rank titles of professor, associate professor, assistant professor, instructor, lecturer or the equivalent of any of those academic ranks. Faculty may also include the chancellor/president, provost, vice provosts, deans, directors or the equivalent, as well as associate deans, assistant deans and executive officers of academic departments (chair-persons, heads or the equivalent) if their principal activity is instruction combined with research and/or public service. The designation as “faculty” is separate from the activities to which they may be currently assigned. For example, a newly appointed president of an institution may also be appointed as a faculty member. Graduate, instruction, and research assistants are not included in this category..
IPEDS
FTE StaffFull-time-equivalent (FTE) staff is calculated by summing the total number of full-time staff and adding one-third of the total number of part-time staff. Graduate assistants are not included.
IPEDS
Full-Time staff
Full-time staff are those who are not in a temporary status and who are regularly scheduled to work Bucknell’s full-time schedule of at least 35 hours per week for at least 43 weeks (at least 1,500 hours) per calendar year. Generally, they are eligible for all University benefits, subject to the terms, conditions, and limitations of each benefit program.
Human Resources
Non-exempt Staff
Those who are entitled to minimum wage and overtime pay protections as set forth in state and federal law, including the Fair Labor Standards Act (“FLSA”). A non-exempt employee must be paid at least minimum wage and receive overtime pay at a rate of one and one-half times their regular rate of pay for any time worked beyond 40 hours in a week.
Human Resources
Other FacultyFaculty who are not tenured or on tenure-track position but sign a long-term contract. They are counted as full-time for IPEDS reporting.
IR Office
Part-time Staff
Part-time staff are those who are not in a temporary status and who are regularlyscheduled to work at least 20 hours per week and between 1,000-1,499 hours per calendar year.Regular part-time employees are eligible for University benefits, subject to the terms, conditions and limitations of each benefit program, with the exception that regular part-time employees are not eligible for dependent tuition and long-term disability, health insurance is available for the employee only (the employee may purchase dependent coverage at an additional cost).
HumanResources
Replacement Faculty
Replacement faculty replace faculty on sabbatical leave or leave with pay. IR Office
Terminal DegreeThe highest earned degree in a discipline. In most cases, this is the doctorate (Ed.D., Ph.D., Doctor of Musical Arts, and Doctor of Jurisprudence). In the fine arts, the M.F.A. or Master’s of Fine Arts degree is considered the highest appropriate degree.
IR Office
Visiting FacultyFaculty in a temporary position of one year or less without tenure consideration. Appointees to two- or three-year positions are not required to use the “visiting” designation although they may use it if they wish”. Visiting faculty employees are counted as full-time for IPEDS reporting.
IR Office
TERM DEFINITION DEFINITION SOURCE
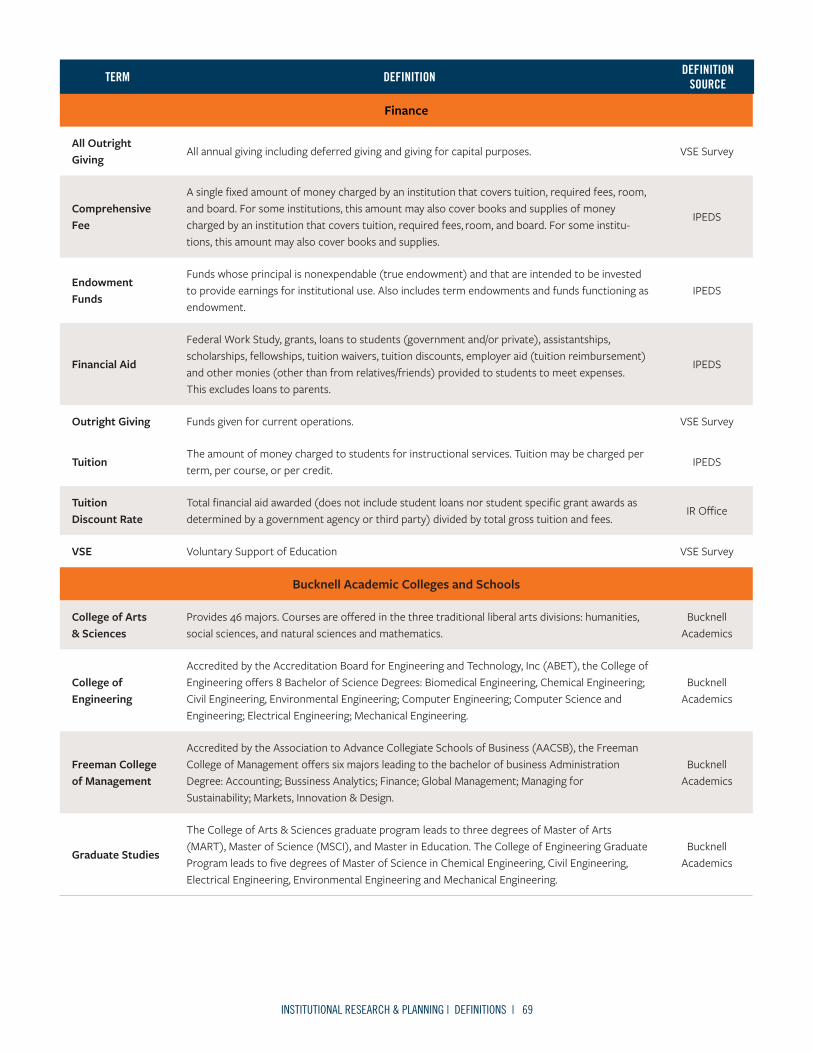
INSTITUTIONAL RESEARCH & PLANNING | DEFINITIONS | 69
Finance
All Outright Giving
All annual giving including deferred giving and giving for capital purposes. VSE Survey
Comprehensive Fee
A single fixed amount of money charged by an institution that covers tuition, required fees, room, and board. For some institutions, this amount may also cover books and supplies of money charged by an institution that covers tuition, required fees, room, and board. For some institu-tions, this amount may also cover books and supplies.
IPEDS
Endowment Funds
Funds whose principal is nonexpendable (true endowment) and that are intended to be invested to provide earnings for institutional use. Also includes term endowments and funds functioning as endowment.
IPEDS
Financial Aid
Federal Work Study, grants, loans to students (government and/or private), assistantships, scholarships, fellowships, tuition waivers, tuition discounts, employer aid (tuition reimbursement) and other monies (other than from relatives/friends) provided to students to meet expenses. This excludes loans to parents.
IPEDS
Outright Giving Funds given for current operations. VSE Survey
TuitionThe amount of money charged to students for instructional services. Tuition may be charged per term, per course, or per credit.
IPEDS
Tuition Discount Rate
Total financial aid awarded (does not include student loans nor student specific grant awards as determined by a government agency or third party) divided by total gross tuition and fees.
IR Office
VSE Voluntary Support of Education VSE Survey
Bucknell Academic Colleges and Schools
College of Arts & Sciences
Provides 46 majors. Courses are offered in the three traditional liberal arts divisions: humanities, social sciences, and natural sciences and mathematics.
Bucknell Academics
College of Engineering
Accredited by the Accreditation Board for Engineering and Technology, Inc (ABET), the College of Engineering offers 8 Bachelor of Science Degrees: Biomedical Engineering, Chemical Engineering; Civil Engineering, Environmental Engineering; Computer Engineering; Computer Science and Engineering; Electrical Engineering; Mechanical Engineering.
Bucknell Academics
Freeman College of Management
Accredited by the Association to Advance Collegiate Schools of Business (AACSB), the Freeman College of Management offers six majors leading to the bachelor of business Administration Degree: Accounting; Bussiness Analytics; Finance; Global Management; Managing for Sustainability; Markets, Innovation & Design.
Bucknell Academics
Graduate Studies
The College of Arts & Sciences graduate program leads to three degrees of Master of Arts (MART), Master of Science (MSCI), and Master in Education. The College of Engineering Graduate Program leads to five degrees of Master of Science in Chemical Engineering, Civil Engineering, Electrical Engineering, Environmental Engineering and Mechanical Engineering.
Bucknell Academics
TERM DEFINITION DEFINITION SOURCE

BUCKNELL UNIVERSITY FACT BOOK 2019-20
LEWISBURG, PA 17837
Institutional Research & Planning
bucknell.edu
2019-20 FACT BOOK