buckling mdes description
40
School of Civil Engineering Sydney NSW 2006 AUSTRALIA http://www.civil.usyd.edu.au/ Centre for Advanced Structural Engineering Interaction Buckling and Postbuckling in the Distortional Mode of Thin-Walled Sections Research Report No R870 Derrick C Y Yap BE Gregory J Hancock BSc BE PhD DEng April 2006 ISSN 1833-2781
-
Upload
pravin-awalkonde -
Category
Documents
-
view
221 -
download
0
Transcript of buckling mdes description

8/14/2019 buckling mdes description
http://slidepdf.com/reader/full/buckling-mdes-description 1/40
School of Civil EngineeringSydney NSW 2006AUSTRALIA
http://www.civil.usyd.edu.au/
Centre for Advanced Structural Engineering
Interaction Buckling and Postbuckling inthe Distortional Mode of Thin-Walled
Sections
Research Report No R870
Derrick C Y Yap BEGregory J Hancock BSc BE PhD DEng
April 2006
ISSN 1833-2781

8/14/2019 buckling mdes description
http://slidepdf.com/reader/full/buckling-mdes-description 2/40
School of Civil EngineeringCentre for Advanced Structural Engineering
http://www.civil.usyd.edu.au/
Interaction Buckling and Postbuckling in the Distortional
Mode of Thin-Walled Sections
Research Report No R870
Derrick C Y Yap, BEGregory J Hancock, BSc, BE, PhD, DEng
April 2006
Abstract:The buckling modes of cold-formed thin-walled sections with edge stiffeners are generally in theforms of the short half-wavelength local buckle, the intermediate half-wavelength distortional buckleand the long half-wavelength flexural/flexural-torsional buckle. These buckling modes usually occurat distinct lengths. However the possibility of the interaction of buckling modes may be present atcertain lengths. This may be due to the distortional mode interacting with the local buckling mode,
both of which may be in the post-buckling range.
Local buckling has been well researched and accounted for in design standards with an effectivewidth model developed by Von Karman et al (1932) to produce a simple model of the post-bucklingreserve strength. Distortional buckling research has made much headway in recent years at theUniversity of Sydney by Hancock (1985), Lau and Hancock (1990), Kwon and Hancock (1992) andYang and Hancock (2004), at Johns Hopkins University by Schafer (2002) and the TechnicalUniversity of Lisbon, Portugal by Silvestre and Camotim (2004). What has been known for sometime is that the distortional mode has a post-buckling reserve strength which is generally less than thatof local buckling. However, the nature of this post-buckling reserve is not clearly understood,
particularly what precipitates failure.
Some research has been done to understand the buckling mode interaction of local and distortional.This is usually carried out by analytically separating the combined modes into its composition ofindividual modes. Generalised Beam Theory (GBT) uses explicit analytical expressions to analysethe influence of local and distortional buckling modes. Another method currently being developed ismodal identification and decomposition, where a numerical method is employed to calculate thecritical loads for the pure buckling modes.
The paper discusses the analysis of post-buckling in the distortional mode of a thin-walled sectionwith edge stiffeners and the effect of interaction of buckling modes on failure loads. The analysis is
based on the longitudinal stress development and redistribution using the finite element packageABAQUS. This methodology whereby the longitudinal stress redistribution is studied is similar to thework of Von Karman et al, in predicting the post-local buckling behaviour.
Keywords:Stress distribution; local buckling; distortional buckling; interaction buckling; postbuckling
behaviour; finite element analysis

8/14/2019 buckling mdes description
http://slidepdf.com/reader/full/buckling-mdes-description 3/40
Interaction buckling and postbuckling in the distortional mode of thin-walled sections April 2006
School of Civil EngineeringResearch Report No R870
2
Copyright Notice
School of Civil Engineering, Research Report R870
Interaction Buckling and Postbuckling in the Distortional Mode of Thin-WalledSections© 2006 Derrick C. Y. Yap & Gregory J. HancockEmail: [email protected] [email protected] ISSN 1833-2781
This publication may be redistributed freely in its entirety and in its originalform without the consent of the copyright owner.
Use of material contained in this publication in any other published works must be appropriately referenced, and, if necessary, permission sought from theauthor.
Published by:
School of Civil EngineeringThe University of SydneySydney NSW 2006AUSTRALIA
April 2006
This report and other Research Reports published by The School of CivilEngineering are available on the Internet:
http://www.civil.usyd.edu.au

8/14/2019 buckling mdes description
http://slidepdf.com/reader/full/buckling-mdes-description 4/40
Interaction buckling and postbuckling in the distortional mode of thin-walled sections April 2006
School of Civil EngineeringResearch Report No R870
3
TABLE OF CONTENTS
TABLE OF CONTENTS ......................................................... ........................................................... ................. 3
1 INTRODUCTION........................................................................................ ............................................... 5 2 SECTIONS INVESTIGATED....................................... ........................................................... ................. 5
3 FINITE ELEMENT ANALYSIS............................................. ........................................................... ....... 6 3.1 GENERAL ......................................................................................................................................................6 3.2 TYPE OF ELEMENT AND FINITE ELEMENT MESH .............................................................................................7 3.3 BOUNDARY CONDITIONS AND METHOD OF LOADING .....................................................................................7 3.4 MATERIAL PROPERTIES AND MATERIAL ORIENTATION ..................................................................................7 3.5 GEOMETRIC IMPERFECTIONS .........................................................................................................................8 3.6 A NALYSES ....................................................................................................................................................8
3.6.1 Eigenvalue buckling analysis....................................................... ........................................................ 8
3.6.2 Postbuckling analysis........................... ........................................................... ..................................... 9 4 SENSITIVITY AND VALIDATION ANALYSES ....................................................... ........................... 9
5 POSTBUCKLING BEHAVIOUR....................... ........................................................... ......................... 11 5.1 LOAD DEFLECTION CURVES ........................................................................................................................12 5.2 LONGITUDINAL STRESS DISTRIBUTIONS ......................................................................................................12
5.2.1 Section with 6 mm thickness............................................................................ ................................... 12 5.2.2 Section with 3 mm thickness............................................................................ ................................... 13 5.2.3 Section with 1 mm thickness............................................................................ ................................... 14
6 TEST RESULTS IN RELATION TO STRENGTH DESIGN CURVES WITH 0.5 AND 0.6COEFFICIENTS.................................................. ........................................................... ................................... 16
7 CONCLUSION ..................................................... ........................................................... ......................... 16
ACKNOWLEDGEMENTS ..................................................... ........................................................... ............... 18
REFERENCES ..................................................... ........................................................... ................................... 19
NOTATIONS........................................................ ........................................................... ................................... 21
FIGURES .................................................... ........................................................... ............................................. 22
TABLES ...................................................... ........................................................... ............................................. 38

8/14/2019 buckling mdes description
http://slidepdf.com/reader/full/buckling-mdes-description 5/40
Interaction buckling and postbuckling in the distortional mode of thin-walled sections April 2006
School of Civil EngineeringResearch Report No R870
4

8/14/2019 buckling mdes description
http://slidepdf.com/reader/full/buckling-mdes-description 6/40
Interaction buckling and postbuckling in the distortional mode of thin-walled sections April 2006
School of Civil EngineeringResearch Report No R870
5
1 INTRODUCTION
Thin-walled sections such as lipped channels can buckle in three different modes being the
short half-wavelength local buckle, the intermediate half-wavelength distortional buckle andthe long half-wavelength flexural/flexural-torsional buckle (Hancock, Murray and Ellifritt(2001), Hancock (2003), Schafer (2002)). The short half-wavelength local buckling modehas been well researched and an effective width model developed by Von Karman et al(1932) to produce a simple model of the post-buckling reserve strength. The long half-wavelength flexural-torsional mode has been well researched by Timoshenko (1945), Vlasov(1961) and Trahair (1993) and was shown to have very little postbuckling reserve of strength.The intermediate half-wavelength distortional buckling mode has been researched at theUniversity of Sydney in recent years by Hancock (1985), Lau and Hancock (1990), Kwonand Hancock (1992) and Yang and Hancock (2004), at Johns Hopkins University by Schafer(2002) and the Technical University of Lisbon, Portugal by Camotim and Silvestre (2004).
What has been known for some time is that the distortional mode has a postbuckling strengthwhich is generally less than that of local buckling. However, the nature of this postbucklingreserve is not clearly understood, particularly what precipitates failure.
Several early papers recognized the mode now known as the distortional mode. Thomasson(1978) called it a torsional mode and tried to prevent it experimentally by placing strapsacross the flanges. Sridharan (1982) called it a local-torsional mode and analysed ittheoretically using a finite strip post-buckling analysis and perturbation theory. Sridharandemonstrated that soon after buckling in the distortional mode, yielding occurs in the lipeither at the tip or the flange junction depending on which way the flange and lip move(inward or outward respectively). He concluded that "one likely consequence of buckling of
an edge stiffener in its own plane would be the onset of plastic yielding; and the yielding of amember which has been the main source of stiffness cannot but hasten the collapse of thestructure". However, experimentation such as that of Yang and Hancock (2004) has shownexperimentally this not to be the case with substantial postbuckling reserve in line with theearly work of Kwon and Hancock (1992) even when the lip has yielded and developed local
plastic mechanisms. A further complication raised by Yang and Hancock was the difference between the strength when the lips moved inward generally with a lower strength than whenthey moved outward. This was confirmed theoretically more recently by the GeneralisedBeam Theory (GBT) models of Silvestre and Camotim (2004) for fixed ended sections.
The main purpose of this paper is to investigate postbuckling in the distortional mode usingthe finite element program ABAQUS. The distortional mode cannot be completely isolatedfrom the local mode and so the interaction of local and distortional buckling is considered inthe paper. The work of Von Karman et al. (1932) showed that the postbuckling behaviourcould be explained by looking at the longitudinal stress redistribution around the section inthe postbuckling range of behaviour. The same approach is used in this paper. In addition,strength design curves for distortional buckling of channels in compression are furthervalidated against the ABAQUS models.
2 SECTIONS INVESTIGATED
The experimental research of Lau and Hancock included simple lipped channels down to 1.67mm thickness and 450 MPa yield stress, the work of Kwon and Hancock included lipped

8/14/2019 buckling mdes description
http://slidepdf.com/reader/full/buckling-mdes-description 7/40
Interaction buckling and postbuckling in the distortional mode of thin-walled sections April 2006
School of Civil EngineeringResearch Report No R870
6
channels with intermediate stiffeners in the web down to 1.0 mm thickness and 500 MPayield, and that of Yang and Hancock included lipped channels down to 0.42 mm thicknessand 550 MPa yield stress. Intermediate stiffeners are used in the thinner material sections toraise the local buckling stress to be comparable with the distortional buckling stress for thethinner material. The problem with the intermediate stiffeners is that they make it difficult tounderstand the local and distortional postbuckling stress redistribution in the sections. It wastherefore decided to investigate simple lipped channel sections in the 1 mm to 6 mmthickness range to better understand the postbuckling stress distributions which occur as aresult of local, distortional and interaction buckling. Different yield stress values were usedincluding very high values which allowed the postbuckled deformations to develop.
The basic section chosen was a simple lipped channel with an 80 mm web and 60 mm flange.The lip size was varied from 5 mm to 9 mm and the thickness from 1 mm to 6 mm. Thereference graphs of buckling stress versus buckled half-wavelength from a semi-analyticalfinite strip buckling analysis (SAFSM) (Papangelis and Hancock, 1995), shown as a solidline, with ends simply supported but free to warp are shown for the 1 mm thick section with 5mm lip in Fig. 1. The effect of fixing the ends as in a test is to increase the distortional
buckling stress much more significantly than the local buckling stress. The results of a splinefinite strip analysis (SFSM) (Lau and Hancock, 1986) between fixed ends are also shown as asolid line with circles in Fig. 1. It can be seen from Fig. 1 that the column with a lip size of 5mm has a distortional buckling mode at approximately 300 mm buckle half-wavelength and
buckling stress of 90 MPa. With the fixed ended condition of the spline finite strip analysis,the distortional buckling stress was increased to approximately 140 MPa, similar to the local
buckling stress. This would allow for possible interaction of local and distortional bucklingmodes.
A 2 mm thick column with a lip size of 9 mm can be seen in Fig. 2 to exhibit a distortional buckling mode at approximately 300 mm buckle half-wavelength. Similar behaviour to thatof the 1 mm thick section with 5 mm lip can be observed for the 2 mm thick section in Fig. 2.On the basis of these studies for a range of thicknesses and lip sizes, it was decided to study 6mm, 3 mm and 2 mm thick sections with a 9 mm lip, and 2 mm and 1 mm thick sections witha 5 mm lip. These dimensions were chosen to produce pure distortional buckling in somecases (i.e. 6 mm thick section) and interaction buckling in some cases (i.e. 2 mm with 9 mmlip, 1 mm with 5 mm lip).
3 FINITE ELEMENT ANALYSIS
3.1 General
The finite element program ABAQUS (2004) version 6.4 was used to simulate the buckling behaviour of fixed-ended simple lipped channels. When analysing elastic deformations, thematerial is assumed to have a linear response and hence no plasticity is included. For theinelastic analysis, plastic strains are included. However since no actual experiments werecarried out to determine the plastic strain data, the data was based on the Yang and Hancock(2002, 2006) stress-strain curves of G550 coupons in tension.
The simulation consists of two steps. In the first step, an elastic buckling analysis, also
known as a linear perturbation analysis, was performed on a perfect column to obtain its buckling mode (eigenmode). This indicates the possible buckling mode of the structure. Inthe second step, a non-linear analysis was carried out on the model using the modified Riksmethod. Material plasticity strains and geometric imperfection, obtained from the previous

8/14/2019 buckling mdes description
http://slidepdf.com/reader/full/buckling-mdes-description 8/40
Interaction buckling and postbuckling in the distortional mode of thin-walled sections April 2006
School of Civil EngineeringResearch Report No R870
7
step, are included in this analysis so as to obtain the ultimate failure loads and failure modesof the columns.
3.2 Type of element and finite element mesh
ABAQUS includes general-purpose shell elements that provide robust and accurate solutionsto most applications. Some of these general-purpose shell element types are the S3, S3R, S4and S4R. Element type S4R is a four-node doubly curved general-purpose shell, reducedintegration with hourglass control, using six degrees of freedom per node (ABAQUS, 2004)and was chosen to be used for the simulations.
Simpson’s rule was chosen, by default, to calculate the cross-sectional behaviour of a shell.The shell element chosen, assuming a homogenous section, has five integration pointsthrough the thickness (ABAQUS, 2004). During the analysis, ABAQUS evaluates the stressand strain components on the top (positive) and bottom (negative) surfaces. For this research,in order to understand how the stresses are redistributed even through the element thickness,
the stress and strain components are evaluated at the shell’s top and bottom surfaces as wellas at the midsurface.
The size of the finite element mesh used in the analysis is 5 mm x 5 mm (length by width)and was applied to both the webs and flanges. The lips have mesh sizes ranging from 5 mm x2.5 mm to 5 mm x 4.5 mm. A typical finite element mesh of a buckled simple lipped channelis shown in Fig. 3.
3.3 Boundary conditions and method of loading
The simple lipped channel column was assumed to be compressed between fixed ends. Thisis done so by restraining the translational and rotational degrees of freedom at both ends ofthe model, except the translational degree of freedom in the axial direction at the top of themodel. This allows for the compression due to the load application at the top end. All nodesother than at the ends are free to translate and rotate in any direction.
When analysing the local buckling component alone at the distortional length, the distortional buckling component has to be “locked out”. This was achieved by restraining the lateraldisplacement of the nodes at the lip flange junction. This effectively “locked out” thedistortional buckling mode so as to facilitate the analysis of the post-local buckling stressdistribution.
The displacement control method was employed to simulate an applied load on the top end ofthe channel column. The applied compressive load was simulated by specifying an axialdisplacement of 2 mm at the top end of the column. This displacement is equivalent to theaxial shortening of the column.
3.4 Material properties and material orientation
As mentioned earlier, a linear perturbation analysis is carried out to analyse the elastic buckling behaviour of the column and to provide the possible buckling modes (eigenmodes)of the column. In the linear analysis, only the density, Young’s modulus and Poisson’s ratio
were included. In some of the analyses, the columns were analysed as having ideal elasticmaterial behaviour, hence material plasticity was not included. However some analyses

8/14/2019 buckling mdes description
http://slidepdf.com/reader/full/buckling-mdes-description 9/40
Interaction buckling and postbuckling in the distortional mode of thin-walled sections April 2006
School of Civil EngineeringResearch Report No R870
8
allowed inelasticity and hence material plasticity values were added into the finite elementmodels by specifying the “true” values of stresses and strains.
If the nominal data for a uniaxial test is obtained and the material is isotropic, the true stress(σ true) and true plastic strain ( ) can be simply converted by the following equations: pl
trueε
( )ε σ σ += 1true (1)
( ) E
true pltrue
σ ε ε −+= 1ln (2)
where E is the Young’s modulus, σ and ε are nominal stress and strain respectively(ABAQUS, 2004). The measured stress and strain values were obtained from tensile coupontests conducted by Yang and Hancock (2002, 2006). The yield stress used in this paper wasassumed to be 700 MPa and the stress-strain curves are for the 0.42 mm material in Table 1of that paper.
In order to determine the longitudinal stress distributions in the postbuckling range, thematerial has to be orientated into the longitudinal direction. This is done by assigning thematerial with a local coordinate system by using the *ORIENTATION option in ABAQUS.During the orientation, each element is assigned to have the member 2-axis of the coordinatesystem in the axial direction.
3.5 Geometric imperfections
In the non-linear analysis, geometric imperfections are added onto the “perfect” model to
create out-of-plane deformations. The geometric imperfections can be defined by threedifferent methods in ABAQUS (ABAQUS, 2004). Firstly, the geometric imperfections can
be defined by the linear superimposition of buckling modes. Secondly, they can be defined by the displacements from an initial *STATIC analysis, which may consist of the applicationof a “dead” load. Thirdly, the imperfections can be defined by specifying specific nodes andmodifying the translational degrees of freedom. In this report, the first method employing thelinear superposition of buckling modes was used.
Firstly, an initial analysis is carried out on a perfect mesh using the elastic buckling analysisto generate the possible buckling modes and, at the same time, nodal displacements of thesemodes are generated. Following this, the imperfection is introduced to the perfect mesh bymeans of linearly superimposing the elastic distortional buckling modes onto the mesh.However when analysing the elastic local buckling component at the distortional buckle half-wavelength, the local buckling mode is linearly superimposed onto the mesh. The lowest
buckling modes are usually the critical modes, hence these are used to generate theimperfections. A scaling factor with respect to the thickness was applied to the imperfection
before superimposing to create the perturbed mesh. To validate the analyses and investigateimperfection magnitudes, sensitivity and validation analyses were preformed with differentlevels of geometric imperfections.
3.6 Analyses
3.6.1 Eigenvalue buckling analysis

8/14/2019 buckling mdes description
http://slidepdf.com/reader/full/buckling-mdes-description 10/40
Interaction buckling and postbuckling in the distortional mode of thin-walled sections April 2006
School of Civil EngineeringResearch Report No R870
9
The eigenvalue buckling analysis is carried out to determine the buckling modes and toestimate the critical buckling stress of “stiff” structures. Stiff structures have very littledeformation prior to buckling and primarily carry loads axially. When the response of astructure is non-linear before collapse, a general eigenvalue buckling analysis can provideuseful estimates of collapse mode shapes (ABAQUS, 2004).
ABAQUS uses the subspace iteration eigensolver when the *BUCKLE analysis is carriedout. Eigenvalues, also known as load multipliers, are extracted in this analysis and the lowestvalue is most important. The buckling mode shapes, also known as eigenvectors, are oftenthe most useful outcome in the eigenvalue analysis, since they predict the likely failure modeof the structure.
3.6.2 Postbuckling analysis
A structure that has material and geometrically nonlinearity or has unstable postbucklingresponse requires a load-displacement analysis to be performed. This analysis is known asthe” modified Riks method” and is generally used to predict unstable, geometricallynonlinear collapse of a structure. The Riks method employs proportional loading and solvessimultaneously for loads and displacements. ABAQUS uses the arc length along the staticequilibrium path in load-displacement space to measure the progress of the solution. Thismethod is useful as it provides solutions regardless of whether the response is stable orunstable.
The Riks method works well in snap-through problems – those in which the equilibrium pathin load-displacement space is smooth and does not branch. The method can also be used to
perform postbuckling analyses of structures exhibit stable and unstable postbuckling behaviours (ABAQUS, 2004). In order to analyse postbuckling behaviour, the model has tohave a continuous response instead of bifurcation, and this is done so by adding the geometricimperfection to create a perturbed mesh. This allows for some response in the buckling mode
before the critical load is reached.
4 SENSITIVITY AND VALIDATION ANALYSES
As part of this investigation, both outwards (O-O) and inwards (I-I) imperfections have beenassumed where outwards refers to the lip motion relative to the other lip. Schafer and Pekoz(1998) recommended that for a distortional geometric imperfection (called Type 2), a valueapproximately equal to the plate thickness, t , can be chosen. However this value may be toolarge when applied as the maximum amplitude of a distortional buckling half-wave since itmay produce conservative results for distortional buckling modes with increasing materialthickness. A value of 0.64t was obtained by Schafer and Pekoz from the lower bound
probability of 25 % of the Type 2 imperfections and this value has been used to analyse andcompare the FEA ultimate failure loads to known strength curves in Fig. 4. The curves are astrength curve (P uw) based on the Winter (1968) effective width formula and the Kwon andHancock (1992) strength equation (P ukh) , which is the same as used in the Direct StrengthMethod (DSM) in AS/NZS 4600:2005 (2005) and NAS (supplement) (2004). The elastic
buckling curve (P od or P ol) is shown as the solid line, while the Winter strength curve, forlocal buckling, is shown as the line with triangles ( ) and the Kwon and Hancock strength
curve, for distortional buckling, as a line with circles ( ). The Winter strength curve isderived from the Winter (1968) effective width as shown in Equations 3 and 4.

8/14/2019 buckling mdes description
http://slidepdf.com/reader/full/buckling-mdes-description 11/40
Interaction buckling and postbuckling in the distortional mode of thin-walled sections April 2006
School of Civil EngineeringResearch Report No R870
10
673.01 ≤=l
e
b
bλ (3)
673.022.01 >
−=
l y
ol
y
ole
f f
f f
bb
λ (4)
where,
λ l
= f y f ol
where , f y is the yield stress and f ol is the local buckling stress
When the effective width, be, of each element of a section is computed for each element inthe section assuming that all buckle locally at the same stress f ol, then multiplying by the platethickness, t , and yield stress, f y, and summing over all elements in the section produces
Puw= P y
λ l
≤ 0.673 (5)
Puw= Pol
P y
1 − 0.22Pol
P y
P y
λ l> 0.673 (6)
where,
ol
yl P
P=λ
where ,P y= Af y and Pol
= Af ol
Equations 5 and 6 are called the Winter strength equations in this paper and apply to local bucking.
Equations 7 and 8 are the Kwon and Hancock strength equations and are similar to Equations5 and 6 except that the coefficient 0.22 and the exponent 0.5 have been changed to 0.25 and0.22 respectively lower the curve below the Winter strength equations and P ol has beenreplaced by the distortional buckling load P od = Af od.
Pukh = P y λ d ≤ 0.561 (7)
Pukh= 1 − 0.25
Pod
P y
0.6 Pod
P y
0.6
P y λ
d > 0.561 (8)
where,od
yd P
P=λ
Silvestre and Camotim (2004) also investigated the local and distortional postbuckling
behaviour of lipped channel columns using Generalised Beam Theory (GBT) and finiteelement analyses. In their paper, the geometric imperfections were assumed to have anamplitude of 0.15t which was applied to the finite element models for both the local anddistortional buckling mode analyses. The FEA ultimate failure loads based on an

8/14/2019 buckling mdes description
http://slidepdf.com/reader/full/buckling-mdes-description 12/40
Interaction buckling and postbuckling in the distortional mode of thin-walled sections April 2006
School of Civil EngineeringResearch Report No R870
11
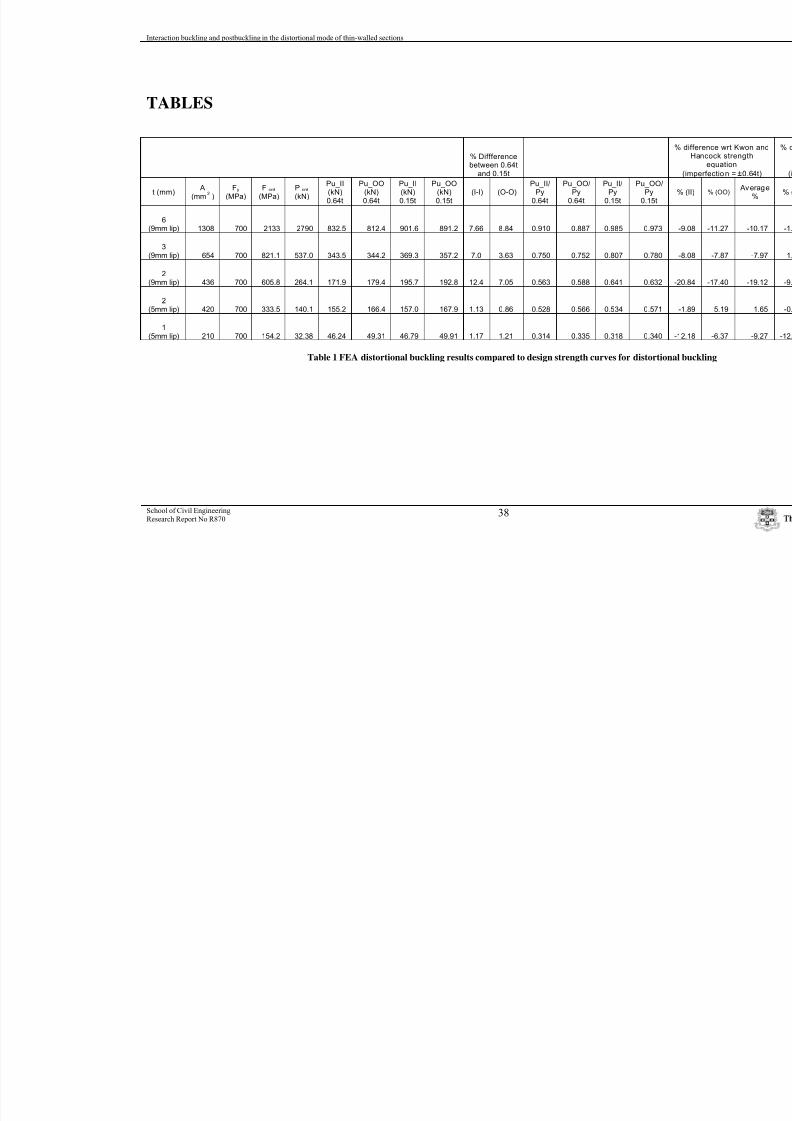
imperfection of 0.15t are compared with the strength curves in Fig. 5 and are higher thanthose in Fig. 4 based on the 0.64t. All values are summarised in Table 1.
It can be seen in Figs. 4 and 5 that at higher slenderness (i.e. the 1 mm thick section), theFEA results for columns with both imperfection magnitudes are slightly lower than the Kwonand Hancock strength curve. When the columns with 9 mm lips are analysed at a thickness of2 mm, it can be seen from Figs. 4 and 5 that the ultimate loads are significantly lowercompared to the Kwon and Hancock strength curve for both imperfection magnitudes. Withthickness increasing to 3 mm and 6 mm, it can be seen from Fig. 4 that the analyses with animperfection magnitude of 0.64t produced much lower ultimate loads when compared to thestrength curves, whereas analyses with an imperfection magnitude of 0.15t producedultimate loads that are well predicted by the strength curves as seen in Fig. 5. Some of thesedifferences are due to the imperfection magnitudes which could include the roundedness ofthe stress-strain curve stockier sections.
The results of the sensitivity analyses based on the different geometric imperfectionmagnitudes are also summarised in Table 1. The difference in ultimate loads between theanalyses with different imperfection magnitudes is approximately 1 % at a thickness of 1mm. The difference in ultimate loads between the analyses with different imperfectionmagnitudes increases up to 12 % at a thickness of 2 mm with 9 mm lips. An additionalanalysis was carried out on a section with 2 mm thickness and with a lip size 5 mm and theultimate loads are well predicted by the strength curves and have a difference ofapproximately 1 % between the analyses with different imperfection magnitudes. Thedifferences in ultimate loads between the analyses with different imperfection magnitudes areapproximately 3.6 % to 8.8 % for sections with thicknesses 3 mm and 6 mm respectively.
The sensitivity analysis confirms the initial statement that thinner materials (1 mm or less) isless sensitive to imperfection magnitudes as the difference in ultimate loads are relativelysimilar. However with thicker materials, the ultimate loads are sensitive to imperfections andwith a larger imperfection, the FEA ultimate loads becomes lower when compared to thestrength curves. The results of the analyses based on the geometric imperfection magnitudeof 0.15t are summarised in Table 1. Generally the scale factor of 15 % of the plate thickness
provides ultimate loads which compare well with the strength curves which are based ontests. Therefore, the scale factor of 15 % of the plate thickness is chosen as the maximumamplitude of the geometric imperfections in the distortional mode to be applied to the finiteelement models for the later analyses in this paper. This choice is particularly important inthis paper because thicker sections have been chosen in many of the analyses to separate thelocal and distortional modes.
To compare the FEA analyses with the Winter strength curve for local buckling, a set ofadditional analyses where distortional buckling was prevented was performed. The results ofthese analyses are summarised in Table 2. From Fig. 5, it can be seen that the local bucklingstrength, shown as a plus (+) symbol, for the sections with varying thicknesses are well
predicted by the Winter strength curve based on a slenderness λ l for local buckling of thewhole section. For sections with thicknesses 1 mm and 2 mm, the FEA ultimate loads areslightly higher, whereas for the section at 3 mm thickness, the FEA ultimate load is slightlylower, which is most likely due to assumed imperfections.
5 POSTBUCKLING BEHAVIOUR
8/14/2019 buckling mdes description
http://slidepdf.com/reader/full/buckling-mdes-description 13/40
Interaction buckling and postbuckling in the distortional mode of thin-walled sections April 2006
School of Civil EngineeringResearch Report No R870
12
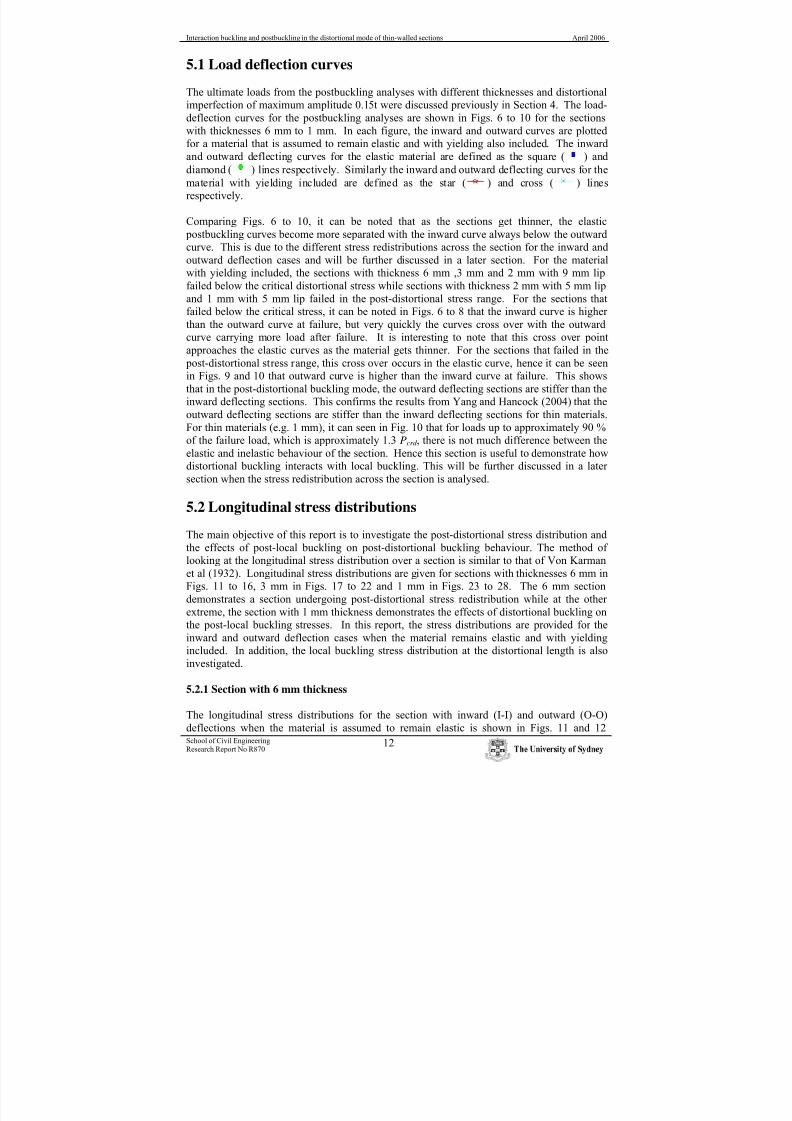
5.1 Load deflection curves
The ultimate loads from the postbuckling analyses with different thicknesses and distortionalimperfection of maximum amplitude 0.15t were discussed previously in Section 4. The load-deflection curves for the postbuckling analyses are shown in Figs. 6 to 10 for the sectionswith thicknesses 6 mm to 1 mm. In each figure, the inward and outward curves are plottedfor a material that is assumed to remain elastic and with yielding also included. The inwardand outward deflecting curves for the elastic material are defined as the square ( ) anddiamond ( ) lines respectively. Similarly the inward and outward deflecting curves for thematerial with yielding included are defined as the star ( ) and cross ( ) linesrespectively.
Comparing Figs. 6 to 10, it can be noted that as the sections get thinner, the elastic postbuckling curves become more separated with the inward curve always below the outwardcurve. This is due to the different stress redistributions across the section for the inward andoutward deflection cases and will be further discussed in a later section. For the material
with yielding included, the sections with thickness 6 mm ,3 mm and 2 mm with 9 mm lipfailed below the critical distortional stress while sections with thickness 2 mm with 5 mm lipand 1 mm with 5 mm lip failed in the post-distortional stress range. For the sections thatfailed below the critical stress, it can be noted in Figs. 6 to 8 that the inward curve is higherthan the outward curve at failure, but very quickly the curves cross over with the outwardcurve carrying more load after failure. It is interesting to note that this cross over pointapproaches the elastic curves as the material gets thinner. For the sections that failed in the
post-distortional stress range, this cross over occurs in the elastic curve, hence it can be seenin Figs. 9 and 10 that outward curve is higher than the inward curve at failure. This showsthat in the post-distortional buckling mode, the outward deflecting sections are stiffer than theinward deflecting sections. This confirms the results from Yang and Hancock (2004) that the
outward deflecting sections are stiffer than the inward deflecting sections for thin materials.For thin materials (e.g. 1 mm), it can seen in Fig. 10 that for loads up to approximately 90 %of the failure load, which is approximately 1.3 P crd , there is not much difference between theelastic and inelastic behaviour of the section. Hence this section is useful to demonstrate howdistortional buckling interacts with local buckling. This will be further discussed in a latersection when the stress redistribution across the section is analysed.
5.2 Longitudinal stress distributions
The main objective of this report is to investigate the post-distortional stress distribution andthe effects of post-local buckling on post-distortional buckling behaviour. The method oflooking at the longitudinal stress distribution over a section is similar to that of Von Karmanet al (1932). Longitudinal stress distributions are given for sections with thicknesses 6 mm inFigs. 11 to 16, 3 mm in Figs. 17 to 22 and 1 mm in Figs. 23 to 28. The 6 mm sectiondemonstrates a section undergoing post-distortional stress redistribution while at the otherextreme, the section with 1 mm thickness demonstrates the effects of distortional buckling onthe post-local buckling stresses. In this report, the stress distributions are provided for theinward and outward deflection cases when the material remains elastic and with yieldingincluded. In addition, the local buckling stress distribution at the distortional length is alsoinvestigated.
5.2.1 Section with 6 mm thickness
The longitudinal stress distributions for the section with inward (I-I) and outward (O-O)deflections when the material is assumed to remain elastic is shown in Figs. 11 and 12

8/14/2019 buckling mdes description
http://slidepdf.com/reader/full/buckling-mdes-description 14/40
Interaction buckling and postbuckling in the distortional mode of thin-walled sections April 2006
School of Civil EngineeringResearch Report No R870
13
respectively. The analysis of the section with this thickness was chosen because it had anelastic distortional buckling stress (F crd = 2132 MPa) much less than the elastic local bucklingstress (F crl = 5347 MPa). The ratio of F crl to F crd is approximately 2.51 as given in Table 2.For both cases, the sections deformed in the post-distortional mode since the stresses werewell below those where local buckling effects might have affected it.
When the stresses are redistributed across the web in the post-distortional buckling region,the stresses decrease in the middle as it sheds the stresses to the flange-web junctions.However for the inward and outward deflections, the increased stresses at the junctions aredifferent at similar load levels. When P/P crd is approximately 1.35, the stress at the flange-web junction is approximately 3890 MPa for the inward deflection mode, while the stress atthe flange-web junction for the outward deflection mode is approximately 4350 MPa. Thus itcan be noted that in the post-distortional range, the flange-web junction of the outward modecarries more load than the inward mode at the same load level for a section with thickness 6mm. This increased stress capacity for the section with outward deflection mode comparedto the inward deflection mode indicates that the inward deflection mode is much softer as itsheds the load more rapidly as the deformations progress, as shown in Fig. 13. This confirmsthe results obtained by Yang and Hancock (2004) that the outward deflection modes arestiffer than the inward deflection modes.
When the distortional mode was “locked out” so as to observe the local buckling stress aloneat the distortional length, the stress distribution for the post-local buckling range for thesection is as shown in Fig. 14. It can be seen that as the load increases, there is significantstress redistribution in the middle of the web and flanges to the flange-web and flange-lip
junctions as for normal post-local buckling behaviour. Figs. 11 and 12 also show that as theloads increase into the post-distortional buckling region, the stresses in the middle of the weband flanges are redistributed to the flange-web and flange-lip junctions. However, it isinteresting to note that this post-distortional buckling stress redistribution has a uniquecharacteristic which has some similarities to the post-local buckling stress distribution shownin Fig. 14, particularly for the inward deflection mode shown in Fig. 11.
The longitudinal stress distributions for the section with inward and outward deflection casesnow including yielding is shown in Figs. 15 and 16 respectively. For the section with inwarddeflection, the stress at the web and flanges are redistributed to the flange-web and flange-lip
junctions relatively equally and hence yield approximately at the same time. The stress in theweb and flanges for the section with the outward deflection are redistributed differently withmost of the stress being shed to the lips and flange-web junctions. Due to the stressconcentrating at the junction, the section fails at a slightly lower load when compared to the
inward mode, with the lips yielding first but failure occurring in the junctions.
5.2.2 Section with 3 mm thickness
The longitudinal stress distributions for the 3 mm thick section with inward and outwarddeflections when the material is assumed to remain elastic is shown in Figs. 17 and 18respectively. The analysis of the section with this thickness was chosen because the sectionfailure loads were in the region of the elastic local buckling stress. The elastic distortional
buckling stress (F crd) and elastic local buckling stress (F crl) are 821 MPa and 1420 MParespectively and the ratio of F crl to F crd is approximately 1.73 as given in Table 2. WhenP/P crd is approximately 1.33, the stress at the flange-web junction is approximately 1700 MPa
for the inward deflection mode as shown in Fig. 17, while the stress at the flange-web junction for the outward deflection mode is approximately 1800 MPa as shown in Fig. 18.

8/14/2019 buckling mdes description
http://slidepdf.com/reader/full/buckling-mdes-description 15/40
Interaction buckling and postbuckling in the distortional mode of thin-walled sections April 2006
School of Civil EngineeringResearch Report No R870
14
Hence it is similar to the previous analysis with thickness 6 mm where the flange-web junction of the outward deflection mode carries more load than the inward deflection mode.
Similar to the previous analysis, the flange-web junction of the outward deflection modecarries more load than the inward deflection mode as the inward deflection mode is softer asshown in Fig. 19. This confirms the results obtained by Yang and Hancock (2004) that theoutward deflection modes are stiffer than the inward deflection modes. This causes thesection with inward deflection to redistribute the stress in the web to the flange-web andflange-lip junctions more rapidly.
When the distortional mode was “locked out” so as to observe the local buckling stress at thedistortional length, the stress distribution for the post-local buckling range for the section isas shown in Fig. 20. The post-distortional buckling stress distribution for the inwarddeflection mode (Fig. 17) has a similar characteristic to the post-local buckling stressdistribution as previously observed with thickness 6 mm. As the load increases, the stress inthe web decreases in the middle and is rapidly shed to the flange-web junctions. When theload applied was approximately 0.8 P crl, which is equivalent to approximately 1.39 P crd, thestress at the flange-web junction is approximately 1300 MPa as shown in Fig. 20. The post-local buckling stress at load level 1.39 P crd can be compared to the stress at the flange-web
junction at the load 1.33 P crd (1700 MPa) of the section with inward deflection mode (Fig.17). This comparison shows that the effect of the distortional buckling on the post-local
buckling stress is to push the stress higher at the flange-web junction, causing the section tofail at the flange-web junction with a higher stress concentration. Therefore thisdemonstrates the effect of interaction of local and distortional buckling in the postbucklingrange is to increase stresses at the flange-web junctions.
The longitudinal stress distributions for the section with inward and outward deflection caseswith yielding are shown in Figs. 21 and 22 respectively. Even though the inward mode hasless stiffness, the stresses in the web and flanges are redistributed relatively equally into theflange-web and flange-lip junctions, allowing the section to carry a higher load (0.688 P crd)with failure occurring at the flange-lip junctions as shown in Fig. 21. Compared to theoutward mode, the stresses are distributed differently with the stresses concentrating at thelips and flange-web junctions. From Fig. 22, it can be seen that the lips yield first but thesection continues to carry load until failure occurs at the flange-web junctions at load level0.665 P crd. The failure load of the outward deflection mode is slightly lower than the inwarddeflection mode in this case.
5.2.3 Section with 1 mm thickness
The longitudinal stress distributions for the 1 mm thick section with inward and outwarddeflections when the material is assumed to remain elastic is shown in Figs. 23 and 24respectively. The analysis of the section with this thickness was chosen because the elasticdistortional buckling stress was approximately equal to the elastic local buckling stress. Theelastic distortional buckling stress (F crd) and elastic local buckling stress (F crl) are 154 MPaand 163 MPa respectively and the ratio of F crl to F crd is approximately 1.06. When P/P crd isapproximately 1.3, the stress at the flange-web junction is approximately 420 MPa for theinward deflection mode (Fig. 23), while the stress at the flange-web junction for the outwarddeflection mode is approximately 400 MPa (Fig. 24). It is interesting to note that at thisthickness, the stress at the flange-web junction for the inward deflection is now higher than
the outward deflection.

8/14/2019 buckling mdes description
http://slidepdf.com/reader/full/buckling-mdes-description 16/40
Interaction buckling and postbuckling in the distortional mode of thin-walled sections April 2006
School of Civil EngineeringResearch Report No R870
15
The lip displacements of the deflection modes are shown in Fig. 25 and although, asmentioned earlier, the flange-web junction of the outward deflection mode carries slightlymore load than the junction of the inward deflection mode, it can be seen that the inwarddeflection mode is softer than the outward deflection mode. This confirms the resultsobtained by Yang and Hancock (2004) that the outward deflection modes are stiffer than theinward deflection modes. With this increased stiffness, the outward mode fails at a higherload compared to the inward mode, as shown in the results in Fig. 5.
When the distortional mode was “locked out” so as to observe the local buckling stress at thedistortional length, the stress distribution for the post-local buckling range for the section isas shown in Fig. 26. When the load applied was approximately 1.28 P crl, which is equivalentto approximately 1.36 P crd, the stress at the flange-web junction is approximately 261 MPa asshown in Fig. 26. This post-local buckling stress of 261 MPa can be compared to the stress atthe flange-web junction at 1.3 P crd (420 MPa) for the inward deflection mode (Fig. 23). Thisis similar to the analysis carried out earlier on thickness 3 mm, whereby the effect of thedistortional buckling on the post-local buckling stress is to push the stress higher at theflange-web junction. This shows the interaction of local and distortional buckling in the
postbuckling range, which can be described by comparing Figs. 23 and 26. In Fig. 26, as theload increases into the post-local buckling range, 0.99 P crl to 1.45 P crl, the stresses in thecentre of the web decreases to approximately 70 MPa, while the stresses in the flangesincrease to approximately 175 MPa. This increased stress at the middle of the flange causesless stress to be redistributed to the junctions. In Fig. 23, as the load increases into the post-distortional buckling range, 1.0 P crd to 1.3 P crd, the stress in the web decreases in a similarfashion to the post-local buckling behaviour. However the stresses in the flanges decreasevery slightly and are redistributed into the junctions, causing the flange-web junctions to bemore highly stressed.
The longitudinal stress distributions for the section with inward and outward deflection caseswith yielding are shown in Figs. 27 and 28 respectively. The purpose of analysing both withand without yielding at this thickness was to observe whether the lip failure significantlyinfluenced the behaviour. It can be observed for the inward deflection mode that up to 90 %of the failure load, which is approximately 1.3 P crd as seen in Fig. 10, there is not muchdifference between the elastic and inelastic behaviour around the section except maybe thestresses in the centre of the flanges as shown in Figs. 23 and 27. The maximum load stilldoes not occur until the flange-web junction yielding occurs. Hence, although the lipyielding does cause some readjustment of the stresses, it is still the flange-web junctionfailure which governs the failure of the section and failure for the inward deflection modeoccurs at a load of 1.445 P crd. By comparison with the inward deflection mode, the outward
mode fails at the yielding of the lips even though this is a higher load (1.54 P crd) due to thedifferent stress distributions as seen in Fig. 28.
5.2.3.1 Effect of lip yielding on failure load
In the previous section, it was discussed that a section with thickness 1 mm, lip yielding mayoccur but not cause failure of the section and that it is the flange-web junction that isnormally the critical factor. Therefore to understand the effect of lip yielding on the failureload, a section (80mm x 60mm x 5mm, 1 mm thickness) similar to the previously analysedsections was designed with a new material, i.e. a different yield stress, that is applied to thelips. By increasing the yield stress to approximately 1700 MPa, the yielding of the lips will
be prevented.

8/14/2019 buckling mdes description
http://slidepdf.com/reader/full/buckling-mdes-description 17/40
Interaction buckling and postbuckling in the distortional mode of thin-walled sections April 2006
School of Civil EngineeringResearch Report No R870
16
Fig. 29 compares the load displacement plots for the inward and outward deflection modesfor the sections with both one and two materials. The section with one material is the
previously analysed section in Section 5.2.3. Figs. 30 and 31 show the longitudinal stressdistributions for the inward and outward deflection modes respectively for the sections withtwo materials. For the inward deflection mode, it can be seen from Fig. 30 that the failureload is approximately 1.505 P crd and this presents a 4.15 % increase from the failure load of1.445 P crd as shown in Fig. 27 for the section with one material. This increase is consideredto be not significant. For the outward deflection mode, it can be seen from Fig. 31 that thefailure load is 1.61 P crd and this presents a 4.48 % increase from the failure load of 1.54 P crd as shown in Fig. 28 for the section with one material. This increase is considered to be notsignificant. Therefore it can be concluded that lip yielding does not play a large part in thesection failure while failure occurs very soon after yielding at the flange-web junction. Thisis confirmed by Yang (2004) with the 800 mm column failing in the outward deflection modewhere local failure occurred in the lips at about 18 kN but the section continued to carry loadto approximately 22 kN with very little apparent effect.
6 TEST RESULTS IN RELATION TO STRENGTHDESIGN CURVES WITH 0.5 AND 0.6 COEFFICIENTS
With the analyses carried out, the distortional buckling results were compared to the strengthdesign curves based on the Kwon and Hancock strength equation as given in Section 4. Thevalidation of the Winter strength curve for local buckling was based on an additional set ofanalyses and was previously discussed in Section 4. The ratios of P crl to P crd for the varyingthicknesses are summarised in Table 2. From Table 2, it can be noted that when sectionswith a larger ratio of elastic local to distortional buckling stress, i.e. sections with thicknesses6 mm, 3 mm and 2 mm (5 mm lip), the failure mode is purely distortional buckling and theresults are generally well predicted by the Kwon and Hancock strength curve. Thesesections, without interaction of buckling modes, have strength results approximately -0.57 %to 2.6 % of the Kwon and Hancock strength curve. When the ratio of elastic local todistortional buckling stress is approximately 1.0, i.e. sections with thicknesses 2 mm (9 mmlip) and 1 mm (5 mm lip), interaction of local and distortional buckling would most likelyoccur and cause the test results to be lower than the Kwon and Hancock strength curve.When a section has interaction of buckling modes, the effect of this interaction causes thesection to have a strength reduction of approximately 9.3 % to 10 % as previouslysummarised in Table 1.
Hence from the analyses of sections failing in the local and distortional modes, the Winterand Kwon and Hancock strength curves are appropriate to be used to predict sections failing purely in the local or distortional mode with no interaction of buckling modes. Wheninteraction of buckling modes occurs, the strength of the section is reduced and the designstrength curves are unable to account for this reduction.
7 CONCLUSION
This paper has described the finite element analysis and results of the postbuckling in thelocal and distortional modes of thin-walled section with edge stiffeners of varyingthicknesses. The effect of the distortional buckling mode on the post buckling stressdistributions was investigated and discussed. The column was designed with fixed-ended
boundary conditions. The finite element program, ABAQUS, was used to create a finite

8/14/2019 buckling mdes description
http://slidepdf.com/reader/full/buckling-mdes-description 18/40
Interaction buckling and postbuckling in the distortional mode of thin-walled sections April 2006
School of Civil EngineeringResearch Report No R870
17
element model by using shell elements. In this finite element model, geometricimperfections, method of load application, material orientation and non-linearity weredeveloped and discussed. A sensitivity analysis for the magnitude of geometricimperfections in the distortional mode of the columns was carried out and the results werecompared to known strength curves to validate the methodology against tests.
Load deflection curves were generated for the sections with and without yielding, whichincluded inward and outward distortional modes and the results were discussed. Furtheranalysis on sections with thicknesses 6 mm, 3 mm and 1 mm was carried out to observe thelongitudinal stress distributions over these sections in the post-distortional and post-local
buckling range. This methodology of analysing the stress redistribution of the section wasadopted from an earlier method by Von Karman et al (1932) to analyse the post-local
buckling behaviour. The following conclusions were determined from the analyses of thestress redistributions of the sections undergoing mainly distortional buckling but with local
buckling also in the thinner sections.
1. The post-distortional buckling stress distribution has a unique characteristic which hassimilarities to the post-local buckling stress distributions with a significant stressredistribution in the web, particularly for the inward distortional mode. This explainswhy post-distortional buckling is higher than post-flexural or flexural-torsional
buckling.
2. When local and distortional buckling interact in the postbuckling range, the effect ofdistortional buckling on the post-local buckling stress is to push the stress higher atthe flange-web junctions.
3. The inward and outward distortional modes have very different stress distributions.The inward mode redistributes stresses in the web and flanges into the flange-web andflange-lip junctions. The outward mode distributes stresses mainly to the flange-web
junctions and lips.
4. Failure tends to occur very soon after yielding of the flange-web junctions and lipyielding does not play a large part in the failure as had been predicted in earlier
papers.
5. With thicker materials (3 mm and 6 mm), at similar load levels, the outwarddeflection mode has higher stress at the flange-web junctions compared to the inwarddeflection modes. With the thinner material (1 mm) the flange-web junction of the
inward deflection mode has a slightly higher stress value compared to the outwarddeflection mode.
6. The section has a higher axial stiffness for the outward mode compared to the sectiondeforming mainly in the inward mode. For the section with thinner material, theanalysis showed that the distortional mode deflecting outwards has a greater strength.This confirms Yang’s (2004) tests that showed the differences in strength whendeflecting inwards and outwards. This was also confirmed theoretically by theGeneralised Beam Theory (GBT) models of Silvestre and Camotim (2004) for fixedended sections.
7. The Winter strength curve is validated by the local buckling analyses, while thedistortional buckling analyses showed that the Kwon and Hancock strength curvevalidates the FEA results with pure distortional failure modes. The interaction of

8/14/2019 buckling mdes description
http://slidepdf.com/reader/full/buckling-mdes-description 19/40
Interaction buckling and postbuckling in the distortional mode of thin-walled sections April 2006
School of Civil EngineeringResearch Report No R870
18
local and distortional buckling modes indicated that there would be a reduction insection strength when the local and distortional buckling stresses are approximatelyequal.
The conclusions of this paper afford a much better understanding of failure in the post-distortional mode. In particular, the reasons why channel sections have a post-distortionalstrength which is not as significant as post-local strength have been explained. Furtherresearch is required to quantify the reductions due to the interaction of local and distortional
buckling modes now that the mechanism is understood.
ACKNOWLEDGEMENTS
This report forms part of an ARC research project entitled “Interaction of local anddistortional buckling modes in cold-formed high strength steel” being carried out at theSchool of Civil Engineering at the University of Sydney. The authors would like to thank the
Australian Research Council for the financial support for the project performed at theUniversity of Sydney.
8/14/2019 buckling mdes description
http://slidepdf.com/reader/full/buckling-mdes-description 20/40
Interaction buckling and postbuckling in the distortional mode of thin-walled sections April 2006
School of Civil EngineeringResearch Report No R870
19
REFERENCES
ABAQUS version 6.4; User’s manual . (2004), ABAQUS, Inc., Pawtucket, R.I.
American Iron and Steel Institute (AISI), (2004), Supplement 2004 to the North AmericanSpecification for the design of cold-formed steel structural members, 2001 edition ,Washington, D.C.
Camotim, D., Silvestre, N., (2004), “GBT-based analysis of the distortional postbuckling behaviour of cold-formed steel Z-section columns and beams”, Proceedings of Fourth International Conference on Thin-Walled Structures (Loughborough, 22-24/6), 2004, pp 243-250.
Hancock, G.J., (1985), “Distortional buckling of steel storage rack columns”, Journal ofStructural Engineering , v111, n 12, Dec 1985, pp 2770-83.
Hancock G.J., (2003), “Cold-formed steel structures”, Journal of Constructional Steel Research , v59(4), April 2003, pp 473-487.
Hancock G.J., Murray T.M. and Ellifritt D.S., (2001), Cold-formed steel structures to the AISI Specification. , Marcel Dekker, New York.
Kwon Y.B. and Hancock G.J., (1992), “Tests of cold-formed channels with local anddistortional buckling”, Journal of Structural Engineering , v117, n7, pp 1786-1803.
Lau, S.C.W. and Hancock, G.J., (1986), “Buckling of thin flat-walled structures by a spline
finite strip method”, Thin-Walled Structures , v 4, n 4, pp 269-94.
Lau, S.C.W. and Hancock, G.J. (1990), “Inelastic buckling of channel columns in thedistortional mode”, Thin-Walled Structures , v 10, n 1, 1990, pp 59-84.
Papangelis, J.P. and Hancock, G.J., (1995), “Computer analysis of thin-walled structuralmembers”, Computers & Structures , v 56, Issue 1, pp 157-76.
Schafer B.W., Pekoz T., (1998), “Computational modelling of cold-formed steel:characterizing geometric imperfections and residual stresses”. Journal of Constructional
Research , v 47, pp 193-210.
Schafer, B.W., (2002), “Local, distortional, and Euler buckling of thin-walled columns”, Journal of Structural Engineering , v 128, n 3, March 2002, pp 289-299.
Silvestre, N. and Camotim, D., (2004), “Local-plate and distortional post-buckling behaviourof cold-formed steel lipped channel columns with intermediate stiffeners”, Proceedings ofSeventeen International Speciality Conference on Cold-Formed Steel Structures (Orlando, 4-5/11), 2004, pp 1-18.
Sridharan, S., (1982), “Semi-analytical method for the post-local-torsional buckling analysisof prismatic plate structures”, International Journal for Numerical Methods in Engineering , v18, n 11, Nov 1982, pp 1685-1697.

8/14/2019 buckling mdes description
http://slidepdf.com/reader/full/buckling-mdes-description 21/40
Interaction buckling and postbuckling in the distortional mode of thin-walled sections April 2006
School of Civil EngineeringResearch Report No R870
20
Standards Australia / Standards New Zealand (2005), Cold-formed steel structures-AS/NZS4600:2005 , Sydney, NSW, Australia.
Thomasson, P.O., (1978), “Thin-walled C-shaped panels in axial compression”, NationalSwedish Building Research, D1:1978 .
Timoshenko, S.P., (1945), “Theory of bending, torsion and buckling of thin-walled membersof open cross section”, Journal of the Franklin Institute , v 239, Issue 5, May 1945, pp 343-361.
Trahair, N. S., (1993), Flexural-torsional buckling of structures , First edition, E & F N Spon.
Vlasov, V. Z., (1961), Thin-walled elastic beams , Moscow (English translation IsraelProgram for Scientific Translation, Jerusalem).
Von Karman, T., Sechler, E.E. and Donnell, L.H., (1932), “The strength of thin plates incompression”, Transactions ASME , v 54, MP 54-5.
Winter, G., (1968), “Thin-walled structures-Theoretical solutions and test results”,Preliminary Publications of the Eighth Congress, IABSE , pp 101-112.
Yang, D. and Hancock, G.J., (2004), “Compression Tests of Cold-Reduced High StrengthSteel Channel Columns Failing in the Interaction Between Local and Distortional Modes”,
Journal of Structural Engineering, v 130, n 12, pp 1954-1963.
Yang, D., (2004), Compression Stability of High Strength Steel Sections with Low Strain- Harding , Ph.D. Thesis, School of Civil Engineering, University of Sydney, Sydney.
Yang, D. and Hancock, G.J., (2006), “Numerical simulation of high-strength steel box-shaped columns failing in the local and overall buckling modes”, Journal of Structural
Engineering , v 132, n 4, pp 541-549.

8/14/2019 buckling mdes description
http://slidepdf.com/reader/full/buckling-mdes-description 22/40
Interaction buckling and postbuckling in the distortional mode of thin-walled sections April 2006
School of Civil EngineeringResearch Report No R870
21
NOTATIONS
Ae Effective area (mm 2)
b Width of element (mm)
be Effective width of element (mm)
E Young’s modulus (GPa)
Fcrd Critical distortional buckling stress (MPa)
Fcrl Critical local buckling stress (MPa)
Fy Yield stress (MPa)
Pcrd, Pod Critical distortional buckling load (kN)
Pcrl, Pol Critical local buckling load (kN)
Py Squash load (kN)
Pukh Ultimate load for Kwon and Hancock strength curve (kN)
Puw Ultimate load for Winter strength curve (kN)
t Thickness (mm)
σ Nominal stress (MPa)
ε Nominal strain (MPa)
σ true True stress (MPa)
ε true pl True plastic strain (MPa)
λd non-dimensional slenderness for distortional
λ l non-dimensional slenderness for local

8/14/2019 buckling mdes description
http://slidepdf.com/reader/full/buckling-mdes-description 23/40
Interaction buckling and postbuckling in the distortional mode of thin-walled sections April 2006
School of Civil EngineeringResearch Report No R870
22
FIGURES
L(3) D(1)60 D(2)
5
t = 1 mm80
Figure 1 Plot of buckling stress vs buckle half-wavelength for 1 mm thick section with 5mm lip
D(1)
L(4)
60 D(3)9
t = 2 mm80
Figure 2 Plot of buckling stress vs buckle half-wavelength for 2 mm thick section with 9mm lip

8/14/2019 buckling mdes description
http://slidepdf.com/reader/full/buckling-mdes-description 24/40
Interaction buckling and postbuckling in the distortional mode of thin-walled sections April 2006
School of Civil EngineeringResearch Report No R870
23
Figure 3 Finite element mesh of simple lipped channel
t = 6mm (I I)
(9mm lip) (OO)
t = 3mm (I I)(9mm lip) (OO)
t = 2mm (OO)(9mm lip) (I I)
t = 2mm (OO)(5mm lip) (I I)
t = 1mm (OO)(5mm lip) (I I)
Figure 4 FEA results compared to strength curves with imperfections 0.64 t

8/14/2019 buckling mdes description
http://slidepdf.com/reader/full/buckling-mdes-description 25/40
Interaction buckling and postbuckling in the distortional mode of thin-walled sections April 2006
School of Civil EngineeringResearch Report No R870
24
Local buckling(t=3mm)
t = 6mm (I I)
(9mm lip) (OO) Local buckling(t=2mm, 9mm lip)
t = 3mm (I I)(9mm lip) (OO) Local buckling
(t=2mm, 5mm lip) Local buckling(t=1mm, 5mm lip)
t = 2mm (I I)(9mm lip) (OO)
t = 2mm (OO)(5mm lip) (I I)
t = 1mm (OO)(5mm lip) (I I)
Figure 5 FEA results compared to strength curves with imperfections 0.15 t
Figure 6 Plot of load vs axial shortening with t = 6 mm (9mm lip)

8/14/2019 buckling mdes description
http://slidepdf.com/reader/full/buckling-mdes-description 26/40
Interaction buckling and postbuckling in the distortional mode of thin-walled sections April 2006
School of Civil EngineeringResearch Report No R870
25
Figure 7 Plot of load vs axial shortening with t = 3 mm (9 mm lip)
Figure 8 Plot of load vs axial shortening with t = 2 mm (9mm lip)

8/14/2019 buckling mdes description
http://slidepdf.com/reader/full/buckling-mdes-description 27/40
Interaction buckling and postbuckling in the distortional mode of thin-walled sections April 2006
School of Civil EngineeringResearch Report No R870
26
Figure 9 Plot of load vs axial shortening with t = 2 mm (5mm lip)
0.9 P u ≈ 1.3 P crd ≈ 42 kN
Figure 10 Plot of load vs axial shortening with t = 1 mm (5mm lip)

8/14/2019 buckling mdes description
http://slidepdf.com/reader/full/buckling-mdes-description 28/40
Interaction buckling and postbuckling in the distortional mode of thin-walled sections April 2006
School of Civil EngineeringResearch Report No R870
27
P/P crd =0.35
0.760.92
1.00 1.20 1.35
Fcrd =
2132 MPa
Stress at flange-web junction ≈ 3890 MPa Fcrl =
5347 MPa
Figure 11 Plot of longitudinal stress distribution around section for t=6mm (I-I)
P/P crd =0.35 0.75
0.92
Fcrd =2132 MPa
1.00
Stress at flange-web junction ≈ 4350 MPa
1.20 1.35
Fcrl =5347 MPa
Figure 12 Plot of longitudinal stress distribution around section for t=6mm (O-O)

8/14/2019 buckling mdes description
http://slidepdf.com/reader/full/buckling-mdes-description 29/40
Interaction buckling and postbuckling in the distortional mode of thin-walled sections April 2006
School of Civil EngineeringResearch Report No R870
28
Inward softer thanoutward
Figure 13 Plot of P/P crd vs lip deflection for section t = 6mm
P/P crl =0.31
0.61 0.84
Fcrl =5347 MPa
1.00
1.20
1.30
Figure 14 Plot of longitudinal stress distribution around section for t=6mm (forced local)

8/14/2019 buckling mdes description
http://slidepdf.com/reader/full/buckling-mdes-description 30/40
Interaction buckling and postbuckling in the distortional mode of thin-walled sections April 2006
School of Civil EngineeringResearch Report No R870
29
Fy = 700 MPa
Failure at flange-web and flange lip junctions
Fcrd =2132 MPa
Figure 15 Plot of longitudinal stress distribution around section for t=6mm (I-I with yielding)
Fy = 700 MPa
Failure at flange-web junctions and at tip of lips
Fcrd =2132 MPa
Figure 16 Plot of longitudinal stress distribution around section for t=6mm (O-O with yielding)

8/14/2019 buckling mdes description
http://slidepdf.com/reader/full/buckling-mdes-description 31/40
Interaction buckling and postbuckling in the distortional mode of thin-walled sections April 2006
School of Civil EngineeringResearch Report No R870
30
P/P crd =0.57 0.81 0.91 1.00
1.19 1.33
Fcrd =821 MPa
Fcrl =1420 MPa
≈ 1700 MPa
Figure 17 Plot of longitudinal stress distribution around section for t=3mm (I-I)
P/P crd =0.57
0.810.92 1.00
1.28 1.49
Fcrd =821 MPa
Fcrl =1420 MPa
X
≈ 1.33 P crd ≈ 1800 MPa
Figure 18 Plot of longitudinal stress distribution around section for t=3mm (O-O)

8/14/2019 buckling mdes description
http://slidepdf.com/reader/full/buckling-mdes-description 32/40
Interaction buckling and postbuckling in the distortional mode of thin-walled sections April 2006
School of Civil EngineeringResearch Report No R870
31
Inward softer thanoutward
Figure 19 Plot of P/P crd vs lip deflection for section t = 3mm
P/P crl =0.30
0.60
0.80
Fcrl =1420 MPa
0.8 x 1.73 = 1.39 P crd
≈1300 MPa1.00
1.20
1.40
Figure 20 Plot of longitudinal stress distribution around section for t=3mm (forced local)

8/14/2019 buckling mdes description
http://slidepdf.com/reader/full/buckling-mdes-description 33/40
Interaction buckling and postbuckling in the distortional mode of thin-walled sections April 2006
School of Civil EngineeringResearch Report No R870
32
Fcrd =821 MPa
P/P crd =0.688Fy =
700 MPa
Failure at flange-lip junctions
Figure 21 Plot of longitudinal stress distribution around section for t=3mm (I-I with yielding)
Fy =700 MPa
Failure at flange-web junctions
P/P crd =0.665 Fcrd =
821 MPa
Figure 22 Plot of longitudinal stress distribution around section for t=3mm (O-O with yielding)

8/14/2019 buckling mdes description
http://slidepdf.com/reader/full/buckling-mdes-description 34/40
Interaction buckling and postbuckling in the distortional mode of thin-walled sections April 2006
School of Civil EngineeringResearch Report No R870
33
P/P crd =0.62
0.891.00
1.11.2
1.3 Fcrd =154 MPa
Fcrl =163 MPa
≈ 420 MPa
Figure 23 Plot of longitudinal stress distribution around section for t=1mm (I-I)
Fcrd =154 MPa
P/P crd =0.62
0.901.00
1.1
1.2
Fcrl =163 MPa
≈ 400 MPa
1.3
Figure 24 Plot of longitudinal stress distribution around section for t=1mm (O-O)

8/14/2019 buckling mdes description
http://slidepdf.com/reader/full/buckling-mdes-description 35/40
Interaction buckling and postbuckling in the distortional mode of thin-walled sections April 2006
School of Civil EngineeringResearch Report No R870
34
Inward softer thanoutward
Figure 25 Plot of P/P crd vs lip deflection for section t = 1mm
P/P crl =0.303
0.673
0.99
Fcrl =163 MPa
1.28
1.45
1.28 F crl ≈ 1.36 F crd ≈ 261 MPa
Figure 26 Plot of longitudinal stress distribution around section for t=1mm (forced local)

8/14/2019 buckling mdes description
http://slidepdf.com/reader/full/buckling-mdes-description 36/40
Interaction buckling and postbuckling in the distortional mode of thin-walled sections April 2006
School of Civil EngineeringResearch Report No R870
35
Fy = 700 MPa
P/P crd =0.31
0.740.90
Fcrd =154 MPa
1.00
1.2
1.41.445
Figure 27 Plot of longitudinal stress distribution around section for t=1mm (I-I with yielding)
P/P crd =0.31
0.750.92
Fcrd =154 MPa
1.00
1.2
1.4
1.54
Fy = 700 MPa
Figure 28 Plot of longitudinal stress distribution around section for t=1mm (O-O with yielding)

8/14/2019 buckling mdes description
http://slidepdf.com/reader/full/buckling-mdes-description 37/40
Interaction buckling and postbuckling in the distortional mode of thin-walled sections April 2006
School of Civil EngineeringResearch Report No R870
36
Figure 29 Plot of load vs displacement for t = 1 mm (2 materials)
P/P crd =0.62 0.81 1.00
Fcrd =154 MPa
1.11.2
1.4
1.505
Figure 30 Plot of longitudinal stress distribution around section for t=1mm (I-I with 2 materials)

8/14/2019 buckling mdes description
http://slidepdf.com/reader/full/buckling-mdes-description 38/40
I
School of Civil EResear
nteraction buckling and postbuckling in the distortional mode of thin-walled sections April 2006
ngineeringch Report No R870
37
Figure 31 Plot of longitudinal stress distribution around section for t=1mm (O-O with 2 materials)
P/P crd =0.62 0.82 1.00
1.11.2
1.4
1.61
Fcrd =154 MPa
8/14/2019 buckling mdes description
http://slidepdf.com/reader/full/buckling-mdes-description 39/40
Interaction buckling and postbuckling in the distortional mode of thin-walled sections
School of Civil EngineeringResearch Report No R870
38
TABLES
% Diffferencebetween 0.64t
and 0.15t
t (mm) A(mm 2 )
F y (MPa)
F crd (MPa)
P crd (kN)
Pu_II(kN)0.64t
Pu_OO(kN)0.64t
Pu_II(kN)0.15t
Pu_OO(kN)0.15t
(I-I) (O-O)Pu_II/
Py0.64t
Pu_OO/Py
0.64t
Pu_II/Py
0.15t
Pu_OO/Py
0.15t
6(9mm lip) 1308 700 2133 2790 832.5 812.4 901.6 891.2 7.66 8.84 0.910 0.887 0.985 0.973 -9.08 -1
3(9mm lip) 654 700 821.1 537.0 343.5 344.2 369.3 357.2 7.0 3.63 0.750 0.752 0.807 0.780 -8.08
2(9mm lip) 436 700 605.8 264.1 171.9 179.4 195.7 192.8 12.4 7.05 0.563 0.588 0.641 0.632 -20.84 -17
2(5mm lip) 420 700 333.5 140.1 155.2 166.4 157.0 167.9 1.13 0.86 0.528 0.566 0.534 0.571 -1.89 5
1(5mm lip) 210 700 154.2 32.38 46.24 49.31 46.79 49.91 1.17 1.21 0.314 0.335 0.318 0.340 -12.18 -6
Table 1 FEA distortional buckling results compared to design strength curves for distortional buckling

8/14/2019 buckling mdes description
http://slidepdf.com/reader/full/buckling-mdes-description 40/40
Interaction buckling and postbuckling in the distortional mode of thin-walled sections April 2006
Thickness F crl (MPa) P crl (kN)crd
crl
P
P Pu local (kN)
% difference wrtWinter strength
equation6 mm
(9 mm lip) 5347 6993.9 2.51 - -
3 mm(9 mm lip)
1420 928.7 1.73 428.0 -4.41
2 mm(9 mm lip) 649.9 283.3 1.07 235.6 1.67
2 mm(5 mm lip)
647.4 271.9 1.94 224.5 0.71
1 mm
(5 mm lip)163.6 34.36 1.06 67.94 6.98
Table 2 Local buckling stresses and ultimate loads