BTM 2014 - MBA Sem IV - Chapter 01A - Appendix 1.1 - Defining Corporate Underperformance
30
Appendix 1.1 Measuring and Benchmarking Organizational Underperformance Ozzie Mascarenhas S. J.; Ph.D. As we argued in Chapter One, in general, organizational underperformance occurs for various reasons within a company such as: No clear definition of vision and mission No timeless core values No enduring purpose Compromising standards for the sake of expediency, No well-planned long-term strategies Mostly ruled by short-term tactics to make quick money Short-term gains at the expense of long-term losses Heedless expansion into non-core business areas Over-diffusion of skills, expertise and talent No great innovations or market breakthroughs, No corporate social responsibility and No strong social mission and identity However, how can we translate the above qualitative criteria into measurable quantitative criteria so that turnaround managers can apply them to predict and control organizational underperformance in its very early stages? Corporate board members need, besides traditional financial data, new and reliable measures that address future performance. In addition, they need immediate response tools to help quickly cut through the welter of information to judge what is most valuable for making decisions. By instituting measurement systems aligned with their strategy and business model, organizations can help ensure that whatever performance measures are employed are measuring what is right for them. By linking measurement to strategy, leaders can identify and effect measures in light of a business's future direction, instead of simply its present status or past performance. By upgrading the quality and scope of performance measures, organizations can clarify and standardize internal and external messages, increasing transparency and enhancing corporate governance (Miller and Israel 2002). 80
-
Upload
kuladeepa-kr -
Category
Documents
-
view
218 -
download
2
description
sd
Transcript of BTM 2014 - MBA Sem IV - Chapter 01A - Appendix 1.1 - Defining Corporate Underperformance

Appendix 1.1 Measuring and Benchmarking Organizational
Underperformance Ozzie Mascarenhas S. J.; Ph.D.
As we argued in Chapter One, in general, organizational underperformance occurs for various reasons within a company such as:
No clear definition of vision and mission No timeless core values No enduring purpose Compromising standards for the sake of expediency, No well-planned long-term strategies Mostly ruled by short-term tactics to make quick money Short-term gains at the expense of long-term losses Heedless expansion into non-core business areas Over-diffusion of skills, expertise and talent No great innovations or market breakthroughs, No corporate social responsibility and No strong social mission and identity
However, how can we translate the above qualitative criteria into measurable quantitative criteria so that turnaround managers can apply them to predict and control organizational underperformance in its very early stages?
Corporate board members need, besides traditional financial data, new and reliable measures that address future performance. In addition, they need immediate response tools to help quickly cut through the welter of information to judge what is most valuable for making decisions. By instituting measurement systems aligned with their strategy and business model, organizations can help ensure that whatever performance measures are employed are measuring what is right for them. By linking measurement to strategy, leaders can identify and effect measures in light of a business's future direction, instead of simply its present status or past performance. By upgrading the quality and scope of performance measures, organizations can clarify and standardize internal and external messages, increasing transparency and enhancing corporate governance (Miller and Israel 2002).
Appendix 1.1 seeks to explore this question of assessing organizational underperformance. In order to do this, we do some “lateral benchmarking.” That is, we benchmark individual company’s performance by its own industry averages on several critical performance indicators.
Formulating Organizational Underperformance Criteria
We define organizational underperformance at several sequential operational and performance stages. Figure A.1.1.1 captures the value chain of the company along which we wish to formulate and define organizational performance-underperformance criteria. For illustration, we apply all metrics to the U. S. automotive companies listed in Fortune 500 of 2007 that produce vehicles and/or auto parts. We restrict our criteria or metrics as measurable by the annual survey data of U. S. Fortune 500 companies.
80
These data are readily available every year, and we propose simple but several criteria that turnaround scholars can use to assess the performance-underperformance of companies within a given industry.
As per the model suggested in Figure A.1.1, our first six criteria relate to employee inputs, namely, employee efficiency in driving sales revenues, corporate profits and market valuation.
Company Employee Underperformance for a given year occurs when:
1. A company’s performance measured by dollar sales revenue per employee is lower than the corresponding domestic industry average.
2. A company’s performance measured by dollar sales revenue per employee is lower than the corresponding domestic industry median.
3. A company’s performance measured by dollar profits per employee is lower than the corresponding domestic industry average.
4. A company’s performance measured by dollar profits per employee is lower than the corresponding domestic industry median.
5. A company’s performance measured by market valuation per employee is lower than the corresponding domestic industry average.
6. A company’s performance measured by market valuation per employee is lower than the corresponding domestic industry median.
Our next six criteria are outcome metrics that relate to sales revenue efficiency per dollar of assets employed, per dollar of equity invested, and profits that sales revenues generate.
Company Sales Revenue Underperformance for a given year occurs when:
7. A company’s performance measured by sales revenue per dollar of total company assets is lower than the corresponding domestic industry average.
8. A company’s performance measured by sales revenue per dollar of total company assets is lower than the corresponding domestic industry median.
9. A company’s performance measured by sales revenue per dollar of stockholders’ equity is lower than the corresponding domestic industry average.
10. A company’s performance measured by sales revenue per dollar of stockholders’ equity is lower than the corresponding domestic industry median.
11. A company’s performance measured by profits per dollar of sales revenue is lower than the corresponding domestic industry average.
12. A company’s performance measured by profits per dollar of sales revenue is lower than the corresponding domestic industry median.
We propose four complementary outcome metrics that relate to the efficiency of corporate profits per dollar of assets employed and per dollar of stockholders’ equity invested.
Corporate Profits and Equity Underperformance for a given year occurs when:
13. A company’s performance measured by dollar profits per dollar of company assets is lower than the corresponding domestic industry average.
14. A company’s performance measured by dollar profits per dollar of company assets is lower than the corresponding domestic industry median.
15. A company’s performance measured by dollar profits per dollar of stockholders’ equity is lower than the corresponding domestic industry average.
16. A company’s performance measured by dollar profits per dollar of stockholders’ equity is lower than the corresponding domestic industry median.
81
We next consider eight supplementary outcome metrics that relate to market valuation as seemingly generated by sales revenues reported, corporate profits generated, company assets employed and stockholders’ equity invested.
Corporate Market Valuation Underperformance for a given year occurs when:
17. A company’s performance measured by market valuation per dollar of sales revenue is lower than the corresponding domestic industry average.
18. A company’s performance measured by market valuation per dollar of sales revenue is lower than the corresponding domestic industry median.
19. A company’s performance measured by market valuation per dollar of profits is lower than the corresponding domestic industry average.
20. A company’s performance measured by market valuation per dollar of profits is lower than the corresponding domestic industry median.
21. A company’s performance measured by market valuation per dollar of company assets is lower than the corresponding domestic industry average.
22. A company’s performance measured by market valuation per dollar of company assets is lower than the corresponding domestic industry median.
23. A company’s performance measured by market valuation per dollar of stockholders’ equity is lower than the corresponding domestic industry average.
24. A company’s performance measured by market valuation per dollar of stockholders’ equity is lower than the corresponding domestic industry median.
Justification of Performance-Underperformance Criteria
We benchmark all twenty-four criteria by domestic industry averages or median performance. Since the motor vehicles and auto-parts company data are highly skewed, benchmarking by averages will be biased toward larger companies, and, therefore, unfavorable to smaller companies. Hence, alternately and additionally, we benchmark performance also by the median. Comparing absolute data (e.g., sales revenue, profits, stockholder equity, market valuation and the number of employees) across companies is meaningless since it will always favor the larger companies. Hence, every criterion is a ratio efficiency measure.
A company’s greatest assets are its employees, their talent and skills they bring to bear on their work,
which should translate into good production, good products, good sales, and, therefore, good profits and if the company is publicly traded, into enhanced stock value (measured by market valuation). Employee efficiency, therefore, is best measured by sales revenues generated per employee (criteria 1-2), profits generated per employee (criteria 3-4), and market valuation generated per employee (criteria 5-6). Market valuation reflects the stockholder value in the company. It is measured by the number of outstanding (common and preferred) stock shares multiplied by the average value of the stock on a given day (2/23/07 in our data).
We sequence our performance-underperformance criteria from one to twenty-four by the degree of managerial control the executives can exercise in corporate performance; that is, to the extent corporate managers can control the variables involved at each stage of the value chain . For instance, managers can develop and control employee skills, motivation and activities for generating sales revenues, profits and market valuation. Hence, we start with the employee efficiency criteria in relation to sales revenues, profits and market valuation (criteria 1-6).
82
A key assumption-mandate of criteria one to six is that employees that are responsible for the company’s R&D, production, new products and services in a given year should be assessed by the sales, profits and market valuation that these products and services generate.
The next most controllable variable for managers are sales revenues (e.g., via new products offerings, quality control, branding, pricing, packaging, bundling, promoting, advertising, convenient retailing and servicing), given the number of employees, company’s total assets and stockholders’ equity, such that sales generate profits and market valuation. Hence, we relate our next set of six criteria to sales revenue efficiency (criteria 7-12).
Mere increase in sales and profits does not indicate good performance, as this increase could be brought about, for instance, by easy credit policies giving customers significantly more time than usual to pay their bills or by increasing inventories to unusual levels in order to meet every customer’s request promptly (Hawawini and Viallet 2002: 141). Moreover, these activities increase a firm’s balance sheet through higher accounts receivable and augmented inventories. A larger balance sheet implies more capital has been deployed to finance the firm’s activities (such as easy consumer credit and expanded inventories). Since capital is costly, a larger balance sheet is not good for the firm. Hence, we need to examine the level of sales per dollar of assets employed (Criteria 7-8) and per dollar of stockholders’ equity used (criteria 9-10). Additionally, we measure sales efficiency by examining profits per dollar of sales (Criteria 11-12). Criteria 11-12 measure profit efficiency of sales – a measure that is closely related to ROS (return on sales). ROS measures the ability of managers to generate profits from the firm’s sales.
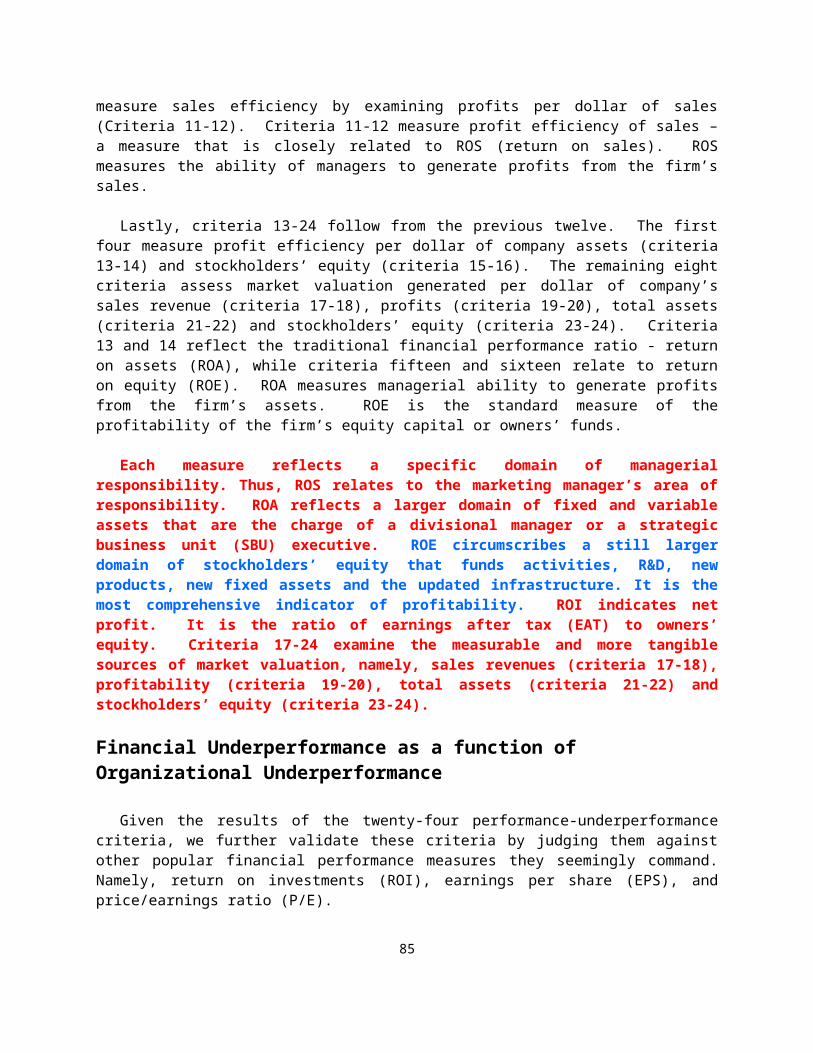
Lastly, criteria 13-24 follow from the previous twelve. The first four measure profit efficiency per dollar of company assets (criteria 13-14) and stockholders’ equity (criteria 15-16). The remaining eight criteria assess market valuation generated per dollar of company’s sales revenue (criteria 17-18), profits (criteria 19-20), total assets (criteria 21-22) and stockholders’ equity (criteria 23-24). Criteria 13 and 14 reflect the traditional financial performance ratio - return on assets (ROA), while criteria fifteen and sixteen relate to return on equity (ROE). ROA measures managerial ability to generate profits from the firm’s assets. ROE is the standard measure of the profitability of the firm’s equity capital or owners’ funds.
Each measure reflects a specific domain of managerial responsibility. Thus, ROS relates to the marketing manager’s area of responsibility. ROA reflects a larger domain of fixed and variable assets that are the charge of a divisional manager or a strategic business unit (SBU) executive. ROE circumscribes a still larger domain of stockholders’ equity that funds activities, R&D, new products, new fixed assets and the updated infrastructure. It is the most comprehensive indicator of profitability. ROI indicates net profit. It is the ratio of earnings after tax (EAT) to owners’ equity. Criteria 17-24 examine the measurable and more tangible sources of market valuation, namely, sales revenues (criteria 17-18), profitability (criteria 19-20), total assets (criteria 21-22) and stockholders’ equity (criteria 23-24).
Financial Underperformance as a function of Organizational Underperformance
Given the results of the twenty-four performance-underperformance criteria, we further validate these criteria by judging them against other popular financial performance measures they seemingly command. Namely, return on investments (ROI), earnings per share (EPS), and price/earnings ratio (P/E).
83
EPS is simply the firm’s earnings after tax (EAT) divided by its total number of outstanding shares. The numerator is an accounting data while the denominator is financial market data. Thus, EPS is no more than a “normalized” measure of the firm’s earnings after tax (Hawawini and Viallet 2002: 158). The price to earnings ratio (P/E), also known as the firm’s earning multiple, is share price divided by EPS. A higher P/E ratio means that investors in the market are assigning higher values to each dollar of current earnings per share (EPS) generated by the firm. That is, P/E indicates the level of investor confidence in the company.
Give our discussions on ROI, EPS and P/E ratios and following the pattern of criteria 1-24, we define the following financial underperformance measures.
Financial Underperformance for a given year occurs when:
25. A company’s financial performance measured by return on investment (ROI) is lower than the corresponding domestic industry average.
26. A company’s financial performance measured by ROI is lower than the corresponding domestic industry median.
27. A company’s financial performance measured by earnings per share (EPS) is lower than the corresponding domestic industry average.
28. A company’s financial performance measured by EPS is lower than the corresponding domestic industry median.
29. A company’s financial performance measured by price to earnings (P/E) ratio is lower than the corresponding domestic industry average.
30. A company’s financial performance measured by P/E is lower than the corresponding domestic industry median.
An Illustration of Metrics 1-30 using Automotive Data 2006
As an illustration, we study the organizational performance and underperformance of twenty-eight motor vehicles and auto-parts companies listed in Fortune 500 for 2007 (Fortune, April 30, 2007, F 64). Table A.1.1.1 has listed the required data by various categories involving the above 30 metrics. Unless otherwise noted, all figures are for the year ended on December 31, 2006.
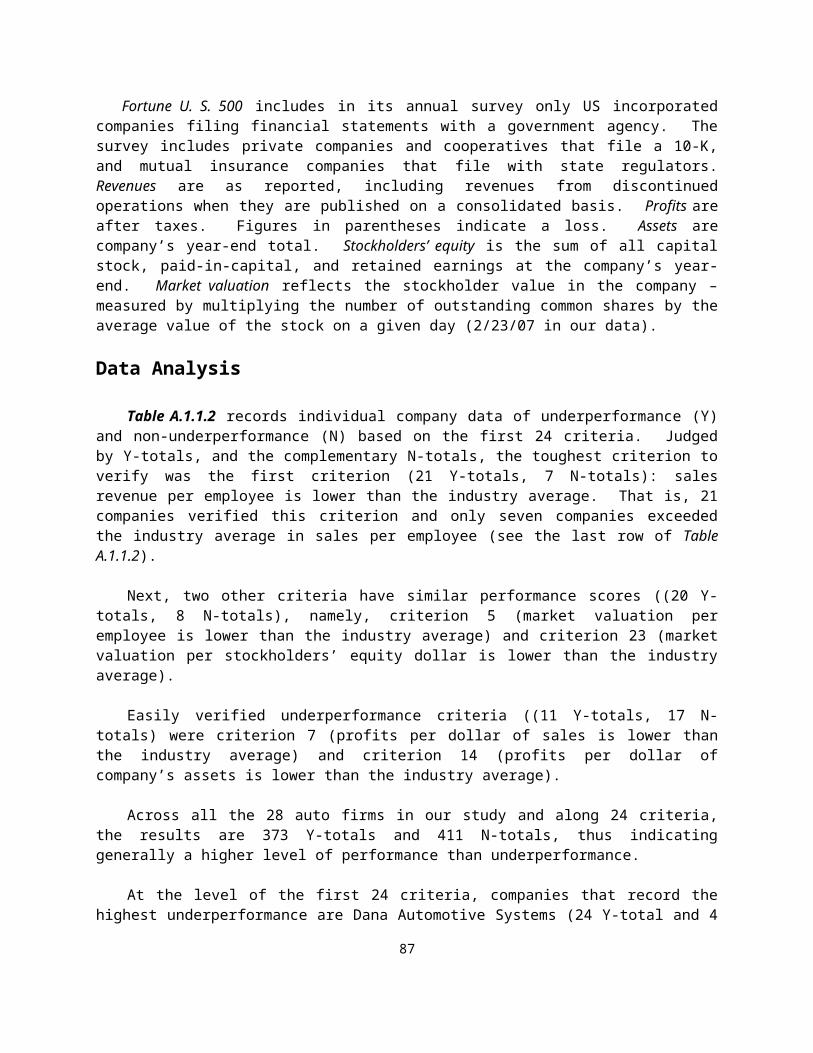
Fortune U. S. 500 includes in its annual survey only US incorporated companies filing financial statements with a government agency. The survey includes private companies and cooperatives that file a 10-K, and mutual insurance companies that file with state regulators. Revenues are as reported, including revenues from discontinued operations when they are published on a consolidated basis. Profits are after taxes. Figures in parentheses indicate a loss. Assets are company’s year-end total. Stockholders’ equity is the sum of all capital stock, paid-in-capital, and retained earnings at the company’s year-end. Market valuation reflects the stockholder value in the company – measured by multiplying the number of outstanding common shares by the average value of the stock on a given day (2/23/07 in our data).
Data Analysis
Table A.1.1.2 records individual company data of underperformance (Y) and non-underperformance (N) based on the first 24 criteria. Judged by Y-totals, and the complementary N-totals, the toughest criterion to verify was the first criterion (21 Y-totals, 7 N-totals): sales revenue per employee is lower than the industry average. That is, 21 companies verified this criterion and only seven companies exceeded the industry average in sales per employee (see the last row of Table A.1.1.2).
84
Next, two other criteria have similar performance scores ((20 Y-totals, 8 N-totals), namely, criterion 5 (market valuation per employee is lower than the industry average) and criterion 23 (market valuation per stockholders’ equity dollar is lower than the industry average).
Easily verified underperformance criteria ((11 Y-totals, 17 N-totals) were criterion 7 (profits per dollar of sales is lower than the industry average) and criterion 14 (profits per dollar of company’s assets is lower than the industry average).
Across all the 28 auto firms in our study and along 24 criteria, the results are 373 Y-totals and 411 N-totals, thus indicating generally a higher level of performance than underperformance.
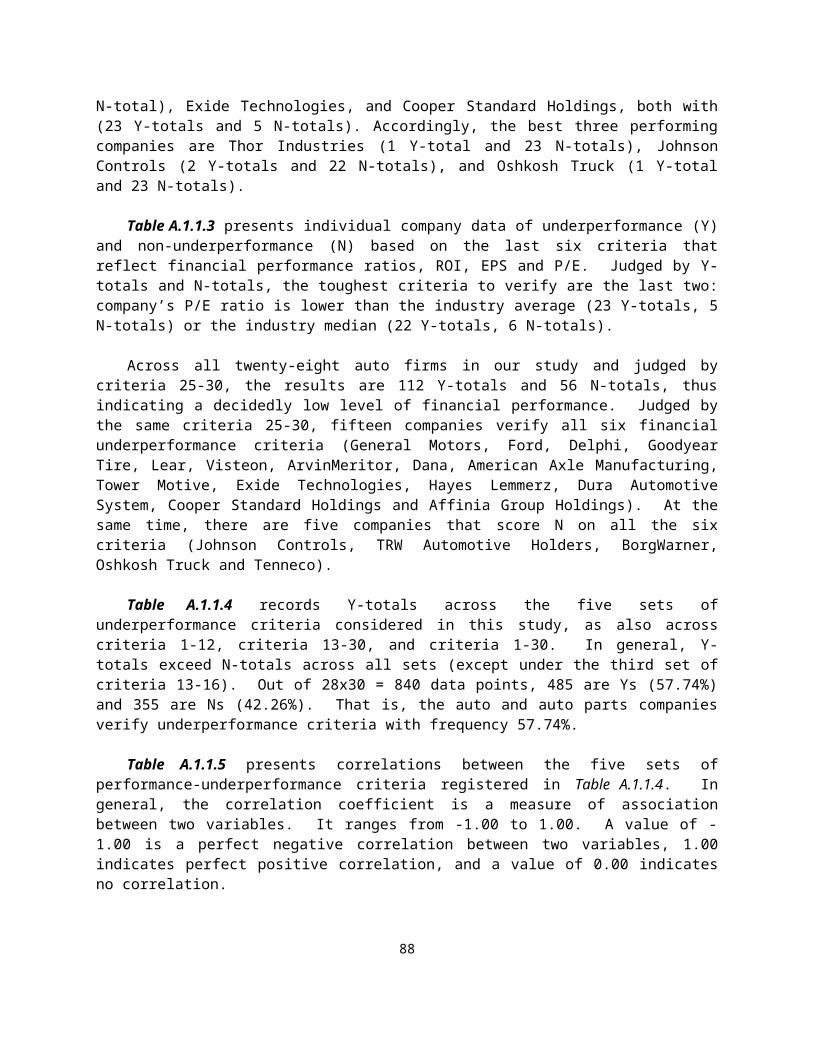
At the level of the first 24 criteria, companies that record the highest underperformance are Dana Automotive Systems (24 Y-total and 4 N-total), Exide Technologies, and Cooper Standard Holdings, both with (23 Y-totals and 5 N-totals). Accordingly, the best three performing companies are Thor Industries (1 Y-total and 23 N-totals), Johnson Controls (2 Y-totals and 22 N-totals), and Oshkosh Truck (1 Y-total and 23 N-totals).
Table A.1.1.3 presents individual company data of underperformance (Y) and non-underperformance (N) based on the last six criteria that reflect financial performance ratios, ROI, EPS and P/E. Judged by Y-totals and N-totals, the toughest criteria to verify are the last two: company’s P/E ratio is lower than the industry average (23 Y-totals, 5 N-totals) or the industry median (22 Y-totals, 6 N-totals).
Across all twenty-eight auto firms in our study and judged by criteria 25-30, the results are 112 Y-totals and 56 N-totals, thus indicating a decidedly low level of financial performance. Judged by the same criteria 25-30, fifteen companies verify all six financial underperformance criteria (General Motors, Ford, Delphi, Goodyear Tire, Lear, Visteon, ArvinMeritor, Dana, American Axle Manufacturing, Tower Motive, Exide Technologies, Hayes Lemmerz, Dura Automotive System, Cooper Standard Holdings and Affinia Group Holdings). At the same time, there are five companies that score N on all the six criteria (Johnson Controls, TRW Automotive Holders, BorgWarner, Oshkosh Truck and Tenneco).
Table A.1.1.4 records Y-totals across the five sets of underperformance criteria considered in this study, as also across criteria 1-12, criteria 13-30, and criteria 1-30. In general, Y-totals exceed N-totals across all sets (except under the third set of criteria 13-16). Out of 28x30 = 840 data points, 485 are Ys (57.74%) and 355 are Ns (42.26%). That is, the auto and auto parts companies verify underperformance criteria with frequency 57.74%.
Table A.1.1.5 presents correlations between the five sets of performance-underperformance criteria registered in Table A.1.1.4. In general, the correlation coefficient is a measure of association between two variables. It ranges from -1.00 to 1.00. A value of -1.00 is a perfect negative correlation between two variables, 1.00 indicates perfect positive correlation, and a value of 0.00 indicates no correlation.
85

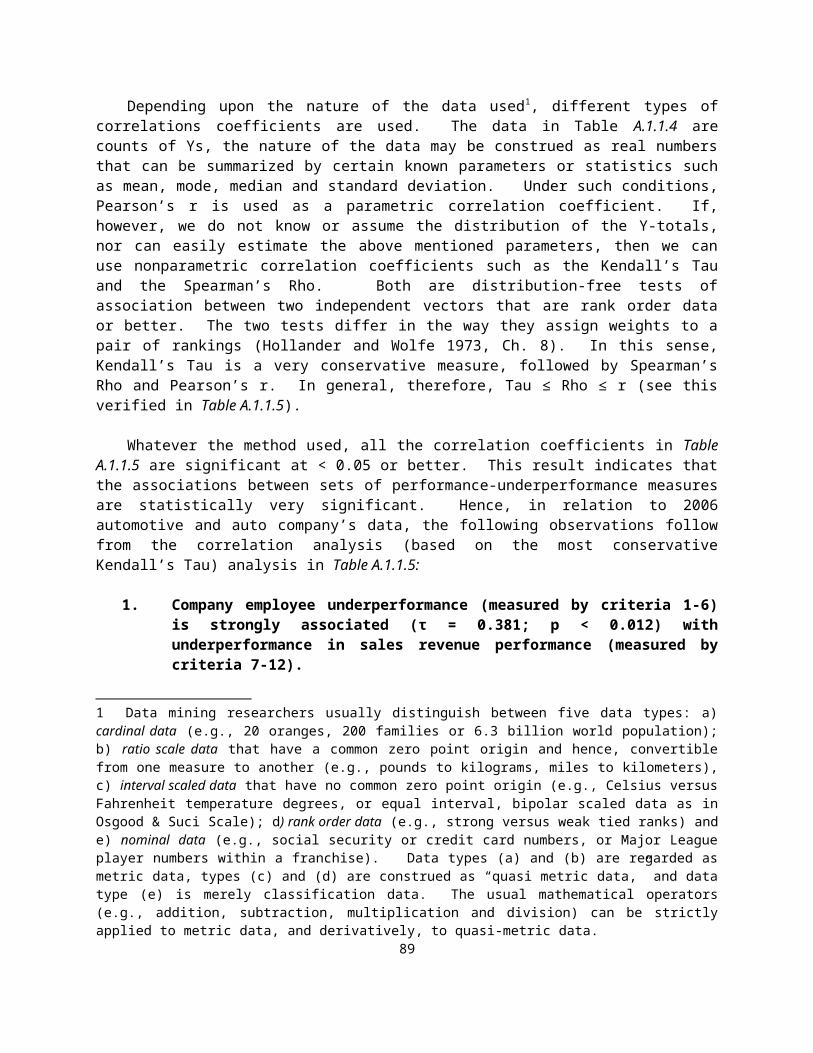
Depending upon the nature of the data used1, different types of correlations coefficients are used. The data in Table A.1.1.4 are counts of Ys, the nature of the data may be construed as real numbers that can be summarized by certain known parameters or statistics such as mean, mode, median and standard deviation. Under such conditions, Pearson’s r is used as a parametric correlation coefficient. If, however, we do not know or assume the distribution of the Y-totals, nor can easily estimate the above mentioned parameters, then we can use nonparametric correlation coefficients such as the Kendall’s Tau and the Spearman’s Rho. Both are distribution-free tests of association between two independent vectors that are rank order data or better. The two tests differ in the way they assign weights to a pair of rankings (Hollander and Wolfe 1973, Ch. 8). In this sense, Kendall’s Tau is a very conservative measure, followed by Spearman’s Rho and Pearson’s r. In general, therefore, Tau ≤ Rho ≤ r (see this verified in Table A.1.1.5).
Whatever the method used, all the correlation coefficients in Table A.1.1.5 are significant at < 0.05 or better. This result indicates that the associations between sets of performance-underperformance measures are statistically very significant. Hence, in relation to 2006 automotive and auto company’s data, the following observations follow from the correlation analysis (based on the most conservative Kendall’s Tau) analysis in Table A.1.1.5:
1. Company employee underperformance (measured by criteria 1-6) is strongly associated (τ = 0.381; p < 0.012) with underperformance in sales revenue performance (measured by criteria 7-12).
2. Company employee underperformance (measured by criteria 1-6) is strongly associated (τ = 0.690; p < 0.000) with underperformance in corporate profits (measured by criteria 13-16).
3. Company employee underperformance (measured by criteria 1-6) is strongly associated (τ = 0.792; p < 0.000) with underperformance in market valuation (measured by criteria 17-24).
4. Company employee underperformance (measured by criteria 1-6) is strongly associated (τ = 0.574; p < 0.000) with underperformance in financial ratios (measured by criteria 25-30).
5. Sales revenue underperformance (measured by criteria 7-12) is strongly associated (τ = 0.327; p < 0.036) with underperformance in corporate profits (measured by criteria 13-16).
6. Sales revenue underperformance (measured by criteria 7-12) is strongly associated (τ = 0.392; p < 0.010) with underperformance in market valuation (measured by criteria 17-24).
1 Data mining researchers usually distinguish between five data types: a) cardinal data (e.g., 20 oranges, 200 families or 6.3 billion world population); b) ratio scale data that have a common zero point origin and hence, convertible from one measure to another (e.g., pounds to kilograms, miles to kilometers), c) interval scaled data that have no common zero point origin (e.g., Celsius versus Fahrenheit temperature degrees, or equal interval, bipolar scaled data as in Osgood & Suci Scale); d) rank order data (e.g., strong versus weak tied ranks) and e) nominal data (e.g., social security or credit card numbers, or Major League player numbers within a franchise). Data types (a) and (b) are regarded as metric data, types (c) and (d) are construed as “quasi metric data,” and data type (e) is merely classification data. The usual mathematical operators (e.g., addition, subtraction, multiplication and division) can be strictly applied to metric data, and derivatively, to quasi-metric data.
86
7. Sales revenue underperformance (measured by criteria 7-12) is strongly associated (τ = 0.341; p < 0.031) with underperformance in financial performance (measured by criteria 25-30).
8. Corporate profits underperformance (measured by criteria 13-16) is strongly associated (τ = 0.595; p < 0.000) with underperformance in market valuation (measured by criteria 17-24).
9. Corporate profits underperformance (measured by criteria 13-16) is strongly associated (τ = 0.684; p < 0.000) with underperformance in financial performance (measured by criteria 25-30).
10. Lastly, underperformance in market valuation (measured by criteria 17-24) is strongly associated (τ = 0.663; p < 0.000) with underperformance in financial performance (measured by criteria 25-30).
Results (1) to (10) based on correlation analysis indirectly establish reliability, face validity and nomological validity of our sets of underperformance criteria (see Churchill 1979; Churchill and Peter 1984; Peter 1981), 2
Concluding Remarks
Performance measurements help improve governance and accountability to stakeholders. This approach can help to convert measurement information into specific beneficial actions. For measurement to offer a competitive advantage, it needs to be regarded as a core organizational process consisting of many sub-processes: interrelationships among strategies and risks; measures, measurement objectives and measurement framework; and alignment, infrastructure, monitoring, reporting, and continuous improvement. Tying Measurement to Strategies and Risks: By linking measurement to strategy, leaders can identify and effect measures in light of a business's future direction (leading indicators), instead of simply its present status (concurrent indicators) or past performance (lagging indicators). This distinguishing feature is crucial as organizations look to modify rapidly their business models and strategies (Miller and Israel 2002).
Table A.1.1.6 presents rank order data on the 28 automotive and auto parts companies based on criteria 1-12, criteria 13-30, and criteria 1-30. Using the last comprehensive measure of underperformance, namely, criteria 1-30, Table A.1.1.6 also features the high performance versus low performance companies by ranks. As expected, the top five performance companies are Johnson Controls, Oshkosh Truck, Tenneco, Thor Industries and Carlisle. The five worst performance companies are Hayes Lemmerz, Dura Automotive System, Exide Technologies, Dana, and Lear. Several of the companies below the rank median are currently struggling, and some have sought bankruptcy protection,
2 Validity, in general, seeks to establish if a given measure measures what it intends to measure. Validity can be established in various ways: a) Analogical validity also called lateral benchmarking (e.g., the measure can be derived from similar concepts in other related fields; e.g., consumer satisfaction measures from parallel measures such as patient satisfaction scales or automobile satisfaction measures, and vice versa); b) Nomological validity relates to strong association between conceptually similar measures (such as our five sets of underperformance criteria); c) Discriminant validity (e.g., the measure discriminates between known demographic or ethnic groups); d) Convergent validity (e.g., different but related measures obtain similar scores) and face validity which indicates that the measure has intuitive appeal of being objective, comprehensive and believable (see Peter 1981).
87
as indicated in Table A.1.1.6. Thus, turnaround executives may also use the 1-30 underperformance metrics for predicting corporate bankruptcy.
Column 2 lists Fortune 1000 ranks for 2006 and 2005. Of the 28 companies listed, only six have improved in ranks from 2005 to 2006 (Johnson Controls from rank 75 to 67, Paccar from 157 to 141, Oshkosh Truck from 625 to 584, Thor Industries from 677 to 643, Cooper Tire from 770 to 701 and Modine Manufacturing from 948 to 944). Three companies have maintained the same ranks from 2005 to 2006 (GMC, Cooper Standard Holdings and Affinia Group Holdings). The remaining 15 companies have lost Fortune 1000 ranks in 2006 compared with 2005 ranks. The worst loss is by Visteon who lost 2006 sales revenues by 33 percent from 2005 and hence, plummeted from rank 128 in 2005 to rank 219 in 2006. Tower Automotive lost sales revenues by 12 percent and slipped from rank 551 in 2005 to rank 668 in 2006. Ford reported a decrease of ten percent in sales from 2005, and a corresponding rank of seven in 2006 from rank five in 2005. In total, 10 out of 28 companies (41.67%) report loss in sales for 2006 compared to 2005. These facts support rankings in Table A.1.1.6.
From a profit performance view, 18 out of 24 companies report negative profits, the worst being Ford with a loss of $12.613 billion, followed by Delphi that lost $5.464 billion, and GMC that recorded a loss of $1.978 billion. The 28 companies together lost a total of $20.78 billion in profits in 2006, with a mean of $-0.74 billion (SD = 2.61) and a median of $- 0.121 billion. These facts also support rankings in Table A.1.1.6. In general, judged by 18 out of 24 companies (75%) with negative profits, 9 out of 24 companies (37.5%) with loss in sales, and 15 out of 24 companies (62.5%) losing Fortune 1000 ranks, we could conclude that, largely, the automotive companies have underperformed in 2006 compared to 2005. The results of Table A.1.1.6 are based on thirty ratio criteria, while the Fortune 500 rankings are based on absolute sales data.
Other performance measures worth looking at are: inventory to sales, receivables to sales, payables to sales, sales to net fixed assets, sales to working capital requirements (WCR), and operating margins. Similarly, one could study inventory to profits, receivables to profits, payables to profits, net fixed assets to profits, and profits to WCR.
88
References
Churchill, Gilbert A., Jr. (1979), "A Paradigm for Developing better Measures of Marketing Constructs," Journal of Marketing Research, 16 (February), 64-73.
______ and J. Paul Peter (1984), "Research Design Effects on the Reliability of Rating Scales: A Meta-Analysis," Journal of Marketing Research, 21 (November) 360-75.
Hawawini, Gabriel and Claude Viallet (2002), Finance for Executive: Managing for Value Creation, 2nd
edition. South-Western: Thompson Learning.
Hollander, Myles and Wolfe Douglas A. (1973), Nonparametric Statistical Methods, New York, NY: John Wiley & Sons.
Horngren, Charles T., Gary L. Sundem, and John A. Elliott (2002), Introduction to Financial Accounting, 8th edition, Upper Saddle River, NJ: Prentice-Hall.
Miller, Jack and Eric Israel (2002),”Improving corporate performance measures to drive results,” Financial Executive, 18:5, (Jul/Aug), 51-53.
Peter, Paul J. (1981), "Construct Validity: A Review of Basic Issues and Marketing Practices," Journal of Marketing Research, 18 (May), 133-145.
89
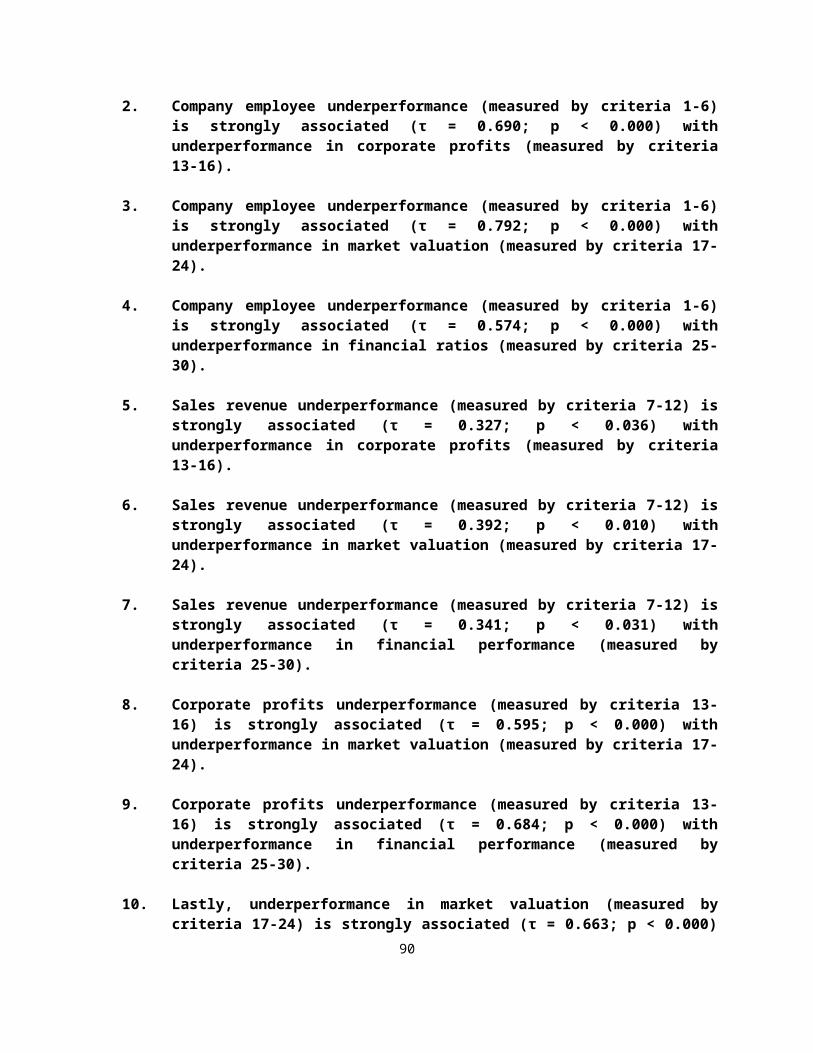
Figure A.1.1: Modeling Performance-Underperformance Measurement Along a Company’s Value Chain
EmployeesSkills, talentTraining
R&DProductionNew Product DevelopmentMarket Offerings
RevenueEarnings
Corporate Profits
MarketValuation
Financial Ratios: ROI, EPS, P/E
Assets and Technology
Stockholders’ Equity
Corporate Performance-Underperformance Metrics
Metrics 1-6 Metrics 7-12 Metrics 13-16 Metrics 17-24 Metrics 25-30
90

Table A.1.1.1: Data on Motor Vehicles and Auto-parts Companies for 2006
Company Data, 2006 Rank -2005, 2006
Annual Sales($B)
% Δ from 2005
Profits($B)
No. of Emplo-
yees
Assets($B)
Stock($B)
M.V.($B)
1 General Motors 3, 3 192.60 8 -10.6 280000 475.284 16.734 11.9492 Ford Motor 4, 5 177.21 -10 2.024 283000 269.476 12.957 14.5583 Johnson Controls 71, 75 28.019 16 0.909 136000 16.144 6.058 14.7494 Delphi 63, 77 27,201 -2 -6.369 171400 17.21 -5.314 0.27535 Goodyear Tire 120, 112 19.723 3 0.228 77000 15.627 0.073 2.4316 Lear 127, 127 17.089 4 -1.381 104000 8.288 1.111 1.097 Paccar 188, 157 14.057 17 1.133 21000 13.715 3.901 12.0268 TRW Automotive
Holders178, 179 12.643 4 0.204 63800 10.23 1.208 2.441
9 Visteon 118, 128 16.976 -33 -0.27 45000 6.736 -0.048 0.57610 Arvinmeritor 244, 242 9.816 0 0.012 27500 5.87 0.875 1.05111 Dana 201, 234 10.092 -2 -1.379 45000 7.877 1.057 0.29312 Federal Mogul 326, 345 6.286 1 -0.334 43100 7.735 -2.433 0.03113 Autoliv 329, 351 6.204 -1 0.292 38750 5.065 2.316 4.84814 Tenneco 453, 463 4.441 5 0.058 19000 2.94 0.129 0.9515 BorgWarner 506, 475 4.293 7 0.239 17400 4.089 1.644 3.35816 Oshkosh Truck 692, 625 2.959 16 0.16 9387 1.718 0.818 4.30217 American Axle & Mfg. 501, 556 3.387 -6 0.056 10000 2.666 0.994 0.82818 Thor Industries 716, 677 2.558 20 0.121 9363 0.857 0.597 2.92219 Tower Automotive 570, 551 3.443 -12 -0.832 11850 2.321 -0.44 0.00420 Exide Technologies 643, 651 2.69 5 1.281 13982 2.29 0.427 0.05821 Carlisle 654, 680 2.55 8 0.106 11577 1.563 0.73 2.3422 Cooper Tire & Rubber 470, 770 2.155 24 -0.009 13361 2.152 0.938 0.90523 Fleetwood Enterprises 626, 662 2.623 -4 -0.161 11500 1.01 0.125 0.66524 Hayes Lemmerz 718, 710 2.405 -4 -0.131 10500 2.272 0.549 0.08225 Dura Automotive
System646, 728 2.344 -6 0.001 15800 2.075 0.339 0.042
26 Cooper Standard Holdings
N.A, 814 2.164 18 -0.008 16266 1.911 0 0
27 Affinia Group Holdings N.A, 816 2.16 1 -0.005 10497 1.381 0 028 Modine Manufacturing N.A, 948 1.543 11 0.061 7896 1.152 0.659 0.974
Total 27753.4 88 -14.594 1523929 889.654 46.004 83.74Mean 991.19 3.142 -0.521 54426.04 31.773 1.643 2.991Std Dev 5136.85 11.651 2.420 75855.77 100.315 4.1976 4.52Maximum 27201 24 2.024 283000 475.284 16.734 14.749Minimum 1.543 -33 -10.6 7896 0.857 -5.314 0Median 4.367 3.5 0.034 18200 3.515 0.695 0.962
91

Table A.1.1.2: Assessing Corporate Underperformance of Automotive Companies by Metrics 1-24
(Data: Fortune 500 Survey Data for Year Ending December 31, 2006)
Company
by #s
Corporate Underperformance Criteria Verified (Y = yes; N = No) Y- Totals1-24
1 2 3 4 5 6 7 8 9 10 11
12 13 14 15 16 17 18 19 20 21 22 23 24
1 N N Y Y Y N N N Y Y N N Y N Y N N Y Y Y Y Y Y Y 14
2 N N Y Y Y N Y Y Y Y N N Y Y Y Y Y Y Y Y Y Y Y N 18
3 Y N N N N N N N N N Y N N N N N N N N N N N N N 2
4 Y Y Y Y Y Y Y Y Y N Y Y N N Y Y Y Y Y N Y Y Y Y 20
5 Y N N N Y Y N Y Y N N N Y Y N N Y N Y Y Y Y N N 12
6 Y Y Y Y Y Y Y Y N N N N Y Y Y Y Y Y Y Y Y Y Y Y 20
7 N N N N N N N N Y Y Y Y N N N N N N N N N N N N 4
8 Y Y N N Y N N N Y N N N N N N N Y N N N Y N Y Y 8
9 Y N N N Y Y Y Y Y Y Y Y N N N Y Y Y Y Y Y Y Y Y 18
10 N N Y Y Y Y N Y N N N N Y Y Y Y Y Y Y Y Y N Y N 15
11 Y Y Y Y Y Y Y Y Y Y N N Y Y Y Y Y Y Y Y Y Y Y Y 22
12 Y Y Y Y Y Y Y Y Y Y Y Y N N Y Y Y Y Y Y Y Y Y Y 22
13 Y Y N N N N N N Y Y Y Y N N N N N N N N N N Y N 7
14 Y N N N Y N N N N N N N N N N N Y N N N Y N N N 4
15 Y N N N N N N N Y Y Y Y N N N N N N N N N N Y N 6
16 N N N N N N N N N N Y Y N N N N N N N N N N N N 2
17 N N Y Y Y N Y Y Y Y Y Y Y Y Y Y Y Y Y Y Y N Y Y 20
18 N N N N N N N N N N Y N N N N N N N N N N N N N 1
19 Y N Y Y Y Y Y Y Y Y Y Y N N Y Y Y Y Y N Y Y Y Y 20
20 Y Y Y Y Y Y Y Y Y Y Y N Y Y Y Y Y Y Y Y Y Y Y Y 23
21 Y N N N N N N N N N Y Y N N N N N N N N N N N N 3
22 Y Y Y Y Y Y N Y Y N Y Y Y N Y Y N N Y Y Y N Y Y 18
23 Y Y N N Y N N N N N N N Y Y N Y Y N Y Y N N N N 9
24 Y Y Y Y Y Y Y Y Y Y Y Y Y Y Y Y Y Y Y Y Y Y Y Y 24
25 Y Y Y Y Y Y Y Y Y Y Y Y N Y Y Y Y Y Y Y Y Y Y Y 23
26 Y Y N N Y Y N N Y Y Y Y Y Y N N Y Y Y N Y Y Y Y 17
27 Y Y N N Y Y N N N N Y Y Y N N Y Y Y N Y Y Y Y Y 15
28 Y Y N N N N N N N N Y Y Y N N N N N N N N N Y N 621 14 13 13 20 14 11 14 18 14 19 12 14 11 13 15 18 16 17 15 19 14 20 15 373
92

Y Totals
93

Table A.1.1.3: Assessing Corporate Underperformance of Automotive Companies by Metrics 25-30
(Data: Fortune 500 Survey Data for Year Ending December 31, 2006)
# CompanyROI (%) EPS
P/E Ratio
Financial Underperformance Criteria verified (Y=Yes; N=No)
Y-Totals25-30
25 26 27 28 29 301 General Motors -6.4 -4.17 n/a Y Y Y Y Y Y 6
2 Ford Motor -7 -6.07 n/a Y Y Y Y Y Y 6
3 Johnson Controls 9.6 5.53 18.84 N N N N N N 0
4 Delphi n/a -9.73 n/a Y Y Y Y Y Y 6
5 Goodyear Tire -10.9 -3.24 n/a Y Y Y Y Y Y 6
6 Lear -22.2 -9.94 n/a Y Y Y Y Y Y 6
7 Paccar 19.8 6.06 14.13 N N N N Y Y 2
8TRW Automotive Holders 0.8 0.39 103.5 N N N N
N N 0
9 Visteon -16.9 -2.55 n/a Y Y Y Y Y Y 6
10 Arvinmeritor -15.6 -4.7 n/a Y Y Y Y Y Y 6
11 Dana n/a n/a -25.00 Y Y Y Y Y Y 6
12 Federal Mogul 27.7 -5.34 n/a N N Y Y Y Y 4
13 Autoliv 11.2 4.67 12.08 N N N N Y Y 2
14 Tenneco 3 1.03 29.39 N N N N N N 0
15 BorgWarner 8.2 3.59 22.65 N N N N N N 0
16 Oshkosh Truck 4.7 2.61 22.92 N N N N N N 0
17 American Axle & Mfg. -13 -4.3 n/a Y Y Y Y Y Y 6
18 Thor Industries 23.6 2.85 14.11 N N N N Y Y 2
19 Tower Automotive -41.00 Y Y Y Y Y Y 6
20 Exide Technologies -16.6 -5.9 n/a Y Y Y Y Y Y 6
21 Carlisle 16.5 3.39 15.3 N N N N Y Y 2
22 Cooper Tire & Rubber -4.4 -0.85 n/a Y Y N Y Y Y 5
23 Fleetwood Enterprises -12.7 -0.76 n/a Y Y N N Y Y 4
24 Hayes Lemmerz -21.9 -4.36 n/a Y Y Y Y Y Y 6
25 Dura Automotive System n/a n/a n/a Y Y Y Y Y Y 6
26Cooper Standard Holdings n/a n/a n/a Y Y Y Y
Y Y 6
27 Affinia Group Holdings n/a n/a n/a Y Y Y Y Y Y 6
28 Modine Manufacturing 5.8 1.31 17.7 N N N N Y N 1Total (Y-Totals) -16.6 -30.48 234.62 17 17* 16 17* 23 22* 112Mean -0.754 -1.234 19.55 4.000Std Dev 14.90 4.67 30.48 2.426Maximum 27.70 6.06 103.5 6.00Minimum -22.2 -9.94 -25.00 0.00Median -1.80 -0.850 16.50 6.00
* Technically speaking, these column totals should be exactly 14 since the median is the dividing benchmark for this criterion. Given many missing variables, however, that are automatically estimated as mean of that column, and given that the median is calculated independent of the missing variables, the median criterion tends to overestimate the Ys and approximates the mean criterion.
94
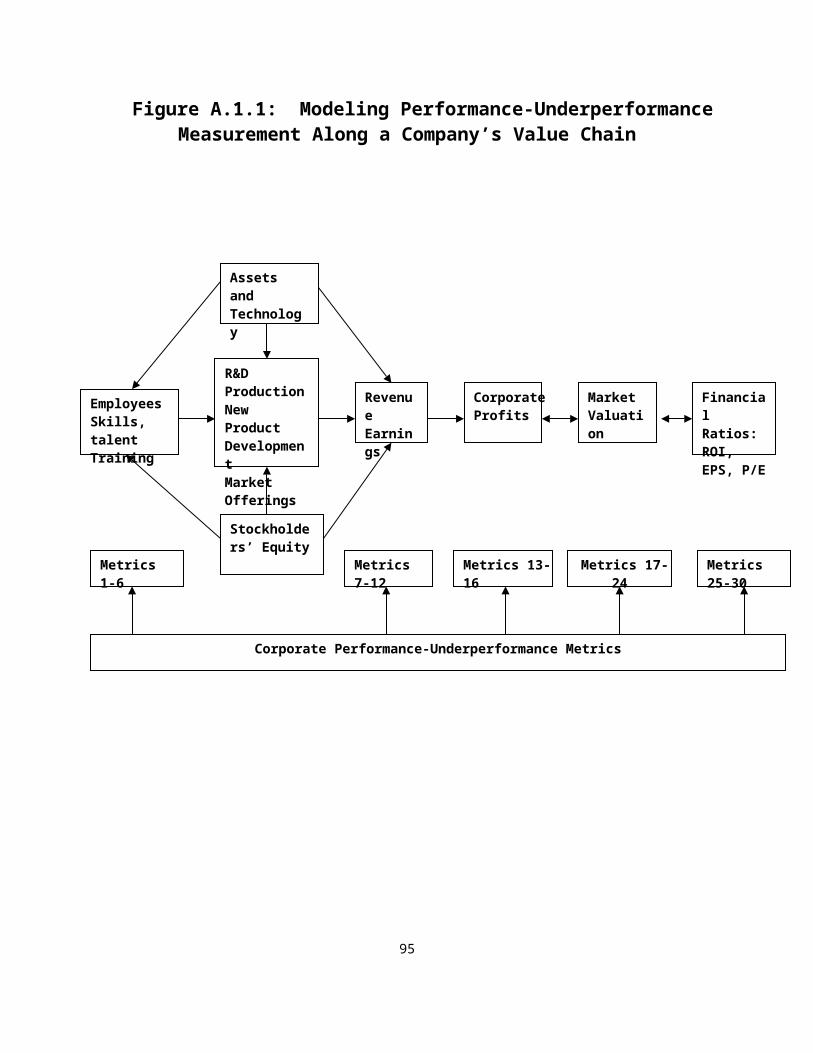
Table A.1.1.4: Performance-Underperformance Data of Motor Vehicles and Auto-parts Companies for 2006
# Automotive or Auto-parts Company
Y-Totals of Criteria Numbers: Y-Totals along Criteria:
1-6 7-12 13-16 17-24 25-30
1-12 13-30 1-30
1 General Motors 3 2 1 8 6 5 15 202 Ford Motor 3 4 4 7 6 7 17 243 Johnson Controls 1 1 0 0 0 2 0 24 Delphi 6 4 2 7 6 10 15 255 Goodyear Tire 3 2 2 5 6 5 13 186 Lear 6 2 4 8 6 8 18 267 Paccar 0 4 0 0 2 4 2 68 TRW Automotive
Holders 3 2 0 3 0 5 3 89 Visteon 3 3 1 8 6 6 15 2110 Arvinmeritor 4 1 4 6 6 5 16 2111 Dana 6 4 4 8 6 10 18 2812 Federal Mogul 6 6 2 8 4 12 14 2613 Autoliv 2 4 0 1 2 6 3 914 Tenneco 2 0 0 1 0 2 1 315 BorgWarner 1 4 0 1 0 5 1 616 Oshkosh Truck 0 2 0 0 0 2 0 217 American Axle & Mfg. 3 6 4 6 6 9 16 2518 Thor Industries 0 1 0 0 2 1 2 319 Tower Automotive 5 6 2 7 6 11 15 2620 Exide Technologies 6 5 4 8 6 11 18 2921 Carlisle 1 2 0 0 2 3 2 522 Cooper Tire & Rubber 5 3 3 5 5 8 13 2123 Fleetwood Enterprises 3 0 3 3 4 3 10 1324 Hayes Lemmerz 6 6 4 8 6 12 18 3025 Dura Automotive
System 6 5 4 8 6 11 18 2926 Cooper Standard
Holdings 4 4 2 7 6 8 15 2327 Affinia Group Holdings 4 2 2 7 6 6 15 2128 Modine Manufacturing 2 2 1 1 1 4 3 7
1-28 Y-Totals 94 87 53 130 121 181 304 485
1-28 N-Totals 74 81 59 94 47 155 200 355
95
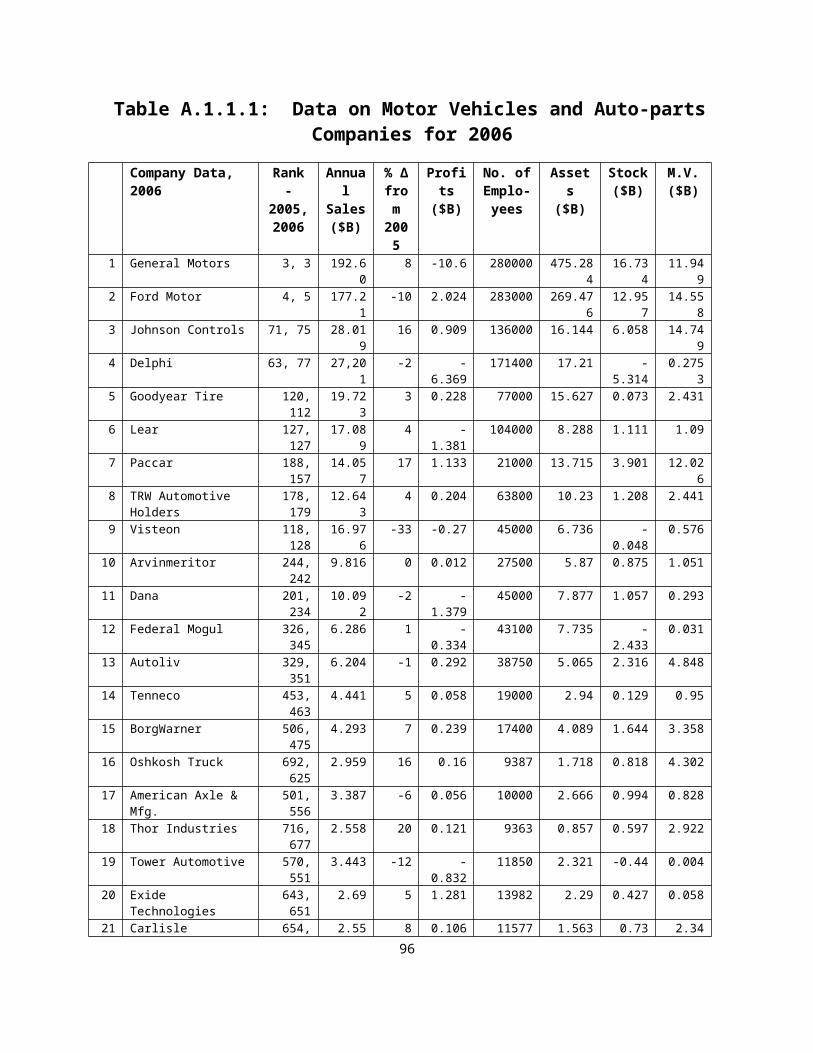
Table A.1.1.5: Correlation Coefficients among sets of Organizational Performance-Underperformance Criteria
Criteria Numbers
Performance-Underperformance Criteria Numbers:1-6 7-12 13-16 17-24 25-30
Pearson’s r:
1-6 1.000 0.4040.008*
0.7750.000
0.8740.000
0.7390.002
7-12 1.000 0.3900.040
0.5000.007
0.4200.026
13-16 1.000 0.7670.000
0.8010.000
17-24 1.000 0.8960.000
25-30 1.000
Kendall’s Tau:1-6 1.000 0.381
0.012*0.6900.000
0.7920.000
0.5740.000
7-12 1.000 0.3270.036
0.3920.010
0.3410.031
13-16 1.000 0.5950.000
0.6840.000
17-24 1.000 0.6630.000
25-30 1.000
Spearman’s Rho:1-6 1.000 0.482
0.008*0.7980.000
0.8710.000
0.7230.000
7-12 1.000 0.3970.037
0.5060.006
0.4200.026
13-16 1.000 0.7310.000
0.7960.000
17-24 1.000 0.8050.000
25-30 1.000
* The second figure under each correlation coefficient is its two-tailed statistical significance (df =27).
96

Table A.1.1.6: Performance Rank of Motor Vehicles and Auto-parts Companies for 2006
# Automotive or Auto-parts Company
Ranks Based on Y-Totals of Criteria
Numbers:
Ordered Rank
Based onMetrics
1-30
Automotive orAuto-parts Company re-listed
by Performance Rank
Filed for Bank-ruptcy
1-12 13-30 1-30
1 General Motors 11 17.5 13 1.5 Johnson Controls2 Ford Motor 17 23 19 1.5 Oshkosh Truck3 Johnson Controls 3 1.5 1.5 3.5 Tenneco4 Delphi 22.5 17.5 20.5 3.5 Thor Industries5 Goodyear Tire 11 12.5 12 5.0 Carlisle6 Lear 19 26 23 6.5 Paccar7 Paccar 7.5 6 6.5 6.5 BorgWarner 8 TRW Automotive Holders 11 9 9 8.0 Modine Manufacturing9 Visteon 15 17.5 15.5 9.0 TRW Automotive Holders
10 Arvinmeritor 11 21.5 15.5 10.0 Autoliv11 Dana 22.5 26 25 11.0 Fleetwood Enterprises 12 Federal Mogul 27.5 14 23 12.0 Goodyear Tire13 Autoliv 15 9 10 13.0 General Motors. ?14 Tenneco 3 3.5 3.5 15.5 Cooper Tire & Rubber ?15 BorgWarner 11 3.5 6.5 15.5 Affinia Group Holdings 16 Oshkosh Truck 3 1.5 1.5 15.5 Visteon 05/01/0517 American Axle & Mfg. 21 21.5 20.5 15.5 ArvinMeritor18 Thor Industries 1 6 3.5 18.0 Cooper Standard Holdings ?19 Tower Automotive 25 17.5 23 19.0 Ford Motor ?20 Exide Technologies 25 26 26.5 20.5 Delphi 10/17/0521 Carlisle 5.5 6 5 20.5 American Axle & Mfg22 Cooper Tire & Rubber 19 12.5 15.5 23.0 Tower Automotive23 Fleetwood Enterprises 5.5 11 11 23.0 Federal Mogul24 Hayes Lemmerz 27.5 26 28 23.0 Lear 01/01/0625 Dura Automotive System 25 26 26.5 25.0 Dana 03/01/0626 Cooper Standard Holdings 19 17.5 18 26.5 Exide Technologies27 Affinia Group Holdings 15 17.5 15.5 26.5 Dura Automotive System28 Modine Manufacturing 7.5 9 8 28.0 Hayes Lemmerz 12/06/01*
* The company emerged from bankruptcy in 2003, but apparently, it did not positively affect its underperformance.
97

Turnaround Executive Exercises
A.1.1.1: Continue the analysis of organizational underperformance as presented in Appendix A.1.1 by doing the following:
a) Identify the foreign auto vehicles and auto parts companies and their performance data for 2006 as per Table A.1.1 (e.g., see Fortune Global 500 for 2007 for a list of these companies).
b) Apply the 30 organizational performance-underperformance criteria to these foreign auto companies and present results as in Tables A.1.1.2, A.1.1.3 and A.1.1.4.
c) Investigate the validity (face and nomological) of your criteria scores via correlation analysis and report results as per Table A.1.1.5.
d) Given your analysis under (b) and (c), rank-order the foreign companies by their performance. Research if some of the worst underperformers have filed for bankruptcy during the last five to six years.
e) Next, combine data in (a) with data of domestic auto companies in Table A.1.1 and re-do exercises (b), (c) and (d) on the combined sample of domestic and foreign auto companies.
f) Examine the patterns of Y-totals and N-totals in: 1) the domestic companies, 2) the foreign companies, and 3) the combined set of domestic and foreign companies. Which performance-underperformance criteria significantly separate the domestic from the foreign auto companies, and why? Hence, what do you conclude?
g) Study the global performance-underperformance ranks of the combined set of auto companies. Which companies under-perform worst, along which criteria, and why?
h) Which companies report high performance, by which criteria, and why?i) Based on findings from (a) to (h), what strategies would you recommend for improving organizational
performance among domestic companies, and why?
A.1.1.2: Study the organizational performance-underperformance of the forty-nine U. S. Gas and Electric companies listed in Fortune 500, April 30, 2007, F-71.
a) Collect their performance data for 2006 on sales revenue, Fortune 500 ranks for 2006 versus 2007, profits, company’s total assets, stockholders’ equity, number of employees and market valuation, and derive descriptive parameters of each variable in terms of mean, mode, median, standard deviation, maximum, minimum, and range.
b) Next, apply the 30 organizational performance-underperformance criteria to these companies and present results as in Tables A.1.1.2, A.1.1.3 and A.1.1.4.
c) Investigate the validity (face and nomological) of your criteria scores via correlation analysis and report results as per Table A.1.1.5.
d) Given your analysis under (b) and (c), rank-order these companies by their performance. Research if some of the worst underperformers have filed for bankruptcy during the last five to six years.
e) Next, identify the foreign gas and electric companies and their performance data for 2006 as per Table A.1.1.1 (e.g., see Fortune Global 500 for 2007 for a list of these companies).
f) Execute steps (b) to (d) on these foreign companies.g) Next, consolidate data in (a) with (e) and re-do exercises (b), (c) and (d) on the combined sample of
domestic and foreign auto companies.h) Examine the patterns of Y-totals and N-totals in: 1) the domestic companies, 2) the foreign companies, and
3) the combined set of domestic and foreign companies. Which performance-underperformance criteria significantly separate the domestic from the foreign gas and electric companies, and why? Hence, what do you conclude?
i) Study the global performance-underperformance ranks of the combined set of gas and electric companies. Which companies under-perform worst, along which criteria, and why?
j) Which companies register higher performance, along which criteria, and why?k) Based on findings from (a) to (j), what strategies would you recommend for improving organizational
performance among domestic gas and electric companies, and why?
98