BTE Publication Summary - Regional economics · PDF file · 2011-09-28BTE...
174
BTE Publication Summary Date Search Results Print Subject Series A to Z Exit GO BACK Transportation of the Australian Wheat Harvest Report The production and export of wheat is important for Australia and its storage and transport represents a significant load on domestic resources. This report presents the results of a study of the costs of transporting the wheat harvest from the production areas to the ports in order to meet both domestic and international demand.
Transcript of BTE Publication Summary - Regional economics · PDF file · 2011-09-28BTE...

BTE Publicat ion Summary
Date
Search
Results
Subject
Series
A to Z
Exit
GO BACK
Transportation of the Australian Wheat Harvest
ReportThe production and export of wheat is important for Australia and its storage and transport represents a significant load on domestic resources. This report presents the results of a study of the costs of transporting the wheat harvest from the production areas to the ports in order to meet both domestic and international demand.

BUREAU OF TRANSPORT ECONOMICS
TRANSPORTATIOIJ OF THE AUSTRALIAN WHEAT HARVEST
AUSTF@LIAN GOVERNMENT PUBLISHING SERVICE CANBERRA 1978
@ Commonwealth of Australia
Printed By Hedges & Bell Pty. Ltd., Sutton Road, MARYBOROUGH .

FOMWORD l The production and export of wheat is important for Australia and its storage and transport represents a significant load on domestic resources. This report presents the results of a study of the costs of transporting the wheat harvest from the production areas to the ports in order to meet both domestic and international demand.
The study covers the period from 1968-69 to 1972-73 and examines the differences between States as well as the effects of variation in the harvest from one year to another. Over this period storage and transport charges amounted to approximately 25 per cent of gross sales value and reached a peak of $167 million €or the record harvest of 1968-69.
The study was conducted by D.S. Short and J. Coat with the assistance of a number of staff members from the Costs and Information Branch of the Bureau.
The study would not have been possible without the co-operation and assistance of a number of organisations and individuals, including the Australian Wheat Board, the various State bulk handling authorities, the State railway systems and a number of bodies representing the wheat growers. In particular I would like to thank the many individual wheat growers who provided statistical information regarding the transport of wheat from farm to bulk storage.
G.K.R. Reid Acting Director
Bureau of Transport Economics Canberra May 1978
iii

CONTENTS
FOREWORD
SUMMARY
CHAPTER 1
CHAPTER 2
CHAPTER 3
CHAPTER 4
INTRODUCTION Terms of Reference Scope of Study Transportation of Bulk Wheat Transport Systems
THE WHEAT TRANSPORT TASK The Supply and Disposal of Wheat Rail Transport Task Road Transport Task Estimated Total Mainland Costs of Transportation
TRANSPORTATION COSTS FOR BULK WHEAT ON THE AUSTRALIAN MAINLAND Estimated Costs of Transportation Variation in Transportation Costs Among
Effects of Marketing Requirements on the States
Transport Costs Summary
MODAL FREIGHT RATES AND COSTS FOR TRANSPORTATION OF WHEAT Relationship Between Freight Rates and
Road Costs and Freight Rates Railway Costs and Freight Rates Effects of Seasonal Variations in Harvests
costs
on Freight Rates and Costs
P age
iii
XV
1 1 1
2 4
8 8 17 17
2 0
22
2 2
25
34 37
38
38 39 41
48
V

Page
CHAPTER 5 EFFECTS OF CHANGES IN WHEAT FLOW PATTERNS Netw-ork Analysis of Wheat Flows Effects of Redirecting Wheat Flows Summary
CHAPTER 6 CONCLUSIONS
ANNEX A MARKETING PROCESS FOR BULK WHEAT IN AUSTRALIA Appendix 1 - Technical Aspects Relating to
the Wheat Marketing Process in Australia Appendix 2 - CommQnwealth and State Acts Relating to Australian Wheat Industry
Appendix 3 - Sixth Wheat Industry Stabilisation Plan
ANNEX B INSTITUTIONAL FRAMEWORK FOR THE TRANSPORTATION OF BULK WHEAT ON THE AUSTRALIAN MAINLAND
ANNEX C OPERATIONS OF STATE BULK HANDLING AUTHORITIES
ANNEX D ESTIMATED TRANSPORTATION COSTS FOR BULK WHEAT: 1968-69 TO 1972-73 POOLS Appendix 1 - Incidental Rail Charges
ANNEX E TRANSPORTATION COSTS: 1972-73 PRICES
ANNEX F ESTIMATION OF THE COSTS OF ANCILLARY HAULAGE OF WHEAT FROM FARM TO SILO
ANNEX G E~TIMATION OF THE COSTS OF ROAD HAULAGE 6F WHEAT FROM OFF-RAIL SILOS TO PORT TERMINAL, WA, 1972-73
50
50
52 60
61
67
76
87
89
92
106
121 127
134
136
139
vi

P age
ANNEX H ESTIMATION OF LINE HAUL COSTS FOR RAIL MOVEMENTS OF WHEAT 141
ANNEX I ESTIMATED CAPITAL CHARGES FOR SPECIALISED RAILWAY ROLLING STOCK FOR WHEAT 147
BIBLIOGRAPHY 153
vi i

TAB LE S
1.1
1.2
2.1
2.2
2.3
2.4
2.5
2.6
2.7
2.8
3.1
Total Nominal Storage Capacity as a Percentage of Maximum Available Supplies of Wheat for the Period 1968-69 to 1972-73
Terminal Capacity as a Percentage of Country Storage Capacity by State and Australia: 1968-69 to 1972-73
Comparison of Areas Sown to Wheat and Total Crops: Australia - 1968-69 to 1972-73 Comparative Value of Wheat and Wheat Product Exports: Australia - 1968-69 to 1972-73
Production and Yield of Wheat: Australia - 1968-69 to 1972-73
Wheat Production Mainland Australia: 1968,-69 to 1972-73
Disposal of Wheat Mainland' Australia: 1968-69 to 1972-73
Wheat P4ovements by Government Railways : 1968-69 to 1972-73
Wheat Movements by Road Transport: 1968-69 to 1972-73
Comparison of Gross Receipts from Sales of Wheat with Estimated Mainland Transportation Costs: 1968-69 to 1972-73 Wheat Pools
Estimated Total Cost of Transportation: Mainland Australia - Wheat Pools 1968-69 to 1972-73
P age
6
11
13
13
16
18
19
21
23
viii

3.2
3.3
3.4
3.5
4.1
4.2
4.3
5.1
5.2
5.3
5.4
5.5
Estimated Total Transportation Costs and P age Pool Receivals by State: 1968-69 to 1972-73
Average Freight Charge and Length of Haul from Silo to Terminal for Wheat: 1968-69 to 1972-73 Wheat Pools
Cost Charged to Wheat Pools by State and Pool: 1972-73 Prices
Comparison of the Estimated Cost of Segregation of Wheat and Premium Payments on NSW: 1968-69 to 1972-73
Wheat Train Operations by Railway System: Estimated Short Run Avoidable Costs and Gross Contribution to System Overhead Costs - 1972-73 Season
Wheat Train Operations by Railway System: Estimated Net Contributions to System Overhead Costs - 1972-73 Season
Wheat Train Operations by Railway System: Estimated Total Net Contributions to System Overhead Costs - 1972-73 Season Estimated Flows of Wheat to Seaboard Terminals: 1971-72
Hypothetical Flows of Wheat to Seaboard Terminals: 1971-72
Hypothetical Changes in Flows of Wheat to Seaboard Terminals: 1971-72
Estimated Changes in Rail Freight Revenue Resulting from a Redirection of Wheat Flows
Estimated Change in Railway Finances Resulting from a Redirection of Wheat Flows
26
27
32
36
44
46
47
53
55
56
57
59
ix

6.1 Estimated Transportation Cost Paid by Growers: 1968-69 and 1972-73 Wheat Pools
A.l.l Australian Wheat Quotas: 1969-70 to 1974-75
B.l Total Wheat Storage Capacity by State and Ownership: Mainland Australia - 1968-69 to 1972-73
B.2 Available Supplies of Wheat, Mainland Australia: 1968-69
B.3 Receivals of Wheat by Grade: Australian Wheat Board 1968-69 to 1972-73
B.4 Grain Deliveries Ex-Farm to Bulk Handling Authorities: 1970-71 to 1972-73
B.5 Tonne Kilometres Performed by Road Line Haul Transportation as a Percentage of Total Line Haul Transport Task, Mainland Australia: 1968-69 to 1972-73
B.6 Wheat Movements Between Bulk Handling Authorities: Australia 1968-69 to 1972-73
C.l Assets and Liabilities: Grain Elevators Board of New South Wales - 1968-69 to 1972-73
C.2 Assets and Liabilities: Grain Elevators Board Victoria - 1968-69 to 1972-73
C.3 Assets and Liabilities: South Australian Co-operative Bulk Handling Ltd - 1968-69 to 1972-73
C.4 Assets and Liabilities: Co-operative Bulk Handling Ltd (and Subsidiaries) - Western Australia: 1968-69 to 1972-73
P age
63
85
96
97
99
100
103
103
109
111
114
11 8
X

c. 5
D. 1
D. 2
D. 3
D. 4
D. 5
Assets and Liabilities: State Wheat Board - Queensland: 1968-69 to 1972-73
Estimated Transport Costs for Wheat: 1968-69 Wheat Pool
Estimated Transport Costs for Wheat: 1969-70 Wheat Pool
Estimated Transport Costs for Wheat: 1970-71 Wheat Pool
Estimated Transport Costs for Wheat: 1971-72 Wheat Pool
Estimated Transport Costs for Wheat: 1972-73 Wheat Pool
D. 1.1 Demurrage Charges by State for Wheat Wagons: 1973
D.1.2 Demurrage Charges, Western Australia: 1973
E.1
F. 1
G. 1
G. 2
H. 1
Relative movements in Transportation Costs for wheat: 1972-73 Prices
Estimated Delivery Cost of Grain from Farm to Silo: Average for Three Years: 1971-72 to 1973-74
Annual Costs of Operating Wheat Trucks: Silo to Terminal - Western Australia, 1972-73 Variable, Fixed and Total Annual Operating Costs for Wheat Trucks: Costs per Tonne and Tonne Kilometre
Estimated Avoidable Railway Costs and Freight Rates by State: 1972-73 Season
Page
12 0
122
123
12 4
125
126
12 8
12 9
135
138
140
140
146
l
xi

P age
1.1 Numbers of Specialised Wagons Used in Grain Traffic: 1973 148
I. 2 Capital Charges €or Specialised Wheat Wagons : 1972-73 150
1.3 Postulated Size of Locomotive Pool €or Wheat Trains by State 150
I. 4 Capital Charges for Postulated Locomotive Pool: 1972-73 15 2
1.5 Total Estimated Capital Charges for Wheat Trains : 19 72- 73 152
xi i

FIGURES
P age
1.1 Australia: Wheat - Production, Storage and Railway Network 5
2.1 Gross Value of Crop Production in Australia: 1964-65 to 1973-74 10
2.2 Supplies and Disposals of Wheat - Australia: 1968-69 to 1972-73
3.1 Silo to Terminal Freight Rates for Wheat: 1972-73 Wheat Pool
3.2 Pool Receivals and Transportation Costs in Constant 1972-73 Prices
15
29
30
xiii

SUMMARY
This report presents the results of a study of the transportation of wheat on the mainland of Australia. In the report the term transportation is taken to include all operations, including the storage and handling of wheat, required to move the 'grain from the farm gate to mainland destinations.
The scope of the study covers the wheat marketed by the Australian Wheat Board during the first five years of the fifth wheat stabilisation scheme which commenced with the harvest of 1968-69. The basic statistical data for the study were obtained from the Australian Wheat Board (AWB), the bulk handling authorities in each State, a number of State railway systems and a field survey of wheat growers undertaken by the Bureau.
Since the 1948-49 wheat season, the bulk of the Australian wheat harvest has been marketed through a series of stabilisation schemes which have been established under cmplementary Federal and State legislation. In accordance with these statutes the Australian Wheat Board is the legally constituted sole marketing authority for domestic and export sales of wheat.
The principal receival agents for the Board are the bulk handling authorities in each State. Each authority provides bulk storage capacity in the wheat belt, mostly located on railway lines, and at port terminals. In addition, each authority arranges on behalf of the Australian Wheat Board, for the mainland distribution of wheat receivals .
The legislative arrangements governing the marketing of wheat have resulted in the establishment of institutions which influence the directional flows of wheat and the mode of surface transport employed. ThB bulk of the line haul operations from the hinter- land storage to mainland destinations in all States involves intrastate movements by rail transport.
xv
l l

The task of moving wheat from production centres to mainland destinations involves not only transport, but also extensive storage facilities. Over the study period, estimates of the magnitude of the rail transport task ranged up to 3.7 thousand million tonne-kilometres per annum and for road transport up to 3.5 million tonne-kilometres per annum.
Estimates of the costs borne by growers and the community for the transportation of the wheat harvest on the Australian mainland ranged up to $167 million (1968-69 wheat pool). Over the five wheat pools transportation costs constituted approximately 25 per cent of the gross value of export and domestic sales of wheat marketed by the AWB.
In all States the line haul costs of transporting wheat from hinterland bulk storage facilities to seaboard terminals, pre- dominantly charges for railway services, were the major element of costs in the transport pr,ocess. Storage and handling charges were the second most significant cost factor. In real terms, rail freight rates in each State declined over the five wheat pools studied. In contrast, storage and handling charges exhibited upward trends.
The total cost of transporting the wheat crops of the individual States obviously varies with the size of the harvest. However, in terms of the cost per tonne, a significant factor explaining the variation in costs within pools is the difference between the States in the distance over which wheat is transported. Further- more, a major reason for the difference in unit costs between States lies in differences in the pricing policies of the bulk handling authorities and State railways.
An assessment was made of the effects on transportation costs of the policy of the AWB to market wheat according to grades. This marketing strategy requires the segregation of wheat while in storage. The segregation process in turn increases the costs to growers through a reduction in the turnaround time of vehicles at
xvi

silos, and possibly through increased storage expenses. On the information available to the Bureau the increase in delivery costs were more than offset by the premiums paid for quality wheats. However, because of the pooling arrangements whereby the costs of storage and handling of wheat are spread equally among all growers operating through the wheat stabilisation scheme, the burden of any additional storage costs associated with segregation of wheat would be borne by all growers in the nation , not only those producing premium wheats.
An investigation of the relationship between freight rates and the costs of providing transport services indicated that for road-transport, the rates applying during the wheat seasons considered in this report approximated the costs of the services. Because of the complexity of rail operations and the fact that many elements of costs are common to a number of different rail traffics , it is not possible to determine precisely the relation- ship between rates charged and costs. However, the results of the study demonstrate quite clearly that wheat freight rates exceed the direct costs associated with the provision of these services and thus make a contribution to the common costs assoc- iated with overall railway operations.
A network analysis of wheat flows in 1971-72 was undertaken in order to assess the efficiency of the transport arrangements given existing facilities. The analysis was confined to the States of NSW, Victoria and SA, as it was economically feasible to transport wheat between these States by rail transport. The postulated changes in wheat flows, dominated by a redirection of wheat to interstate outlets, suggested that a reduction in the freight bill borne by growers (and the community by way of a rail freight subsidy) of $1.65 million could have been achieved. This loss of income to therailways would have been marginally offset by a reduction in the costs of operations estimated at $0.44 million. The results of this analysis indicated that the institutional constraints on the directional flows of wheat,
xvi i

which restrict the use of intersystem rail facilities to trans- port wheat across State boundaries, inhibit the efficient allocation of resources employed in the railway industry.
xviii

CHAPTER 1 - INTRODUCTION TERMS OF REFERENCE
On 1 June 1973 the Minister for Transport directed the BTE to undertake a study and report on wheat freight rates in Australia. The study was to consider:
. the relationship of wheat freight rates and the cost of provision of necessary transport facilities both for rail and road;
. tne effect of institutional factors on the means and direction of transport;
. the cause of variations in transport costs between states;
. the effect of marketing requirements on transport costs;
. the relationship between variations in size of the harvest and freight rates and costs; and
. the efficiency of present transport arrangements €or wheat.
SCOPE OF STUDY
The most recent statistics available to the Bureau in undertaking this study covered the period from the 1968-69 to th'e 1972-73 wheat pool. During this period the bulk of the Australian wheat harvest, approximately 90 per cent of production, was marketed through the wheat stabilisation arrangements'') and sold fob at mainland destination. Information was not available to the
(1) Details of the marketing process for wheat sold through the wheat stabilisation schemes are given in Annex A.
1

Bureau for estimation of the costs of transporting wheat sold outside the stabilisation scheme. This study has therefore been confined to the transportation of wheat sold through the central marketing arrangements.
The scope of the study was ,further constrained to the transport and handling of wheat grown on the mainland since only insignifi- cant quantities of wheat were grown in Tasmania and the bulk of the wheat required for human consumption in that State was imported from the mainland.
Throughout the study, transportation has been defined to include not only line haul movements from farm gate to port terminals, but also the various storage and handling operations that are involved in the marketing process.
TRANSPORTATION OF BULK WHEAT (
The means and direction of transport of the Australian wheat harvest(2) , marketed through the fifth wheat stabilisation scheme, were influenced by three institutions:
. the Australian Wheat Board (AWB), the legally constituted sole marketing authority for the harvest;
. the State bulk handling authorities, the principal licensed receival agents of the AWB who arrange, on behalf of the Board, for the storage and handling of the crop and the distribution of receivals to final Australian destinations; and
. the State railway systems, the major mode used for line haul transport from the hinterland to mainland outlets.
(1) Nearly all wheat was handled in bulk, only insignificant
(2) Details of the institutional framework and background data quantities were transported in bags.
on the transportation of wheat in Australia are contained in Annex B.
2
The nexus between these institutions arises as a result of legislative arrangements and State Government policies. The link between the AWB and the bulk handling authorities is a function of federal and complementary State legislation, necessary to meet constitutional requirements for central marketing operations. State Government policies of developing their railway systems and their own bulk handling organisations independently have influenced the way in which the railways and bulk handling authorities have been associated.
The effect of the interaction of these institutions is that wheat moves predominantly by rail and that the direction of movement, with minor exceptions, is to terminals in the State in which the wheat is grown, even though an interstate outlet may be closer.
Interstate consignments of wheat marketed by the AWB are relatively insignificant in the overall transport scene. The major consign- ments are from the mainland to Tasmania,-a deficit producing State in terms of production for human consumption. The mainland interstate movements of wheat €ram NSW to Victoria, SA and Queensland are minor and.are arranged to meet shipping schedules for export .
Intersystem rail consignments of wheat have been restricted over the years primarily as a result of State Governments, in.fostering econmic development within their borders, adopting a policy of developing their own railway systems as separate entities and encouraging the movement of traffic within their borders. An indirect result of this policy, and which has inhibited the use of intersystem rail facilities for wheat movements, has been that intersystem rail freight rates for wagon load consignments of wheat are significantly higher than those for intrasystem journeys of a comparable distance .
(1) For a more detailed description of this rating practice see Bureau of Transport Economics, A Study of Intersystem Railway Freight Rating Practices, Australian Government Publishing Service, Canberra, 1976, Ch. 6.
(1)
l 1
3

TRANSPORT SYSTEMS
The intrastate mainland transportation of wheat consists basically of four stages - delivery by road transport from the farm to the AWB, storage and handling of wheat at hinterland or port terminal storage facilities and finally, delivery to domestic clients or ship's hold for export.
Extensive bulk storage' facilities are provided throughout the wheat belt in each State and at terminals located at major ports. Most storage'structures in the wheat belt are located on railway property. In all States, except South Australia, port terminals are serviced by both road and rail infrastructure. In South Australia, two port terminals are situated-off-rail. Figure 1.1 shows the main grain storage facilities and rail network in each State .
As shown in Table 1.1, the total nominal wheat storage capacity in each State except WA and Queensland represents similar pro- portions of the volume of wheat produced and marketed. The higher storage capacities in WA and Queensland (in the latter two seasons covered by the study) relative to the maximum available supplies of wheat reflects the program of the bulk handling authorities in those States to provide capacity for grains other than wheat. Nevertheless, management of storage space in each State is influenced by the policies of the AWB relating to the marketing of wheat by grades as well as those of the bulk handling authorities towards the storage of grains other than wheat. These policies require the segregatiou of the various types of grain and grades of wheat, thus limiting both the nominal and effective storage space available in any seasqn.
The general pattern of distribution of wheat from country storage involves direct deliveries to mainland destinations by the use of time table or unit trains. In the States of South Australia and Western Australia the bulk handling authorities utilise commercial road transport, in addition to the State railway system, to move wheat from country storage to port terminals.
4

LEGEND EXISTING RAILWAYS GAUGE SHOWN THUS
BROAD STANDARD _______- NARROW
WHEAT PRODUCTION MAJOR PRODUCING AREA OTHER SIGNIFICANT PRODUCING AREAS i-
UNDER 3.6 ( UNDER 0.10. I( 9 1 CUBIC METRE OF WHEAT
3.6 - 9 1 ( 0.10- 0.25 I #I
WEIGHS ABOUT 0.75 TONNES
PORT STORAGES
STATE WHEAT HANDLING AUTHORITY OTHER
EOUAL TO 3 MIL. BUSHEL CAPACITY L-
__" "" __"___
AUSTRALIA W H E A T : PRODUCTION, STORAGE AND
RAILWAY N E T W O R K

TABLE 1.1 - TOTAL NOMINAL STORAGE CAPACITY AS A PERCENTAGE OF THE MAXIMUM AVAILABLE SUPPLIES (a)OF WHEAT FOR THE PERIOD 1968-69 TO 1972-73
(per cent)
State 1968-69 1969-70 1970-71 1971-72 1972-73
NSW 73 99 104 94 96 Vic 73 88 93 95 94 SA 50 80 98 98 96 WA 106 150' 14 9 153 171 Qld 85 97 92 105 114
(a) Supplies equals receivals for a pool plus carryovers from
Source: Storage capacities - Table B.1, Annex B. previous pools.
Wheat Supplies - Table B.2, Annex B.
TABLE 1.2 - TERYINAL STORAGE CAPACITY AS A PERCENTAGE OF COUNTRY STORAGE CAPACITY BY STATE AND AUSTRALIA: 1968-69 TO 1972-73
(per cent)
State 1968-69 1969-70 1970-71 1971-72 1972-73
NSW 9.2 5.7 5.4 6.0 7.4 Vi c 33.5 27.3 32.6 32.6 32.5 SA 60.5 59.7 56.2 56.3 57.6 WA 26.8 38.5 38.3 38.1 32.8
Qld 6.6 6.9 8.7 9.0 8.9 AUSTRALIA. 22.6 23.6 24.8 25.7 25.0
Source: Table B.1, Annex B.
6

While the overall pattern of transportation is similar in each State the fact that the States have developed their own rail and storage system independently has led to considerable variation in the transportation systems used. This variation in the transport systems, can be illustrated by a comparison of the distri.bution of storage capacity between country silos and port terminals (Table 1.2). In 1972-73 the ratio of terminal to country storage capacity varied from 7 per cent in New South Wales to 58 per cent in South Australia.
In States where terminal facilities are small relative to country storage capacity, grain must be moved from the hinterland to meet sales orders. On the other hand, in States where terminal facilities are large relative to hinterland capacity, orders for clients can often be met direct from terminal holdings. Con- sequently, States with relatively small terminal facilities mount a continuous year round line haul operation, while States with relatively large terminal capacities mount a more concentrated seasonal line haul effort.
7

CHAPTER 2 - THE WHEAT TRANSPORT TASK During the period 1968-69 to 1972-73 wheat accounted for over half of the total area sown to crops in Australia (Table 2.1). In financial terms, wheat production averaged over 30 per cent of the gross value of crop production during the quinquennium to 1972-73 (Figure 2.1). Over the same period, the value of exports of wheat and wheat products to total exports of agricultural, horticultural and viticultural produce ranged from over 34 per cent in 1972-73 to nearly 55 per cent in 1969-70 (Table 2.2). In terms of the percentage of total national exports, the range extended from 4.6 per cent in 1972-74 to 10.4 per cent in 1970-71.
l
The aim of this chapter is to illustrate not only the size, but also the variability of the task of transporting wheat sold through the central marketing authority, the Australian Wheat Board, in the mainland States of Australia. The statistics presented relate to production, supply and disposal of wheat and the magnitude of the task undertaken by rail and road transport. Finally, estimates of the costs of mainland transportation borne by growers and the community for the wheat pools 1968-69 to 1'972-73 are presented.
THE SUPPLY AND DISPOSAL OF WHEAT
The wheat growing areas in the mainland of Australia are illustrated in Figure 1.1. Wheat is produced'in two inland belts receiving an annual rainfall of between 250 and 500 millimetres. The first belt stretches south from the Darling .Downs in Queensland through the Western Slopes of New South Wales to the Riverina. From there the belt reaches westward through the Wimmera in Victoria to Eyre Peninsula in South Australia. The other belt stretches south and inland from Geraldton to Katanning in Western Australia.
8

TABLE 2.1 - COMPARISON OF AREAS SOWN TO WHEAT AND TOTAL CROPS: AUSTRALIA - 1968-69 TO 1972-73
Wheat Total crops Wheat as ('000 hectares) ('000 hectares) percentage of
total crops
1968-69 10,845 16,665 1969-70 9,486 15,728 1970-71 6,478 13,450 1971-72 7,138 14,295 1972-73 7,603 14,386 Average 1968-69 to 1972-73 8,310 14,905
65.1 60.3 48.2 49.9 52.8
55.8
Source: Australian Wheat Board, Annual Report, 1972-73 and ~
Commonwealth Year Book, No. 60.
9

3.0
2.5
1964-65 1965-66 1966-67 1967-68 1968-69 1969-70 1970-71 1971-72 1972-73 1973-74
YEAR
FIGURE 2-1 GROSS VALUE OFCROP PRODUCTION IN AUSTRALIA 1 1964-65 TO 1973-74

TABLE 2.2 - COMPARATIVE VALUE OF WHEAT AND WHEAT PRODUCT 'EXPORTS: AUSTRALIA - 1968-69 TO 1972-73
Year 1968-69 1969-70 1970-71 1971-72 1972-73
Wheat ( $ l 000) 258 , 334 337 , 570 433 , 000 418 , 529 273 , 096 ~~~ ~ ~~
Flour ($' 000) 22,444 21,641 20,051 13 , 712 13,108 Meal and groats ( $ l 000) 25 100 101 239 117
Total wheat exports ($'OOO) 280,803 359 , 311 453 , 152 432 , 480 286 , 321 ~~ ~~~~
Total exports of agricultural, horticultural & viticultural produce ( $ l 000) 583 , 206 657 , 953 872 , 342 961 , 800 831,315 wheat exports as proportion of total agricultural exports (%) 48.1 54.6 51.9 45.0 34.4
Total national exports ($' 000) 3,374,263 4,137,222 4,375,757 4,896,368 6,213,704 Total wheat exports as a proportion of total national exports (%) 8.3 8.7 10.4 8.8 4.6
Source: Australian Bureau of Statistics, Overseas Trade, 1972-73, Bulletin No. 70, Canberra 1974. Ref. No. 8.11.

Production
Table 2.3 shows wheat production in Australia from 1968-69 to 1972-73, the period covering the fifth Xheat Stabilisation Plan") . Production ranged from the record harvest of 14.8 million tonnes in 1968-69 to approximately 6.4 million tonnes in 1972-73.
A breakdown of production by mainland States 'for the seasons 1968-69 to 1972-73 is shown in Table 2.4. New South Wales and Western Australia were the largest producers, providing over half of the Australian total. Queensland was the smallest wheat
~ producing State with 1968-69 being the only season when the harvest exceeded one million tonnes.
Several factors underlie the decline in production during the quinquennium. In 1968-69 a record Australian wheat harvest and carryover stocks coincided with the build-up of world wheat stocks. At the instigation of the industry, restrictions were placed on the quantities of wheat that could be delivered to the AWB from the 1969-70 season onwards(2). While the quota systems resulted in a decline in wheat output, production was also restricted by adverse weather conditions as evidenced by the reduction in the average yields per hectare' in Australia from 1.3 tonnes in 1968-69 to 0.85 tonnes in 1972-73 (Table 2.3). The only year in which deliveries to the AWB exceeded the national quota was 1969-70. However, in later years, although national quotas exceeded deliveries, some individual States produced over quota wheat(3) illustrating the variability in production that occurs among the States. (1) In the fifth scheme, established under the Wheat Industry
Stabilisation Act 1968, provisions relating to wheat exports were intended to span a period of 5 years terminating on 30.9.73. Interim legislation was enacted to extend the scheme to cover wheat exports in the 1973-74 season, pending outcome of negotiations between the Federal Government and representatives of the industry. In respect of domestic consumption of wheat there was provision in the Act (Section 6) to extend the covering period to 7 years.
(2) Quota restrictions were suspended from the 1975-76 season. (3) A contingency quota was established in the 1973-74 season to
provide for States producing in excess of their quota allocation. , 12

TABLE 2.3 - PRODUCTION AND YIELD OF WHEAT: AUSTRALIA - 1968-69 TO 1972-73
Production Yield ( '000 tonnes) (tonnes per hectare)
Average 1963-64 to 1967-68 9,255 1.21 1968-69 14,804 1.36 1969-70 10,546 1.11 -1970-71 7,890 1.22 1971-72 8,511 1.19 1972-73 6,434 0.85 Average 1968-69 to 1972-73 9,637 1.15
Source: Australian Wheat Board, Annual Report, 1972-73.
TABLE 2.4 - WHEAT PRODUCTION MAINLAND AUSTRALIA(a) : 1968-69 TO 1972-73
( I 000 tonnes)
State 1968-69 1969-70 1970-71 1971-72 1972-73
NSW 5,855 4,430 3,010 2,409 1,954 Vi c 2,469 2,274 1,004 1,799 1,249 SA 2,263 1,610 790 1,407 815 WA 3,060 1,815 2,957 2,165 2,003 Qld 1,144 405 120 722 405 AUST 14,791 10,534 7,881 8,502 6,426
(a) Excludes the ACT. Source: Australian Wheat Board, Annual Report, 1972-73.
13

Despite these restrictions on production, the average annual harvest for the period 1968-69 to 1972-73 was approximately 9.6 million tonnes, an' increase over the average 9.3 million tonnes for the previous quinquennium (Table 2.3).
Total Available Supplies to AWB
Wheat available to the AWB in any year is the sum of deliveries to licensed storage facilities and stocks carried over f r m the previous year. Total production in any year always exceeds total deliveries to the AWB due to farmers retaining some wheat for seed and other purposes and because of sales outside the wheat stabilisation scheme. Statistics on total available supplies of wheat in mainland Australia over the study period and their relation to total production are illustrated in Figure 2.2.
A major factor contributing to wheat supplies of 15.3 million tonnes in 1968-69 was the record harvest of 14.8 million tonnes in that year. In the following season production declined, but total available supplies actually increased. This increase in supplies was due mainly to the difficulties encountered in selling wheat on the export market which resulted in a record carryover of stocks of over 7 million tonnes. By 1972-73, the decline in production in relation to disposals had reduced the opening stocks in that year to 1.4 million tonnes while total available supplies were down to 6.8 million tonnes.
Disposal of Wheat by the AWB
Disposals of wheat and wheat products by the AWB for the years 1968-69 to 1972-73 are presented in Figure 2.2 and Table 2.5.
Total exports rose from 6.6 million tonnes in 1968-69 to 9.1 million tonnes in 1970-71, then fell to 4.1 million tonnes in 1972-73. New South Wales and Western Australia were the major exporting States.
14

18 - 16 - 14 -
I2 - v) W 2
0 2 10 - l- L 0 - -l 8 - -l
5 -
6 -
4 -
2 -
0-
iUPPLIE!
;eed etc.
A W B
9%
............. ............. ............. ............. ............. ............. ..............
1968 - 69
JPPLIEE
Seed eic
A W 0
, m to A W 8 , Seed etc.) TOTAL PRODUCTION (incl. Deliveries
POSALS
............. ............. ............. ............. ............. ............. .............
.............
............. ............. ............. ............. ............. ............. ............. ............. ............. ............. ............. ............. ............. ............. ............. ............. ............. ............. ............. ............. ............. ............. ............. ............. ............. ............. ............. ............. .............
............. ............. ............. ............. ............. ............. ............. .............
UPPLIE$
ked etc.
AWB CARRYOVERS WHEAT RETAINED ON FARM (incl. Private Soles 1 LOCAL CONSUMPTION (AWE
~
EXPORTS
............. ............. ............. ............. ............. .............
1969-70 1970-71
YEAR
FIGURE 2-2
UpPuEfi Need etc.
.............. .............. .............. .............. .............. .............. .............. .............. .............. .............. ..............
1971-72
Soles 1
UPPLIES
1972-73
SUPPLIES AND DISPOSALS OF WHEAT-AUSTRALIA : 1968-69 TO 1972-73

TABLE 2.5 ,- DISPOSALS OF WHEAT(a) MAINLAND AUSTRALIA: 1968-69 TO 1972-73
( ' 000 tonnes)
1968-69 1969-70 1 9 W - 1 - 1971-72 1972-73
DOMESTIC CONSUMPTION
Human consumption - NSW 500 - Vic 358 - Qld 167 - SA 110 - WA 90
Sub-total 1225
Stockfeed - NSW 98 - Vic 73 - Qld 20 - SA 19 - WA 39
Sub-total 249 Total Domestic 1474
514 347 172 113 93
1239
243 2
12 5
35 297
1536
519 356 16 9 111 96
1251
32 3 2 2 4
39 370
1621
54 6 349 174 11 3 92
1274
413 6
19 16 47
501 1775
570 324 170 112 90
1266
538 97
105 72 82
894 2160
EXPORTS
- NSW 2721 2884 2744 1956 624 - Vic 820 1562 1988 1740 923 - SA 9 09 1372 1339 1271 74 8 - WA 1484 2104 2938 2345 1749
- Qld 700 265 41 448 85 Total Exports 6634 8187 9050 7760 4129
Total Disposals 8108 9723 10671 9535 6289
(a) Includes wheat and wheat equivalents. Source: Various AWB Annual Reports and Supplementary Stocks and
Sales Bulletins.
16

Sales of wheat by the AWB on the domestic market increased from 1.5 million tonnes in 1968-69 to 2.2 million tonnes in 1972-73. Sales for human consumption of wheat products remained almost static at about 1.2 million tonnes per annum over the period and the increase in total domestic sales was due almost entirely to increasing sales of wheat for use as stock feed, particularly in New South Wales and Queensland.
RAIL TRANSPORT TASK
Estimates of the magnitude of the rail task of transporting wheat for the years 1968-59 to 1972-73 are shown in Table 2.6. The figures for tonnes carried were obtained from the official records of the Australian Bureau of Statistics. Interpretation of these data is made difficult by the fact that the same wheat may be counted several times when multiple movements are involved.
The BTE estimated the tonne-kilometres performed as the products of the tonnes carried each year and the weighted average length of rail haul to port terminals in each State. The rail task ranged from 6.3 million tonnes in 1972-73 to 10.0 million tonnes in 1970-71, or in terms of tonne-kilometres from 2.0 thousand million to 3.7 thousand million‘’) . In terms of both the tonneage carried and tonne-kilometres performed the Rail Division of the Public Transport Commission of New South Wales consistently undertook the greatest task among the States followed by either the Victorian Railways or the Western Australian Government Railways .
ROAD TRANSPORT TASK
Table 2.7 contains estimates of the road transport task of moving wheat during the study period. The estimates for tonnes carried
(1) The marginal discrepancies between the Australian Bureau of Statistics figures and BTE estimates arises because of the difference in the definition of the task. In this report the task is defined as the movement of wheat from the hinter- land to the seaboard and therefore excludes multiple move- ments of wheat.
17

TABLE 2.6 - WHEAT MOVEMENTS BY GOVERNMENT RAILWAYS: 1968-69 TO 1972-73
State 196'8-69 1969-70 1970-71 1971-72 1972-73
Tonnes Carried (Million)
NSW 3.1 3.5 3.5 3.3 1.7 Vi c 1.7 1.6 2.6 2.1 1.6
Qld 0.9 0.5 0.3 0.5 0.4 SA 0.6 1.0 1.1 0.8 0.6 WA 1.5 2.3 2.5 2.6 2.0 Total 7.8 8.9 10.0 9.3 6.3
~~ ~ ~
Tonne-Kilometres (Thousand million)
NSW 1.54 1.86 1.86 1.77 0.91 Vi c 0.58 0.56 0.89 0.71 0.52
Qld 0.30 0.20 0.12 0.19 0.14 SA 0.09 0.15 0.15 0.12 0.09 WA 0.44 0.64 0.70 0.74 0.53
Total 2.95 3.40 3.72 3.53 2.19
Sources: Australian Bureau of Statistics, Rail, Bus and Air Transport, 1972-73; various issues of Transport and Communication; Bureau of Transport Economics estimates.
18

TABLE 2.7 - WHEAT MOVEMENTS BY ROAD TRANSPORT: 1968-69 TO 1972-73 State 1968-69 1969-70 1970-71 1971-72 1972-73
Tonnes Carried (Million)
NSW 5.3 4.0 2.5 2.0 1.4 Vi c 2.6 2.3 0.9 1.7 1.2 Qld 1.0 0.3 0.1 0.7 0.3 SA 2.3 1.6 0.7 1.4 0.7 WA 3.4 1.9 3.2 2.3 2.1 Total 14.6 10.1 7.4 8.1 5.7
Tonne-Kilometres (million)
NSW 80 59 38 30 22 Vi c 34 30 12 23 15 Q Id 51 16 4 32 16 SA 66 47 24 47 27 WA 123 84 12 0 94 81 Total 354 236 19 8 226 16 1
Source: Bureau of Transport Economics estimates.
19

were based on wheat receivals data supplied by the AWB, while the distances for the calculation of tonne-kilometres were estimated by the Bureau.
The movements. by road are predominantly from farm to silo €or all States, but there are some farm to terminal consignments in Victoria, South Australia and Western Australia and silo to terminal movements by road in South Australia and Western Australia. Because of multiple movements of wheat consignments, the estimated tonnes carried exceed receivals to the AWB in some cases, partic- u'larly in Western Australia.
Over the study period the estimated road task for mainland Australia ranged from 5.7 million tonnes in 1972-73 to 14.6 million tonnes in 1968-69. In terms of tonne-kilometres the task for these years ranged from 161 million to 354 million. The comparatively large road transport task in terms of tonne-kilometres performed in SA and WA reflects the greater dependence on road for line haul movements in those States.
ESTIMATED TOTAL MAINLJiND COSTS OF TRANSPORTATION
Estimates of the total costs borne by both the wheat growers and the community for the transportation of wheat on the mainland from the farm gate to port terminals for each of the five wheat pools 1968-69 to 1972-73 are presented in Table 2.8. The estimates include pool charges and State Government subsidies . (1)
The cost estimates ranged in nominal values from $93 million for the 1972-73 pool to $167.3 million for the 1968-69 wheat pool. Expressed as a percentage of gross receipts from sales the estimated transportation costs varied from 24.1 per cent to 29 per cent, averaging 26.8 per cent over the five pools.
(1) For more details of these cost estimates refer to Chapter 3 and Annex B.
20

TABLE 2.8 - COMPARISON OF GROSS REXEIPTS FROM SALES OF WHEAT WITH ESTIMATED MAINLAND TRANSPORTATION COSTS: 1968-69 TO 1972-73 WHEAT POOLS
~~~
Pool Gross receipts Estimated Estimated transpor-
costs percentage of gross from sales (a) transportation tation costs as
receipts ($m) ($m) ( % l
1968-69 693.4 167.3 24.1 1969-70 424.0 123.1 29.0 1970-71 387.8 107.8 27.8 1971-72 380.2 105.4 27.7 1972-73 340.3 93.0 27.3
5 Year average 445.1 119.3 26.8
(a) Excludes payments from Stabilisation Fund. Sources: Gross receipts from sales: Australian Wheat Board, - Annual Report, various issues.
Transportation costs: Table 3.1., Chapter 3.
21

CHAPTER 3 - TRANSPORTATION COSTS FOR BULK WHEAT ON THE AUSTRALIAN MAINLAND
In this chapter resource costs for transportation of wheat on the Australian mainland for the five wheat pools 1968-69 to 1972-73 are estimated. The value of the resources are measured as the sum of the costs incurred by growers and State Government sub- sidiQs. (2)
To comply with the terms of reference for the study the analysis is extended to investigate firstly, the major underlying causes of the variations in transport costs among the States and secondly, the effects of marketing requirements on transport costs.
ESTIMATED COSTS OF TRANSPORTATION
The cost estimates for the transportation of wheat have been structured on pool receivals adjusted for over quota deliveries and relate to the movements from farm gate to port terminal on the mainland. The estimates are based on the costs incurred by growers in delivering wheat to the AWB, including imputed values for the time spent by growers in delivering wheat into bulk storage, the costs from hinterland bulk storage to port terminals and State Government subsidies. In addition, storage and handling costs, administration charges and additional rail freight costs arising from the stabilisation arrangements are included.
The mainland transportation costs for wheat are shown in Table 3.1 for each of the five wheat pools (3). Estimated total costs for the nation varied between $93 rnillion in 1972-73 and $167.3 million in 1968-69. Of these costs between $1.2 million (1972-73)
(1) Strictly speaking the value of resources should exclude transfer payments such as excise duty on fuels.
(2) This assumes that the income from wheat traffic covers the social costs of wheat transport operations.
(3) The details of costs for each pool by the various stages of the transport processes for wheat, including storage, hand- ling and AWB administration costs are contained in Annex D.
22

I ' ,
TABLE 3.1 - ESTIMATED TOTAL COST OF TRANSPORTATION: MAINLAND AUSTRALIA - WHEAT POOLS 1968-69 TO 1972-73 (+ million)
State Estimated transport, storage, State subsidy on Total cost of transportation handling and administration charges
68-69 69-70 70-71 71-72 72-73 68-69 69-70 70-71 71-72 72-73 68-69 69-70 70-71 71-72 72-73
wheat transportation
NSW 71.8 57.4 47.2 35.9 30.9 1.5(c) 3.6(c) 3,9(c) 3.2(c) l.l(c) 73.3 61.0 51.1 39.1 32.0 25.8 20.0 16.3 18.6 16.1 15.1 6.1 2.2 9.7 6.3
SA 16.4 12.1 9.0 9.7 9.2 - 16.4 12.1 9.0 9.7 9.2 WA 33.1 23.7 28.8 28.2 29.4 0.2 ~ 0.1 0.2 0.1 0.1 33.3 23.8 29.0 28.3 29.5 Aust(a) 165.6(b) llS.4 103.7 102.1 91.8 1.7 3.7 4.1 3.3 1.2 167.3(b) 123.1 107.8 105.4 93.0
tu Vi c 25.8 20.0 16.3 18.6 16.1 - Qld 15.1 6.1 2.2 9.7 6.3 -
- - - - W - - - -
- - - -
(a) Totals may not add due to rounding. (b) Includes pool rail freight charge of $3.5 million for which state details are not available.
Source: Estimated transport storage, handling and administration charges. Tables D.l to D.5. (c) Subsidy covers rail freight concessions on wheat and flour.
~~ -
NSW state subsidy on wheat line haul transport: Report of the Auditor-General, NSW, 1969-70 to 1972-73. Details of subsidies paid by pool are not available. Subsidies relate to payments in a financial year. WA state subsidy on wheat line haul transport: Personal contact with AWB.
and $4.1 million (1970-71) represented subsidies on wheae, line haul freight rates paid by the State Governments of NSW akd {A. The remainder of the estimated costs were incurred either directly or indirectly by wheat growers.
Growers may be liable for line haul costs additional to the transport charges deducted from first advance payments. These costs may arise for a number of reasons. For example, the policy of the AWB is that millers receive wheat. of a homogeneous quality to ensure the production of a standard quality of flour for bread and biscuit manufacture. This means that relatively small quantities of wheat may have to be collected from a number of widely dispersed silos. Additional line haul cost may also arise when wheat has to be transported between bulk storage facilities for housekeeping purposes or to interstate terminals to meet shipping schedules. As additional transport costs form part of the pool charges they are borne jointly by all growers who operate within the central marketing arrangements.
An analysis of the effects of handling grains other than wheat is outside the scope of 'this study. However, it is evident that the storage costs for wheat will be influenced by the requirements for storing other grains.
It could be expected that no additional costs would be caused to wheat growers during a poor harvest. Indeed, it is possible that the greater utilisation of bulk storage facilities through storing other grains would tend to reduce the burden of costs on the wheat producer. Conversely, during a bumper wheat harvest
I additional costs may be imposed on the wheat industry, depending
I on the requirements for other grains. Without a detailed know- !
i ledge of the arrangements of the bulk handling authorities covering the storage of other grains it has not been possible for the Bureau to undertake an analysis of the effects of these
I operations on the costs of the transportation of wheat. However, the approach employed in analysing costs will automatically include any additional costs arising from this source although they are not separated out explicitly.
24

VARIATION IN TRANSPORTATION COSTS AMONG THE STATES
Table 3.2 summarises the amount of wheat delivered to the AWB and the total transport costs for each state over the study period. Clearly the main determinants of the transport cost in any particular case are the magnitude of the task (expressed in tonne-kilometres) and the freight rate charged. Both these factors vary between States at any given time and over time in any given State.
An analysis has been undertaken of the variation in costs between States within pools and between pools within States to explore the different values assumed by these basic determinants.
Variation in Transport Costs Within Pools
The line haul costs of transporting wheat from silos to port terminals were the major transportation expenses incurred by growers in all States for each of the five wheat pools (1) .
To explain the differences in these costs among the States the analysis was based on the weighted average freight rates, in nominal values, and the weighted average length of haul.(2) in each mainland State as presented in Table 3.3. The-freight rates are based on the deductions from the first advance payments to growers and the road haulage charges paid by the bulk handling authorities in WA, SA and NSW.
As would be anticipated most of the differences in cost per tonne moved are accounted for by the differences in average distance hauled, but there remain significant differences in charges per tonne-kilometre between States and within a single State.
(1) For details refer to Annex D Tables D.l to D.5. (2) The weighted average freight rates and length of haul have
been calculated using tonneages received into individual silos as weights. Therefore, the resulting averages reflect variations due to seasonal conditions.
25

TABLE 3.2 - ESTIMATED TOTAL TRANSPORTATION COSTS AND POOL RECEIVALS(a) BY STATE: 1968-69 TO 1972-73
Pool State 1968-69 1969-70 1970-71 1971-72 19-72-73
NSW - Q'ty ('000 tonnes) 5357 3538 2982 2008 1454 Costs ($m) 73.3 61.0 51.1 39.1 32.0
Vic - Q'ty (' 000 tonnes) 2577 1769 14 15 1551 1426 Costs ($m) 25.8 20.0 16.3 18.6 16.1
Qld - Q'ty (' 000 tonnes) 1056 326 90 666 325 Costs ($m), 15.1 6.1 2.2 9.7 6.3
SA - Q'ty ('000 tonnes) 2162 1225 973 1089 928 Costs ($m) 16.4 12.1 9.0 9.7 9.2
WA - Q'ty ('000 tonnes) 2876 1598 2259 2068 2087 Costs ($m) 33.3 23.8 29.0 28.3 29.5
i l , AUST -
Q'ty (' 000 tonnes) 14028 8456 - 7719 7382 6220 Costs ($m) 167.3 123.1 107.8 105.4 93.0
, i (a) Receivals adjusted for over quota wheat.
Source: Quantities - Australian Wheat Board, Annual Report, 1973-74, P. 27 and 38. Costs -.Table 3.1.
26

TABLE 3.3 - AVERAGE FREIGHT CHARGE (a) AND LENGTH OF HAUL FROM SILO TO TERMINAL FOR WHEAT, 1968-69 TO 1972-73 WHEAT POOLS
1968-69 1969-70 1970-71 1971-72 1972-73
State Haul Rate Haul Rate Haul Rate Haul Rate Haul Rate per per T per per C per per C per per per
km Eonne :-km km tonne :-c: km tonne :-km km Stonne t-km km ;on,, t-km
h, 4
NSW 500 8.27 1.65 510 8.93 1.75 , 515 8.97 1.74 502 8.88 1.77 533 9.01 1.71 Vic 341 6.83 2.00 344 6.85 1.99 343 6.84 1.99 342 6.84 2.00 328 6.73 2.05 Qld 345 8.52 2.47 392 8.72 2.22 377 8.54 2.27 350 8.12 2.32 350 8.16 2.33 SA 150 3.99 2.66 157 4.09 2.61 139 3.76 2.71 153 4.31 2.82 148 4.22 2.85 WA 286 5.17 1.81 270 5.05 1.87 289 5.19 1.80 281 5.16 1.84 267 5.05 1.89
(a) The freight charges are based on the deductions from the first advance payments to growers and the
Source: BTE estimates road hdulage charges paid by the bulk handling authorities.

A comparison of the rail freight charges, based on the tonne- kilometre rates, that applied on the mainland during the 1972-73 season is made in Figure 3.1. The analysis was confined to the railways as rail was the major mode, and in the eastern seaboard States the only mode, used by the State bulk handling authorities for silo to terminal wheat movements. Consequently, rail freight rates, rather than those applying on road transport w,ere generally the predominant factor underlying the level of freight charges for this particular segment of transportation.
The comparisons in Figure 3.1 show that the rail freight rates per tonne-kilometre in all States 'decreased as distance increased. However, the rate of decline varied markedly among the States.
The grain rates in Queensland were, in general, higher than those in other States, even though concessions applied to wheat traffic on certain lines and freight charges were subject to a ceiling of $8.86 per tonne for hauls in excess of 429.7 kilometres in that State''). The freight rates in WA, for distances in excess of 120 kilometres, were the lowest of all States.
Variation in Transport Costs Between Pools
While the difference in the interrelationships between rail freight rates and the distances over which wheat was hauled explain the variation in costs among the States within pools, it is not sufficient to explain the differential in costs between pools. To do so it was necessary to explore the reasons under- lying the changes in line haul and pool charges, the major transport expenses borne by growers, over the five pools.
Figure 3.2 shows pool charges, silo to terminal and total line haul costs, expressed as the weighted average cost per tonne in
(1) Queensland Government Gaze'tte, 16 June, 1972, p. 863.
28

7
6
a 5 c c 0' Y
3 4 W
2 z
e W P W c U (L
K 3
2
I
0
NSW ._._._ VIC "" QLD o - - - ~ SA - W A X-
I00 200 300 400 500 600 700 800 DISTANCE (km )
FIGURE 3-1 SILO TO TERMINAL FREIGHT RATES FOR WHEAT,
1972-73 WHEAT POOL
SOURCE: Data supplied by AWB
29

12 KE Y ,Toto1 Line Haul
"-._ ~ ""... -"- _.._ Pool Receivals
1968-69 1969-70 1970-7 I 1971-72 1972-73 YEAR
FIGURE 3-2 3 POOL RECEIVALS AND TRANSPORTATION COSTS IN CONSTANT
1972-73 PRICES
30

constant 1972-73 prices . The difference between total line haul and silo to terminal costs measures the costs incurred by growers in delivering wheat from the farm to the AWB.
The pool costs for each State shown in the graph do not reflect the actual charges levied on growers. Under the terms of the wheat stabilisation scheme the pool costs for each State are aggregated and then averaged over the total national deliveries for that pool. For every tonne of wheat delivered to the AWB each grower is levied a charge equal to the national average pool cost. For example, as shown in Table 3.4 the national average pool cost for the season 1972-73 was $6.13 per tonne paid by all growers in the nation and was less than the average pool costs in the States of NSW ($9.49) and Queensland ($8.61). In the other three mainland States the average pool cost was less than the national average. Reference to the average pool costs per tonne on a State basis, assist in explaining the variation in costs among the S tate s .
In all States the costs for both categories of line haul operations that is farm to the AWB and silo to terminal movements, exhibited a downward trend, signifying a decrease in costs in real terms over the five wheat pools. The silo to terminal charges were the major element of the total line haul costs incurred by growers. As the railways in each State moved the bulk of the wheat to terminals then the rail freight rates in each State were the main factor underlying the silo to terminal line haul charges, and the decline over the five pools in the charges for this segment of transportation reflected a reduction in real rail freight rates.
In contrast to the decline in line haul costs there was an upward trend over the five seasons in the pool costs in each State. The charges levied by the bulk handling authorities for storage and handling were the major factor underlying total pool costs.
(1) For details regarding the calculation of constant prices refer to Annex E.
31

TABLE 3.4 - COSTS CHARGED TO WHEAT POOLS BY STATE AND POOL: 1972-7 3 PRICES (a)
( $/tonne ~~~
State Pool 1968-69 1969-70 1970-71 1971-72 1972-73
~~~~ ~
NSW 3.92 6.21 5.41 6.74 9.49 Vi c 2.36 3.57 3.40 2.97 3.44 Qld 4.40 9.32 14.93 3.78 8.61 SA 2.96 5.73 4.95 3.95 4.96 WA 4.26 8.27 4.72 4.37 5.75 AUST 3.88 6.11 4.88 4.57 6.13
(a) The charges €or the years 1968-69 to 1971-72 were inflated by the Australian Bureau of Statistics Price Index of Materials Used in Building Other Than House Building. Ref. No. 9.6.
Source: Pool charges supplied by the AWB.
32

Each bulk handling authority assigned the costs of storage and handling to each pool on the basis of their year-on-year costs of operation, that is, according to the general principles of accounting. This is evidenced by the inverse relationship in each State between the cost per tonne and pool receivals (refer to Figure 3.2). A number of factors, such as whether or not the authority is required to pay interest on loan funds‘’) and the income derived from the storage of grains other than wheat, influence the year-on-year costs attributed to the storage of wheat by each bulk handling authority. There were significant variations among the authorities in the method of financing their overall operations and, as a result, there was considerable variation among the States of the average pool cost per tonne.
The overall effect of the divergent trends in line haul and pool costs in each State on total unit cost varied among the States. In NSW the increase in pool costs more than offset the decrease in line haul costs resulting in an increase, in real terms, in total unit costs over the five pools. In Victoria, SA and WA total costs per tonne declined, while in Queensland total unit costs were relatively stable over the five pools.
Within each State the policies of the railways and the bulk handling authority regarding the charges for their respective services were mainly responsible for the trend in the overall transport charge.
Other Factors Underlying the Variation in Transport Costs
In the States of WA, SA and Victoria growers employed one of two
(1) The most important source of finance for the South Australian Co-operakive Bulk Handling Ltd. organisation is the interest free tolls levied on growers in South Australia. Refer to Annex C for further details.
33

strategies to deliver wheat to the AWB - road transport from the farm to either a seaboard terminal or a local silo. For farm to terminal movements, growers in SA incurred the greatest overall costs . (1)
Whil'e there was considerable variation among the States in the costs associated with the road movement of wheat from farm to silo, the data from which the estimates were derived were not considered sufficiently rel'iable to provide a basis for detailed analysis.
EFFECTS OF MARKETING REQUIREMENTS ON TRANSPORT COSTS
A requirement arising from the policy of the AWB to market wheat according to grades is that' the various grades must be segregated during transportation. This segregation process may lead to additional transportation costs in the form of increased expenses to growers when delivering wheat from the farm to the AWB and in the form of increased storage and handling costs.
Costs incurred by the bulk handling authorities constitute part of the pool charges and are borne,equally by all growers in the nation. Because of the pooling arrangements, details of add- itional costs that may arise due to the segregation of wheat in bulk storage facilities are not available and so it has not been possible for the BTE to undertake a comprehensive analysis of the effects of the segregation of wheat on transport costs.
However, a limited analysis has been undertaken based on the results of a study by the NSW Department of Agriculture . In this work it was estimated that, in NSW, segregation of wheat increased the costs of transport by an average, taken over the whole harvest, of 18.4 cents per tonne (1968 prices). (1) For details refer to Annex D. (2) J.W. eeebairn, 'Segregation of NSW Wheat: An Economic
(2)
Investigation', Miscellaneous Bulletin No. 4, Division of Marketing and Agricultural Economics, NSW Department of Agriculture, Sydney, 1968, Chapters 7, 8.
34

This cost relates to more expensive road transport for farm to silo movements. The additional cost arose because of the increase in the turn-around time of vehicles, resulting from the slower receival rate at silos because of segregation, and by the restrictions placed on the time and the location at which partic- ular grades of wheat-could be delivered into storage. It was concluded that the additional cost was a function of the quantity of wheat segregated and largely independent of the variability in harvest size . (1)
Estimates of the increase in transport costs in NSW associated with the segregation of wheat for the five wheat pools, 1968-69 to 1972-73, were derived by inflating the rate for the 1968-69 pool of 18.4 cents per tonne according to the index of road haulage freight rates for wheat developed by the Master Carriers’ Association of NSW. On this basis, the increase in transport costs ranged from $1 million for the 1968-69 pool to an estimated $0.38 million for the 1972-73 pool (Table 3.5).
A comparison of these estimates with premium payments for quality wheat in NSW was made to place the additional costs in perspective. This analysis shows -that the increase in costs due to segregation of wheat was more than off-set by the premium paid to growers , see Table 3.5. However, while this suggests that the policy of the AWB to market wheat by grades was profitable to growers of premium wheats in NSW, any additional costs incurred by the NSW GEB as a result of segregation would have been pooled and therefore borne by all growers delivering wheat to the AWB in Australia, not only those producing premium wheats .
As wheat was segregated in all States over the study period it appears, on the available evidence, that the effect on transport of the marketing of wheat by grades was to increase the costs to
(1) J.W. Freebairn, ibid, p. 63.
35

TABLE 3.5 - COMPARISON OF THE ESTIMATED COST OF SEGREGATION OF WHEAT(a) AND PREMIUM PAYMENTS IN NSW: 1968-69 TO 1972-73
~ ~ ~~
Wheat Pool 1968-69 1969-70 1970-71 1971-72 1972-73
Wheat Receivals ( I 000 tonnes) 5357 3538 ~ 2982 2008 1454 Cost/tonne (cents) 18.4 20.52 21.03 23.93 26.09 Total costs ($'OOO) 986 726 627 480.5 379 Total premium payments ($'OOO) 3000 804 1906 3026 1226
(b)
(a) Costs relate to farm to silo movements only. (b) Wjusted for over quota wheat. Source: Receivals : Australian Wheat Board
Premiums : Bureau of Agricultural Economics, The Australian Wheat Growing Industry, An Economic Survey, 1972-73, Australian Government Publishing Service, Canberra 1975, pp 52-53.
-
costs : BTE estimates.
36

all growers operating within the wheat stabilisation scheme while providing additional returns only to those producing premium grade wheat.
S UI4MARY
The estimated annual costs of the resources used to transport wheat on the mainland ranged up to $167.3 million during the study period.
Over the five wheat pools the costs of transportation, both within and between pools, varied significantly between the States. As would be expected the main determinants of transport cost in each case were found to be the mass of wheat moved, the distance over which it was moved and the rail freight rates charged. In each State the rail unit price varied with distance, but the shape of the price-distance curve was different in each case. Variation over time in total costs of transportation for individual States was found to be primarily a function of bulk handling authority and railway system pricing policies.
On the evidence available to the Bureau, it appears that while the policy of the AWB to narket wheat by grades was profitable to growers of premium grades, the effect of this policy was to increase the costs of transport to all growers in the nation operating within the wheat stabilisation arrangements.
37

CHAPTER 4 - MODAL FREIGHT RATES AND COSTS FOR TRANSPORTATION OF WHEAT
The purpose of this chapter is to examine firstly the relation- ship between freight rates that applied to wheat movements and the costs of providing both rail and road transport services during the study period and, secondly, the effects of seasonal 'variations in the wheat harvests ori freight rates and costs.
Following an outline of the general principle underlying the price cost relationship the results of empirical investigations into the relationships for both modes of transport are presented. The effects of variations in wheat production on rates and costs are then discussed.
RELATIONSHIP BETWEEN FREIGHT RATES AND COSTS
The 'economic' price for a transport service regardless of mode should, in principle, at least cover the avoidable cost of providing the service and desirably make a contribution to overhead costs. The upper limit for pricing is set by market forces, but the overall objective is generally that of ensuring that the total price charged for all services together should equal the total costs of the system, including an allowance for 'profit'. The price charged for an individual service will depend upon a managerial assessment of market demand elasticities and so the contributions to overheads by different classes of traffic will vary. Some traffics may make only a small contri- bution while other traffics make a large one'') . The divergence
(1) Under the restrictive assumption of zero cross price elasticities it can be shown that where market imperfections exist optimal pricing requires that for each product the percentage deviation of price from marginal cost must be inversely proportiona1,to its price elasticity. Refer to W.J. Baumol and D.F. Bradford 'Optimal Departures from Marginal Cost Pricing', American Economic Review, V01 60, No. 3, June, 1970.
38

in contributions to overhead costs by the various classes of traffic reflects the difference in price, set according to demand elasticities, for transport services and the avoidable costs of providing the services.
ROAD COSTS AND FREIGHT RATES
As there is no conclusive evidence to indic 'ate whether or not road haulage freight rates cover the social costs of providing road services, it has been assumed that the estimates of the freight rates used in this section are at least equal to the avoidable social costs of road haulage operations.
Over the study period the road transportation of wheat included Consignments from the farm to either country storage or terminal, shipments from off-rail silos to terminal or rail head and consignments within the wheat belt between bulk handling author- ities for example, from NSW GEB storage facilities in the Riverina to the Victorian GEB silos located on Victorian Railway property. The limited data available to the Bureau restricted the analysis of the relationship between prices and costs for road transport to movements f r m farm to silo and silo to terminal.
Farm to Silo Wheat Movements
As indicated previously most wheat novements from farm to silo were undertaken by growers using their own vehicles. The results of a field survey undertaken to obtain details of these costs, and hence the price paid by growers for this transport service, showed that the estimated national weighted average price (long run avoidable cost) per tonne, for the three years 1971-72 to 1973-74, was $2.80, ranging from $1.71 to $8.49. (1)
(1) Refer to Annex F for details.
39

Comparable quotations for commercial haulage obtained by the Bureau varied between $1.30 and $3.80 per tonne according to locality. However, the Bureau found that, in'general', the contract hauliers did not rely on wheat haulage for their annual income. The quoted rates reflected excess haulage capacity available at harvest time. While detailed information on the costs of these particular operations is not available, the relat-ively low rates suggest that commercial operators based their price only on the operating costs, that is their short run avoidable costs, of providing the services.
The widespread use of commercial road haulage to undertake the farm to silo movement of wheat could have serious implications for the wheat transport task. Firstly, if growers continue to follow the strategy of delivering the crop to local silos during the harvest this would involve employing hauliers for only a few weeks in every year. Consequently, this demand would require an increase in road haulage capacity which, accompanied by the resultant excess capacity in the industry during the rest of the year, would necessitate contract haulage rates substantially above the rates obtained by the Bureau in the field survey. Secondly, greater reliance by growers on commercial road haulage may increase the requirement for on-farm wheat storage capacity. This need would increase further if the delivery strategy were varied to cover a longer period of time. Such changes would increase the possibility of pest infestation and would also adversely affect the degree of utilisation of existing silo and terminal capacities. A detailed investigation of the implications of change to the present delivery strategies common amongst Australian wheat growers was beyond the scope of this study.
Silo to Terminal Road Movements of Wheat
~ The data necessary to consider the relationship between freight ~ rates and the costs of road line haul transportation of wheat ,
~
from silos to terminals are not available for all areas. However, field data were made available to the Bureau for road
40
haulage operations for the clearance of off-rail country storages during 1972-73 in the Lakes District of Western Australia, north of Esperance. The survey information indicated that this haulage task was the major business for road transport operators over the year.
The road haulage costs relate to rigs consisting of a prime mover, semi-trailer and dog trailer with a total carrying capacity of 40 tonnes, travelling 130,000 kilometres annually. The average break even cost for this service was estimated to be $6.56 per tonne . (1)
The comparable weighted average freight rate for this area of WA based on information supplied by the AWB, was $6.57 per tonne. Comparison of this rate with the estimated cost indicates that in 1972-73 road transport freight rates in WA for wheat line haul operations approximated the cost of providing the service.
However, State Government policy in WA is that no grower who delivers to an off-rail silo is required to pay a rate for road transport to the terminal that would be in excess of the rail freight rate to the nearest terminal if the off-rail silo were served by rail. Consequently, when account is taken of the State subsidy applying to the Lakes District the weighted average freight rate charged to wheat growers in the 1972-73 season was reduced to $6.25 per tonne . ( 2 )
RAILWAY COSTS AND FREIGHT RATES
The magnitude of the line haul transport task from on-rail silos to terminals virtually ensures that the bulk of the task will be performed by the railways.
(1) For details of cost estimates refer to Annex G. (2) The same principle applies to a number of other off-rail
silos in WA.
41

The transportation of wheat is not only one of the major traffics for the railways, but also 'one of the major sources of railway revenue. However, as it is not possible to unequivocally allocate the common costs of railway operations to specific traffics, it was decided to illustrate the relationship between rail freight rates and costs by showing the extent to which the revenue from wheat traffic contributed to the overhead costs in both the short and 16nger term operations of the railways.
Short Term Railway Operations
The short run avoidable costs for rail line haul of wheat from silo to port terminal in'each State for 1972-73 have been estimated from a cost model developed by the Bureau relating to time table trains . (1)
The inputs used to develop the model cover costs of train crews (including downtime), locomotive fuel and maintenance, wagon and brakevan maintenance, marshalling and shunting and track mainten- ance. Since the basic information included general and specific purpose wagons all avoidable costs associated with the trip have been attributed to wheat traffic. This approach avoided allocat- ing costs .common to other traffics using the service, for example, when backloading superphosphate or general cargo.
The estimate of short run avoidable costs takes no account of system overheads such as capital charges. It was assumed that special purpose rolling stock had'no alternative use and hence no opportunity cost. It was also assumed .that capital charges on general purpose rolling stock, track and way were system overheads and as such could be excluded from the estimates of short run avoidable cost. The resulting estimates of short run avoidable costs set the lower limit to railway freight rates.
(1) For details of the model refer to Annex H. The model was structured to provide estimates on a round trip basis, that is, from terminal to silo and return.
42

Table 4.1 shows the estimated short run avoidable costs, weighted average freight rates (excluding incidental charges not included in freight rates ) and the estimated gross contributions to system overhead costs for each State during the 1972-73 wheat season. The cost estimates were derived for both a 'light' train with a gross trailing load of 1,000 tonnes, and a 'heavy' train with a gross trailing load of 1,850 tonnes.
For 'heavy' trains the estimated costs ranged from 0.32 cents per tonne-kilometre in NSW to 0.41 cents per tonne kilometre in WA. Comparing the estimated costs with the freight rates the gross contribution to overheads varied from 1.39 cents per tonne- kilometre in NSW to 2.48 cents per tonne-kilometre in SA. Similarly, for 'light' trains costs ranged from 0.54 cents per tonne-kilometre in NSW to 0.65 cents per tonne-kilometre in WA and the gross contributions to overheads extended from 1.17 cents per tonne-kilometre in NSW to 2.24 cents per tonne-kilometre in SA.
Longer Term Railway Operations
Without a detailed knowledge of demand elasticities €or rail traffic it is not possible to determine the appropriate proportion of common system overhead costs to be carried by the wheat traffic (2) . However, it is possible to determine whether, and by how much, the revenue, net of short run avoidable costs, exceeds the capital charges directly associated with the wheat traffic.
(1) For details of incidental charges applying to wheat traffic
(2) The overhead costs of all State Railway Systems include refer to Annex D , Appendix 1.
Various categories which are common to all traffics, for example the costs of signalling and administration. From an economic standpoint those common costs should be distributed among traffics on the basis of demand elasticities, ie according to market demand.
43

TABLE 4,.1.- WHEAT TRAIN OPERATIONS BY RAILWAY SYSTEM: ESTIMATED SHORT RUN AVOIDABLE COSTS AND GROSS,CONTRIBUTION TO SYSTEM OVERHEAD COSTS - 1972-73 SEASON
State Average Avoidable costs per round trip Average rail Gross contributions rail haul Train 1 (a) Train 2(b) freight rate to overhead costs from silo to Train l(a) Train 2(b) terminal
(km) (c/t km) (c/t km) (c/t km) (c/t km) (c/t km)
NSW 533 0.32 0.54 1.71(c) 1.39 1.17 a=- vic 328 0.38 0.61 2.05 1.67 1.44
Qld 350 0.37 0.60 2.33 1.96 1.73 SA 151 0.39 0.63 2.87 2.48 2.24 WA 269 0.41 0.65 1.89 1.48 1.24
bP
~~
(a) Based on a train load of 1330 tonnes of wheat: unladen on 'down' trip. (b) Based on a train load of 740 tonnes of wheat: unladen on 'down' trip. (c) Net of subsidy paid on wheat freight rates by the NSW Government. Source: Bureau of Transport Economics estimates.

Only those charges, such as depreciation and interest on capital 1 for hopper wagons and locomotives, are directly attributed to the wheat traffic . (1)
The estimated contributions(2) from wheat traffic to the overhead costs of each railway system net of capital charges in 1972-73 are shown in Table 4.2. The lower limit of the estimates follow from the assumption that the total harvest in each State was transported by 'light' trains. The upper limits were derived by postulating that the whole harvest was moved by 'heavy' trains. The upper bounds of the estimates ranged from 0.68 cents per tonne-kilometre in Queensland to 1.94 cents per tonne-kilometre in SA, while the lower bounds varied from 0.23 cents per tonne- kilometre in Queensland to 1.40 cents per tonne-kilometre in SA.
Based on the estimated tonne-kilometres performed in each State (3) the upper limits of the total net contributions ranged from $1 million in Queensland to $9.9 million in NSW as shown in Table 4.3. The lower limits extend from $0.3 million in Queensland to $6.2 million in NSW.
The analyses of both the short and longer term operations of the railways show that in each State the freight rates applying to wheat traffic were above the sum of short term avoidable costs and depreciation charges and interest on capital in respect of hopper wagons and locomotives used for wheat traffic. Thus, wheat traffic in each State has contributed to the overhead costs of the railway system concerned.
(1) Insufficient detail is available regarding the use of perman- ent way by various categories of freight to allow the inclusion of capital charges for track in the cost estimates. By omitting estimates of these costs from the calculations it has been implicitly assumed that any portion of track used exclusively for wheat traffic would have no financially viable alternative use.
(2) Details of the calculations are shown in Annex I. (3) Refer to Table 2.6, Ch. 2.
45

TABLE 4.2 - WHEAT TRAIN OPERATIONS BY RAILWAY SYSTEM: ESTIMATED NET CONTRIBUTIONS (a) TO SYSTEM OVERHEAD COSTS - 1972-73 SEASON
(cents per tonne kilometre)
State Gross contribution to overhead Capital charges for rolling Net contribution to costs stock (b) overhead costs
Train l(c) Train 2 (d) Train l(c) Train 2 (d) Train l(c) Train 2 (d)
NSW 1.39 p Vic 1.67
Qld 1.96 SA 2.48 WA 1.48
1.17 0.30 1.44 0.47 1.73 1.28 2.24 0.54 1.24 0.64
0.49 1.09 0.68 0.75 1.20 0.69 1.50 0.68 0.23 0.84 1.94 1.40 0.97 0.84 0.27
(a) Net contributions are based on the assumption that the total harvest has been
(b) Includes locomotives and wheat hoppers with wagon costs adjusted to reflect fleet
(c) Based on a train load of 1330 tonnes of wheat; unladen on 'down' trip. (d) Based on a train load of 740 tonnes of wheat; unladen on 'down' trip. Source: Bureau of Transport Economics estimates.
transported by either 'heavy' trains or alternatively 'light' trains.
size.

TABLE 4.3 - WHEAT TRAIN OPERATIONS BY RAILWAY SYSTEM: ESTIMATED TOTAL NET CONTRIBUTIONS TO SYSTEM OVERHEAD COSTS - 1972-73
($m)
State Net contributions to overhead costs Train 1 (a) Train 2 (b)
NSW Vic
Qld SA WA
9.9 6.2 1.0 1.7 4.5
6.2 3.6 0.3 1.3 1.4
_ _ _ _ _ _ ~ ~ ~~ ~ ~ ~~
(a) Based on a train load of 1 330 tonnes; unladen on 'down' trip (b) Based on a train load of 740 tonnes; unladen on 'down' trip Source: BTE estimates.
47

EFFECTS OF SEASONAL VARIATIONS IN HARVESTS ON FREIGHT RATES AND
COSTS
In the analysis of commercial road haulage operations the evidence for farm to silo movements suggested that freight rates were based on variable operating costs. In other words, the rates reflected the degree of excess capacity in commercial haulage. Therefore, it is reasonable to conclude that throughout the study period fluctuations in the size of the harvest did not affect either the freight rates or the costs of these services.
On the other hand, a breakdown of the costs to growers using their own vehicles to transport wheat from farm to silo indicated that fixed costs constituted about 65 to 75 per cent of total costs. Therefore, variations in the size of each grower's crop will not greatly affect his total costs from year to year. However, the unit costs of transporting wheat,will vary inversely with the size of the crop due to the relatively large proportion
, ~ of fixed to variable costs of operating vehicles.
For silo to terminal movements the evidence relating to operations in WA shows that variable costs for commercial road haulage constituted approximately 60 per cent of total financial costs . As freight rates appear to be closely attuned to total costs it could be expected that both freight rates and costs would there- fore tend to move in the same direction as fluctuations in the size of the transport task.
(1)
Over the study period rail freight rates in all States declined in real terms, although relatively constant in absolute terms, irrespective of fluctuations in the size of harvests. Therefore, there is no evidence to suggest that variations in the size of the harvest in any State influenced rail freight rates.
(1) Refer to Annex G for details.
48

Considering the fixed nature of a large portion of the total costs associated with railway operations and the rigidity of other major expenditures, such as labour costs, then it is reasonable to conclude that seasonal fluctuations in harvests due to climatic factors had no noticeable impact on the overall costs of railway services.
Similarly, the inflexibility of the total costs of storage and handling of wheat relative to seasonal fluctuations in harvests is due to the significance of the fixed costs in the overall costs of operations.
The administrative techniques of both the railways and bulk handling authorities require that the wheat traffic bear the year-on-year costs of their operations. Viewed in these terms, the unit costs of these services vary inversely with the harvest size. This was illustrated in the analysis of storage and handling costs in Chapter 3.
49
CHAPTER 5 - EFFECTS OF CHANGES IN WHEAT FLOW PATTERNS
The historical link between the growth of the wheat industry in each State and the development of the State railway network in addition to the obligation of each bulk handling authority towards the needs of the State in which it operates has meant that, traditionally, the bulk of the wheat harvest moves to the terminals in the State in which it is grown. To examine the potential €or improvement in efficiency an investigation was made into the possible effects of a more intensive use of intersystem rail facilities. The results of the analysis are presented in this chapter.
NETWORK ANALYSIS OF WHEAT FLOWS
There are a number of options that could be examined to test the efficiency of the current transport arrangements for wheat. For example, rescheduling of time table trains, greater use of unit trains and optimisation of location of bulk storage facilities. Information relating to the operations of the transport system in each State is not available in sufficient detail to undertake a comprehensive analysis of the various alternatives or some combination of the strategies that could lead to more efficient transport systems . 41)
Based on the information available to the Bureau a network analysis of wheat flows for the 1971-72 financial year was undertaken. The object of the analysis was the minimisation of costs incurred by both the wheat growers and the community in the provision of rail services. The effect of the postulated change in wheat flows on railway finances was then examined.
(1) Limited information was available on which a preliminary analysis was undertaken by the Bureau to assess the advan- tages arising from the use of unit trains rather than scheduled mixed goods trains to move wheat from the Junee sub-terminal in NSW to Sydney. The results suggested that because of the restrictions such as speed, train size etc., applying on the NSW railway system, the cost advantage to the railways of operating unit trains may only be marginal.
50

Specification of Network Analysis
The network analysis was confined to the States of NSW, Victoria and SA(1) because it was possible to transport wheat between these States by rail. Western Australia was excluded since rail movements of wheat over these distances are precluded on an economic basis.
Taking into account the rail network in the States, the analysis is based on 34 regions (supply points) and seven port terminals (demand points). Each region is centred round a major town. The regions were structured on the boundaries used in the BTE infor- mation bulletin, Estimates of Australian Interregional Freight Movements , 1971-72.
The rail freight rates deducted from first advance payments to growers for the 1971-72 wheat pool were used to derive estimates of the transport charges for wheat. For intrastate movements of wheat in NSW adjustments were made to the rates to include the subsidy paid by the State government. Estimates of the total charges for any regional-terminal link were based on the assumption that the freight rate from the town, around which the region is centred, to a port terminal was representative of the rates applying to all movements over the link.
An out-of-kilter algorithm was used to develop the least cost flow patterns for wheat. In this analysis the capacity at the seven terminals was constrained by the estimated maximum throughput per annum . (2)
On interstate links for distances up to 600 kilometres the freight rates adopted in the model were the maximum of the two
(1) Eyre Peninsula was excluded from SA because the rail network
(2) These estimates were obtained by personal contact with the in this area is separate from the remainder of the State.
authorities at the various terminals.
51

State rates, excluding any State subsidy") , irrespective of whether the distance to interstate terminals exceeded that to intrastate outlets. For distances in excess of 600 kilometres the only rates available were the freight charges in NSW. These rates were used in the model subject to the condition that where the distance to the interstate terminal was greater than the distance to the intrastate terminal, the interstate rate, excluding any subsidy, was not less than the intrastate rate, including any subsidy. The reason for this proviso was to avoid anomalies in the freight rate schedules due to subsidies that could lead to nonsensical flow patterns.
The rationale for selecting the more expensive State rail freight rate for interstate consignments for distances up to 600 kilometres was that the wheat traffic was bearing the higher charge for the distance. Therefore, there was no economic justification to select the lower rate. Also, it was not feasible to use inter- system rail freight charges as these rates, under normal circum- stances preclude interstate wagon load consignments of bulk wheat. Under current intersystem rail freight arrangements it is less expensive to transport wheat by rail to intrastate rather than interstate terminals, even though the distance may be considerably longer . (2)
EFFECTS OF REDIRECTING WHEAT FLOWS
Estimates of intrastate flows of wheat from the various regions to the terminals for the 1971-72 financial year are illustrated in Table 5.1. The total quantity of wheat involved in the
(1) Where NSW freight rates were used for interstate consignments of wheat the State subsidy was excluded as it is not reason- able to expect the NSW government to subsidise interstate grain movements.
(2) For details of intersystem rail freight rates applying to movements of bulk wheat refer to Bureau of Transport Economics, A Study of Intersystem Railway Freight Rating Practices, Australian Government Publishing Service, Canberra, 1976, p. 33.
52

I"Y a. .l. .. ".. ..* ""_ " " . - . - ( ' 000 tonnes)
Destination Origin Centre 1 2 3 4 5 6 7
Sydney Newcastle Geelong Portland Port Wallaroo Port Total Adelaide Pirie
43 6 9
429 395 239 181
03 Newcastle 04 Aberdeen 42 42 11 Barraba 51 300 351 12 Bellata 30 179 209 13 Ballimore 315 2 317 13A Binnaway 2 39 41 14 Coonamble 61 55 116 15 Byrock 7 7 16 Bathurst 11 11 17 Forbes 981 4 985 20 Kingsvale 69 69 21 Junee 379 379 22 Tabbita 182 182 23 Burrumbuttock 319 3 19 24 Berrigan 30 30 3 0 Me lbourne 43 32 Castlemaine 6 33 Hamilton 9 34 Ilorsham 709 35 Ouyen 424 36 Inglewood 239 37 Benalla 181 61A Hamley Bridge 17 17 61B Nantawarra 2 74 61C Red Hill 7 7 64 Kapunda 42 42 65 Nairne 1 1 66 Waikerie 31 31 67 Murray Bridge 24 24 68 Karoonda 54 54 69 Keith 24 24 73 Booleroo Centre 2 50 52 74 Jamestown 35 35 74A Burra 27 27
2440 621 1302 309 224 72 92 5060
~ ~~ ~
3 3
280 29
72

analysis was estimated to be over 5 million tonnes"). Movements of wheat in NSW accounted for more than half the total, over 3 million tonnes. The quantity of wheat for which the Victorian GEB arranged transport was estimated at 1.6 million tonnes with the remainder, 0.39 million tonnes being transported within SA.
~
The least cost flows as determined by the mathematical program are illustrated in Table 5.2. In general, the results indicate that a redirection of wheat flows not only within the States, but also from southern NSW to Victoria and from the north west of Victoria to SA would have lowered the total rail freight bill.
The major change suggested by the analysis was the use of Geelong in Victoria, rather than Sydney in NSW, as the outlet for wheat grown in the Riverina area of NSW. The total quantity of wheat involved was estimated at 728 thousand tonnes. The analysis also indicated that it would have been possible to achieve a saving in rail freight charges if an estimated 424 thousand tonnes of wheat, produced in the north western region of Victoria, had been sent to Port Adelaide rather than Geelong. A further reduction in the rail freight bill could also have been realised through the greater use of the Portland facilities if the AWB had arranged for an additional 220 thousand tonnes of wheat, originating in the western half of Victoria, to be exported through Portland rather than Geelong. Details of the quantities of wheat involved in the redirection of flows within the States are given in Table 5.3.
~
Estimated Reduction in Railway Freight Bill
The effect of the postulated changes in wheat flows on the total rail freight bill borne by growers and the community is shown in Table 5.4. The ,results of the analysis indicate a reduction in (1) From October l971 to November 1972, 97 thousand tonnes of
wheat were transported from NSW to Victoria (refer to Table B.6, Annex B). Details of +transport arrangements for this consignment are not available to the BTE and have there- fore been excluded from the analysis.
54

Destination Origin Centre 1 2 3 4 5 6 7
03 Newcastle 04 Aberdeen 11 Barraba 12 Bellata 13 Ballimore 13A Binnaway 14 Coonamble 15 Byrock 16 Bathurst 17 Forbes 20 Kingsvale 21 Junee 22 Tabbita
VI 23 Burrumbuttock 24 Berrigan 3 0 Melbourne 32 Castlemaine 3 3 Hamilton 34 Horsham 35 Ouyen 3 6 Inglewood 37 Benalla 61A Hamley Bridge 61B Nantawarra 61C Red Hill 64 Kapunda 65 Nairne 66 Waikerie 67 Murray Bridge 68 Karoonda 69 Keith 73 Booleroo Centre 7 4 Jamestown 74A Burra
VI
Sydney Newcastle Geelong Portland Port Wallaroo Port Total Adelaide Pirie
3 42 351 209
41 317
116 7 11 985 69
379 18 2
319 30 43 6
218
239 181
9 491
424
17
42 1 31 24 54 24
27
74
3 42 351 209 317 41 116 7 11 985 69 379 182 319 30 43 6 9
709 424 239 181 17 74
7 7 42 1 31 24 54 24
52 52 35 35
27

~~~ ~
Destination
Origin Centre 1 2 3 4 5 6 7 Sydney Newcastle Geelong Portland Port Wallaroo Port
Adelaide Pirie
03 Newcastle - 3 3 11 Barraba - 51 51 12 Bellata - 30 30 13 Ballimore 2 - 2
cn 13A Binnaway - 2 2 m 14 Coonamble 55 - 55
17 Forbes 4 - 4 21 Junee -379 379 2 3 Burrumbuttock - 319 319 24 Berrigan - 30 30 33 Hamilton - 9 9 34 Horsham -211 211 35 Ouyen -395 - 29 424 61B Nantawarra - 2 2 73 Booleroo Centre - 2 2
-753 25 113 191 420 2 2

TABLE 5.4 - ESTIMATED CHANGES IN RAIL FREIGHT REVENUE RESULTING FRC A REDIRECTION OF WHEAT FLOWS: 1971-72
($' 000)
State Freight Bill for Change in Actual Hypothetical freight F lows Flows bill
NSW . Intrasystem 27230 19544 -7686 . Subsidy 3200 2948 - 252 . Intersystem - 6498 6498
TOTAL 30430 28990 -1440
VICTORIA . Intrasystem l0513 7137 -3376 . Intersystem - 3172 3172
TOTAL 10513 10309 - 204 SOUTH AUSTRALIA . Intrasystem 1554 1547 - 7
ALL STATES . Intrasystem 39297 28228 -11069 . Subsidy 3200 2948 - 252 . Intersystem - 9670 9670
TOTAL 42497 40846 -1651
I
l l
57

the freight bill for each State. For the three States the total reduction was estimated at $1.65 million.
The major savings would have occurred in NSW, estimated at over $1.44 million. This saving comprises a reduction in the costs borne directly by growers in the Riverina area of NSW of nearly $1.2 million, and a saving of about $0.25 million to the NSW comm6nity through a decrease in the subsidy for wheat traffic paid by the State Government. Savings to growers in the other States were relatively insignificant, consisting of $0.2 million in Victoria and only $7 000 in SA.
Estimated Changes in Railway Finances
The postulated movements of wheat by rail to interstate destinations would involve longer distances over one rail system than the other. To estimate the effects of these movements on railway finances, it is assumed firstly, that revenue from this traffic would be divided equally between the two railway systems and secondly, each railway would be responsible for the costs (1)
incurred on their system.
Based on these assumptions the net eff-ect on the financial position of the NSW PTC was that this system would have been out of pocket to the extent of $3.2 million, since, while the estimated decrease in costs was about $1.5 million, this would have been more than offset by the loss in revenue of approximately $4.7 million. In the States of Victoria and SA the railway systems would have been marginally better off. Though costs would have increased on both systems, due to the carriage of intersystem traffic, these costs would have been more than offset by the increase in revenues. The overall net effect of the hypothetical changes in traffic flows on the finances of the three railway systems was an estimated reduction in income of about $1.61 million , as indicated in Table 5.5.
(1) Cost estimates were derived from the avoidable cost model developed in Annex H.
58

TABLE 5.5 - ESTIMATED CHANGE IN RAILWAY FINANCES RESULTING FROM A REDIRECTION OF WHEAT FLOWS: 1971-72
($'OOO)
State Actual Hypothetical Variation Flows Flows
Revenue : NSW 30430 25741 -4689 VIC 10513 11972 1459 SA 1554 3133 1579
Total 42497 40846 -1651
Avoidable Costs: NSW 7 702 6230 -1472 VIC 2612 3472 860 SA 297 865 568
Total 10611 10567 - 44
Net Change in Financial Position: NSW 22728 19511 -3217 VIC 7901 8500 599 SA 1257 2268 1011
Total 31886 30279 -1607
59

SUMMARY
The results of this analysis indicate that changes in the present flow patterns of wheat would be advantageous to the wheat growers through an increase in net income resulting from a reduction in the rail freight bill. However, since wheat traffic contributes significantly to the overhead costs of railway operations, the reduction in costs to the railways from a reduction of wheat flows would be less than the loss in revenue incurred, and so the overall railway deficit would be increased. In practice the Victorian and South Australian Railways would probably obtain a net gain from the change with the increase in deficit falling upon the NSW PTC, who would'be the major loser of traffic.
On balance it would appear that a more efficient allocation of national transport resources would be achieved through better utilisation of intersystem rail facilities €or the transport of the wheat harvest. However, the potential savings are compar- atively small once the impact on rail revenues is taken into account and so a more detailed analysis, covering a wider range of issues, would be needed before any major change in operations was considered.
60

CHAPTER 6 - CONCLUSIONS The transportation of wheat marketed through the wheat stabilis- ation scheme, on the Australian mainland, involves basically four stages - delivery from farm to the AWB, storage and handling and delivery to the domestic market or ship's hold for export. The directional flows and mode of transport used to move the wheat are influenced by three institutions:
. The Australian Wheat Board:
. the State bulk handling authorities; and
. the State railway systems
During the fifth wheat stabilisation scheme the major effects of the interaction of these institutions on the transportation of wheat were firstly, that the State railways were the main mode of transport used to move wheat from the hinterland production areas to Australian mainland outlets and secondly, the directional flows of these shipments were, with minor exceptions, to terminals within the State in which the wheat was grown, even though interstate outlets may have been closer.
Over the five wheat pools considered in this report interstate consignments of wheat marketed by the AWB constituted only a small proportion of the total wheat transport task. The major interstate movements were from the mainland to Tasmania, a deficit producing State in terms of wheat used for human consump- tion. In comparison, mainland interstate consignments of wheat from NSW to Victoria, SA and Queensland, were relatively insignif- icant and were arranged to meet shipping schedules for export.
Within the institutional framework described above, estimates of the costs of the resources devoted to the transportation of the harvest on the mainland for the wheat pools, 1968-69 to 1972-73, ranged from $93 million (1972-73) to $167 million (1968-69). The costs were measured in terms of the outlays by growers and the
61

community and relate to the movement of wheat from the farm gate to the seaboard. The estimated costs constituted, on average, over the five wheat pools, about 25 per cent of the gross receipts from sales of Australian standard white wheat by the AWB.
An interstate comparison of the estimated costs of transportation showed that there were significant variations among the States. The major reasons for the cost differentials within pools were the variations in the size of the crop harvested in each State, the interrelationship in each State between rail freight rates and the distances over which wheat was hauled and the strategies of growers in delivering wheat to the AWB. In addition to the variation in seasonal fluctuations in harvest among the States, a major cause of the discrepancy in costs over the five pools was the difference in the pricing policies of each bulk handling authority ' and State railway system.
A summary of the costs borne by growers for the various segments of the transportation process for the two wheat pools 1968-69 and 1972-73 is contained in Table 6.1: The total costs of operating growers' vehicles has been assigned to the wheat enterprise, irrespective of other activities in which the vehicles may have been employed throughout the year. Therefore, the unit costs of operatingl the vehicles reflects the upper limits of the costs incurred by growers. The extreme variation between the States in the costs of delivering wheat from the farm to bulk storage arises €or a number of reasons. For example, the costs per tonne-kilometre reflect variations in the length of hauls, the carrying capacities of vehicles and the quantities of wheat delivered into bulk storage.
Under the terms of reference for the study the BTE was requested to assess the effects of marketing requirements on transport costs. The analysis was confined to the effects of the policy of the AWB to market wheat by grades. As a result of this marketing strategy growers delivering wheat to storage facilities accepting a variety of grades incur increased costs due to the increase in
62

TABLE 6.1 - ESTIMATED TRANSPORTATION COST PAID BY GRCWERS : 1968-69 AND 1972-73 WHEAT POOLS(a)
1968-69 Wheat Pool 1972-73 Wheat Pool(d)
Farm to State terminal Farm to Silo to Pool Costs (d) Farm to Farm to Silo to - Pool costs
delivery silo delivery terminal Rail ~~~~~~~ silo delivery terminal Ra,l, Storage AWS road (b) by road (b) haulage (c) Freight iz$& road (b) by road (h) haulage (c) 1kei.ght and Admin-
Handling istration _____ ~
$ per F per $ per F per $ per F per $ per $ per $ per $ per c per $ per F per $ per F per $ per $ per $ per tonne t-km tonne t-km tonne t-km tonne tonne tonne tonne t-km tonne t-km tonne t-km tonne tonne tonne
NSW - - 1.85 12.30 8.27 1.65 - 3.21 0.13 - 2.66 17.70 9.01 1.71 - 9.01 0.48
VIC 2.30 15.30 1.25 15.60 6.83 2.00 - 1.90 0.12 3.59 23.90 1.94 24.20 6.73 2.05 - 3.02 0.42
QLD - - 2.02 4.20 8.52 2.47 - 3.60 0.09 - 2.83 5.90 8.16 2.33 - 8.00 0.62
S A 4.00 7.15 1.43 10.98 3.99 2.66 - 2.41 0.14 4.00 7.15 1.43 10.98 4.22 2.85 - 4.42 0.54
W A 3.93 3.51 2.93 13.97 5.17 1.81 - 3.31 0.14 5.79 4.94 4.22 20.10 5.05 1.89 - 5.27 0.48
AUST 3.41 8.65 1.90 11.41 6.56 2.12 0.25(e) 2.94 0.13 4.46 12.00 2.62 15.78 6.63 2.17 - 5.64 0.48
-
m
(a) Tllc 1968-69 wheat pov1 was the season of the record harvest, while receivals in each State for the 1972-73 pool were more closely related to the average raceivals for the 5 pools 1968-69 to 1972-73.
(b) In the States of WA and SA estimates are based on the weighted average costs of ancillary (growers) and hire and reward cartage. Estimates for the other States are based on anclllary haulage only.
(c) Estimates based on deductions from first advance payments to growers and road haulage charges paid by bu1.k handling authorities. Excludes subsidies paid by the NSW and WA governments
(d) Estimates are the simple average costs based on pool receivals adjusted for over quota wheat.
(e) State details not available.
SOURCE: Road transportation costs - BTE estimates - Line haul and pool costs - data supplied by AWE

the turnaround time of vehicles. Furthermore, additional storage and handling costs may also arise. On the evidence available to the Bureau the premium payments for quality wheats more than offset the increase in delivery costs. However, because of the pooling arrangements for storage and handling costs, any additional storage costs that may arise from the necessity to segregate the various grades of wheat would be borne by all growers marketing wheat through the AWB, not only those producing premium grades.
The terms of reference also required the Bureau to consider the relationship between freight rates and the costs of providing the necessary transport facilities, both for rail and road, and the relationship between the size of the harvest and freight rates and costs.
In general for road transport it was found that freight rates approximated the long run average cost of providing the services. The exception occurring where excess capacity existed in the commercial road haulage industry for short haul movements from the farm to the local silo. In this situation prices reflected the short run avoidable costs of providing the services.
There was no evidence to suggest that the variation in the size of harvest significantly affected the cost to growers of operating their own vehicles. Based on the information provided to the Bureau it appears that because of the relative significance of variable to total costs of commercial road haulage operations the prices and the costs of these services would tend to vary directly in relation to fluctuations in the harvest size.
Because of the problem associated with the allocation of costs common to the various traffics transported by the railways, the analysis of the relationship between rail freight rates and costs was aimed at estimating the revenue contributions from wheat traffic to the overhead costs of the railway systems. The general conclusion was that in most States the income from the carriage of wheat contributed significantly to the overall costs
64

of railway operations. However, with the amount of information available, it is not possible for the Bureau to determine whether or not the contribution by the wheat traffic to common system costs is sufficient, bearing in mind the objective of making total system revenue equal to total cost.
In real terms, rail freight rates in each State declined over the five pools, despite seasonal fluctuations in harvests. Therefore, variations in the size of harvests did not affect the level of charges set by the railways.
The total costs of operations of both the railways and the bulk handling authorities were relatively insensitive to variations in the size of the harvests due to the importance of the fixed element of total costs in both cases.
To comply with the final specific term of reference relating to the efficiency of transport arrangements, a network analysis of railway movements of wheat in 1971-72, covering the States of NSW, Victoria and SA, was undertaken. Queensland was excluded from the analysis as there is no direct rail link in the wheat belt between NSW and Queensland. Western Australia was also excluded as interstate rail distances preclude rail movements of wheat on an economic basis. The objective of the analysis was the minimisation of expenditure by growers and the community for the transportation of wheat.
The major change in the flow patterns of wheat suggested by the analysis was to redirect wheat produced in the Riverina region of NSW through Geelong rather than the Sydney terminal. Other changes in flows included redirecting wheat from north-western Victoria to SA and the greater use of Portland as an outlet for Victorian production.
The overall reduction in the rail freight bill arising from the postulated changes in wheat flows was estimated at $1.65 million. The major savings, approximately $1.4 million, would have accrued to growers and the community .in NSW.
65

From the viewpoint of the railways this reduction in income of $1.65 million would be partially offset by a reduction in costs estimated at $0.04.4 million.
The redirection of wheat traffic as suggested in this report would have implications in fields which have not been considered in detail, such as investment in railway and bulk storage facil- ities and alterations to the institutional barriers governing the means and direction of transport of wheat. Nevertheless, the results of the study indicate that the institutional constraints on the directional flows of wheat restricts the intensive use of intersystem rail facilities that could lead to a more efficient allocation of the resources devoted to the railway industry.
66

ANNEX A
MARKETING PROCESS FOR BULK WHEAT IN AUSTRALIA
Any meaningful discussion about the transportation of wheat in Australia requires an understanding of the factors influencing the transport process. The basis of this knowledge lies in the method of marketing the Australian wheat harvest.
In this annex the discussion relates to the marketing process for the Australian wheat harvest with particular emphasis on the role of the Australian Wheat Board - the legally constituted sole marketing authority for domestic sales of wheat and international sales of Australian wheat and flour.
WHEAT MARKETING SCHEMES
The sale of the bulk of the Australian wheat harvest is conducted through centralised marketing arrangements . Currently, the formal foundation of centralised marketing in Australia is found in the wheat industry stabilisation schemes that have been in force since the 1948-49 wheat season.
To appreciate the operations of the current wheat narketing system it is necessary to review the evolutionary developments of wheat marketing in Australia that eventually led to post World War I1 centralised marketing arrangements.
As early as the latter part of the 19th century growers experi- mented with co-operative marketing of wheat(2) . However, it was not until after the start of World War I that orderly marketing was introduced in Australia . An Australian Wheat Marketing (3)
to Appendix 1. (2) Tom Connors, Australian Wheat Industry: Its Economics and
(3) Ibid p. 4. Politics, Gill Publications, Canberra, March 1972. p. 3.
67

Scheme was established on a compulsory pool basis by the Federal Government and the States of New South Wales, Victoria, Soukh Australia and Western Australia"). Initially, the scheme was to cover only the 1915-16 wheat season but was subsequently extended to cover the seasons up to 1920-21.
An Australian Wheat Board was established to administer the orderly marketing arrangements of the Australian Wheat Marketing Scheme. The authority of the Board, in accordance with the provisions of the Wheat Marketing Scheme, included arrangements for the storage and shipment of the harvest, sale of the crop and providing financial advances to growers pending sale of the wheat (2)
From the 1921-22 wheat season until the 1938-39 season when the initial wheat stabilisation scheme was implemented in Australia, voluntary pools and/or open market selling existed in the four States which had participated in the Australian Wheat Marketing Scheme, the only exception being the compulsory State wheat pool in Western Australia for the 1921-22 season. In Queensland, compulsory State pools operated from the 1921-22 season until the introduction of the national wheat stabilisation scheme incorp- orated in the Wheat Industry Assistance Act, 1938 and complementary State legi~lation(~). During the Second World War the wheat industry was organised under the National Security (Wheat Acquisition) Regulations and made subject to the Wheat Industry (War-time Control) Act, 1939 . (4)
The support price provisions of the original wheat stabilisation plan extended only to domestic sales. The home consumption price €or wheat was maintained through the imposition of a tax on the domestic sales of flour the proceeds of which were deposited in a
~ ~ ~
(1) Australia, Department of Primary Industry, The Wheat Industry and Stabilisation, Report by Sir Allan R. Callaghan, Canberra, October 1972, p. 48.
(2) Ibid, p. 48. (3) Commonwealth of Australia, Year Book, 1946-47, No. 37 ,
p.1296. (4) Callaghan op. cit., p. 51.
68

Stabilisation Fund set up by the Act''). The distribution to growers from the Fund was managed by State Governments (2) . It was not until the 1940-41 season that the stabilisation scheme was extended to cover exports . (3)
The machinery for this segment of the scheme involved, firstly, a commitment by the Federal Government to support a guaranteed price for exports and secondly, the establishment of a stabilis- ation fund to assist in financing the guarantee(41 . The fund was financed by growers through a levy on exports when prices exceeded the guaranteed price. In adverse years when export prices fell below the support price the accumulated funds were used to maintain the guaranteed price. In addition, the proceeds from the flour tax were deposited into this Fund . ( 5 )
Extension of the stabilisation scheme to cover exports was accompanied by production controls through firm registration, licensing of growers and acreage controls. These controls were administered by the Wheat Industry Stabilisation Board which was set up under the wartime Commonwealth legislation(6) . The legislative enactments governing production controls remained in force until the introduction of the first peace time wheat stabilisation scheme in December 1948 which included support price provisions for exports and domestic sales of wheat.
During the inter-war period legal decisions were made regarding the constitutional rights of the Commonwealth Government over centralised marketing programs (7). The concern for the problems confronting the wheat industry during this period found expression
(1) Wheat Industry Assistance Act 1938 , section (6). ( 2 ) Commonwealth of Australia, Year Book, No. 37 op. cit. (3) Connors, op. cit. , p. 12. (4) Connors, ibid, p. 13. (5) Commonwealth of Australia, Parliamentary Debates, 1938,
(6) Callaghan, op. cit. , p. 51. (7) For example-v Commonwealth of Australia (1936) Law
Reports, Appeal Cases.
Vol. 158, p. 2136.
69

in the Royal Commission on the wheat, flour and bread industries appointed in 1934(1). The influence of these two factors together with the experience gained by the industry in centralised market- ing arrangements underlies the structure of post World War I1 wheat marketing schemes.
Following the Second World War, Federal Parliament enacted legi-slation in the form of the Wheat Industry Stabilisation Act of 1946, with intent to establish, in peace time, a national wheat marketing organisation. However, because production controls could still be imposed not all States passed the necessary complementary legislation to give effect to this proposal . (2)
The first operative Wheat Stabilisation Scheme of the post-war period was introduced for the 1948-49 season. Further schemes have operated until the present, each one covering a five year time span except for the fifth scheme which was extended for a further twelve month,period until the end of September, 1974. The sixth scheme commenced on 1 October, 1974.
Legislative Arrangements for Wheat Stabilisation Schemes
The legislative bas,is of post World War I1 wheat stabilisation schemes is at both the State and Federal levels of government. Under the Constitution of the Commonwealth of Australia the power of the Federal Government, with respect to legislation governing trade, is limited to international transactions and trade between th,e States of the C~mmonwealth(~). Legislation covering intrastate trade is the sole province of the individual State Governments. Thus, to facilitate the operations of the wheat stabilisation schemes, Federal and complementary State legislation is necessary .
(1) Callaghan, op. cit., p. 51. ( 2 ) Commonwealth of Australia, Parliamentary Debates, 1948,
Vol. 198, p. 1447. (3) The Commonwealth of Australia Constitution Act (1900-1967)
Section 51 (I), Commonwealth of Australia, Year Book, 1973, No. 59.
stabilisation scheme is contained in Appendix 2.
(4)
(4) A listing of the relevant Acts covering the fifth wheat
70

The general objectives of the legislation governing wheat market- ing arrangements are:
. to protect the income of growers against the vagaries of the market; and
. to ensure a regular supply of a basic food to domestic consumers at equitable prices . (1)
The principle features of the Federal legislation aimed a+ achieving these objectives include:
establishment of national wheat pools; establishment of the Australian Wheat Board as the sole authority for the marketing of wheat in Australia and of wheat and wheat products exported from Australia; provision for a guaranteed price for wheat exports; and provision for the establishment of a Stabilisation Fund financed by way of an export levy (2) on wheat, by which growers contribute to maintaining the guaranteed price.
The complementary State legislation includes provisions which:
. ensure a uniform home consumption price;
. authorise an approved organisation to receive wheat intended for sale; and
. affor2. the Australian Wheat Board the status of a State statutory authority to act in respect of: (i) the purchase and sale of wheat and control of all matters relating to the storage, handling and shipment of wheat: and (ii) the licensing of receival agents in each State.
(1) Commonwealth of Australia, Parliamentary Debates, 1948,
(2) The levy is raised under the Wheat Export Charge Act applic- Vol. 198, PP- 1449, 1450.
able to the particular wheat stabilisation plan.
71

The terms of each scheme with respect to support prices") and conditions applying to the Stabilisation Fund are arranged through negotiations between the Australian Minister for Primary Industry and the Australian Wheat Growers' Federation. Formal acceptance of the terms is via the Australian Agricultural Council and enactment of the necessary legislation in the Australian Parliaments.
AUSTRALIAN WHEAT BOARD
After the outbreak of World War I1 an Australian Wheat Board was constituted under the National Security (Wheat Acquisition) Regulations (2). The authority vested in the Board included the purchase, the sale or disposal of wheat and wheat products and the management of all matters pertaining to the storage, handling and shipment of the wheat and flour (3). Under the provisions of the wartime legislation the Board was empowered to administer the stabilisation arrangements of the marketing scheme(4). The AWB was reconstituted under the Wheat Industry Stabilisation Act 1948 and its authority to administer post World War I1 wheat stabilis- ation plans has continued under successive legislative enactments . (5)
Operations of the Australian Wheat Board
The AWB has three major functions - the issuing of licences to receival agents, marketing of wheat and administration of wheat pools.
In accordance with the provisions of the legislation governing the functions of the AWB, the Board may issue a licence to a person, firm, company or State authority to secure wheat on its behalf (6) . The licence reserves to the Board the right to (1) Refer to Appendix 1 for details of support prices. (2) Wheat Acquisition Regulations, Statutory Rules 1939, No. 96,
(3) Ibid Nos. 96, 120,regulation 26. (4) Commonwealth of Australia, Parliamentary Debates, 1939,
(5) For the structure of Board representation refer to Part 2 of
(6) Wheat Industry Stabilisation Act, 1968-70, Section 16(1).
regulation 3.
Vol. 162, p. 2136.
Wheat Industry Stabilisation Act 1968-70.
72

determine grades, quality standards and dockage rates, to inspect wheat held in storage and to issue instructions for the delivery of wheat to mainland destinations. In addition, the terms of a licence require that the receival agent inform the Board of wheat receivals, claims for payment and transport accounts.
As the Australian Government is a signatory to the International Wheat Agreement‘’) the Board, in its marketing transactions, must have regard to the commitments and obligations of the Federal Government under this Agreement. Subject to these constraints, however, the Board has in effect been autonomous (2) in its day-to-day marketing activities.
Ownership of wheat is vested in the AWB upon the Board accepting deliveries from growers. Though the Board owns and markets wheat, the receival of grain, the storage and handling of wheat, the arrangement for transport from hinterland bulk storage facilities to mainland destinations and the loading of ships at terminals is undertaken on behalf of the Board by the licensed receival agents.
The AWB exports wheat to over 30 countries, in some cases negotiat- ing directly with Government purchasing agencies and in others conducting sales through international grain houses or grain merchants. A similar situation applies to the sale of flour. However, flour millers in Australia may also actively participate in export markets . (3)
Though the Board seeks to negotiate sales of existing supplies on a cash basis some sales are arranged on extended credit plans. In addition, the Board enters into long term wheat sale commit- ments . (1) Refer t;o Appendix 1 for details of the International wheat
(4)
Agreement. The legislation gives the Australian Minister for Agriculture power of direction over the Board concerning the performance of its functions and the exercise of its powers, e.g. refer to Wheat Industry Stabilisation Act 1968-70, Sectlon 13(3). Department of Primary Industry, Marketing Division, Wheat Marketing : Australia, April l9 7 3. Australian Wheat Board, Annual Report, 1973-74, p. 9.
73

Until recently Australian wheat was marketed under the general description of 'fair average quality' (faq). From the early sixties wheat has been sold according to specified classes. Prime hard and hard wheats, as well as soft wheat suitable for biscuit manufacture, command a premium over prices paid for faq quality wheats on world markets. The AWB not only actively pursues markets for the various grades of wheat but also assists the industry by providing information on market requirements . (1)
The third major function,of the AWB is the administration of the pooling arrangements (*) of the wheat stabilisation plans. This involves the determination of pool charges, payment to growers of wheat pool proceeds and the administration of the Stabilisation Fund.
The principal source of finance from which the AWB makes payments to growers is the revenue raised from sales proceeds. However, the Board raises interim loans from the Reserve Bank of Australia, which are'guaranteed by the Federal Government, to finance first advance payments to the growers.
PRIVATE SALES OF WHEAT
Private sales (3) of wheat involve transactions on the domestic market outside the wheat stabilisation scheme. Private sales involving interstate transportation of wheat operate legally under the protection of the Constitution of the Commonwealth of Australia(4). Intrastate private sales which apparently legally circumvented the jurisdicti,on of the AWB as the sole marketing authority include:
(1) Ibid, p.10. (2) Refer to Appendix 1 for details of pool system and Stabilis-
ation Fund. (3) Private sales are commonly referred to as 'black market'
sales. (4) Section 92 of the Constitution deems that trade amongst States
shall be absolutely free. Commonwealth of Australia Con- stitution Act (1900-1967).
74

. short term crop leasing arrangements;
. purchase of standing crops;
. contract growing;
. share farming or partnership arrangements between property owners and large scale wheat users; and
. on farm gristing of wheat €or subsequent sale . (1)
Legislative enactments governing the sixth Wheat Stabilisation Scheme (2) include provisions aimed at closing the loopholes in previous legislation under which intrastate sales operated . (3)
Figures on the value of private sales are not available. However, the Bureau of Agricultural Economics in its wheat industry survey for the period 1969-70 to 1971-72(4) estimated that 3 percent of total disposals of wheat were private sales taken over the mainland states.
(1) Australia, Department of Primary Industry, The Wheat Industry and Stabilisation, Report by Sir Allan R. Callaghan, Canberra,, October 1972, p. 48.
Stabilisation Scheme.
21(6) and 23 (i) (b) .
(2) Refer to Appendix 3, Annex A for details of the sixth Wheat
(3) Wheat Industry Stabilisation Act, No. 62, 1974, Section
(4) Bureau of Agricultural Economics, The Australian Wheatgrowing Industry, ?m Economic Survey, 1969-70 to 1971-72, pp. 32-34.
75

ANNEX A APPENDIX I
TECHNICAL ASPECTS RELATING TO THE WHEAT MARKETING PROCESS IN AUSTRALIA
The objectives in this appendix are to define terminology, describe the operations of particular aspects and outline agree- ments relating to the centralised marketing process of the Australian wheat harvest.
STORAGE
Silos
Silos, situated on or near railway sidings in the wheat belts, serve as the basic receival point for wheat deliveries from individual growers. Silo storages are on average less than 20,000 tonne capacity.
Sub-terminals
Sub-terminals., located in the hinterland, are usually larger storages than silos. They provide capacity €or storing carry- overs from previous seasons, for the consolidation of consignments of particular wheat varieties and to enable 'housekeeping' tasks to be carried out at country silos. The States of SA and Queensland do not operate sub-terminal facilities.
Terminals
Terminals are the storage facilities situated at the seaboard and involve substantial storage capacities ranging from 100,000 to 3 million tonnes. Used as a chief point of consolidation of wheat, they are both the loading centres for export and important sources of supply of wheat to mills and stockfeed users in coastal areas.
76

CENTRALISED MARKETING ARRANGEMENTS
Orderly Marketing
The orderly marketing of wheat refers to the arrangement whereby a central marketing authority is authorised by legislation to receive all wheat intended for sale, and to market the receivals on the domestic and international markets. The marketing authority makes progress payments to growers net of costs. These payments are financed by way of loan arrangements and from the pooled proceeds from the sale of each harvest.
Wheat Stabilisation Scheme
Wheat stabilisation schemes in Australia have normally operated over a period covering five wheat harvests. The schemes include not only orderly marketing arrangements, but also support prices for domestic and export sales.
Wheat Pool
A wheat pool refers to the receipts and expenditures, incurred either directly or indirectly by the central marketing authority, from the sale of a particular harvest. Pool payments are the returns to growers from total sales receipts net of costs.
The realisation of each pool in Australia is of no fixed duration as the AWB may make sales under conditions of varying credit arrangements to different nations or the Board may take a number of years to dispose of the harvest from a particular season.
Method of Pool Payments
The general method of calculating returns to growers is that after deductions are made for pre'miums from the sale of quality wheats, the remaining proceeds from all sales of wheat on the domestic and export markets for a particular harvest are pooled.
77

The pooled proceeds may exclude claims on the Stabilisation Fund and/or Commonwealth Consolidated Revenue to ensure that the price €or export sales is equal to that guaranteed by the Federal -Government. These pooled returns form the basis by which the AWB calculates the gross average returns from all sales. , The net average return to growers is then determined by deducting from the gross average returns contributions to the Stabilisation Fund (where applicable), pool charges, selling and mainland transport expenses.
In each State, premiums from the sale of quality wheats are pooled according to the specific grades of wheat. The average premium for each grade constitutes the premium payments to growers producing that particular strain of wheat.
The actual method of payment to growers involves a series of progress payments. On delivery of wheat to the licensed receival agent of the AWB, growers receive part payment‘’) from the Board of the final return from wheat sales. The cost of rail freight from local delivery point to the nearest export terminal in the State in which the wheat is grown is deducted by the AWB from this first advance payment. Where growers deliver direct to export terminals rail freight charges are not deducted from the first progress payment.
Dockage at various rates, according to the condition of the grain delivered, is also deducted from the first advance where wheat is below faq (Australian standard white) standard. This loss is borne by the grower. Such grain can be sold by the AWB at below the dockaged price, in which case the loss is borne by the Pool as-a whole and the converse applies where the selling price exceeds the dockaged price.
The level of the first advance is determined by Federal Cabinet each season. From the 1957-58 season to the 1972-73 wheat season
~
(1) During the fifth wheat stabilisation plan the first advance to growers averaged 74 per cent of the guaranteed price.
78

the first advance per bushel was $1.10 ($40.42 per tonne) f.0.r. terminals. For the 1973-74 season the first advance payment was increased by 10 cents per bushel to $44.09 per tonne . Since the introduction of delivery quotas in the 1969-70 season the first advance has applied to the limited deliveries set under the quotas .
(1)
(2)
Second and subsequent payment to growers range over varying periods depending on market conditions and marketing arrangements entered into by the AWB. Growers have had to wait in excess of four years for the realisation of the 1969-70, 1970-71 and the
Pool Charges
The charges deducted from sales receipts and which over the pool on a national scale include:
interest on funds borrowed by the AWB; interest on funds borrowed by the licensed rece for the purpose of storing and handling wheat;
are averaged
ival agents
costs of administration incurred by the AWB(4) and licensed receival agents(5) , including the costs of administration of a State law relating to wheat quotas , (6).
costs of transport other than that deducted from the first advance ; and costs of storing and handling wheat including capital facility allowances to offset depreciation of storage and handling equipment.
(l) Australian Wheat Board Annual Report, 1973-74, p. 37. (2) Ibid, p. 77. (3) Grain Elevators Board of NSW, Bulk Wheat , Oct. 1973 p. 22. (4) Wheat Industry Stabilisation Act 1968-70, Section 21 (5b).
L_
(5) Ibid Section 34 (1) (6) Ibid Section 34 (3) (7) Additional transport costs may arise through the logistics
of handling wheat, e.g. railway stop-over charges at sub- terminals and when wheat is moved from one storage site to another for housekeeping purposes.
79

l SUPPORT PRICES
In describing the support prices particular reference is made to the fifth stabilisation scheme which commenced in October 1968, and ended in September 1974.
Guaranteed Price
The guaranteed price is the price per bushel, fob, at export terminal ports, for faq bulk wheat, guaranteed by the Federal Government for export sales of wheat. In the fifth scheme the price applied to a maximum of 200m bushels (5.4m tonnes) of wheat for each poolt1). The price for quantities exported in excess of this amount is determined by the market.
In the fifth stabilisation scheme the guaranteed price for the 1968-69 season was fixed at $1.45 per bushel ($53.28 per tonne) fob at export ports compared with $1.64 per bushel ($60.26 per tonne) in 1967-68. This price took account of cost of production data provided by a survey of the industry carried out by BAE for the period 1964-65 to 1966-67 and recommended by the Wheat Index Committee(2). It was consistent with the price range set by the International Grains Agreement. For the 1972-73 season the guaranteed price was set at $1.57 per bushel ($57.61 per tonne) fob at ports(3) . A premium is paid on wheat grown in Western Australia and exported from that State in recognition of the
(1) This was an increase of 50m bushels over the previous scheme. The increase was a concession by the Federal Government to offset the change in assessin.g the annual variation in the guaranteed price that came into effect in the fifth scheme. GEB of NSW, op. cit., p. 8.
(2) Australian Wheat Board, Annual Report, 1968-69, p. 10, 11, 27; and Bureau of Agricultural Economics, Report on the Price Structure of Wheat for 1972-73, November 1972, p. 1; and Australia Senate, Parliamentary Debates, 1968, Vol. S.37, p. 1647-1651.
(3) Commonwealth Bureau of Census and Statistics, The Wheat Industry 1971-72 and 1972-73 preliminary, Reference Number 10.35, p. 17.
80

freight advantages of the State owing to its proximity to prin- cipal overseas markets. The premium is equivalent to the actual freight advantage up to a maximum of 2.5 cents per bushel (1) .
Annual adjustments to the guaranteed price set for the 1968-69 season were based on the movements in the BAE cost of production index which covered specified items such as farmers' cash costs, interest paid, costs of transport and wheat pool charges (2) . Items such as interest on farmers' equity and working capital, depreciation and owner-operators' allowance were treated as constants in the index(3), in contrast to the method adopted for previous stabilisation schemes.
Home Consumption Price
The home consumption price refers to the price per bushel of faq wheat, bulk basis, f.0.r. ports, on the domestic market. The price includes a loading to meet freight charges on wheat shipped to Tasmania from the mainland(4). In the fifth scheme this loading ranged from 1.0 cents per bushel (36.7 cents per tonne) in 1968-69 to approximately 2.5 cents per bushel (91.9 cents per tonne) in 1972-73 . (5)
The home consumption price of approximately $1.70 per bushel ($62.83 per tonne) in 1968-69 was set above the guaranteed price by the legislation(6) and initially applied to all domestic sales of wheat, i.e. for human consumption, stockfeed and indus- trial use. Late in 1969, the Federal and State Governments passed amending legislation which gave the AWB discretionary power to sell wheat on the domestic market for purposes other
(1) H.A. Rolfe, Industry in Australia - Wheat, p. 24. ( 2 ) Bureau of Agricultural Economics, op. cit., p.1. (3) Ibid, p. 30. (4) The loading was first introduced in the second scheme 1953-54
(5) CBCS, Op. cit. p. 13. (6) Australia, Senate, Parliamentary Debates, 1968, Vol. S37,
to 1957-58.
pp. 1647-1651.
81

than human consumption at prices below the home consumption price but not less than f.0.r. equivalent of the current guaranteed price (l). The main aim of the amendments was to check the growth of unauthorised sales of wheat, on both the intra and interstate markets . (2)
The home consumption price was adjusted annually by the same monetary amount as the guaranteed price(3). In the 1972-73 pool the home consumption price was $1.84 per bushel ($67.63 per tonne). The marginally greater absolute increase in the home consumption price (1.5 cents per bushel) compared with the increase in the guaranteed price over the first two years of the fifth scheme is partially explained by the increase in the loading (by 0.6 cents per bushel) to offset freight charges on wheat shipped to Tasmania.
, STABILISATION FUND
The Wheat Prices Stabilisation Fund is a trust account set up under each Wheat Industry Stabilisation Act. In the fifth scheme provision was made, under the Wheat Export Charge Act, 1968, for payment by growers, of a charge equivalent to the excess of returns from all export sales over the guaranteed price plus 5 cents per bushel ($1.84 per tonne), subject to a maximum of 15 cents per bushel ($5.51 per tonne). The ceiling of growers’ contributions to the fund was fixed at $80 million in the fifth scheme. Any excess beyond this amount was to be returned to
~ growers.
When the average export price falls below the guaranteed price the deficiency is made up first by drawing upon the fund if it is in
(1) Australian Wheat Board Annual Report, 1972-73 p.5. (2) Australia, Department of Primary Industry, The Wheat
Industry and Stabilisation, Report by Sir Allan R. Callaghan, Canberra, October, 1972, p. 65.
(3) Bureau of Agricultural Economics, op. cit., pp.1-4.
82
credit, in respect of up to 200m bushels for each pool. When the fund is exhausted, the Federal Government meets its obligations under the guarantee from Consolidated Revenue.
Similar arrangements regarding the working of the fund existed in previous schemes. By the end of the first scheme (1948-49 to 1952-53) growers had contributed $151.2m to the stabilisation fund. This amount, with interest added, was refunded to growers and not included in subsequent schemes. In subsequent schemes a ceiling was placed on growers' contributions to the fund. It was not until 1959-60 that growers' credit in the fund was exhausted and the Federal Government made its first contributions to the fund to meet the guarantee. Up to the 1972-73 pool the Federal Government contributed approximately $300m to the fund (1) . Approximately half of these contributions were made during the first five years of the fifth scheme(2). During the first four years of the fifth scheme the industry encountered relatively low export prices which resulted in the Federal Government contributing $140m to the fund. The overall effect of the increase in export prices for the 1972-73 harvest and the currency revaluation by the Federal Government was that the Government would contribute an estimated $10m to the fund in the fifth year of the scheme . (3)
WHEAT QUOTAS
Increased wheat production in the 1960s in countries which had formerly been large importers coincided with rising output in major wheat exporting countries including Australia. The resulting high stock levels in the late sixties throughout the world affected the Australian Wheat Board carryovers which amounted to over 7 million tonnes from the record harvest of 1968-69. Market prospects at the time indicated that the position would worsen if production were not controlled.
(1) CBCS, Op. Cit., p.15. (2) GEB of NSW, Op. cit., p. 10. (3) Ibid.
83

In March 1969 a system of delivery quotas was recommended to the Commonwealth and State governments by the Australian Wheatgrowers' Federation. Quotas for the 1969-70 season were eventually agreed upon by all governments at 9,362,000 tonnes plus a special allowance for prime hard wheat for NSW and Queensland of 354,000 tonnes. For details refer to Table A.l.l. Distribution of quotas within a State was the responsibility.of the State Government and was generally based on average deliveries over a recent period. Deliveries for the 1969-70 season of wheat other than prime hard exceeded quota.
In succeeding years the national quotas were fixed with regard to the volume of carryovers from the previous season and to market prospects"). Nevertheless, during the remaining years of the fifth stabilisation plan deliveries to the AWB fell below the national quota even though some States exceeded their individual quota allocations. For the 1973-74 season provision was made for a contingency p001,of 544,000 tonnes to be distributed among States in which deliveries exceeded quota allocations. Western Australia was the only State in the 1973-74 season to produce above its allocation. Since all other States could not fulfil their quota allocation during that season it was agreed by all States that quota restrictions would not apply to Western Australian production.
INTERNATIONAL WHEAT AGREEiWNT
Australia has been a member nation of the series of International Wheat Agreements that have operated since 1949. The Agreements comprise a consortium of signatories of wheat exporting and importing nations. The membership of the 1971 International Wheat Agreement accounted €or over 95 per cent of world trade in wheat . (2)
l (1) Australian Wheat Board, Annual Report, 1973-74, p. 19. (2) Ib,id, p. 18.
84

TABLE A.1.1 - AUSTRALIAN WHEAT QUOTAS: 1969-70 TO 1974-75 ( ' 000 tonnes)
N.S.W. Victoria S.A. W.A. Q'land Australia
1969-70 Base Quota 3,348 1,769 1,225 2,340 680 9,362 Hard Wheat Allowance 190 163 354
Total 3,538 1,769 1,225 2,340 844 9,716
1970-71 Base Quota 2,504 1,415 980 1,878 544 7,321 Prime Hard Allowance 517 299 816 Shortfall Allowance 381 13 6 517
Total 3,021 1,415 980 2,259 980 8,655
1971-72 Base Quota 2,966 1,551 1,089 2,068 599 8,274 Prime Hard Allowance 327 299 626 Shortfall Allowance 136 136 272 Durum 54 54
Total 3,484 1,551 1,089 2,068 1,034 9,226
1972-73 Base Quota 3,429 1,823 1,252 2,395 708 9,607 Prime Hard Allowance 191 163 354 Southern Hard Allowance 109 109 Durum 54 54 Special Shortfall Allowance 1969-70 191 191
Shortfall Allowance 599 16 3 762
Total 4,273 1,823 1,361 2,585 1,034 11,077
1973-74 (a) Base Quota 4,928 2,123 1,470 2,803 816 11,240 Prime Hard Allowance 191 163 354 Southern Hard Allowance 10 9 Durum 54 54 Shortfall Allowance 980 354 408 245 19 1 2,177
Total 5,253 2,477 1,987 3,048 1,170 13,934
Proportional additions to bring total to 14 million tonnes 5,275 2,490 1,995 3,065 1,175 14,000
1974-75(a)
Total Quota 5,275 2,490 1,995 3,065 1,175 14,000
(a) An additional contingency pool of 544,000 tonnes, not shown in the table, was established in the 1973-74 season to allow for States producing in excess of their quota allocation. For 1974-75 season the contingency pool was increased to 2 million tonnes.
Source: Australian Wheat Board, Annual Report, 1973-74, p. 38.
85
l '

The major objective of the consortium is price stabilisation for international marketing of wheat. Provisions of the Agreements prior to 1971 specified a price range for international trans- actions among member nations . Though there were no pricing arrangements in the International Wheat Agreement of 1971 there was provision in the Agreement €or the reintroduction of a price plan. Until the 1967 Agreement(2) the price range covered only one Cype of wheat.. In the 1967 International Grains Agreement the price ranges covered 14 types of wheat.
A further objective introduced in the 1967 Agreement has been that developed member nations, both exporters and importers, provide aid to developing nations in the form of wheat and flour €or human consumption. Under the 1971 Agreement Australia‘s aid commitment was set at 225,000 tonnes annually.
(1) Under the terms of the 1967 Agreement exporting nations undertook not to sell wheat below the agreed minimum price to any nation whether a member of the Agreement or not. Australia, Year Book, No. 55, p. 836.
(2) This Agreement was known as the International Grains Agree- ment, ibid.
86

ANNEX A APPENDIX 2
COMMONWEALTH AND STATE ACTS RELATING TO AUSTRALIAN WHEAT INDUSTRY
COMMONWEALTH ACTS
1. Wheat Research Act, 1957 No 22. 2. Wheat Tax Act, 1965 No 58. 3. Wheat Export Charge Act, 1968 No 98. 4. Wheat Industry Stabilisation Act, 1968. 5. Wheat Industry Stabilisation Act, 1968-70. 6. Wheat Industry Stabilisation Act, 1973.
STATE ACTS New South Wales
1. 2.
3. 4. 5. 6.
7. 8. 9.
Grain Elevators Act, 1954-1967, No 36. Wheat Industry Stabilisation Act, 1968 No 50. Wheat Industry Stabilisation Act, 1968 modified. Wheat Export Charge Act, 1968. Wheat Quotas Act, 1969, No 53. Wheat Industry Stabilisation and Wheat Quotas (Amendment) Act 1969 No 74. Wheat Quotas Act, 1970, No 66. Wheat Quotas Act, 1971, No 76. Wheat Industry Stabilisation and Wheat Quotas (Amendment) Act, 1973, No 88.
Victoria
1. Grain Elevators Act 1958-1971, No 6266. 2. wheat Industry Stabilisation Act, 1968-1969, No 7766. 3. Wheat Marketing Act, 1969-1971, No 7894. 4. Wheat Marketing Act, (Special Quotas), 1970, No 7976.
87

South Australia
1. Bulk Handling of Grain Act, 1955-1969. 2. Wheat Industry Stabilisation Act,.1968-1969. 3. Wheat Delivery Quotas Act, 1969-1970.
Western Australia
1. Bulk Handling Act, 1967. 2. The Wheat Industry Stabilisation Act, 1968, No 58.
Queensland
1. Wheat Pools Act, 1920-1972. 2. Wheat Industry Stabilisation Act, 1968-69. 3. Wheat Industry Stabilisation (Amendment) Act, 1969. 4. Wheat Delivery Quotas Act, 1970-1974.
88

APJNEX A APPENDIX 3
SIXTH WHEAT INDUSTRY STABILISATION PLAN
The Sixth Wheat Industry Stabilisation Plan, applies to the season commencing 1 October 1974 and the four subsequent seasons. The AWB's power extends for a further two seasons. This plan differs from the fifth plan in the following ways: (1)
. The concept of a 'guaranteed price' has been replaced by a 'stabilisation price'. This price is related to movements in the international wheat market. It was set at $73.49 per tonne f.o.b. for the 1974-75 season and is to be adjusted in the
. four succeeding seasons by the application of a formula (2) . Unlike previous plans the stabilisation price applies to all wheat exports of each season.
. The Government will contribute up to $80 million over the five season period of the plan if the Stabilisation Fund contains insufficient industry contributions to meet payments required for any season. This is subject to any government contri- butions being repaid in subsequent seasons before industry contributions are accumulated by the Fund. Any outstanding Government contributions at the end of the fifth season will be written off.
. A single home consumption price is to be applied to all wheat sold on the domestic market. That is, the special pricing arrangements €or wheat for non-human consumption (stockfeed) under the previous plan, were deleted. The home consumption price is adjusted each year (December l) from the base level of $70.41 per tonne less Tasmanian freight loading, according
(l) Australia, Senate Parliamentary Debates,1974,Vol. S.61, pp
(2) The formula is explained in Wheat Industry Stabilisation 1310-1313.
Act, 1974, p. 17.
89

to an index of cash costs and rail freight and handling charges based on the BAE wheat industry survey for the period 1969-70 to 1972-73. The constant items included in the index applicable to the Fifth Stabilisation Scheme have been omitted in the new index structure . (1)
. The term 'fair average quality' was replaced by 'Australian standard white' to improve the image of Australian wheat in the market place . (2)
. The Minister for Primary Industry still has power to issue directions to the Australian Wheat Board. However, the Government has undertaken to bear the full risk of non-payment if the Minister directs the AWB to sell wheat on terms more generous than the Board is prepared to undertake on a commercial basis.
. Legislation has been enacted to control wheat sales outside the centralised marketing scheme. This legislation is designed to close loopholes, e.g. leasing arrangements, which previously enabled growers to circumvent the requirement that all wheat intended for sale be delivered to the AWB . (3)
. The AWB was given the supplementary borrowing power to make progress payments to growers at an accelerated rate, to repay seasonal borrowings from the Reserve Bank, or to finance stock holdings for long periods.
(1) Bureau of Agricultural Economics, Sixth Wheat Stabilisation Scheme, Establishment of a Base Price Structure and Pro- cedures for Annual Variation, Canberra, November 1974,'pp.1-3.
(2) The reasons for chanqinq to 'Australian standard white are . . discussed further in Sir Allan R. Callaghan, The Wheat Industry and Stabilisation, Department of Primary Industry, October 1972.
"
(3) Australia, Senate Parliamentary Debates, op. cit., p. 1312.
90

Wheat delivery quotas have been suspended for the 1975-76 season. However the quota mechanism has been retained by giving the State Governments the option of allocating quotas in a season to individual growers. This enables the re-imposition of quotas without the requirement of a request from the growers.
91

ANNEX B
INSTITUTIONAL FRAMEWORK FOR THE TRANSPORTATION OF BULK WHEAT ON THE AUSTRALIAN MAINLAND
The objective in this annex is to highlight the institutional factors affecting the transportation of wheat marketed through the wheat stabilisation schemes in Australia. This is achieved by considerifig the physical aspects of the transportation task as a process commencing with the grower, while emphasising the relationships among the various phases of the transportation of the harvest.
Deliveries of Bulk Wheat by Growers to AWB
The task of transporting wheat begins immediately the crop is harvested"). Growers operating within the centralised marketing arrangements are under a statutory obligation to deliver their wheat to the AWB. Deliveries to tine Board are, in general, made within the State in which the wheat is grown.
The strategies employed in the industry to effect these deliveries are :
. on-farm storage prior to delivery to licensed receival agents of the Board; or
. immediate delivery to either local silo operated by the bulk handling authority or other licensed receival agent Of the Board; or
. immediate delivery to storage provided by either the bulk handling authority or the AWB at port terminals.
(1) The harvest period varies throughout the nation extending from November to March.
92

On-f arm Storage
Although the bulk of the wheat crop intended for sale is delivered to the AWB immediately after harvest, in some instances wheat is retained on the farm for delivery at a later stage. The range of on-farm grain storage facilities include mobile field bins, steel or concrete silos, grain sheds, mesh bins in open sheds and, in some cases in Western Australia, where there is little risk of summer rain, open heaps on the ground.
Grain storage capacity on wheat holdings varies from property to property. Capacity ranges from the minimum necessary to keep the header in operation during harvest and to store grain retained by the grower for his own use, to large silos . (1)
Deliveries of Wheat to Bulk Handling Authorities
In general, growers deliver their wheat to the bulk handling authority operating in their State. However, in some States relatively small quantities of wheat are delivered by growers, with the approval of the Board, direct to flour mills.
At intervals during the wheat growing season district officers of the bulk handling authority in each State survey wheat properties to ascertain estimates of the quantities, by grade, of wheat that can be expected to be delivered during the harvest to storage located in the wheat belt. These estimates form the basis of the plan whereby each State authority makes arrangements to provide capacity to receive the wheat. In addition, each bulk handling authority stipulates the grades of wheat that will be accepted at
(l) In its investigation into the wheat industry the Bureau encountered on-farm storage capacity of 1,500 tonnes in Western Australia. For a more comprehensive discussion of on-farm storage in 1971-72 refer to N.M. Nicholls and B.M. Morse 'Grain Storage on Wheatgrowing Properties', Quarterly Review of Agricultural Economics, Vol. XXVII, No 2, April 1974.
93

particular silos. Where arrangements have been nade to receive multiple grades at a silo the bulk handling authority may notify growers, during th,e harvest period, of times at which specific grades will be accepted.
Throughout the wheat belt in each State the location of storage facilities provided by the bulk handling authority is such that wheat properties are in general, within 25 kilometres of a silo. Growers, acting on their own volition, deliver wheat in bulk to the nearest local silo accepting their particular grade of wheat or to a port terminal. The liability for this segment of the transportation of wheat is the responsibility of the grower.
Bulk deliveries to the AWB by the grower are usually undertaken in his own vehicle. However, in some instances, commercial road hauliers may be employed. The types of vehicles used by the grower vary widely ranging from single axle tray body trucks of 5 tonnes carrying capacity to semi-trailers with a carrying capacity of up to 20 tonnes. The choice of particular types of vehicles depends on many factors, including the quantity of grain to be transported, the distance over which the wheat is carted, other tasks for which the vehicle can be used throughout the year and the costs of operating the vehicle . (1)
Prior to the introduction of restrictions on deliveries to the AWB receivals at local silos were accepted on a first-in-first- served basis. As growers endeavoured to deliver their wheat to the local silo as soon as possible after harvest to minimise the risk of damage to the grain by inclement weather, this method of receival commonly led to the formation of queues of vehicles. The result was often a considerable loss of time to the grower through delays in turnaround time of vehicles. However, when quota restrictions on deliveries were imposed growers were
(1) Road maintenance taxes imposed by State Governments may also have a significant influence on the size of vehicle operated by growers, e.g. in South Australia and Western Australia the maximum carrying capacity to gain exemption from the tax is 8.128 tonnes compared to 4.064 tonnes in other States-
94

assigned capacity at local storage points based on their quota allocation. Silo committees, comprised of growers delivering to a particular silo, administered this arrangement. The overall effect of quota restrictions on deliveries to local storage and the assignment of storage capacity to individual growers has been a more orderly pattern of deliveries and a reduction in the turnaround time of vehicles.
Storage and Handliilg of Bulk Wheat
The storage and handling of wheat marketed by the AWB is an essential part of the transport process. Extensive storage facilities are provided throughout the wheat belt in each State and at terminals located at major ports. Licensed bulk storage facilities for grain were provided by the AWB, the State bulk handling authorities and flour mills. Table B.l shows wheat storage capacity by ownership and location over the study period. The figures show the nominal capacity of storage facilities available in each season. The effective capacity gf each storage system depends on the throughput, that is, the rate at which the system receives and disposes of grain. In the discussion below the figures relate to nominal storage capacities.
In the 1968-69 season the record harvest, combined with the carryover of stocks, culminated in total available supplies to the AWB of 15.3 million tonnes (Table B.2), compared with total licensed bulk storage capacity on the mainland, at the beginning of the harvest, of 14 million tonnes. Victoria and Western Australia were the only States in that season where storage capacity exceeded total supplies. Over the next four years investment programs increased the storage capacity in each State. These increases, coupled with relatively smaller harvests over this period, resulted in the storage capacities in each State exceeding total supplies from the 1970-71 season onwards. However, because of seasonal variability in production, the
95

TABLE B.l - TOTAL WHEAT STORAGE CAPACITY BY STATE AND OWNERSHIP: MAINLAND AUSTRALIA - 1968-69 TO 1972-73 ('000 tonnes)
Year State 1968-69 1969-70 1970-71 1971-72 1972-73 Authority
Country Terminal Total Country Terminal Total Country Terminal Total Country Terminal Total Country Terminal Total
NSW GEB'aJ AWB
Subtotal Mi 11
VIC GEB(~) AWB Mill
Subtotal m SA CBH U)
AW B Mi 11
Subtotal WA CBH
AWB Mi 11
Subtotal QLD SWB
AWB
Subtotal Mill
Australian Total
3620 286 3906 5140 238 5378 5133 442 88
87 529 606 87 693 880 70 158 86 78
4150 443 4593 5832 164 78
403 6235 6091 1621 214 1835 2196 241 482 490 490 969 479
2437 2267 972 479
78 55 2181
133 71 44 759 2940 2746 775
115 75 3521 2821
816 494 1310 1322 735 2057 1439
31 19 50 32 19 54 54 236
847 513 1360 1354 808 2162 1703 51 28
3079 820 3899 3473 1179 4652 3453 136 41 18
177 686 422 15 33 18
1108 704 15
3233 876 4109 4177 1616 5793 4172 33 15
826 46 872 825 56 881 785 9 9 123 9 132 89
17 14 31 18 843 69 912 966
14 32 17 79 1045 891
- - - -
-
11254 2660 13914 15075 3681 18756 15678
238 87
403 78
350 544
938 44
892 50
963 21
1196 395
1606 15
76
15 91
-
4001
5371 4523 238 967 874 87 156 94 6494 5491
87 412
2617 2307 354 1023 470 551 119 44 75 3759 2821 980
2331 1673 928
49 26 13 20
~2666 1699 961 4649 3540 1204 1099 718 30 17
419
5778 4275 1641 18
861 836 90 89 165 - 32 16 15 982 1017 105
286 -
19679 15303 4099
4761 4548 316 961 868
4864 87 955
181 94 5903 5510 490
87 181 6000
2661 2318 1021 470 551 1021
354 2672
119 64 3801 2852
43 948
107 3800
2601 1622 922 13 - 13
2544 13
46 25 2660 1647
19 954 2601
44
4744 4233 1204 1137 723 419
5437 1142
35 18 16 5916 4974 1639 6613
34
165 112 926 982 97 1079
31 17 112
15 1122 1111 112
32 1223
-
19402 16094 4143 20237
(a) Excludes storages in Southern NSW serviced by Victorian Railways and operated by GEB-VIC. (b) Includes storages detailed in (a). Source: AWB, Gristinq and Storage Capacity of Mills, various years; AWB, Annual Reports, various issues.

TABLE E.2 - AVAILABLE SUPPLIES OF WHEAT, MAINLAND AUSTRALIA 1968-69 TO 1972-73
( ' 000 tonnes)
State 1968-69 1969-70 1970-71 1971-72 1972-73
NSW 5622 6269 50 89 3403 1908 Vic 2935 4022 3000 2493 1474 SA 2292 2717 1884 1678 975 WA 3423 3406 3871 2778 2017 Q Id 1072 511 214 666 379
AUSTRALIA 15344 16925 14058 11018 6753
Note: Available supplies equal carryover stock from previous year
Source: Various AWB Annual Reports and Supplementary Stocks and plus deliveries to the AWB.
Sales Summary.
97

vagaries of export sales and the need to segregate the various types and grades of grain held in bulk storage, this apparent excess of capacity does not necessarily imply that all regions throughout the nation had adequate storage capacity.
Segregation
The AWB policy of marketing wheat by grades influences the management of. storage space. This requires segregation of the various grades of wheat, thus reducing the effective storage space available in a season.
Table B.3 shows wheat receivals by grade for the study period. The greatest requirement for segregation was in NSW where receivals include fair average quality (now Australian standard white), prime hard and hard (northern and southern), falcon, durum, soft and off-grade. Four grades are shown for Queensland in the table and only three for the other States.
The State bulk handling authorities also handle grains other than wheat. With the exception of the 1972-73 harvest in Queensland, wheat was the major grain crop handled by the mainland bulk handling authorities. In 1972-73 the quantities of grain sorghum and sunflower handled by the State Wheat Board in Queensland almost doubled that of wheat. Further details are given in Table B.4.
The bulk handling authorities in each State provided the vast majority of the storage facilities. From the 1971-72 to the 1972-73 season the nominal storage capacity of the authorities in each State exceeded pool receivals. This illustrates the objective of the authorities which is aimed at providing storage systems to receive wheat almost immediately it is harvested . (1)
(1) A discussion on the operations of the bulk handling author- ~- ~~~~
ities is contained in Annex C.
98

TABLE B. 3 - RECEIVALS OF WHEAT BY GRADE: (a) AUSTRALIAN WHEAT BOARD 1968-69 to 1972-73
(‘000 tonnes)
State Grade 1968-69 1969-70 1970-71 1971-72 1972-73 ~~~
- SA
wn
NSW Northern-
faq Prime Hard Hard Durum Off-grade
South/West- faq Prime Hard Hard SOf t Off-grade Falcon
Total
faq Hard Of f-grade
Total
faq Hard Off-grade
Total
f aq Hard Off-grade
Total
- QLD f aq Prime Hard Hard Off -grade
Total
1474 - (b) 724 i10 - 125 - - 165 15 81
2837 2024 75 101 - - - - 82 27 - -
50 255 34 - 355
1443 92 33 - 309 15
20 7 347 74 - 74
984 82 12 -
166 60
2 136
6 9
10 0
912 13 213 31 22 -
5357 3968 2586 2006 1444
2558 2275 857 1609 1131 20 54 28
18 63 14 85 3
2576 2338 891 1748 1162
- -
1914 1201 573 1044 561 25 3 284 102 117 153 17 31 6 135 4
2184 1516 C81 1296 71 8
2748 1560 2667 1652 1623 - - - . - 65 127 38 21 265 78
2875 1598 2688 1917 1766
110 - 8 86 34 62 505 164 - 163 18 - 118 27 119 8 36 67
1023 3 16 88 666 349
- 125 -
AUSTRALIA TOTAL 13988 9736 6934 7633 5439
(a) Receivals not adjusted for over quota wheats. (b) NSW Northern faq renamed Northern Hard in 1969-70 season. Source: Australian Wheat Board, Annual Report, 1973-74.
99

TABLE B.4 - GRAIN DELIVERIES EX-FARM TO BULK HANDLING AUTHORITIES: 1970-71 TO 1972-73 ('000 tonnes)
Grain New South Wales - Western Australia - Victoria - Grain Elevators Co-operative Bulk Grain Elevators Co-operative State Wheat Board Handling Ltd Board Bulk Handling Board
South Australia - Queensland - Limited
70-71 71-72 72-73 70-71 71-72 72-73 70-71 71-72 72-73 70-71 71-72 72-73 70-71 71-72 72-73
~ Wheat 2586 2006 1444 2688 1917 1766 891 1748 1162 681 1296 718 88 666 349 g Oats - - - 283 80 8 - - - 22 20 2 - - -
Barley - - - 684 874 426 222 272 92 580 850 348 24 138 - Grain sorghum 343 150 158 - - - Maize 6 1 - - Sunflower 5 41 22 Other
- - - - - - 171 595 587 - - - - - - - - - - -
- - - - - - - - - - 41 57 16 4 - 1 4 6 22 35 - - - - - - 1
~~~ ~ ~ ~~
Source: Wheat - Australian Wheat Board, Annual Report, 1973-74. Other grains - various State Bulk Handling Authorities' Annual Reports up to 1972-73, and statistics supplied by the State Wheat Board, Queensland.

In the wheat belt, most storage facilities are located on railway property, a consequence of the contractual arrangements between railways and the bulk handling authorities. In all States, except South Australia, port terminals are serviced by both road and rail infrastructure. In South Australia two port terminals are. situated off-rail.
I
The Australian Wheat Board is responsible for the restitution of costs incurred by each State bulk handiing authority €or the storage and handling of wheat. However, the remuneration paid by the Board is subject to agreement between the Australian Minister for Primary Industry and the appropriate State Government Minister (
These payments by the AWB form part of the pool charges.
Line Haul Operations
Most of the wheat stored in the hinterland by the bulk handling authorities is moved to a port within the State where it is grown8 even though an interstate outlet may be closer. The major portion of this line haul transportation of the wheat is under- taken by the railways.
The bulk handling authority in each State arranges with the railways for the placement of rolling stock to transport wheat to mainland destinations to meet the requirements of AWB sales. Each authority is also responsible €or providing labour to load and unload rail trucks.
In the States of South Australia and Western Australia the bulk handling authorities utilise commercial road transport, in addition to the State railway system, to move bulk wheat from country storage to port terminals. Except in Queensland, where all country storage facilities are serviced by rail, bulk handling authorities use commercial road haulage to clear off-rail country silos to either a rail head or port terminal.
101
The costs of line haul transportation is paid by the AWB , (1)
from funds deducted for this purpose from the first advance payments to growers. In general these deductions are equal to the rail freight charge from local silo to the nearest intrastate port terminal. Should line haul costs in any State exceed total growers' deductions the excess is debited to the wheat pool and then averaged over all deliveries to the Board throughout Australia.
In all States excepting New South Wales and Queensland, some growers, even when local stbrage is available, employ either their own vehicles or contract road haulage to transport wheat directly from farm to the seaboard terminal. In these circum- stances, the grower is directly responsible €or costs of cartage and the AWB does not deduct line haul freight charges from the first advance payments.
The percentage distribution of the road line haul task of moving wheat from the hinterland to seaboard terminals for the years 1968-69 to 1972-73 is contained in Table B.5. Except in South Australia where road transportation ranged up to 34 per cent of the estimated tonne- kilometres performed, road transport formed only a relatively small proportion of the total line haul task . (2)
WHEAT CONSIGNMENTS BETWEEN BULK HANDLING AUTHORITIES
The information in Table B.6, which shows the quantifies of interstate movements of wheat marketed through the wheat stabilis- ation scheme for the period 1968-69 to 1972-73, illustrates the relatively insignificant quantities of wheat that were transported between the States. The data in the table excludes certain consignments of wheat from the Riverina r-egion of New South Wales to Victoria. Parts of this region are serviced by the Victorian
(1) In the case of road transport the cost is initially borne by the bulk handling authority which is then reimbursed by the AWB . moved by road in South Australia in 1970-71 was the result of a poor harvest in the State.
(2) The comparatively small quantities of wheat, 11 per cent,
102

TABLE B. 5 - TONNE-KILOMETRES PERFORMED BY ROAD (a) LINE HAUL TRANSPORTATION AS A PERCENTAGE OF TOTAL LINE HAUL TRANSPORT TASK(^) MAINLAND AUSTRALIA: 1968-69 TO 1972-73
(Per cent)
State 1968-69 1969-70 1970-71 1971-72 1972-73
NSW - - - - - Vi c 0. oa 0.05 - 0.03 0.03
Qld SA 34.0 la. o 11.0 23.0 20.0 WA 13.0 8.0 9.0 7.0 8.0 Total 4.0 2.0 2.0 2.0 3.0
- - - - -
(a) Excludes road haulage from farm to silo. (b) Road plus rail transport. Source: Bureau of Transport Economics estimates.
TABLE B.6 - WHEAT MOVEMENTS BETWEEN BULK HANDLING AUTHORITIES: AUSTRALIA- 1968-69 TO 1972-73
( ' 000 tonnes)
Year Ending 30 November
State
NSW VIC SA WA QLD TAS
1969
1970
1971
1972
1973
Imports Exports
Imports Exports Imports Exports Imports Exports Imports Exports
5 15
15 9 16 9 19 23 97 26 5
45
50
46 1 31 1 42 2 33
Source: Australian Wheat Board, Annual Report, Various Issues.
103

Railways and the bulk storage facilities on these lines are owned and operated by the Victorian Grain Elevators Board. Because of this unique transportation arrangement between the two States, deliveries to bulk storage on these lines and thence to Victorian outlets, though technically interstate movements, are classified for central marketing operations as intrastate movements.
Over-the five year period the bulk of interstate consignments occurred between the mainland and Tasmania'') . The other major interstate movements were from New South Wales to Victoria, except in 1970-71 when the bulk of interstate exports from New South Wales were to Queensland.
Over the study period the bulk of interstate mainland movements of wheat were arranged to meet shipping schedules €or exports. The general pattern for consigning wheat from New South Wales to either Victoria or Queensland was to move the wheat from bulk storage in the wheat belt of New South Wales by road transport to storage facilities operated by the bulk handling authorities in the other States, and then by rail transport to mainland outlets. While direct intersystem rail movements of wheat did occur during this period, they were the exception rather than the rule.
Intersystem rail consignments of wheat have been re,stricted over the years primarily as a result of each State Government, in fostering economic development within its borders, adopting a policy of developing their own railway system as a separate entity from that of other systems.
This policy has led to a 'tree' of rail tracks in each State radiating from the State capital or major ports. A further facet
(1) Tasmania is a de'ficit producing State in terms of human consumption and imports wheat from the mainland. The freight charges €or shipment to Tasmania are met from a
~~
I surcharge on domestic sales on the mainland.
104

of this development is that the wheat belts in each of the eastern States are currently serviced by rail track of different gauge S.
Notwithstanding this problem of the break of gauge, wheat consign- ments can be transhipped from rail wagons of one system to those of another at stations bordering the two rail systems where the rail tracks are adjacent, for example, Tocumwal in New South Wales. However, direct intersystem rail movements in the wheat belt between New South Wales and Queensland are precluded. In New South Wales the Northern Line, servicing the wheat belt in the north west of the State, terminates at Boggabilla which is about eight kilometres by road from Goondiwindi on rail in Queensland.
105

ANNEX C
OPERATIONS OF STATE BULK HANDLING AUTHORITIES
The aim in this annex is to provide the background to the operations of each State bulk handling authority. Following a brief discussion of the role of bulk handling authorities the origin of each auth6rity, the method of financing operations and, with the exception of Queensland, an outline of the financial structure of each authority during the study period is given.
STATE BULK HANDLING AUTHORITIES
The primary role of State bulk handling authorities is to act as the agents for the AWB with regard to the receival, storage, handling and distribution of wheat. The operations of each authority include:
. provision and maintenance of a country elevator system and terminal facilities for the storage and handling of grain;
. provision of labour to operate the elevator system;
. arrangements for the segregation of different grades of wheat and other grains in the elevator system;
. arrangements to control pest infestation of wheat in storage;
. provision of wheat (by quantity and grade) as specified by the Australian Wheat Board and arrangements for the transportation of the consignments to destinations nominated by the AWB; and
. administration of the delivery quota system.
GRAIN ELEVATORS BOARD OF NEW SOUTH WALES
The elevator system for the bulk handling of wheat in New South Wales began operations in the 1920-21 wheat season"). The State
(1) The first trial run of bulk handling of wheat in Australia occurred at Peak Hill in NSW in 1918. Grain Elevators ,
Board of NSW, 50 Years of Bulk Grain Handling in NSW, 1972, p. 7.
106

Wheat Board, which was then in existence to administer the pooling arrangements or orderly marketing, leased the storage
l
facilities from the State Department of Agriculture. In the
interests. From the 1923-24 wheat season, when the elevator following two seasons the elevator system was leased to private
the Grain Elevators Board of NSW, the elevator system was admin- system reverted to a public utility, until the establishment of
of Agriculture . istered by the Government Grain Elevator Branch of the Department
(1)
In 1955 the Grain Elevators Board (GEB) of New South Wales was constituted as a statutory authority'2) . The GEB is a corporate body with the primary function of receiving, storing and handling wheat(3). In accordance with the provisions of the complementary Federal and State legislation governing the wheat stabilisation schemes the GEB is a licensed receival agent of the AWB in New South Wales.
8 .
The Grain Elevators Board was authorised to handle grains other than wheat by the l967 amendment to the Grain Elevators Act, provided that in so doing the Board's performance of its functions in relation to wheat were not prejudiced. The GEB has subsequently received into storage sorghum, maize, sunflower seed and soybeans. The Board or other owner/trustees for commodities other than wheat pay specified storage and handling charges and undertake to clear all stocks from GEB facilities prior to the commencement of the next wheat season(4) . The GEB arranges storage facilities so that the various grains and oilseeds, as well as the different grades of wheat handled, are segregated while in store.
Financial Structure
The GEB may obtain finance for investment in storage and handling
(1) Ibid, p. 11. (2) Grain Elevators Act, NSW 1954-67 Section 7 (2). (3) Ibid , sections 9 and 12. (4) Grain Elevators Board of NSW, ibid., p. 16.
107

facilities by short term bank borrowing, debenture and stock issues for which the NSW Government may set the limit. Debenture raisings also require approval by the Loan Council within the State loan programme.
As a licensed receival agent of the AWB expenses incurred by the GEB for its handling of the NSW wheat crop become the responsib- ility of the AWB subject to agreement between the Federal Minister for .Primary Industry and the State Minister for Agriculture. In accordance with this procedure, operating expenses (net of handling charges €or coarse grains and other income), interest and loan expenses, depreciation and hiring charges on grain handling assets not yet fully depreciated are reimbursed by the AWB. Audited accounts of the GEB must be submitted to the Parliament of NSW.
Table C.l shows the broad structure of assets and liabilities of the GEB. Total liabilities increased from $68.4m in 1968-69 to $87.8m in 1972-73. Of this increase, the rise in net private loans was $14.2m and in reserves and provisions $6.3m. Net loan and advance liabilities to the State Treasury fell by $1.4m in the same period.
Of the increase in total assets from $68.4m to $87.8m fixed assets in handling and storage installations accounted for $7.5m and additions to other assets such as investments $11.9m.
GRAIN ELEVATORS BOARD - VICTORIA The Grain Elevators Board of Victoria consisting of three members was set up under powers given to the Victorian Government by the Grain Elevators Act of 1934(1). This Act was passed to provide for the bulk handling of wheat in the State of Victoria. In 1936
(1) Victorian Year Book, 1970, p. 324.
108

TABLE C.l - ASSETS AND LIABILITIES: GRAIN ELEVATORS BOARD OF NEW SOUTH WALES - 1968-69 TO 1972-73
LIABILITIES 68-69 69-70 70-71 71-72 72-73 - $m % $m % $m % $m 9; $m %
Net Loan Liability to 'Treasury and Net 25.999 38.0 26.369 33.8 26.100 32.1 25.372 29.5 24.600 28.0 Treasury Advances
Net Private Loans 30.083 44.0 37.327 47.8 39.176 48.2 43.076 50.0 44.319 50.5
g Reserves and 11.328 16.5 12.565 16.1 14.066 17.3 15.669 1.8.2 17.590 20.0 \D Provisions
Other Liabilities 1.030 1.5 1.753 2.3 1.901 2.4 1.997 2.3 1.304 1.5
'I'OT'AL LIABILITIES 68.440 100.0 78.014 100.0 81.243 100.0 86.114 100.0 87.813 100.0 ~ ~ ~~ ~ ~~~
ASSETS
Fixed Assets afLcr Depreciation 64.373 94.1 70.575 90.5 71.749 88.3 72.220 83.9 71.821 81.8
Other Assets including Sinking Fund €or 4.067 5.9 7.439 9.5 9.494 11.7 13.894 16.1 15.992 18.2 Private Loans
TOTAL ASSETS 68.440 100.0 78.014 100.0 81.243 100.0 86.114 100.0 87,813 100.0
Source: Grain Elevators Board of NSW, Annual Report - various issues.

the Board built its port terminal at Geelong on land vested in the Geelong Harbour Trust . It was not until the 1939-40 wheat season that the GEB first received and shipped bulk wheat .
(1) (2)
As the bulk handling authority for the State of Victoria the GEB became the licensed receival agent in Victoria for the Australian Wheat Board under the Federal and State wheat stabilisation legislation.
The Board was given power to handle bulk barley by an amendment in 1963 to the Grain Elevators Act(3). Bulk barley receivals began in the following season. Storage must be provided on a segregated basis for both wheat and barley.
Financial Structure
Finance may be raised by the GEB by bank overdraft or by debenture issue under guarantee by the State Government of Victoria and subject to approval by the Loan Council. Handling and capital charges in connection with wheat storage are reimbursed by the AWB .
The broad structure of the GEB assets and liabilities is shown in Table C.2. Over the five year period 1968-69 to 1972-73 loan finance remained nearly constant in absolute terms, and fell as a proportion of total liabilities from 75 per cent to 70 per cent. Reserves, sinking funds and accumulated revenue increased from $8.7m in 1968-69 to $11.5m in 1972-73, ie from 23 per cent to 28 per cent of total liabilities. Over the same period the value of fixed assets in handling and storage facilities less depreciation and renewal funds fell from $25.3 million in 1968-69 to $21.5m in 1972-73. On the other hand, non-fixed assets principally invest- ments, increased from $12.6m to $19.3m, i.e. from 33 per cent to 47 per cent of total assets. (1) Victorian Year Book , 1973. (2) Victorian Year Book, 1970, p. 325. (3) Capacity is made available at Portland by arrangement with
the Portland Harbour Trust.
110
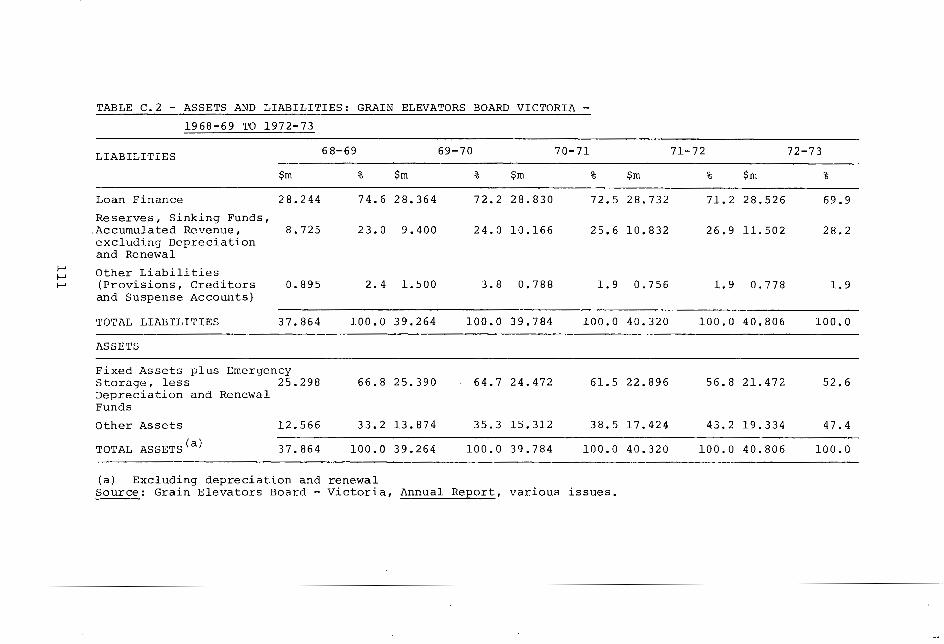
TABLE C.2 - ASSETS AND LIABILITIES: GRAIN ELEVATORS BOARD VICTORIA - 1968-69 TO 1972-73
LIABILITIES 68-69 69-70 70-71 71-72 72-73
$m % $m % $m 8 $m 8 $m 8
Loan Finance 28.244 74.6 28.364 72.2 28.830 72.5 28.732 71.2 28.526 69.9 Reserves, Sinking Funds, Accumulated Revenue , 8.725 23.0 9.400 24.0 10.166 25.6 10.832 26.9 11.502 28.2 excluding Depreciation and Renewal
L Other Liabilities P (Provisions, Creditors 0.895 2.4 1.500 3.8 0.788 1.9 0.756 1.9 0.778 1.9
and Suspense Accounts)
TOTAL LIABILITIES 37.864 100.0 39.264 100.0 39.784 100.0 40.320 100.0 40.806 100.0
ASSETS
Fixed Assets plus Emergency Storage, less 25.298 66.8 25.390 64.7 24.472 61.5 22.896 56.8 21.472 52.6 Depreciation and Renewal Funds Other Assets 12.566 33.2 13.874 35.3 15.312 38.5 17.424 43.2 19.334 47.4
TOTAL ASSETS (a) 37.864 100.0 39.264 100.0 39.784 100.0 40.320 100.0 40.806 100.0
(a) Excluding depreciation and renewal Source: Grain Elevators Board - Victoria, Annual Report, various issues.

SOUTH AUSTRALIAN CO-OPERATIVE BULK HANDLING LTD
South AustralianCa-operative Bulk Handling Ltd (SACBH) began in 1954 as a non profit-making growers' co-operative organisation set up to handle bulk grain. Efforts had been made since 1908 to establish bulk handling in South Australia''). However, it was not until 1952 that the first facilities were installed at Ardrossan. These facilities had been planned originally to handle dolomite quarried by BHP and the State Government subsequently stipulated grain . (2)
that they should also be available to handle bulk
Incorporation of the company in 1954 was followed in 1955 by the State Government granting to it exclusive rights over handling grain in bulk within the State (3) . Initial finance was negotiated from the Commonwealth Trading Bank of $2 million and from the State Government $1 million . (4)
The Company has power to store and handle grains other than 'wheat(5) . Segregation of wheat by grade , and of other grains is the responsibility of the company.
Financial Structure
The company can raise finance by borrowing from the Commonwealth Trading Bank of Australia. However its most important source of finance is the system of interest free tolls on all growers authorised by the Bulk Handling of Grain Act. Tolls levied in 1975 were 2 cents per bushel and 5 cents per bushel delivered for wheat and barley respectively. Repayment of tolls is on the following basis: for wheat, an annual repayment in each of nine years of one ninth of the total of the previous twelve yearly tolls; €or barley, an annual repayment in each of twelve years on one-twelfth .of the total of the previous twelve yearly tolls. (1) South Australian Co-operative Bulk Handling Ltd, Home for a
Harvest, p. 5. Ibid, pp. 5,6. Ibid, pp. 10,ll. , Ibid Bulk Handling of Grain Act,
112
SA 1955 , Section 33.

Wheat handling expenses incurred by the company are recouped from the AWB in accordance with the company acting as its licensed receival agent in the State of South Australia.
The Australian Barley Board (ABB) uses SACBH silo facilities for barley storage, and pays SACBH handling charges and a capital facilities allowance . (1)
The structure of financing is shown in Table C.3. During the period 1968-69 to 1972-73 finance from growers by tolls increased from $21.2m to $27.3m. Of this increase $1.2m represented funds contributed by wheat growers and the remainder from barley growers. However, consolidated funds comprising ploughed back profits increased from $8.9m in 1968-69 to $18.7m in 1972-73, i.e. from 26 per cent to 39 per cent of total liabilities. The bulk of total funds, finance fixed assets in handling and storage facili-ties.
CO-OPERATIVE BULK HANDLING LTD - WESTERN AUSTRALIA Co-operative Bulk Handling Ltd (CBH) was registered in Western Australia in 1933 as a growers' co-operative handling organisation The idea of bulk grain handling was first investigated in Western Australia in 1913 by the Bulk Handling of Grain Advisory Board. Later in.1920 the Western Australian Grain Growers' Co-operative was established for the same purpose, but was later abandoned . (2)
In 1922 steps were taken to set up a Co-operative Wheat Pool of Western Australia by Westralian Farmers Co-operative Ltd together with the Co-operative Federation and the Primary Producers' Ass~ciation'~). The reserve funds which resulted from the Co-operative Wheat Pool contributed to the initial capital of CBH and a similar contribution was made by 4estralian Farmers Co-operative Ltd . (1) Personal contact with representatives of the AWE. (2) Co-operative Bulk Handling Ltd, A Co-operative Enterprise,
' (4)
p.8. (3) Ibid, p.7. (4) Ibid, pp. 7,15.
113

TABLE C. 3 - ASSETS AND LIABILITIES: SOUTH AUSTRALIAN CO-OPERATIVE BULK HANDLING LTD - 1968-69 TO 1972-73
~- ~
LIABILITIES 68-69 69-70 70-71 71-72 72-73
~ ~~ ~
From Growers - Wheat Toll Advances 18.6 54.4 19.8 49.9 20.2 48.9 20.4 44.7 19.8 41.4 - Barley Toll Advances 2.6 7.6 3.6 9.0 4.9 11.9 6.7 14.7 7.5 15.7
P Consolidated Funds 8.9 26.0 11.5 29.0 13.4 32.4 15.9 34.9 18.7 P
39 .l Ip Other Liabilities 4.1 12.0 4.8 12.1 2.8 6.8 2.6 5.7 1.7 3.8
TOTAL LIABILITIES 34.2 100.0 39.7 100.0 41.3 100.0 45.6 100.0 47.7 100.0
ASSETS
Fixed Assets Plus Emergency Storage after 33.7 98.5 38.9 98.0 40.9 99.0 43.5 95.4 45.1 96.0 Depreciation Other Assets 0.5 1.5 0.8 2.0 0.4 1.0 2.1 4.6 2.6 4.0
~~ ~~~ ~
TOTAL ASSETS 34.2 100.0 39.7 100.0 41.3 100.0 45.6 100.0 47.7 100.0 ~~~ ~ ~~~
Source: South Australian Co-operative Bulk Handling Ltd. Annual Report, various issues.

Aftx?r incorporation in 1933 the company took over five sidings from Westralian Farmers and planned another 48 (l). Difficulties in gaining acceptance of the idea of bulk handling in the farming community as a whole resulted in a Royal Commission. As a result of its recommendations legislation was initiated to make thz company the bulk handling authority €or wheat. Despite opposition, the Bulk Handling Act of 1935 was passed and came into effect on 1 February 1936(2), giving the company the sole right of receiving and handling wheat until 31 December 1985 (3) .
A deed of trust with the growers provided that the organisation would be handed over to their control when the initial borrowings froan the Trustees of the Wheat Pool, Westralian Farmers Ltd and Prudential Assurance CO Ltd., had been repaid and at the latest by 1948(4). Growers‘ foundation tolls enabled these borrowings to be progressively repaid up to October 1943 by which time the feasible storage and handling construction programme was also completed ( 5, . In October 1943 the company was formally handed over to grower control and financing was then by means of deben- tures issued for foundation tolls paid since 1933(6) as part of a revolving toll fund. In addition, port terminal facilities were introduced in 1952 (7) .
Co-operative Bulk Handling Ltd is the licensed receiver for the Australian Wheat Board in Western Australia under the State and Federal Wheat Stabilisation legislation.
Although the 1935 legislation facilitated the handling by the cmpany of grains other than wheat(8) it was not until the
(1) Ibid, p.15. (2) Ibid, p. 16. (3) Bulk Handling Act, 1935, Section 3. (4) Co-operative Bulk Handling Ltd., op. cit., p. 44. (5) Ibid. (6) Ibid.
(8) Grain, in the Bulk Handling Act, 1935, section 2, was (7) Ibid.
defined as wheat and barley.
115

1951-52 season that oats and barley were handled by the company at the request of growers''). Since 1967-68 linseed and sorghum I
were received and in 1970-71 and 1971-72 rapeseed and lupins also . (2)
Financial Structure
The company may finance its activities through bank credit, the issue of securities and by borrowing from grower-shareholders. The first two avenues of finance require State Government approval. However, borrowing by debentures need not go through the Loan Council since it falls under the Industries Assistance Act of
~ Western Australia by which the State Government may give assistance to any industry within the State . (3)
~
Borrowing from growers under the Bulk Handling Act is by means of foundation tolls and port equipment tolls, the maximum rates of which may be 5 cents and 2 cents per bushel delivered respect- i~ely'~). Both tolls may be used to finance handling facilities or to repay borrowings made for the same purpose. Port equipment tolls are specifically intended to finance bulk handling facilities at ports, and foundation tolls, country as well as port facilities. Debentures are subsequently issued to-growers on the basis of tolls paid over the previous ten years. Repayment is by annual payments of one tenth of the total capital sum covered by the debenture .
,
(5)
In its role of licensed receiver of wheat for the AWB the company recoups wheat handling expenses from the Board. Expenses of handling other grains such as oats, barley, linseed, rapeseed and lupins are recouped from marketing agencies for other grains.
~ (1) Ibid, p. 21. (2) Co-operative Bulk Handling Ltd, Annual Report, 31 Oct. 1973. (3) Personal contact with representatives of CBH. (4) Bulk Handling Act 1967, sections 31 and 32. In 1975 the
combined foundation/port equipment toll was 5 cents per bushel.
(5) Personal contact with CBH.
116

Storage and handling expenses are charged at the same rate to all grains on a volume basis (l). Financial reports of the company must be placed before the Parliament of Western Australia each year . (2)
The importance of grower finance in Western Australia is shown in Table C.4. Issued capital, debentures, interest bearing deposits and toll advances increased from $35.5m in 1968-69 to $51.6m in 1972-73 but represented a proportion of total liabilities falling from 64.3 per cent in 1968-69 to 50.8 per cent in 1972-73. This has been due to the growth of term loans from non-grower sources. Term loan commitments to non-growers increased in 1971-72 from $0.086m to $38.08m making it the most important source of finance in the five year period.
Figures for the company's assets are affected by the term loan commitment made in 1971-72 which increased other (non-fixed) assets in the form of moneys at deposit. These have been reduced in later years.
STATE WHEAT BOARD - QUEENSLAND The State Wheat Board (SWB) was established by the Queensland Government under the Wheat Pool Act of 1920, which conferred powers on the Board in respect of marketing of wheat in the 1920-21 season. These powers were progressively extended until the 1937-38 season.
Under the National Security (Wheat Acquisition) Regulations of 1939 which gave authority to the AWB to control production and marketing of the Australian wheat crop, the functions of the SWB were taken over for the period of World War 11.
The SWB reverted to its original functions by virtue of the
(1) Personal contact with CBH. (2) Bulk Handling Act 1967, section 12.
117

.
TABLE C.4 - ASSETS AND LIABILITIES: CO-OPERATIVE BULK HANDLING LTD (AND SUBSIDIARIES) - WESTERN AUSTRALIA : 1968-69 TO 1972-73
~ ~~ ~~ ~ ~
68-69 69-70 70-71 71-72 72-73
LIABILITIES $m 8 $m % $m % $m % $m %
From Growers - - Issued Capital 0.031 0.06 0.031 0.06 0.031 0.06 0.031 0.03 0.031 0.03
- Debentures and Interest 29.172 52.9 27.399 51.7 25.655 46.8 22.497 23.31 19.276 19.0
- Toll Advances 6.275 11.4 9.631 18.2 16.066 29.3 22.084 22.9 32.329 31.8
L Reserves 6.378 11.6 4.091 7.7 4.694 8.6 8.185 8.5 6.512 6.4
Bearing Deposits
Other Liabilities (Non-Growers) - Term 1.000 1.8 1.000 1.9 0.086 0.2 38.083 39.5 38.080 37.5 - Current 12.313 22.3 10.880 20.5 8.289 15.1 5.625 5.8 5.365 5.3
TOTAL LIABILITIES 55.169 100.0 53.032 100.0 54.821 100.0 96.505 100.0 101.592 100.0
ASSETS
Fixed Assets after Depreciation 52.905 95.9 50.228 94.7 52.345 95.5 58.785 60.9 76.769 75.6 Other Assets 2.264 4.1 2.804 5.3 2.476 4.5 37.720 39.1 24.823 24.4
TOTAL ASSETS 55.169 100.0 53.032 100.0 54.821 100.0 96.505 100.0 101.592 100.0
Source: Co-operative Bulk Handling Ltd, Annual Report various issues.

Wheat Industry Stabilisation Act, 1948 (Queensland). Also in that year, after legislation concerning the first Wheat Industry Stabilisation Plan for Australia came into force, the SWB became the licensed receival agent of the AWB.
SWB facilities also handle grain crops other than wheat on behalf of other agricultural organisations (l’ . Segregation of premium wheats and other grains is the responsibility of the SWB.
Financial Structure
Under the Wheat Pool Act 1920-1972, the SWB is entitled to raise finance through mortgage over its assets, through bank arrangements or from the Commonwealth Government.
As the sole licensed receiver of wheat for the AWB the State Wheat Board is also entitled to re-imbursement of handling, storage and other expenses for wheat, subject to agreement between the appropriate State and Commonwealth Ministers. Disagreement over the basis of reimbursement has caused difficultie in the finalisation of SWB accounts for the period 1969-70 to 1972-73 . (2)
Table C.5 shows the assets and liabilities of the State Wheat Board €or the years 1968-69 to 1972-73. The table shows that Growers’ Funds as a source of capital to finance the functions of the SWB have declined in importance over the period and that State Treasury Loans and Debenture Loans have increased in importance. Loans and Accumulated Funds accounted for 48 per cent and 49 per cent respectively of capital from all sources in 1972-73.
(1) Personal contact with representatives of the SWB. (2) Queensland, Separate Report of the Auditor-General, 1974,
Government Printer, 27 November 1974, p. 18.
119

\TABLE C.5 - ASSETS AND LIABILITIES: STATE WHEAT BOARD - QUEENSLAND : 1968-69 TO 1972-73
-~ ~~ ~~~ ~ ~~ ~~ ~~ ~
ZIABILITIES 68-69 69-70 70-71 71-72 72-73
$m % $m % $m % $m % $m % ~~
State Treasury Loans, Debenture Loans , less 6.420 32.7 8.023 42.2 9.275 44.4 10.211 44.6 11.627 48.3 Debenture Sinking Funds Growers' Funds 3.800 19.4 1.243 6.5 0.685 3.3 1.013 4.4 0.301 1.3
E Accumulated Funds, o Provisions etc. 9.066 46.3 9.666 50.8 10.339 49.5 11.048 48.2 11.835 49.2
Other Liabilities 0.313 1.6 0.087 0.5 0.592 2.8 0.630 2.8 0.302 1.2
TOTAL LIABILITIES 19.599 100.0 19.019 100.0 20.891 100.0 22.902 100.0 24.065 100.0
ASSETS
Fixed Assets 15.671 80.0 17.005 89.4 18.441 88.3 20.622 90.0 22.456 93.3 Other Assets 3.928 20.0 2.014 10.6 2.450 11.7 2.280 10.0 1.609 6.7
TOTAL ASSETS 19.599 100.0 19.019 100.0 20.891 100.0 22.902 100.0 24.065 100.0
Source Queensland, Separate Report of the Auditor-General, 1974, Government Printer, 27 L' November 1974, p. 18)port of the Auditor-General , 1969-70, Government Printer, 1970, p. 172.
ANNEX D
ESTIMATED TRANSPORTATION COST FOR BULK WHEAT: 1968-69 TO 1972-73 POOLS
In this annex the cost estimates for each wheat pool, 1968-69 to 1972-73, and for each State, detailed according to the various segments of the transportation process are presented.
121

TABLE D.l - ESTIMATED TRANSPORT COSTS FOR WHEAT, 1968-69 WHEAT POOL ($'m)
Estimated costs paid directly by grower Pool costs Estimated total transport
Farm to Farm to silo Silo to Total Rail Handling AWB Total costs terminal delivery by terminal freight and admin- delivery road haulage storage istration
State . by road
E NSW - 9.9
h) vic 0.1 3.2
~~~~~ ~~
Q Id - 2.1
SA 2.3 2.3 WA 0.7 7.9
Aust 3.1 25,4
44.0 53.9 (a) 17.2 0.7 17.9 71.8
17.4 20.6 (a) 4.9 0.3 5.2 25.8
9.0 11.1 (a) 3.8 0.1 4.0 15.1
6.3 10.9 (a) 5.2 0.3 5.5 16.4
14.0 22.6 (a) 10.1 0.4 10.5 33.1
90.6 119.1 3.5 41.2 1.8 46.5 165.6
(a) Details by state not available. Note: Figures may not add to totals due to rounding. Source: Road transportation costs: Bureau of Transport Economics estimates,
Line-haul and pool costs: Data supplied by AWB.

TABLE D.2 - ESTIMATED TRANSPORT COSTS FOR WHEAT, 1969-70 WHEAT POOL
($'m) - Estimated costs paid directly by grower' Pool costs Estimated
Farm to Farm to silo Silo to Total Rai 1 terminal delivery by
Handling AWE terminal
Total costs
delivery road haulage storage istration
total transport
freight and admin-
State by road P W h) NSW 7.3 31.3 38.6 17.8 1.0 18.8 57.4
Vi c (a) 2.4 12.2 14.6 - 4.9 0.5 5.4 20.0 Q Id 0.7 2.8 3.5 - 2.5 0.1 2.6 6.1 SA 1.5 1.2 3.4 6.1 - 5.4 0.4 5.8 11.9
- -
- WA 0.6 4.5 7.4 12.4 - 10.8 0.5 11.3 23.7 Aust 2.1 16.1 57.1 75.3 - 41.4 2.5 43.9 119.3
(a) Less than 50,000 Note: Figures may not add to totals due to rounding. Source: Road transportation costs: Bureau of Transport Economics estimates,
Line-haul and pool costs: Data supplied by AWE.
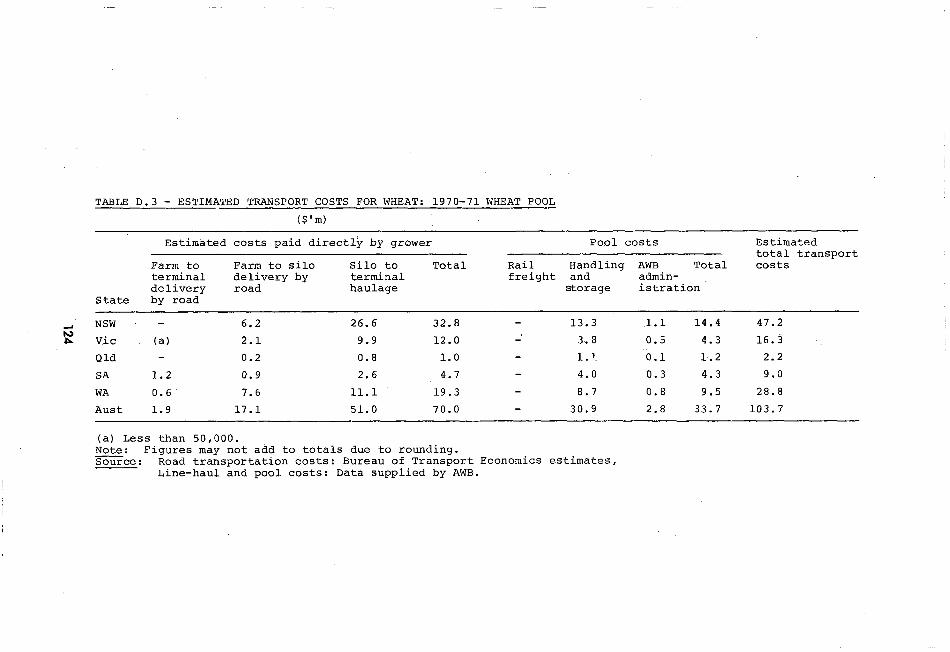
TABLE D.3 - ESTIMATED TRANSPORT COSTS FOR WHEAT: 1970-71 WHEAT POOL ($'m)
Estimated costs paid directly by grower Pool costs Estimated total transport
Farm to Farm to silo Silo to To.tal Rai 1 Handling AWB Total costs terminal delivery by terminal freight and admin- delivery road haulage storage istration
State by road
NSW Vic (a)
Q Id SA 1.2
WA 0.6 Aust 1.9
- IQ
- 6.2 2.1 0.2
0.9 7.6
17. 1
26.6 32.8 - 13.3 1.1 14.4 47.2
9.9 12.0 - 3.8 0.5 4.3 16.3
0.8 1.0 - 1.1 0.1 1.2 2.2
2.6 4.7 - 4.0 0.3 4.3 9.0
11.1 19.3 - 8.7 0.8 9.5 28.8
51.0 70.0 - 30.9 2.8 33.7 103.7
(a) Less than 50,000.
Source: Road transportation costs: Bureau of Transport Economics estimates, - Note: Figures may not add to totals due to rounding.
Line-haul and pool costs: Data supplied by AWB.

TABLE D.4 - ESTIMATED TRANSPORT COSTS FOR WHEAT: 1971-72 WHEAT POOL
($'m)
Estimated costs paid directly by grower ~~ ~
Pool costs Estimated
Farm to Farm to silo Silo to Total Rai 1 Handling AWB terminal delivery by
Total costs terminal freight and
delivery road admin-
haulage
total transport
~ State by road storage istration
N NSW 5.3 17. l 23.0 - 12.0 0.9 12.9 35.9 Vi c (a) 3.1 11.1 14.2 - 3.7 0.1 4.4 18.6
Q Id 1.9 5.1 7.6 - 1.8 0.3 2.1 9.7
-
- SA 1.5 1.0 3.1 5.6 - 3.6 0.5 4.1 9.7 WA 0.9 8.7 10.0 19.6 - 1.7 0.9 8.6 28.2 Aust 2.5 19.9 47.6 70.0 - 28.8 3.3 32.1 102.1
(a) Less than 50,000 Note: Figures may not add to totals due to rounding. Source: Road transportation costs: Bureau of Transport Economics estimates,
Line-haul and pool costs: Data supplied by AWB.

TABLE D.5 - ESTIMATED TRANSPORT COSTS FOR WHEAT: 1972-73 WHEAT POOL
($'m)
Estimated costs paid directly by grower Pool costs Estimated total transport
Farm to Farm to silo Silo to Total Rail Handling AWB Total costs terminal delivery by terminal freight and admin- delivery road haulage storage istration
State by road
NSW 3.9 Vi c (a) 2.6
- P h, Qld m
. . - SA 1.4
0.9 0.8
WA 1.0 6.5 Aust 2.5 14.8
13.2 17.1 - 13.1 0.7 13.8 30.9 8.5 11.2 - 4.3 0.6 4.9 16.1 2.6 3.5 - 2.6 0.2 2.8 6.3 2.4 4.6 4.1 0.5 4.6 9.2 9.8 17.4 - 11.0 1.0 12.0 29.4 36.5 53.7 - 35.1 3.0 38.1 91.8
-
(a) Less than 50,000 Note: Figures may not add to totals due to rounding. Source: Road transportation costs: Bureau of Transport Economics estimates,
Line-haul and pool costs: Data supplied by AWB.

ANNEX D APPENDIX 1
INCIDENTAL RAIL CHARGES
This annex presents the railway charges levied on shipments of wheat and flour other than the distance rates. These charges are demurrage, tarpaulin hire, charges for the bulk carriage of goods, stopover and transfer charges.
DEMURRAGE
This charge is levied‘’) when freight wagons are not loaded and consigned or unloaded within the time period specified by the various railways. A comparison of demurrage charges by State is shown in Table D.l.l. These charges vary considerably among the States, extending from $2.90 for a four-wheeled wagon to $5.60 for an eight-wheeled wagon in Queensland, and from $6.70 to $19.45 in Victoria.
In WA, demurrage charges levied on Jetty or Blue Cross wagons are lower than those presented in Table D.l.l. These are old wagons used for moving wheat from terminal storage to wharves for ship loading. Demurrage charges levied on covered wagons in WA are $0.75 to $1.50 greater than for open wagons. Details of charges in WA are shown in Table D.1.2.
TARPAULIN HIRE
Tarpaulins are required for protection in open top wagons. The charges for these tarpaulins vary considerably among States as follows.
(1) Demurrage charges are levied at the discretion of the railways
127

TABLE D.l. 1 - DEMURRAGE CHARGES(1) BY STATE FOR WHEAT WAGONS: 1973 (S)
Type of NSW(2) QM(~) Vi c SA(4) WA Wagon
First Second Max/ First Second Max/ First Second Max/ First Second Max/ First Second Max/ Day Day Day Day Day Day Day Day ~~
Day Day Day Day Day Day Day
Four wheeled 5.25 5.78 6.30 2.90 2.90 2.90 6.70 6.70 6.70 3.84 3.84 3.84 6.00(5) 6.00 6.00 p3 Eight wheeled 10.50 11.56 12.60 5.60 5.60 5.60 19.45 19.45 19.45 5.20 5.20 5.20 12.00(6)12.00 12.00 03
r
(1) These charges come into operation when loading or unloading are not completed in a specified time period.
(2) An additional charge is levied for tarpaulins covering goods in trucks under demurrage of $1 per tarpaulin
(3) An additional charge is levied of $0.70 for each tarpaulin retained to cover goods in the truck under
(4) The SA demurrage charges are calculated at 48C per four wheeled vehicle per hour with a minimum charge of
(5) For four wheeled wagons exceeding 10 tonnes.
Source: Goods Rates Books 1973 from Public Transport Commission of NSW, Victorian Railways, Queensland (6) For eight wheeled open wagons exceeding 20 tonnes.
See the Goods Rates Books for the time periods allowed by each State.
for the first day and 15C for each subsequent day exclusive of Sundays and public holidays.
demurrage.
$2.50 and 65C per eight wheeled wagon with a minimum charge of $5.00.
Railways, Western Australian Government Railways Commission, South Australian Railways.

TABLE D.1.2 - DEMURRAGE CHARGES, WESTERN AUSTRALIA: 1973 (S)
Type of Jetty or Blue Cross 0 ther Wagon
Open Covered Open Covered
Four wheeled wagons - up to 10 tonnes 3.00 3.50 4.00 4.75 - exceeding 10 tonnes 4.50 4.50 6.00 6.75 Eight wheeled wagons - up to 20 tonnes 6.00 6.00 8.00 9.50 - exceeding 20 tonnes 9.00 9.00 12.00 13.50
~ ~ ~ ~ ~~~~
Source: Western Australian Government Railways Commission, Goods Rates Book, Vol. 1, 1973, p. 57.
129

New South Wales The hiring charge is $2 per tarpaulin for the first day, and $0.50 per day for subsequent days. For periods of hire greater than one week, the charge is $5 for the first week and $1 for each successive day subject to a maximum charcre of $5 per week (1) .
Q Eensland No charge is made for one tarpaulin for a four wheeled wagon, two tarpaulins for an eight wheeled wagon having' an inside length up to 9750m, or three tarpaulins for an eight wheeled wagon with an inside length greater than 9750m. Charges for additional tarpaulins are $-2 each . (2)
Victoria , m \
Tarpaulins are provided free of charge by the Victorian Railways ") .
South Australia Tarpaulin hire charges are determined by the distances travelled as well as by the size of coverings. The charges are (4).
0- 80 81-240 240 and over
Small Coverings ( $ 1 0.50 0.62 0.75
Large Coverings (S) 0.75 1.00 1.25
Western Australia A charge for the provision of cover €or all traffic requiring it is included in freight rates . (5)
(1) Public Transport Commission of NSW, Rail Division, Merchandise
(2) Queensland Railways, Goods and Livestock Rates Book, 1 July
(3) Victorian Railways, Goods Rates Book, No 28, Vol 1, 1 July
(4) South Australian Railways, Goods and Livestock Rates
(5) Western Australian Government Railways Commission, Goods
~~ ~~
and Livestock Rates, Vol 1, 1 July 1973, p. 21.
1973, By-Law No 1038, p.3.
1973, p. '22.
Book, Vol. 1, 1 July 1973, p. 34.
Rates Book, Vol. 1, 1 July 1973, p. 56.
130

BULK CARRIAGE OF GOODS
In Victoria a surcharge is levied for the bulk carriage of grain and certain other commodities. The charge ranges from $2.40 per proofed GY wagon and $6.00 per GJF and GJX wagon (1) .
STOPOVER CHARGES
These charges are levied on wheat transported by rail from silo to port terminal when the journey is broken at sub-terminzls or flour mills and the wheat is re-consigned as either grain or flour.
New South Wales
In NSW the freight rate for the carriage of wheat is initially the sum of the distance rates for each stage of the journey. A
rebate is paid by the railways under certain circumstances amounting to the difference between the sum of the two distance rates charged and the through ordinary distance rate for the total distance hauled, plus a stopover charge(2). In general, wheat consigned to flour mills in the Newcastle area for gristing and then consigned as wheat products to Darling Harbour ineur a stopover charge of 46 cents per tonne for the purpose of calcu- lating the rebate. In the case of wheat consigned to sub-terminals and then to port terminals the stopover charge is 92 cents per tonne. Flour and semolina gristed for export from wheat which was previously transported by rail is exempt from the stopover charge . (3)
Victoria
In Victoria the re-consignment of goods in wagon loads to the
(1) Victorian Railways, op. cit. , p. 24. (2) Public Transport Commission of NSW, op. cit. , p. 36. (3) In addition, a freight rebate of 20 cents per tonne is paid
on flour and semolina transported by rail from mill to port for export.
131

same consignee at another station is allowable under certain conditions and incurs a re-consigning charge of 65 cents per tonne in addition to freight charges. The freight rate charged, in the case of one re-consignment, is that applying to the distance between the original despatching station and the destination station to which the re-consignment is made. Where goods are subsequently re-consigned the ordinary tariff rates apply to that and further re-consignments. In the case of re-consignment of goods in less than wagon load lots the freight rates charged are those applicable to the two separate journeys . (1)
l
l Where grain is consigned in Victoria from one country station to mills, and the mill products are then consigned elsewhere by rail, a stopover charge is made of 65 cents per tonne or $1.45 per tonne, depending on the location of the mill and the destin- ation of the grain products.
, The freight rate charged in the case of grain consigned in Victoria to mills is the sum of the separate tariff charges on each journey. A rebate is payable under certain conditions of the difference between the sum of the separate tariff charges and the 'Grain' rate for the total distance, plus the stopover charge mentioned above . (2)
Queensland
Wheat consigned from country stations in Queensland to mills and then re-consigned as flour and other mill products is charged rail freight at the rates for wheat and wheat products for the separate journeys, plus any shunting or haulage charges that may
(1) Victorian Railways, op. cit., p. 23. (2) Victorian Railways, op. cit., pp. 131, 132. The rebate on
1
apply (3)
freight rates also applied to grain railed from Victorian stations to Albury, Wahgunyah (for Corowa) and Tocumwal for gristing and re-consigned as mill products to Victorian stations. A further freight rebate of 15 per cent is available for export flour consigned to the port of export from mills including those located at Albury, Corowa and Tocumwal.
(3) Queensland Railways, op. ckt., p. 91.
132

South Australia
Wheat consigned in SA from country stations to country flour mills, and as flour from mills to any station is initially charged at 'AP' rates for the distance involved in each journey. Under certain circumstances a rebate is payable amounting to the difference between the sum of the separate rates and the rate for the total distance . (1)
However, where wagon loads of goods of selected classes, including the 'M' classification, are reconsigned to the same consignee at another station a re-consignment charge is made in addition to freight charges of 20 cents or 35 cents per tonne according to whether SAR or Victorian railway wagons are used ( 2 ) .
TRANSFER CHARGES
Transfer charges apply to intersystem movements of wheat between States. Movements of wheat between NSW and Victoria on lines operated by the Victorian Railways into southern NSW are not classified as intersystem consignments.
Transfer charges(3) on intersystem movements of wheat are as follows :
Border Station Charge per Tonne Minimum Charge
Clapham-Border Tunnel 1.50 0.50
Wallangarra 1.50 0.50
Albury, Wodonga 0.70 0.30
Tocumwal 0.70 0.30
Gladstone/Peterborough 0.70 0.30
( $ 1 ($)
(1) South Australian Railways, op. cit., p. 74.. ( 2 ) Ibid., p. 33. (3) Railways of Australia, Goods Rates Book, 1 March 1975,
p. 6.
133

ANNEX E
TRANSPORTATION COSTS: 1972-73 PRICES
The purpose of this Annex is to set out the methodology used to express transportation costs for wheat, presented in Chapter 3, in constant 1972-73 prices.
The two main components of costs, transport to terminals and pool charges were treated using different indices. Line haul costs comprising farm to silo and silo to terminal freight charges, were inflated by the ABS Average Weekly Earnings index. By using other indices such as the CPI, marginally different results were obtained; although the same general pattern existed. Pool charges comprising mainly storage and handling costs, were inflated by the ABS Materials Used in Building Other Than Housing Index. This index was chosen because a large part of pool charges consisted of capital costs of storage facilities.
In Table E.l, the inflated total transport costs per tonne are shown. In order to aid comparison between years, the costs for each year were divided by the 1972-73 cost i.e. the 1972-73 cost is shown as unity.
Transport costs in NSW showed a slight upward trend, while the States of Victoria, South Australia and Western Australia showed a general decline in these costs. In Queensland, transport costs fluctuated substantially but were at the same level at the beginning and end of the five year period.
13 4

TABLE E.l - RELATIVE MOVEMENTS IN TRANSPORTATION COSTS FOR WHEAT: 1972-73 PRICES
State 1968-69 1969-70 1970-71 1971-72 1972-73
NSW 0.86 1.00 0.92 0.95 1.00
Vi c 1.23 1.29 1.21 1.15 1.00
Qld 1.00 1.21 1.46 0.81 1.00
SA 1.03 1.24 1.09 0.97 1.00 WA 1.11 1.33 1.07 1.04 1.00
Source : Silo to terminal costs per tonne - Table 3.3. : Farm to silo costs - Annex D, Tables D.l to D.5. : Quantities of wheat , Table 3.2. : Pool costs per tonne - Table 3.4.
135

ANNEX F
ESTIMATION OF TIIE COST OF ANCILLARY HAULAGE OF WHEAT FROM FARM TO SILO
PURPOSE OF STUDY AND DATA BASE
The purpose of the study was to survey farmers in the wheat belt to obtain details of their delivery strategies and the costs involved in those strategies.
Data relating to deliveries of all grains and to vehicle operations were collected for a three year period 1971-72 to 1973-74 from a total of ten farms in Queensland, NSW, Victoria, SA and WA. From this information the average cost to the farmer per tonne and per tonne-kilometre were calculated.
METHODOLOGY
The estimate of costs was based on the following assumptions:
. Driver's labour was included by imputing values equivalent to the appropriate wage awards for farm workers: for NSW, SA and WA, the Federal Pastoral Award; for Victoria, the Victorian Agricultural and Pastoral Workers' Determination; for Queensland, the Station Hands' Award (State).
. Vehicle running&costs, i.e. fuel, oil, maintenance and tyres were 6.8 cents per kilometre based on Bureau estimates in A Study of Intersystem Railway Freight Rating Practices Australian Government Publishing Service, Canberra, 1976.
. All fixed costs associated with truck ownership were attributed to the cartage of grain, since the alternative of allocating fixed costs between activities would have yielded results which would have varied according to the arbitrary method of allocation selected.
136
. The return to capital invested in grain delivery vehicles was assumed at 7.5 per cent per annum, as a measure of the rate of return obtainable if the capital was invested elsewhere (1) .
. Depreciation was calculated on the straight line method assuming a life of 15 years for farm trucks.
RESULTS
The case studies revealed a wide range of delivery costs. Table F.l sets out the results obtained for nine case studies, one of the ten having been excluded as that grower was engaged in long haul direct delivery from farm to port terminal and also used his vehicles for other commercial haulage activities in the remainder of the year.
The weighted average delivery cost per tonne for the nine case studies was $2.80, having a range of $1.71 to $8.49. The average cost per tonne-kilometre performed for grain deliveries varied between 5.88 cents and 36.50 cents with the weighted average being 13.51 cents.
(1) Bureau of Agricultural Economics, The Australian Wheatgrowinq Industry: An Economic Survey 1969-70 to 1971-72, Australian Government Publishing Service, Canberra, 1973, p. 102.
137

TABLE F. 1 -. ESTIMATED DELIVERY COST OF GRAIN FROM FARM TO SILO: AVERAGE FOR THREE YEARS - 1971-72 TO 1973-74
State Case Study
Western Australia South Australia Victoria New South Wales Queensland
1 1 2 1 2 1 2 3 1
Total three year
03 Total deliveries cost ( $ 1 3707 3193 5710 3732 3071 2154 4637 5388 4116
( tonnes ) 1370 1080 1680 2053 1564 1257 1067 635 2058
W
Tonne kilometres performed 18339
Average cost per tonne ( $ 1 2.71
Average cost per tonne-km (cents) 20.21
8749 70261 14481 13593 20238 25715 23007 69972
2.96 3.40 1.82 1.96 1.71 4.35 8.49 2.00
36.50 8.13 25.77 22.59 10.64 18.'03 23.42 5.88
Source : Bureau of Transport Economics estimates.

ESTIMATION OF THE COST OF ROAD HAULAGE OF WHEAT FROM OFF-RAIL SILOS TO PORT TERMINAL, WA,
1972-73 -
Information was obtained in field surveys relating to the road haulage of wheat in WA from off-rail silos at Holt Rock, Lake Varley, Lake King, Mt Madden and Ravensthorpe to the terminal at Esperance. The information made available to the BTE indicates that clearance of silos by road haulage is carried out for approximately eight months of the year. Although some backloading of superphosphate is available for approximately three months the haulage of wheat represents the bulk of the annual business of the hauliers concerned.
The components of variable and fixed annual operating costs are shown in Table G.1. Variable costs per kilometre travelled annually were 30.6 cents and fixed costs 18.7 cents. In Table G.2 costs per tonne and per tonne kilometre are presented. Total annual operating costs were $6.56 per tonne and 2.47 cents per tonne- kilometre.
ASSUMPTIONS
Annual distance travelled: 130,000 km Capital value of prime mover, semi and dog trailer is $80,000.
Depreciation - straight line method over 6 years. Return to capital - 7.5 per cent per annum. Semi and dog trailer capacity - 40 tonnes.
139

TABLE G.l - ANNUAL COSTS OF OPERATING WHEAT TRUCKS: SILO TO TERMINAL - WESTERN AUSTRALIA, 1972-73
(cents per km travelled per annum)
COST ELEMENTS Variable costs
Fue 1 Oi 1 1 Maintenance ) Tyres
5.7 1.2
1.7 Road maintenance charges 6.3 Licence/permit fee 3.7 Allowance for hauling dog trailer 4.0 Wages (assume opportunity cost equals wage
Allowance for annual leave, sick leave of driver)
and superannuation
7.3 0.7
Total variable costs 30.6
Fixed costs Depreciation 7.7 Registration and 3rd party 0.6 Insurance 1.8 Return to capital 4.6 Admin. overheads 4.0
Total fixed costs 18.7
Total costs 49.3
TABLE G.2 - VARIABLE, FIXED AND TOTAL ANNUAL OPERATING COSTS FOR WHEAT TRUCKS: COSTS PER TONNE AND TONNE KILOMETRE
Cost element Cost per tonne Cost per tonne km ($1 (cents
Variable 4.07 1.53 Fixed 2.49 0.94 Total 6.56 2.47
140
..

ANNEX H
ESTIMATION OF LINE HAUL COSTS FOR RAIL MOVEMENTS OF WHEAT
The purpose of this Annex is to provide estimates of the short run avoidable costs associated with wheat line haul.
Multiple regression analysis has been used to develop a function from which the short-run avoidable operating costs for a particular rail haul can be estimated. Although the function has been developed from data primarily associated with wheat traffic the method is equally applicable to the carriage of other traffics.
The aim of developing the model is to assist in setting freight rates by providing a means of estimating the lower limit below which revenue received from the trip should not fall in the short run if the service is to be viable.
DEFINITION OF AVOIDABLE OPERATING COST
Avoidable railway operating costs are defined as those which would not be incurred if the service were not provided. All costs are avoidable in the long run, but in the shorter term, with fixed capital equipment some costs are unavoidable.
Traditionally, economists consider that the short-run refers to a situation in which the costs of capital equipment are fixed i.e. unavoidable. However, railway costs associated with the movement of wheat may be considered avoidable or unavoidable:
. on a trip basis;
. on a yearly basis;
. over a time period longer than one year due to the relatively large proportion of fixed capital equipment employed in railway operations.
141

Examples of costs considered unavoidable over a period of at least one year are:
. depreciation and interest on capital already invested in the
l system; . administrative overheads.
l Costs considered unavoidable on a trip basis, yet avoidable over a one year time period are:
. safeworking (labour) ;
. wagon maintenance relating to time rather than to distance travelled;
l . tarpaulin costs; . replacement costs of track and other fixed assets.
~ DATA BASE
Data were only available for two of the mainland State railway systems in 1974 and was taken from Guards' Running Statements. These documents contained details (l) of scheduled trains operated over sections of track in both the Iup' direction to the terminal (laden predominantly with wheat) and 'down' direction (generally unladen).
Of the sixty-four observations obtained, six were deleted from the data bank because of the difficulty of accurately estimating track maintenance costs . (2)
The data bank available to the BTE related to time table trains.
(1) The details included crew working times, locomotive types, train running times, loads, shunting activities, pick up and s.et down of wagons and a description of each wagon, its contents and its final destination.
estimate track maintenance for the purpose of the functions gave unsatisfactory results when applied to lightly trafficked lines.
(2) The track maintenance formula developed by BTE and used to
142

To minimise the problem associated with the existence of common costs the avoidable operating cost function was developed on a round trip basis. The cost components were:
. train crew time
. marshalling and shunting (labour)
. locomotive fuel and maintenance
. wagon maintenance
. hakevan maintenance
. track maintenance.
Terminal handling costs were not included in the avoidable operating cost function because the railways are not responsible for the handling of wheat into or out of wagons.
As a result of the railway policy of non-retrenchment of labour the assumption was made that the opportunity cost of labour was equal to the wage cost per hour‘’) . Therefore the cost of labour was considered avoidable on a trip basis.
SPECIFICATION
The following variables were included in the model:
Y : avoidable operating costs ($) X1 : train crew time (hours) X2 : marshalling and shunting time (hours) X3 : distance (kilometres) x4 : gross trailing load (tonnes)
(1) Train crew and marshalling and shunting labour have been costed on an hourly basis. As well as wages and allowances for overtime, the hourly rates include provision for holidays, sick pay, long service leave, superannuation, uniforms, training, living quarters and expenses.
143

Fifty eight observations were recorded for both 'up' and 'down' movements. Graphical presentation of th.e data on scatter diagrams ,:
.indicated a linear relationship between costs and the independent variables. Ordinary least squares estimation yielded:
Y = -49.85 + 21.90X1 + 51.86X2 '+ 0.94X3 + 0.09X4 (28.62) (11.07) (5.45) (0.41) (0.02)
R2 = 0.91 F(4,53) = 131.07
All variables were significant at the 0.05 level.
, The ranges of observations is given below indicating the range within which reliable cost estimates can be expected.
Variable Minimum Observation Maximum Observation Y 55 ($1 960 ($)
x1 x2 x3
2.0 (hrs) 0.0 (hrs) 22 (km)
12.0 (hrs) 5.0 (hrs) 315 (km)
x4 150 (tonnes) 2523 (tonnes)
ESTIMATION OF AVOIDABLE COSTS OF RAIL LINE HAUL OF WHEAT
Avoidable operating costs in 1972-73 €or rail line haul of wheat from silo to port terminal in each State have been estimated for the purposes of the study for time table trains on a round trip basis. As the data for the cost calculation were in 1973-74 prices, the costs were deflated to 1972-73 levels using the index of Average Weekly Earnings.
All round trip costs have been attributed to wheat. This avoids the problem of arbitrarily allocating avoidable round trip costs between commodities using the service when backloading occurs, say of superphosphate or general freight.
144

The assumptions made for the purpose of estimating avoidable costs were as follows:
The length of haul was the weighted average for each State of the distance by rail from country silos to port terminals in the 1972-73 season, using as weights the tonneages received into silos in 1972-73. Data was obtained from the AWB.
Wheat was hauled by time table trains by a shuttle type service over two sections of track of equal length''), except for SA where one section was assumed,because of the shorter average distance involved in that State. It was assumed that the 'down' journey in each section was unladen.
Train weights on the 'up' journey were: . gross trailing load 1850 tonnes, wheat hauled 1330 tonnes . gross trailing load 1000 tonnes, wheat hauled 740 tonnes.
Average speed of train was 25 kilometres per hour. No explicit allowance was made for delays in transit. The speed assumed is based on average effective speeds observed in data obtained bythe Bureau from a survey of wagon usage May 1974.
Crew time calculated according to average running speed plus one hour downtime per shift to cover sign on and sign off time .
Marshalling and shunting time was two hours per section.
The results of the calculations are shown in Table H.l. The figures represent averages from which the results for particular branch lines and/or main lines may vary significantly.
(1) Equal lengths of section were used as the results of a sensitivity test showed that the avoidable cost per tonne Over the total journey differed only marginally with variable lengths of section.
145

TABLE H.l - ESTIMATED AT JO I DABLE RA1 LT STATE: 1972-73 SEASON
QAY COSTS AND FREIGHT RATES BY
State Averaae distance Estimated avoidable Average rail of rail haul - cost per tonne freight rate 1972-73 averaqe Train l(a) Train 2 (b) per tonne (km) ( $ 1 ' ($1 ( $ 1
l NSW 533 1.73 2.87 9.10(c) Vi c 32 8 1.25 2.00 6.73 Qld 350 1.29 2.09 8.16 SA 151 0.59 0.95 4.34 WA 269 1.11 1.75 5.08
(a) Assumption of gross trailing load 1850 tonnes and wheat
(b) Assumption of gross trailing load 1000 tonnes and wheat hauled on 'up' journey 1330 tonnes, 'down' journey unladen.
hauled on 'up' journey 740 tonnes, 'down' journey unladen.
Government. l (c) Net of,the subsidy paid on wheat freight rates by the NSW
Source: Bureau of Transport Economics estimates.
146

ANNEX I l
ESTIMATED CAPITAL CHARGES FOR SPECIALISED RAILWAY ROLLING STOCK FOR WHEAT
This annex presents the methodology used to estimate capital charges €or wheat trains. Details of interest on capital and depreciation have been based on the numbers of specialised wheat wagons used by each rail system in 1973 and a hypothesised pool of locomotives necessary to move an average harvest for the years 1968-69 to 1972-73.
SPECIALISED WHEAT WAGONS
D'ewreciation
For each State each wagon was assumed to have a replacement cost of $20,000 in 1972-73 and a life of 15 years. Using the straight line method, annual depreciation was calculated at $1333.
Interest on Capital
The wagons in service were assumed to have an average age of 7.5 years. Interest on capitai calculated using a rate of 8.5 per cent was $850.
Total Cawital Charaes
Estimated capital charges, i.e. depreciation plus interest, total $2183 per wagon. Annual total capital charges €or each State were calculated as the product of the capital charges per wagon and total numbers'') of specialised wheat wagons owned by each system.
(l) Refer to Table I. 1 €or number of wagons €or each system.
147

TABLE 1.1 - NUMBERS OF SPECIALISED WAGONS USED IN GRAIN TRAFFIC: 1973 (a)
Vic
Qld
SA
WA
State
NSW BWH 217 WHX 218 WH 150 FWH 163 GJX 20 G JF 330 V JMG 317 VJD 50 VJDG 56 Q GX 225 VGY 1
HBN 17 HAN 17 HB 32 SHBX 52 ww 140 WWN 40 xw 90 RCW 109 RCH 89
~ ~~
Wagon code Number
(a) In addition, general purpose wagons are used €or wheat transport. These have been ignored €or the purpose of calculating capital charges.
Source: Contact with various State rail authorities.
148

It was postulated that wheat traffic bears the total capital charges for hopper wagons even though they may be used to transport grains other than wheat or may be idle during years of poor harvest. The charges based on total fleet numbers also implicitly allow for the costs of wagon downtime arising through loading and unloading delays at terminals and silos.
Using the average harvest for the period 1968-69 to 1972-73 and the average length of haul in each state, the annual capital charges were calculated on a tonne and tonne-kilometre basis. These results are presented in Table 1.2. The estimates range from $0.20 per tonne for SA to $2.87 in Queensland and from 0.10 cents per tonne-kilometre in NSW to 0.82 cents in Queensland.
LOCOMOTIVES
The hypothesised pool of locomotives necessary to move the average harvest in each State €or the period 1968-69 to 1972-73 was calculated assuming an average payload of 1330 tonnes for a 'heavy' train and 740 tonnes €or a 'light' train. It was also assumed that wheat trains operate for 250 days each year. Further, it was postulated that in all States, one locomotive was on standby for every two in service, and that in all States, except South Australia, wheat was carried from silo to terminal in a two-stage shuttle type operation. The numbers of locomotives required therefore depends on whether the harvest was transported by 'light' or 'heavy' trains. The numbers of locomotives for each State depending on the type of train are presented in Table I. 3.
Depreciation
The replacement cost of a locomotive in 1972-73 was assumed to be $300,000. Using the straight line method and a life of 15 years annual depreciation was calculated as $20,000.
149

TABLE 1.2 - CAPITAL CHARGES FOR SPECIALISED WHEAT WAGONS: 1972-73 State Per tonne
($ 1 Per tonne kilometre
(cents )
NSW 0.53 0.10 Vi c 0.44 0.13
Qld 2.87 0.82 SA 0.20 0.13 WA 0.46 0.17
Source: BTE estimates.
TABLE 1.3 - POSTULATED SIZE OF LOCOMOTIVE POOL FOR WHEAT TRAINS BY STATE: 1972-73
State Light trains Heavy trains
NSW 204 108 Vi c 108 60
Qld 36 24 SA 42 24 WA 144 84
Source: BTE estimates.
150

Interest on Capital
Assuming an average age of locomotives in service of 7.5 years, and a rate of 8.5 per cent, interest on capital was calculated as
$12,750.
Total Capital Charges
Estimated capital charges for each State total $32,750 for each locomotive. For each State the total capital charges incurred for the postulated pool of locomotives are shown in Table 1.4. These costs range from 0.41 cents per tonne-kilometre in NSW to 0.80 cents in WA for 'light' trains and from 0.22 cents per tonne kilometre in NSW to 0.47 cents in WA for 'heavy' trains.
ESTIMATED TOTAL TRAIN CAPITAL CHARGES
The estimated capital charges applicable to the total rolling stock involved in wheat traffic are presented for each State in Table I. 5. For 'light' trains these charges ranged from 0.51 cents per tonne-kilometre in NSW to $1.50 in Queensland. For heavy' trains, the range was 0.40 cents per tonne-kilometre in
NSW to 1.28 cents in Queensland.
151

TABLE 1.4 - CAPITAL CHARGES FOR POSTULATED LOCOMOTIVE POOL: 1972-73 State Light trains Heavy trains
per tonne per tonne km per tonne per tonne km ( $ 1 (cents) ($ 1 (cents)
NSW 2.18 0.41 1.15 0.22 Vi c 2.02 0.62 1.12 0.34
Qld 2.39 0.68 1.59 0.46 SA 1.08 0.71 0.62 0.41 WA 2.17 0.80 1.26 0.47
Source: BTE estimates.
i
TABLE 1.5 - TOTAL ESTIMATED CAPITAL CHARGES FOR WHEAT TRAIN: 1972-73 l
State Light trains Heavy trains
per tonne per tonne km per tonne per tonne km ( $ 1 (cents ( $ 1 (cents
NSW 2.71 0.51 1.68 0.40
Vi c 2.46 0.75 1.56 0.47
Qld 5.26 1.50 4.46 1.28
SA 1.28 0.84 0.82 0.54 , WA 2.63 0.97 1.72 0.64
~
Source: BTE estimates.
152

BIBLIOGRAPHY
AUSTRALIAN GOVERNfiENT PUBLICATIONS
AUSTRALIA. Department of Primary Industry. The Wheat Industry and Stabilisation. Report by Sir Allan R. Callaghan, Canberra, October 1972.
AUSTRALIA. Department of Primary Industry. Wheat Marketing: Australia. Canberra, April 1973.
AUSTRALIA. Bureau of Transport Economics. A Study of Intersystem Railway Freight Rating Practices. Australian Government Publishing Service, Canberra, November 1976.
AUSTRALIA. Bureau of Statistics. Rail, Bus and Air Transport, 1972-73. Ref. no. 14.21.
AUSTRALIA. Bureau of Statistics. Transport and Communication. Various issues. Ref. no. 14.11.
AUSTRALIA. Commonwealth Bureau of Census and Statistics. The Wheat Industry 1971-72 and 1972-73 (Preliminary). Ref. no. 10.35.
-
AUSTRALIA. Senate Parliamentary Debates, 1939, vol. 162.
AUSTRALIA. House of Representatives Parliamentary Debates, 1948 vol. 198.
AUSTRALIA. House of Representatives Parliamentary Debates I
1938, vol. 158.
AUSTRALIA. Senate. Parliamentary Debates, 1968, vol. S.37.
AUSTRALIA. Senate Parliamentary Debates, 1974, vol. S.61.
AUSTRALIA. Bureau of Agricultural Economics. The Australian Wheatgrowing Industry. An Economic Survey, 1969-70 to 1971-72 and 1972-73. Australian Government Publishing Service, Canberra 1973 and 1975.
153

AUSTRALIA. Bureau of Agricultural Economics. Report on the price structure of Wheat for 1972-73. Canberra, November 1972.
i AUSTRALIA. B.ureau of Agricultural Economics. Sixth Wheat ~ Stabilisation Scheme. Establishment of a Base Price Structure
and Procedures for Annual Variation. Canberra, November 1974.
AUSTRALIA. Year Book, 1946-47, no. 37. Government Printer, Canberra.
AUSTRALIA. Year Book, 1969, no. 55. Government Printer, Canberra.
AUSTRALIA. Year Book, 1973, no. 59. Government Printer, Canberra.
STATE GOVERNMENT PUBLICATIONS
NEW SOUTH WALES. Public Transport Commission. Amendments to Merchandise and Livestock Rates Book 1973. Circular No. 40.
l
VICTORIA. Year Book, 1970. Government Printer, Melbourne.
VICTORIA. Year Book, 1973. Government Printer, Melbourne.
QUEENSLAND. Separate Report of the Auditor-General, 1974. Government Printer, November 1974.
QUEENSLAND. Annual Report of the Auditor-General, 1969-70. Government Printer, December 1970.
OTHER REPORTS
~ Grain Elevators Board of NSW. Bulk Wheat. Sydney, October 1973.
Grain Elevators Board of NSW. 50 Years of Bulk Grain Handling in NSW. Sydney, August 1972.
154

Grain Elevators Board of NSW. Annual Report. Various issues 1968-69 to 1972-73.
Grain Elevators Board - Victoria. Annual Report. Various issues 1968-69 to 1972-73.
South Australian Co-operative Bulk Handling Ltd. Home for a Harvest .
South Australian Co-operative Bulk Handling Ltd. Annual Report. Various issues 1968-69 to 1972-73.
Co-operative Bulk Handling Ltd. Annual Report. Various issues 1968-69 to 1972-73.
Co-operative Bulk Handling Ltd. A Co-operative Enterprise.
OTHER REFERENCES
Baumol, W.J. and Bradford, B.F. 'Optimal Departures from Marginal Cost Pricing', American Economic Review, vol. 60, no. 3, June 1970.
Callaghan,Sir Allan R. The Wheat Industry and Stabilisation, Australia, Department of Primary Industry, Canberra, October 1972.
Campbell, X.O. 'A Wheat Policy €or the Seventies'. Australian Journal of Agricultural Economics, vol. 15, no. 1,April 1971.
Cassidy, P.W. McCarthy, W.O., and Toft, H.I. 'An Application of Spatial Analysis to Beef Slaughter Plant Location and Size, Queensland'. Australian Journal of Agricultural Economics, vol. 14, no. 1, June 1970.
Connors, T. Australian Wheat Industry: Its Economics and Politics Gill Publications , Canberra, March 19 72.
Curlewis, W.P.C. 1800 Tonne Ore Trains in Australia. Address delivered to Institute of Mechanical Engineers, London, May 1974.
15 5

Dent, W. 'Optimal Wool Flows for Minimisation of Transport Costs'. Australian Journal of Agricultural Economics, vol. 10, no. 2 , Dec 1966.
De Salvo, J.S., and Lave, L.B. A Statistical Engineering Approach to Estimating Railway Cost Functions. Rand Corp- oration, Santa Monica, March 1968.
Dorman, L.H. The Grain Elevator and Transportation System in Australia. Address to Canadian International Grains Institute Seminar, W'innipeg, Oct 1973.
Ferguson, D.C., and McCarthy, W.O. 'A Spatial Analysis Approach to Size and Location of Australian Wool Selling Centres'. - Review of Marketing and Agricultural Economics , vol. 38 , no. 4, 1970.
Ferguson, D.C., and Pemberton, G.M. 'Size and Location of Australian Wool Selling Centres - a Note'. Review of Marketing and Agricultural Economics, vol. 38, no. 4, 1970.
Fisher, N.W.F., and Stanley, J.K. 'On the Economics of Country Bulk Grain Storage'. Australian Economic Papers, June 1972.
Fleming, M.S., and Bell, W.E. 'PHAER Producers. Haul and Elevator Receipts'. The Logistics and Transportation Review, vol. 9, no. 2, 1973.
Graziers' Association of New South Wales. Post War Wheat Subsidy - the Truth Not the Myth. Unpublished study undertaken by the Association, 1974.
Hurt, V.G., and Tramel, E. 'Alternative Formulations of the Transhipment Problem'. Journal of Farm Economics, vol. 47, no. 3, Aug 1965.
Knight, G. 'The New South Wales Flour Milling Industry'. The Australian Geographer, vol. XI, no. 2, 1969.
-
156

Nicholls, N.M. , and Morse, B.M. 'Grain Storage on Wheatgrowing Properties'. Quarterly Review of Agricultural Economics, vol. XXVII, no. 2, Apri1.1974.
Rolfe, H.A. Industry in Australia - Wheat. Longmans, The Griffin Press, Adelaide, 1968.
Stollsteimer, J.F. A Working Model for Plant Numbers and Locations Giannini Foundation Paper no. 238. Originally reported in unpublished PhD. Thesis University of California, Berkeley, 1961.
Thompson, N.J. 'Country Bulk Grain Storage - an Evaluation'. Australian Economic Papers. Dec 1970.
Thompson, N.J. 'On the Economics of Country Bulk Grain Storage: A Reply' , Australian Economic Papers, June 1972.
Trychniewicz, E.W. 'Rationalising Grain Movements', The Logistics and Transportation Review, vol. 9, no. 2, 1973.
Trychniewicz, E.W. and Trangi, O.P. 'Grain Transportation in Canada: some critical issues and implications for research'. Canadian Journal of Agricultural Economics, Feb 1968.
Walker, H.V. 'The Grain-handling Problem'. Canadian Journal of of Agricultural Economics, Feb 1968.
Weinschenck, G., Henrichsmeyer, W., and Aldinger, F. 'The Theory of Spatial Equilibrium and Optimal Location in Agriculture: A Survey', Review of Marketing and Agricultural Economics, vol. 36, 1968.
Whan, I.F. The Economics of Road Transporting Wheat from the Farm to Government Storage and the Reasons for Farmers Adopting a Particular Delivery Strategy. University of New England, Armidale , 1969.
15 7