BSR.vol.1 Iss.1 .Martinez.hernandez.sna.Fashion.cities
24
www.business-systems-review.org Business Systems Review ISSN: 2280-3866 Volume 1 – Issue 1 This work is licensed under the Creative Commons Attribution 3.0 Unported License. To view a copy of this license, visit http://creativecommons.org/licenses/by/3.0/ 225 “Ranking-based Ties” Social Networks. An illustration based on a system of Fashion Capital Cities in the world Ignacio Martínez de Lejarza Associate P rofessor of A pplied Ec onomics. Fac ulty of Econ omics, University of Valenc ia, Spain. e-mail: [email protected]. Corresponding author José Rodolfo Hernández-Carrión Associate P rofessor of A pplied Ec onomics. Fac ulty of Econ omics, University of Valencia, Spain. e-mail: [email protected]. Presented at the First Business Systems Laboratory Discussion Meeting – 10-11 September 2012 – University of Palermo - Italy / revised November3 / accepted November 13 / published online November 14, 2012. DOI: 10.7350/BSR.A16.2012 – URL: http://dx.medra.org/10.7350/ BSR.A16.2012 ABSTRACT Our paper aims to apply a non-conventional Social Network Analysis to a network generated from an initial sorting of data with mere order. The aim is to test whether and how one relationship set "conveniently" generated by the ranking is able to provide a coherent system of interactions with possible practical and theoretical utility. We consider a system of city distributions where we focus on “Ranking-Based Ties” social networks, considering a system of "objects" of the same class that would be able to interact. The objects in question are ordered according to their "performance" in a particular ranking. According to a survey developed by Global Language Monitor, there is a ranked number for every capital that could be considered important among the world’s most fashionable cities. Using the rank of scoring average we construct a fashion cities network in order to analyze the dynamics and the topology of the system following a gradual process of clustering or densification of relationships consistent with key network statistics analysis. Keyword s: Fashion cities, Fashion Capitals, Social Networks, SNA, Ranking-based Ties, System of cities. 1. INTRODUCTION Our purpose is to offer the beginnings of a new line of inquiry into social networks, to apply a social network analysis to the core group of global fashion cities. The question motivating our inquiry is whether and how social network effects have spillovers and connect each other; we are going to consider a system of cities distribution where we focus on “Ranking-based ties” social networks. In our paper we would start a discussion which is still “ongoing”. We consider a system of “objects” of the same class that would be able to interact. The objects in question are ordered
-
Upload
anonymous-oy8hr2n -
Category
Documents
-
view
217 -
download
0
Transcript of BSR.vol.1 Iss.1 .Martinez.hernandez.sna.Fashion.cities

7/30/2019 BSR.vol.1 Iss.1 .Martinez.hernandez.sna.Fashion.cities
http://slidepdf.com/reader/full/bsrvol1-iss1-martinezhernandezsnafashioncities 1/23
www.business-systems-review.org Business Systems Review ISSN: 2280-3866
Volume 1 – Issue 1
This work is licensed under the Creative Commons Attribution 3.0 Unported License. To view a copy of this license, visit http://creativecommons.org/licenses/by/3.0/
225
“Ranking-based Ties” Social Networks.
An illustration based on a system of Fashion
Capital Cities in the world
Ignacio Martínez de Lejarza Associate Professor of Applied Economics. Faculty of Economics, University of Valencia, Spain.
e-mail: [email protected]. Corresponding author
José Rodolfo Hernández-Carrión Associate Professor of Applied Economics. Faculty of Economics, University of Valencia, Spain.
e-mail: [email protected].
Presented at the First Business Systems Laboratory Discussion Meeting – 10-11 September 2012 –
University of Palermo - Italy / revised November3 / accepted November 13 / published online November
14, 2012. DOI: 10.7350/BSR.A16.2012 – URL: http://dx.medra.org/10.7350/BSR.A16.2012
ABSTRACT
Our paper aims to apply a non-conventional Social Network Analysis to a network generated
from an initial sorting of data with mere order. The aim is to test whether and how one
relationship set "conveniently" generated by the ranking is able to provide a coherent system of
interactions with possible practical and theoretical utility. We consider a system of city
distributions where we focus on “Ranking-Based Ties” social networks, considering a system of "objects" of the same class that would be able to interact. The objects in question are ordered
according to their "performance" in a particular ranking. According to a survey developed by
Global Language Monitor, there is a ranked number for every capital that could be considered
important among the world’s most fashionable cities. Using the rank of scoring average we
construct a fashion cities network in order to analyze the dynamics and the topology of the
system following a gradual process of clustering or densification of relationships consistent with
key network statistics analysis.
Keywords: Fashion cities, Fashion Capitals, Social Networks, SNA, Ranking-based Ties, System
of cities.
1. INTRODUCTION
Our purpose is to offer the beginnings of a new line of inquiry into social networks, to apply a
social network analysis to the core group of global fashion cities. The question motivating our
inquiry is whether and how social network effects have spillovers and connect each other; we aregoing to consider a system of cities distribution where we focus on “Ranking-based ties” social
networks.In our paper we would start a discussion which is still “ongoing”. We consider a system of
“objects” of the same class that would be able to interact. The objects in question are ordered

7/30/2019 BSR.vol.1 Iss.1 .Martinez.hernandez.sna.Fashion.cities
http://slidepdf.com/reader/full/bsrvol1-iss1-martinezhernandezsnafashioncities 2/23
Business Systems Review, ISSN: 2280-3866
Volume 1, Issue 1, 2012
This work is licensed under the Creative Commons Attribution 3.0 Unported License. To view a copy of this license, visit http://creativecommons.org/licenses/by/3.0/
226
according to their “performance” in a particular ranking. That “performance” will be, ultimately
and therefore this ranking, which is cause-effect and reason-consequence, the root of allrelationships that would exist among them.
These relationships are realized through mechanisms such as competition, imitation, leadership,monitoring, differentiation, etc. These are mechanisms all of which can be at least partially
driven by this ranking.
Let be S=< E, R > an ordered system with a set of individual E, E={e1,e2,…,en} and a totally
order relationship R with the usual properties, that means being reflexive, anti-symmetric and
transitive .
Over this structure we consider the ranking function R as a map from the set E to the Real Space,
R : R: ER / R(ei) = Ri
with:
∀i : Ri ∈ Q being Q, the Set of rational numbers,
Ri >R j ⇔ ei precedes e j by the order R ,
max{ Ri} ≤ N and min { Ri} ≥ 0
On such structures may induce a binary relation between each two of the elements E, so that bothlink according to some criterion consistent with the relationship.
The ultimate goal and purpose of our work is to see whether it is possible to extract a set of
viewable and analyzable interactions with SNA resources, from a initial sort of order, so as to
facilitate research in areas where it is conceivable that this order relation is capable of generating
interactive behaviors of interest. Several examples of these situations could be the following: the
presence of various firms in the same market segment; the competition between electioncandidates; competition between countries, regions, or even companies in the market of a
product; organization of events; and supremacy at commercial, sports, economic or militaryenvironment.This will be the goal in the case study in which we get a binary relationship that grows with
some measure of the discrepancy between the two orders of the two elements of E considered,
and it is also growing with some measure of relevance or importance of both.
We want to analyze a particular case, the relationships of influence among fashion cities or
capitals (The Global Fashion Capitals). We get a triennial ranking from The Global Language
Monitor (GLM) which is an Austin, Texas-based company that collectively documents, analyzes
and tracks trends (www.languagemonitor.com and en.wikipedia.org/wiki/Fashion_capital ).
From these raw data we would establish different relationships meaning competitiveness,gravitation, emulation, imitation, differentiation, leadership, servility, etc. We want to check if
these relationships that determine the ranking can be useful to explain which fashion-city
network works from a linkage perspective. We assume as work methodology that ranking and
network relationships mutually define, or codetermine, each other.
Any ranking is based on the best-worst performance of individuals or nodes on a set of values,
traits, attributes, variables, etc. Furthermore consideration of dynamics or structure interactions
(at a given time) of the system comprising the set of individuals would let us to consider a quitedifferent set of relationships among those individuals who in one way or another are induced orhave been the cause of this sort.

7/30/2019 BSR.vol.1 Iss.1 .Martinez.hernandez.sna.Fashion.cities
http://slidepdf.com/reader/full/bsrvol1-iss1-martinezhernandezsnafashioncities 3/23
Business Systems Review, ISSN: 2280-3866
Volume 1, Issue 1, 2012
This work is licensed under the Creative Commons Attribution 3.0 Unported License. To view a copy of this license, visit http://creativecommons.org/licenses/by/3.0/
227
In our paper we approach this relationship by using the conceptual and methodological apparatus
of Social Network Analysis (SNA). According to SNA standpoint methodology, ties among
individuals induced by a ranking may be:
− Uni-directional or bidirectional (Oriented-Not oriented)
− Valued or not valued
Figure 1 shows an outline:
Figure 1: Typology of Networks
On the other hand if we consider the case valued and the strength associated with the links and
how can depend (be caused / or cause) of the organization and ranking of the relative position
between nodes (individuals), there would be a lot of possibilities that are summarized and shown
in Table 1.Therefore, following that line, in one-directional ranked-based network, the ties between two
nodes reach values from the best to the worst one (B-W) or in the reverse direction (W-B).Moreover, considering the strength of valued ties, the relevance of each node should play an
important role that we still have not developed.
The current state of our research does not allow consideration of all cases and we only haveexplored some of these possibilities in the case of Fashion Cities. We have considered the
classification as given, and not lose sight of that once obtained some results, perhaps it might be
interesting to compare them with empirical studies that present data from the fashion industry
itself, its agents and professionals, through objective economic indicators and statements of
professional opinion.

7/30/2019 BSR.vol.1 Iss.1 .Martinez.hernandez.sna.Fashion.cities
http://slidepdf.com/reader/full/bsrvol1-iss1-martinezhernandezsnafashioncities 4/23
Business Systems Review, ISSN: 2280-3866
Volume 1, Issue 1, 2012
This work is licensed under the Creative Commons Attribution 3.0 Unported License. To view a copy of this license, visit http://creativecommons.org/licenses/by/3.0/
228
Table 1. Different kinds of Ranking-based Networks
ONE WAY BIDIRECTIONAL
NON-VALUED
B-W W-B
Leadership
Prevailing
position
Followship
Subordinating
Not-
Significant
VALUED
CreasingImitated /
Emulated by
Inspiring
Imitation / Emulation to
Be inspired by
WatchfulnessCompetition
Cooperation
Decreasing
Differentiatio
n from
Looking for
own way
Competition for the
best position
Gravitation.
(each other)
Consideration
Creasing/ Decreasing
An integrated
set of
relations
An integrated set of relations
An integrated set of not valued relations
2. THE SYSTEM OF THE TOP FASHION CAPITAL CITIES IN THE WORLD
According to a survey developed by Global Language Monitor, there is a ranked number forevery capital that could be consider important among the world’s most fashionable cities. Global
Language Monitor, or GLM, is a media analytics company that documents, analyzes and tracks
cultural trends in language the world over, with a particular emphasis upon Global English
(http://www.languagemonitor.com).GLM's main services include Narrative Tracker which is based on global discourse, providing a
real-time, accurate picture about any topic, at any point in time. Narrative Tracker analyzes the
Internet, blogosphere, the top 75,000 print and electronic global media, as well as new social
media sources as they emerge (en.wikipedia.org/wiki/Global_Language_Monitor ).We can define fashion capital as a city which is a major center for the fashion industry and in
which many activities including the production and retailing of fashion products, fashionimportant events (such as fashion weeks and awards) and fashion related trade fairs generate
quite significant economic output.
A fashion capital will generally show an active, vivid, strong and unique subculture, an
environment capable of inspiring not only fashion professionals, but also the citizens of the
whole city, turning its street style and street culture into essential characteristics to consider.A fashion capital will also usually have a broad mix of business, entertainment, culture, andleisure activities and be internationally recognized for having a unique and peculiar identity.
There are currently widely regarded as being four principal fashion capitals in the world, known
as “the big four”: London, Milan, New York City and Paris. An annual ranking of the leading
fashion capitals is produced by Global Language Monitor. Berlin and Singapore broke in 2011
into the Top Ten, which is the core whole reference (www.languagemonitor.com/fashion/london-
overtakes-new-york-as-top-global-fashion-capital ). In 2010 world fashion capital moved from
Europe continent to United States of America (www.languagemonitor.com/fashion/new-york-
regains-fashion-capital-crown-from-milan), and in 2011 London regained this top score forEurope again, being New York the one holding longer this position in recent years.

7/30/2019 BSR.vol.1 Iss.1 .Martinez.hernandez.sna.Fashion.cities
http://slidepdf.com/reader/full/bsrvol1-iss1-martinezhernandezsnafashioncities 5/23
Business Systems Review, ISSN: 2280-3866
Volume 1, Issue 1, 2012
This work is licensed under the Creative Commons Attribution 3.0 Unported License. To view a copy of this license, visit http://creativecommons.org/licenses/by/3.0/
229
Rank of scoring average “ Ri” of these cities has been obtained from the fashion city annual
ranking from 2009 to 2011 by subtracting 50 from the average position. Table 2 (in Appendix)shows the cities ordered by ranking average.
It should be noted that some cities are labelled with “N” meaning its absence in the ranking forthe considered year.
3. THE NETWORK OF FASHION CAPITAL CITIES
Considering this ranking scores we initially thought that the elements of the adjacency matrixcould be:
0
in other case
max(2, )
ii
i iij
ji j
A i
R R A
R R R
= ∀
=
−
In this way, the ties between cities link two nodes with a strength that should be proportional to
the relevance of both cities (the geometric mean) and, as well, the greater relative position
between in and out nodes, the greater strength.
However, this valuation favored too much the ties between far (but not relevant) cities. This
inconvenient was avoided dividing by the factor max (2, |Ri-Rj|).
Finally, the proposed network could be summarized with an adjacency matrix with:
0
in other case
max(2, )
ii
i iij
ji j
A i
R R A
R R R
= ∀
=
−
Figure 2 shows this final complete network, and an enlargement of the central area is displayed
in Figure 3.
Blue circles represents European cities, black ones North American cities, gray ones are Asian-
Pacific cities, violet ones are Latin American cities, red ones are from Middle East, deep green is
the color for African cities and the light green one represents Moscow.
It is remarkable that the central position in display is in consonance with the relevance of eachcity. Central core is compound by the constellation of the great four London, Paris, Milan and New
York; including as well, Los Angeles and Hong Kong, with some more additional cities
surrounding the main ones.
4. PROCESSING ALL INFLUENCES AND CONNECTIONS AMONG EACHOTHER FASHION CAPITALS
We have selected the resulting networks of consider only intensity ratios exceeding decreasingvalues. In this way we would be able to visualize how influences are configured according to a
particular topology, in order to provide several relevant clues about how transmission of
innovations, guidelines, criteria, styles, etc. works in the fashion world connecting all different
centres of influence.

7/30/2019 BSR.vol.1 Iss.1 .Martinez.hernandez.sna.Fashion.cities
http://slidepdf.com/reader/full/bsrvol1-iss1-martinezhernandezsnafashioncities 6/23
Business Systems Review, ISSN: 2280-3866
Volume 1, Issue 1, 2012
This work is licensed under the Creative Commons Attribution 3.0 Unported License. To view a copy of this license, visit http://creativecommons.org/licenses/by/3.0/
230
Considering only the relations with values of strength greater than 23 network, we reach the
maximum intensity network where we are able to find only the five major world capitals of fashion, although comprising only incomplete connectivity influences as from New York to
Paris, Milan and London, and London to Hong Kong (this one perhaps because of post-colonialcontinuity as a potential explanation). This first step is shown in Figure 4 (in Appendix).
When decreasing the influence intensity threshold up to 20 (Aij>20), we find that the “core
constellation” of fashion capitals constitutes a highly connected network. Even if it is still an
incomplete network, we get a very high density connected network. Only connections in both
directions from New York to the cities of Los Angeles and Hong Kong fall below the threshold
(Figure 5, in Appendix).
Only by lowering the threshold to 19 (Aij> 19), is when the first links between cities of second
level cluster may be shown (Figure 6). Specifically we can appreciate the influence of Sydneyover Barcelona and of Barcelona on Tokyo (interestingly, the main cluster connectivity is not
increased).
As we reduce the threshold of significance, it seems that more cities or fashion capitals areincorporated into this second-level cluster network; but pretty slowly (well, with a threshold of
18, only Rome and Shanghai are influenced by Tokyo) and after that the process gets more speed(Figure 7).
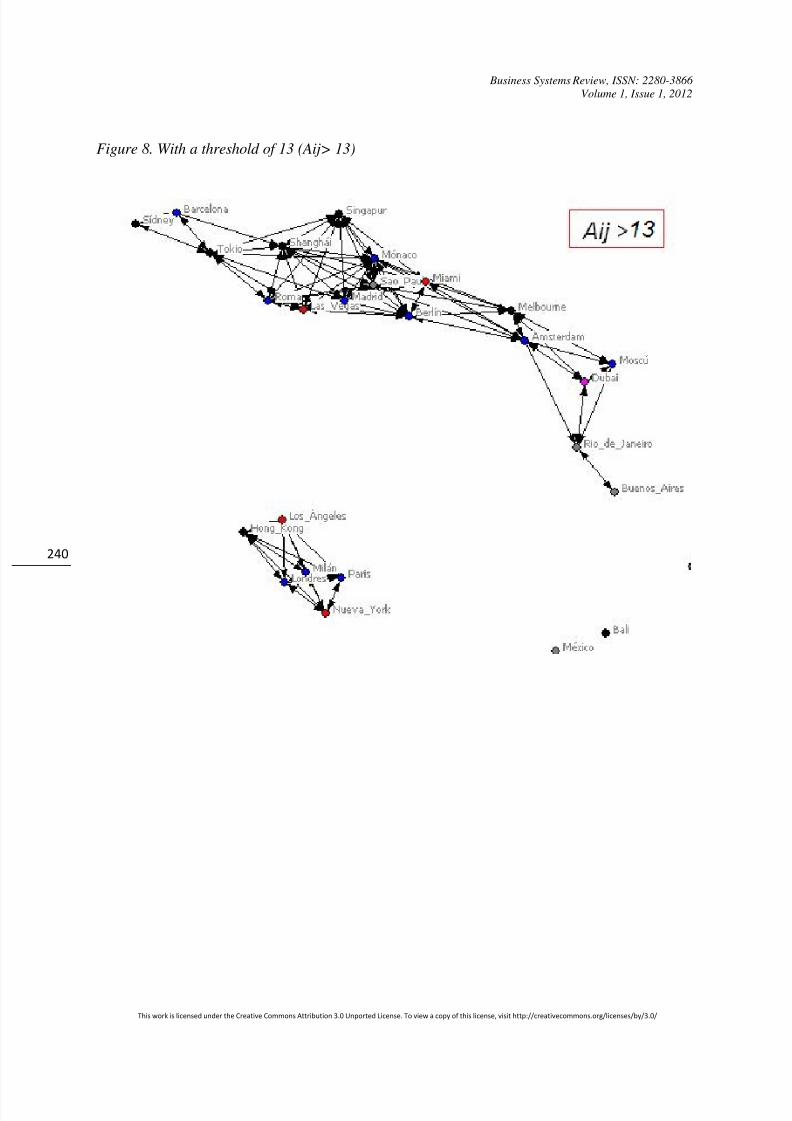
Upon reaching a minimum intensity of 13 (Aij>13) (Figure 8, in Appendix), the network shows
two clearly differentiated clusters with high degree of connectivity, although not complete, in
neither of both cases.If we consider a somewhat lower level of intensity as the threshold we get a third cluster of axial
arrangement around the core emerging fashion city of Mexico. This third cluster contains only
two-way interactions, Mexico-Mumbai and Mexico-Bali. In addition it is remarkable that the two
main clusters interact for the first time through the influences of Los Angeles and Hong Kong in
direction to Sydney (which recreates the Pacific Connection) (Figure 9, in Appendix).Related to the third cluster which appears at this level of strength, it is not reasonable to consider
that it matches relations of an actual imitation, emulation, differentiation, cronyism, etc. and
looks more like a sub-net spuriously generated by its own (by the relative position and variationsthereof in these three years considered).
Interestingly, despite the fact that we have simply assumed that the order of the ranking of cities
should be consistent with the set of relations of influence really produced, until we get to thislevel, all the relationships that had been appearing were intuitively quite realistic.
Going down to an intensity level of 7 (Aij> 7), we get a fourth cluster of interconnected cities
with medium density which constitutes another group of fashion cities competing in a lower
division or league. There we find some important cities economically relevant at a regional or
even global level (as Chicago) but without so much tradition in the fashion industry that onlyrecently have started to look for presence in the fashion world.
Moreover, in this level of intensity the basic framework of the very most relevant fashion
capitals (the mean core) is already built thanks to the emergence of new influences between
primary and secondary constellation; as influences between Paris and London to Sydney, or Los
Angeles and Hong Kong to Barcelona (Figure 10, in Appendix).
Upon reaching the threshold intensity 5, there is not any isolated cluster found any more. The
global network of fashion capitals is already constituted as such. However there are some
isolated nodes, not integrated in any network, that are identified as the cities of Atlanta, Caracas,Medellin, Frankfurt, Krakow, Antwerp and Abu Dhabi (Figure 11, in Appendix).

7/30/2019 BSR.vol.1 Iss.1 .Martinez.hernandez.sna.Fashion.cities
http://slidepdf.com/reader/full/bsrvol1-iss1-martinezhernandezsnafashioncities 7/23
Business Systems Review, ISSN: 2280-3866
Volume 1, Issue 1, 2012
This work is licensed under the Creative Commons Attribution 3.0 Unported License. To view a copy of this license, visit http://creativecommons.org/licenses/by/3.0/
231
Now, we have got a network not only consolidated or quite compact, but also because of the
density of the relationships, that has been increased considerably. By the other hand, remains ahigher density of connections within the initial clusters, more than among the different clusters.
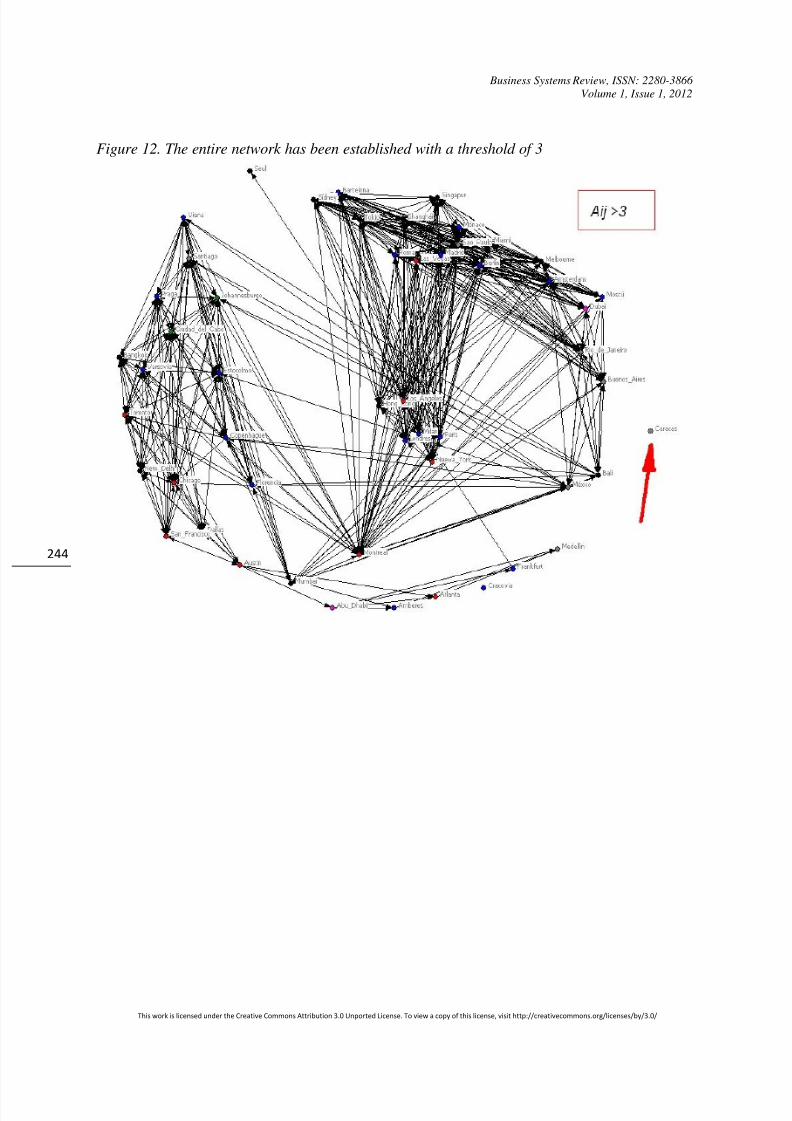
If we reach a threshold of 3, the entire network has been established; Caracas and Krakow are theonly cities which remain as isolated nodes. The primary and more important two clusters have
already formed a compact and high density core of relationships (Figure 12, in Appendix).
The hierarchy gets dissolved almost reaching this level of quite reduced level of influence. It is
important to remark that a ranking is a hierarchy. And a hierarchy is an absolutely linear
network, nothing heavy or dense. If the hierarchy of fashion cities creates dense relationships is
because it is something dynamic and competitive.
Finally, considering the intensity threshold of 1 (Aij>1), we have already completed the network
of relationships with relevant or important influence that we had initially considered. We reachthe whole network in which Caracas is also incorporated. The network has clearly two areas of
maximum density relationships (the two main clusters) which are also highly related between
them (Figure 13, in Appendix). As we will see, this gradual process of clustering or densificationof relationships is consistent with the key network statistics analysis.
5. GEOGRAPHICAL ANALYSIS OF FASHION-CITIES NETWORK
The relations among the different cities in the network display a typical performance of
interaction in a globalized world. However, strong polarizations towards privileged regional
areas could be verified in the graphic above (Figure 14, in Appendix) which shows the mean
intensity of all ties between cities of each geographical area to each other.
Influences, from and to, North America and West Europe are clearly greater than the rest. And a
lesser relevance of African cities is also evident.Relations among cities of different geographical areas are reproducing a globalized world with
very distinct polarizations which can be identified in the average values of the intensities of theseinfluences:
If we only consider the ties with relevant strength, the geographical analysis would be more
illustrative. In fact, considering the number of main interactions, the number of interactions with
strength greater than one, as it is shown in the following figure, some conclusions could be
obtained:
− The maximum number of main interactions is between cities groups from West Europe andAsia-Pacific (21 and 15, in one and the other direction).
− These two regions, jointly with North America, constitute a triad that becomes the
fundamental core of the fashion-cities main relations with a number of 79(21+15+11+15+12+5) relations, while the other areas hold many fewer relations and Africahas none.
The following graph (Figure 15, in Appendix) shows the number of relevant intensity influences
(greater than 1) among the various geographical areas.

7/30/2019 BSR.vol.1 Iss.1 .Martinez.hernandez.sna.Fashion.cities
http://slidepdf.com/reader/full/bsrvol1-iss1-martinezhernandezsnafashioncities 8/23
Business Systems Review, ISSN: 2280-3866
Volume 1, Issue 1, 2012
This work is licensed under the Creative Commons Attribution 3.0 Unported License. To view a copy of this license, visit http://creativecommons.org/licenses/by/3.0/
232
6. STATISTICAL ANALYSIS OF THE MAIN NETWORK NODES
In this section we carry out a global analysis of fundamental features for nodes (fashion capital
cities) in the network considering ties of strength superior than one and extending analysis to thewhole network.
For each raw identifying a city, Table 3 (in Appendix) displays its regional attributes: area,
country, cultural tradition, as well as the principal indicators of the fundamental network features
as neighbourhood, closeness and between-ness.
“Degree” of a node is the number of links that involve this node, so it indicates the cardinality of
neighbourhood nodes. Obviously the greater degree the more relevant the node is. Maximumvalue of degree is “n-1”, being “n” total number nodes being minimum value as 0 (when node is
absolutely isolate). Initially being n=53; by excluding the impact relationships below 1, the
number of “important nodes” becomes n= 47 and the maximum 46.Between-ness of a node is the number of paths among different nodes that pass through that
node. This indicator informs us about how important the node is. It means intermediation as ameasure of how easily a node can connect with other nodes.
Finally, “closeness” is a reciprocal measure of the (harmonic) mean distance between the
considering node and all the rest. Being l (i,j) the distance between the nodes i and j, the numberof links we can found across the shortest path that ties i with j, the (harmonic) closeness of the
node i is:
1
( , )i
i j
n
l i jδ
≠
−=
∑
At the final results table, we see how the degree is descending from the maximum value (46 for
cities belonging to the main central cluster in orange colour), as has been described in former
epigraph. Subsequently, a second best value appears for Barcelona and Sydney with a degree of 43, constituting a transition from the former group to the second cluster (pink colour), with a
degree of 42, with an epigone group integrated by Dubai, Moscow and Rio de Janeiro. From here
it is shown a smoothing descendent degree for several cities from Buenos Aires to Frankfurt.
Finally, the last cities have no important relations (strength ≥ 1) and so their degree has value 0.
As expected, the three centrality indicators (degree, between-ness and closeness) display similarperformance for the different cities showing a hierarchical clustering of decreasing centrality or
relevance. Colour layout could help to perceive it.
6.1 The degree distribution
Another usual element in the statistical analysis of networks is the degree distribution study, theanalysis of the frequency distribution of the degree values and its comparison with standardsignificant distributions.
Typically interest is focused to the possibility of fitting a Pareto or Poisson distribution. Poisson
distribution is the performance that should show a merely random network. On the other
extreme, a potential Pareto distribution is the typical scale-free distribution with an accelerated
decreasing frequency (in potential way) with the increasing degree.
Figure 16 shows the degree distribution of the cities degree. Comparing with the Poisson and
standard Pareto distributions graphics (Figure 17 and Figure 18 in Appendix) we can clearlyconclude that the distribution is so far from one as from the other, so its performance is notstochastic but is not scaling-free.
7/30/2019 BSR.vol.1 Iss.1 .Martinez.hernandez.sna.Fashion.cities
http://slidepdf.com/reader/full/bsrvol1-iss1-martinezhernandezsnafashioncities 9/23
Business Systems Review, ISSN: 2280-3866
Volume 1, Issue 1, 2012
This work is licensed under the Creative Commons Attribution 3.0 Unported License. To view a copy of this license, visit http://creativecommons.org/licenses/by/3.0/
233
Kolmogorov-Smirnov tests results (Table 4, in Appendix) show an evident misfit to Poisson or
Normal distributions; and misfit to Pareto distribution is obvious since the distributions graph.Differing from the scaling-free distribution indicates that this structure lacks “strategic points”
and also indicates that is remarkably distributed spite of having been generated by an ordinalrelation. In fact, it indicates now a high degree of intercommunication.
REFERENCES
Andersson, M., Karlsson, C. (2004). Regional innovation systems in small & medium- sizedregions. Paper No. 10, CESIS Working Paper, KTH Royal Institute of Technology.
Barabási, A. L., Bonabeau E. (2003). Redes sin escala. Investigación y Ciencia, Julio, p. 58–67.
Barabási, A.L. & Albert, R. (1999). Emergence of scaling in random networks, Science, 286,
509–512.Jackson, M.O. (2008). Social and Economic Networks. Princeton University Press.
Newman, M. E. J. (2005). Power laws, Pareto distributions and Zipf's law. Contemporary
Physics, 46, 323–351. Retrieved: 01/08/2012 from: http://arxiv.org/abs/cond-mat/0412004v3
Serrano, M. A., Boguñá, M., Vespignani, A. (2007). Patterns of dominant flows in the worldtrade web. Journal of Economic Interaction and Coordination, 2, 111–124.

7/30/2019 BSR.vol.1 Iss.1 .Martinez.hernandez.sna.Fashion.cities
http://slidepdf.com/reader/full/bsrvol1-iss1-martinezhernandezsnafashioncities 10/23
Business Systems Review, ISSN: 2280-3866
Volume 1, Issue 1, 2012
This work is licensed under the Creative Commons Attribution 3.0 Unported License. To view a copy of this license, visit http://creativecommons.org/licenses/by/3.0/
234
APPENDIX
Table 2: Ranking of fashion capitals
RANKING FASHION CAPITALS Ranking 2011 Ranking2010
Ranking2009
Ranking average score Ri
New York 2 1 2 48,33
London 1 3 5 47
Paris 3 4 3 46,67
Milan 4 6 1 46,33
Los Angeles 5 5 4 45,33
Hong Kong 6 2 7 45
Sydney 11 7 9 41
Barcelona 7 9 14 40
Tokyo 9 14 12 38,33Shanghai 14 12 14 36,67
Rome 13 22 6 36,33
Las Vegas 16 16 10 36
Singapore 8 15 20 35,67
Madrid 12 10 21 35,67
Monaco 15 N N 35
Sao Paulo 25 13 8 34,67
Berlin 10 18 19 34,33
Miami 26 8 13 34,33
Melbourne 17 11 25 32,33
Amsterdam 19 17 N 32
Dubai 27 21 11 30,33
Moscow 18 20 22 30
Rio de Janeiro 23 19 20 29,33
Buenos Aires 20 24 24 27,33
Bali 21 32 N 23,5
Mexico City 22 29 31 22,67
Mumbai 24 28 30 22,67
Florence 31 N N 19
Vienna 35 27 N 19
Copenhagen 29 34 N 18,5
Johannesburg 41 25 N 17
Santiago 30 31 39 16,67
Stockholm 28 33 40 16,33
Prague 48 26 29 15,67
Warsaw 33 36 N 15,5
Cape Town 46 23 N 15,5
Toronto 34 38 N 14

7/30/2019 BSR.vol.1 Iss.1 .Martinez.hernandez.sna.Fashion.cities
http://slidepdf.com/reader/full/bsrvol1-iss1-martinezhernandezsnafashioncities 11/23
Business Systems Review, ISSN: 2280-3866
Volume 1, Issue 1, 2012
This work is licensed under the Creative Commons Attribution 3.0 Unported License. To view a copy of this license, visit http://creativecommons.org/licenses/by/3.0/
235
Bangkok 32 35 42 13,67
Chicago 36 37 N 13,5
New Delhi 39 30 43 12,67San Francisco 38 N N 12
Dallas 37 40 N 11,5
Austin 40 N N 10
Abu Dhabi 42 N N 8
Antwerp 44 41 N 7,5
Atlanta 45 40 N 7,5
Frankfurt 43 43 N 7
Medellin N 44 N 6
Seoul N 45 N 5
Krakow 47 39 50 4,67Caracas 50 42 N 4
Montreal 49 N N 1
Table 3: Regional attributes and fundamental network features of fashion cities
City Regional AreaCulturetradition
Country Degree Betweenness ClosenessHarmonicCloseness
New_York N_America Ang-Saxon USA 46 29,415 358 46
London European Union Ang-Saxon UK 46 29,415 358 46
Milan European Union Italian Italy 46 29,415 358 46
Paris European Union French France 46 29,415 358 46
Hong_Kong Asia-Pacific Asian China 46 29,415 358 46
Los_Angeles N_America AngSaxon USA 46 29,415 358 46
Barcelona European Union Hispanic Spain 43 9,915 361 44,5
Sydney Asia-Pacific AngSaxon Australia 43 9,915 361 44,5
Amsterdam European Union Eur Holland 42 5,54 362 44
Berlin European Union Eur Germany 42 5,54 362 44
Las_Vegas N_America AngSaxon USA 42 5,54 362 44
Madrid European Union Hispanic Spain 42 5,54 362 44
Melbourne Asia-Pacific AngSaxon Australia 42 5,54 362 44
Miami N_America AngSaxon USA 42 5,54 362 44
Monaco European Union French Monaco 42 5,54 362 44
Rome European Union Italian Italy 42 5,54 362 44Sao_Paulo Latin America Hispan Brasil 42 5,54 362 44
Shanghai Asia-Pacific Asian China 42 5,54 362 44
Singapur Asia-Pacific Asian Singapur 42 5,54 362 44
Tokyo Asia-Pacific Asian Japan 42 5,54 362 44
Dubai Middle East Muslim Dubai 41 4,44 363 43,5
Moscow East Europe Eur Russia 41 4,44 363 43,5
Rio_de_Janeiro Latin America Hispan Brasil 41 4,44 363 43,5
Buenos_Aires Latin America Hispan Argentina 40 3,657 364 43
Bali Asia-Pacific Asian Indonesia 38 2,365 366 42
Mexico City Latin America Hispanic Mexico 36 1,365 368 41

7/30/2019 BSR.vol.1 Iss.1 .Martinez.hernandez.sna.Fashion.cities
http://slidepdf.com/reader/full/bsrvol1-iss1-martinezhernandezsnafashioncities 12/23
Business Systems Review, ISSN: 2280-3866
Volume 1, Issue 1, 2012
This work is licensed under the Creative Commons Attribution 3.0 Unported License. To view a copy of this license, visit http://creativecommons.org/licenses/by/3.0/
236
Mumbai Asia-Pacific Asian India 36 1,365 368 41
Florence European Union Italian Italy 31 0,069 373 38,5
Vienna European Union Eur Austria 31 0,069 373 38,5
Copenhaguen European Union Eur Denmark 30 0 374 38Johannesburg Africa AngSax SAfrica 30 0 374 38
Santiago Latin America Hispan Chile 29 0 375 37,5
Cape_Town Africa AngSax SAfrica 27 0 377 36,5
Stockholm European Union Eur Sweden 27 0 377 36,5
Prague European Union Eur Czech Rep 27 0 377 36,5
Toronto N_America AngSax Canada 27 0 377 36,5
Warsaw European Union Eur Poland 27 0 377 36,5
Bangkok Asia-Pacific Asian Tailhand 25 0 379 35,5
Chicago N_America AngSax USA 25 0 379 35,5
New_Delhi Asia-Pacific Asian India 24 0 380 35
San_Francisco N_America AngSax USA 24 0 380 35Dallas N_America AngSax USA 23 0 381 34,5
Austin N_America AngSax USA 20 0 384 33
Abu_Dhabi Middle East Muslim Abu Dhabi 8 0 396 27
Antwerpen European Union Eur Holland 6 0 398 26
Atlanta N_America AngSaxon USA 6 0 398 26
Frankfurt European Union Eur Germany 6 0 398 26
Caracas Latin America Hispanic Venezuela 0 0 2704 0
Krakow European Union Eur Poland 0 0 2704 0
Medellin Latin America Hispanic Colombia 0 0 2704 0
Montreal N_America French Canada 0 0 2704 0
Seoul Asia-Pacific Asian SCorea 0 0 2704 0
Table 4: Kolmogorov Smirnov’s goodness-of-fit tests
Kolmogorov-Smirnov test forDEGREE DISTRIBUTION
FIT TO NORMAL DISTRIBUTION degree
N 52
Normal Parameters mean 30,6154
Standarddeviation
14,82731
EXTREME DIFERENCES Absolute ,200
Positive ,150
Negative -,200
Kolmogorov-Smirnov Z 1,446
Asymptotic significance. (bilateral) ,031
FIT TO POISSON
DISTRIBUTION degree
N 52
Poisson parameters mean 30,6154
EXTREME
DIFERENCESAbsolute ,403
Positive ,173
Negative -,403
Kolmogorov-Smirnov Z 2,904
Asymptotic significance. (bilateral) ,000

7/30/2019 BSR.vol.1 Iss.1 .Martinez.hernandez.sna.Fashion.cities
http://slidepdf.com/reader/full/bsrvol1-iss1-martinezhernandezsnafashioncities 13/23
Business Systems Review, ISSN: 2280-3866
Volume 1, Issue 1, 2012
This work is licensed under the Creative Commons Attribution 3.0 Unported License. To view a copy of this license, visit http://creativecommons.org/licenses/by/3.0/
237
Figure 2. The complete network
Figure 3. Enlargement of central area of the network

7/30/2019 BSR.vol.1 Iss.1 .Martinez.hernandez.sna.Fashion.cities
http://slidepdf.com/reader/full/bsrvol1-iss1-martinezhernandezsnafashioncities 14/23
Business Systems Review, ISSN: 2280-3866
Volume 1, Issue 1, 2012
This work is licensed under the Creative Commons Attribution 3.0 Unported License. To view a copy of this license, visit http://creativecommons.org/licenses/by/3.0/
238
Figure 4. Five major world capitals of fashion, maximum intensity network
Figure 5. Influence intensity threshold up to 20 cities

7/30/2019 BSR.vol.1 Iss.1 .Martinez.hernandez.sna.Fashion.cities
http://slidepdf.com/reader/full/bsrvol1-iss1-martinezhernandezsnafashioncities 15/23
Business Systems Review, ISSN: 2280-3866
Volume 1, Issue 1, 2012
This work is licensed under the Creative Commons Attribution 3.0 Unported License. To view a copy of this license, visit http://creativecommons.org/licenses/by/3.0/
239
Figure 6. Lowering the threshold to 19 (Aij> 19)
Figure 7. With a threshold of 18 (Aij> 18)
7/30/2019 BSR.vol.1 Iss.1 .Martinez.hernandez.sna.Fashion.cities
http://slidepdf.com/reader/full/bsrvol1-iss1-martinezhernandezsnafashioncities 16/23
Business Systems Review, ISSN: 2280-3866
Volume 1, Issue 1, 2012
This work is licensed under the Creative Commons Attribution 3.0 Unported License. To view a copy of this license, visit http://creativecommons.org/licenses/by/3.0/
240
Figure 8. With a threshold of 13 (Aij> 13)

7/30/2019 BSR.vol.1 Iss.1 .Martinez.hernandez.sna.Fashion.cities
http://slidepdf.com/reader/full/bsrvol1-iss1-martinezhernandezsnafashioncities 17/23
Business Systems Review, ISSN: 2280-3866
Volume 1, Issue 1, 2012
This work is licensed under the Creative Commons Attribution 3.0 Unported License. To view a copy of this license, visit http://creativecommons.org/licenses/by/3.0/
241
Figure 9. Third cluster appears while the first two ones interact through the Pacific Connection

7/30/2019 BSR.vol.1 Iss.1 .Martinez.hernandez.sna.Fashion.cities
http://slidepdf.com/reader/full/bsrvol1-iss1-martinezhernandezsnafashioncities 18/23
Business Systems Review, ISSN: 2280-3866
Volume 1, Issue 1, 2012
This work is licensed under the Creative Commons Attribution 3.0 Unported License. To view a copy of this license, visit http://creativecommons.org/licenses/by/3.0/
242
Figure 10. Level of 7 brings a fourth cluster and some relevant connections

7/30/2019 BSR.vol.1 Iss.1 .Martinez.hernandez.sna.Fashion.cities
http://slidepdf.com/reader/full/bsrvol1-iss1-martinezhernandezsnafashioncities 19/23
Business Systems Review, ISSN: 2280-3866
Volume 1, Issue 1, 2012
This work is licensed under the Creative Commons Attribution 3.0 Unported License. To view a copy of this license, visit http://creativecommons.org/licenses/by/3.0/
243
Figure 11. The global network of fashion capitals is already constituted
7/30/2019 BSR.vol.1 Iss.1 .Martinez.hernandez.sna.Fashion.cities
http://slidepdf.com/reader/full/bsrvol1-iss1-martinezhernandezsnafashioncities 20/23
Business Systems Review, ISSN: 2280-3866
Volume 1, Issue 1, 2012
This work is licensed under the Creative Commons Attribution 3.0 Unported License. To view a copy of this license, visit http://creativecommons.org/licenses/by/3.0/
244
Figure 12. The entire network has been established with a threshold of 3

7/30/2019 BSR.vol.1 Iss.1 .Martinez.hernandez.sna.Fashion.cities
http://slidepdf.com/reader/full/bsrvol1-iss1-martinezhernandezsnafashioncities 21/23
Business Systems Review, ISSN: 2280-3866
Volume 1, Issue 1, 2012
This work is licensed under the Creative Commons Attribution 3.0 Unported License. To view a copy of this license, visit http://creativecommons.org/licenses/by/3.0/
245
Figure 13. The global network with two main clusters defined
Figure 14. Mean intensity links between geographical areas

7/30/2019 BSR.vol.1 Iss.1 .Martinez.hernandez.sna.Fashion.cities
http://slidepdf.com/reader/full/bsrvol1-iss1-martinezhernandezsnafashioncities 22/23
Business Systems Review, ISSN: 2280-3866
Volume 1, Issue 1, 2012
This work is licensed under the Creative Commons Attribution 3.0 Unported License. To view a copy of this license, visit http://creativecommons.org/licenses/by/3.0/
246
Figure 15. Number of influences of maximum intensity between geographical areas
Figure16. Degree distribution and descriptive

7/30/2019 BSR.vol.1 Iss.1 .Martinez.hernandez.sna.Fashion.cities
http://slidepdf.com/reader/full/bsrvol1-iss1-martinezhernandezsnafashioncities 23/23
Business Systems Review, ISSN: 2280-3866
Volume 1, Issue 1, 2012
This work is licensed under the Creative Commons Attribution 3.0 Unported License. To view a copy of this license, visit http://creativecommons.org/licenses/by/3.0/
247
Figure 17: Poisson distribution
Figure 18. Pareto distribution


![Hurwit.pericles Athens Building.lib Iss[1]](https://static.fdocuments.in/doc/165x107/553684a4550346640d8b496d/hurwitpericles-athens-buildinglib-iss1.jpg)