BSC RESEARCH - Seeking Alpha · 1/28/2016 · BSC RESEARCH Vietnam Sector Outlook 2016 ... BTS and...
77
Transcript of BSC RESEARCH - Seeking Alpha · 1/28/2016 · BSC RESEARCH Vietnam Sector Outlook 2016 ... BTS and...


B S C R E S E A R C H
Vietnam Sector Outlook 2016 Part 1
TABLE OF CONTENTS
2015 Sector Investment Strategy Review ................................................................................... 1
1. BSC’s view on the market and sector in 2015 ..................................................................... 1
2. Growth in earnings and valuations ...................................................................................... 5
3. Comparison between sector growth and VN-index in 2015 ................................................. 6
3. Top stocks in 2015 ............................................................................................................. 8
4. Performance of recommended stocks ................................................................................ 9
5. Sectors business performance in 9M2015 .........................................................................10
Banking Sector..........................................................................................................................12
Real Estate Sector ....................................................................................................................17
Construction Sector ..................................................................................................................19
Cement Sector ..........................................................................................................................21
Ceramic Sector .........................................................................................................................23
Technology Sector ....................................................................................................................25
Seaport Sector ..........................................................................................................................28
Automobile Sector .....................................................................................................................30
Non-life Insurance Sector ..........................................................................................................32
Textile Sector ............................................................................................................................35
Electricity Sector .......................................................................................................................38
Tire Sector ................................................................................................................................43
Plastic Sector ............................................................................................................................45
Pharmaceutical Sector ..............................................................................................................48
Steel Sector ..............................................................................................................................50
Aquaculture Sector ...................................................................................................................55
Oil & Gas Sector .......................................................................................................................57
Fertilizer Sector .........................................................................................................................60
Sugar Sector .............................................................................................................................65
Marine Transportation Sector ....................................................................................................68
Natural Rubber Sector ..............................................................................................................70

B S C R E S E A R C H Vietnam Sector Outlook 2016 Part 1
1 // www.bsc.com.vn
2015 SECTOR INVESTMENT STRATEGY REVIEW
1. BSC’s view on the market and sector in 2015
In order to assess the accuracy and effectiveness of BSC’s view in The Sector Outlook Report 2015, we
consider different factors including (1) The market performance in 2015 and (2) Sector strategy
(1) The market performance in 2015
• In terms of points: The VN-Index closed at 579.02 points (+ 6.1%) on Dec 31st 2015, which
falls under the Neutral scenario forecasted in our 2015 Macro and Stock market report. "We
are in favor of Neutral Scenario in which VN-Index may finish at 600 pts, and if having various
strong supporting news (Positive Scenario), this index is expected to end at 650 pts." BSC has
predicted somewhat exactly end point of VN-Index in 2015 as comprehensively assessing that
several good factors like TPP agreement, EU-Vietnam FTA, Korea-Vietnam FTA and stable
Vietnam macro may significantly impact on the stock market.
• In terms of market movements: market fluctuations were close to our forecast. In our 2015
Macro and Stock market report, we stated that the market would perform positively in the first
6 months and bear major challenges in the last 6 months. In our 3Q report, we stated that the
market would perform positively in October, sideway in November and decrease in December.
• Information affecting VN-Index and stock market in 2015: As we predicted, information had
a positive impact on the market and enterprises was: stable macroeconomy, reduction in
lending rates, joining FTAs, TPP and opening ownership room for foreign investors. The
negative factors also happened as our forecast, such as the Fed rate hike in 2015, the
economic stagnation of China, the risks from Circular 36, which led to money recession.
• In term of Investment Strategy by cyclical timing. We made the following assessment:
"During the first half of 2015, stock groups leading the market in terms of size are: Blue Chip and Large cap" and "in second half of 2015: stocks with the strongest performance are small cap and MidCap" We assessed accurately the stock trend in 2015, with the first 6-
month period was led by good growth BCs and LargeCap group, up by 10% and 1.5%; while
MidCap and SmallCap went sideways during the first 3 quarters and only had a breakthrough
in the last months of the year with growth of 14.7% and 22.2%.

B S C R E S E A R C H
Vietnam Sector Outlook 2016 Part 1
www.bsc.com.vn // 2
Source: Bloomberg, BSC (2) Sector stategy 2015
Five notable investment topics in 2015: we gave 5 investment topics in 2015 and they had a strong
impact on VN- Index for the year. Moreover, most of our recommended stocks outperforned Vn-index
in 2015.
• First, the recovery of macro economy was more evitable and the finance sectors benefited from
this trend. At year end, Banking sector increased by 12.1% (VCB, BID), Insurance increased
by 51.23% (BIC, BMI)
• Second, real estate recovered with rising liquidity. This led to opportunities for dowstream
sectors such as construction, materials, and furnitures. The strongest growth belonged to
enterprises located in the South, thanks to the boost in civil investment and the FTAs. At year
end 2015, investors who followed this topic may gain profit from the BSC’s recommended
stocks or leading stocks of the sectors such as Construction (CTD, HBC), Real estate (VIC,
DXG), Materials (BMP, NTP), Ciment (HT1, BCC), Brick (CVT, VSC, VIT)...
• Third, energy price fell and electricity price increased, leading to an improvement in earnings
of sectors such as transportation, automobile, fertilizer, thermal, chemical, ... due to the low
input prices; In 2015, our recommended stocks also had good growth in the Chemicals sector
(PLC), Electricity (NT2), Fertilisers (DPM); transportation (GSP), ...
• Fourth, the expansionary monetary policy of ECB and the JCB caused depreciation in JPY and
EUR. BSC’s assessment was relatively accurate for this trend, although enterprises with large
EUR loans such as HT1, BCC, BTS and NT2 only recognized exchange rate gain in Q1 / 2015,
and recorded losses in the remaining quarters. Considering all of 2015, these businesses have
been recorded foreign exchange rate gains (HT1 and NT2 recorded strong growth in 2015)
104.3915994
107.7117422
114.7165797
122.1962546
119.7251609
90
95
100
105
110
115
120
125
T01 T02 T03 T04 T05 T06 T07 T08 T09 T10 T11 T12
Stock Movements in 2015
BCs Index LargeCap Index MidCap Index SmallCap Index Penny Index

B S C R E S E A R C H Vietnam Sector Outlook 2016 Part 1
3 // www.bsc.com.vn
• Fifth, the Free Trade Agreements (FTAs), in which ACFTA effective in Jan 1st 2015 negatively
affected the pharmaceutical and steel sectors, stock price movements for these sectors were
not positive in 2015. Meanwhile, our most expected sectors such as Logistics (GMD), ports
(VSC, HAH), and industrial (KBC, LHG) offered strong growth. Textile, a sector expected by
investors, did not yield significant growth.
Source: Bloomberg, BSC
2015 Sector outlook.
• We had commented, " Please note that Real estate and Bank are likely to lead VNIndex in
2015, replacing Oil and Gas position”. In fact, at the beginning the year, the banking sector had
strong increase, totaled 12.1% in 2015. terms of capitalization, the banking sector was the
largest group with the leading role. The proportion of the banking group's capitalization (VCB -
CTG - BID - STB - EIB - MBB) increased from 22.85% (05.01.2015) to 27.55% (29.12.2015),
in which VCB is the 2nd largest, accounting for 10.28% of total market capitalization.
On the other hand, the real estate sector did not grow as we expected, with 2.93% decrease
in the year. However, recommended real estate stocks had very good growth VIC (+ 20.37%),
DXG (+ 61.02%) and KDH (+ 24.42%).
• In addition, in 2015, the BSC is one of the first securities companies bullish on sectors of IT,
seaports, Insurance. With Seaports and insurance sectors, while being less attractive in the
65
115
165
215
265
315
T01 T02 T03 T04 T05 T06 T07 T08 T09 T10 T11 T12
VNIndex and Sectors
Vnindex Real Estate Construction Insurance
Textile Oil & Gas Steel Cement
Seaport Marine Transportation Sugar Aquaculture
Plastic Automobike Tire Technology
Rubber Fertilizer Power Pharmaceutical
Banking

B S C R E S E A R C H
Vietnam Sector Outlook 2016 Part 1
www.bsc.com.vn // 4
eyes of investors, BSC had published the report in June 2015 with Positive rating, before the
rise of these sectors in July (link Seaports report, links insurance report).
• We did not assess correctly for sugarcane and tire sectors in early 2015. However, in our
update report, we lowered our ratings for tire and sugar and the ability of related stocks to be
included in ETF of SBT and BHS (link to report) .We also did not assess correctly for the sector
with strongest growth in 2015, which was automobile sector.
Source: BSC
450
500
550
600
650
700
T01 T02 T03 T04 T05 T06 T07 T08 T09 T10 T11 T12
Vnindex and BSC's Sector Outlook Reports 2015
Sector outlook Q1:Bullish about Bank and Real Estate
Sector outlook Q2:Marine Transport and Tire are underperform
Sector outlook Q3:Bullish about Sea port, Technology and Insurence. Lower Marine Transport outlook, raising the prospect of Sugar
Sector outlook Q4:Lower prospects of Pharmaceutical, Tires and Marine Transportation
Sector report 01:Bullish about Insurance
Sector report 02:Bullish about Seaport
Sector report 03:Sugar

B S C R E S E A R C H Vietnam Sector Outlook 2016 Part 1
5 // www.bsc.com.vn
2. Growth in earnings and valuations
VN30 only yield a slight growth, VN MidCap recovered in earnings
Macroeconomic stability continues, high GDP growth had a positive impact on listed businesses.
Manufacturing activities expanded and with improvement in profitability in 2015. Average EPS trailing of
the market by the end of Q3/2015 reached 2,430 VND, up 9.7% compared to the 2014 EPS. If excluding
the abnormal profit from asset sales of KDC, trailing EPS 2015 would have been VND 2,230, up 4.5%
compared with 2014). In the last 2 years, average EPS growth of the market reached over 5%. However
EPS of VN30, the group with high influence on the market did not sustain an equivalent growth. VN30 EPS
in 2013, 2014 and trailing 2015 were respectively VNDF 2,167; 2,096; and 2,077 (excluding the abnormal
profit from asset sales of KDC). Sluggish profit growth is one reason VN30 stocks can not play the leading
growth in 2015 market.
Liquidity decline caused VN-Index price movement not comparable to the improved profits and book value
of listed stocks in the last 7 months.
VN-Index has relatively closely correlated to PE and PB movements in the first 5 months of 2015. However,
the gap gradually widened in June and maintained throughout the year. End of 2015, VN-Index increased
by 6.1% while P/E declined by 8.9% and PB decreased by 1.3%. This data shows that the movement in
2015H2 prices did not keep up with the improvement in fundamental factors such as EPS and BVPS.
Correlation between VN-Index and P/E, P/B in 2015
Source: Bloomberg, BSC Research
VN-Index, 106.1
P/E, 91.1
P/B, 98.7
80.0
85.0
90.0
95.0
100.0
105.0
110.0
115.0
120.0

B S C R E S E A R C H
Vietnam Sector Outlook 2016 Part 1
www.bsc.com.vn // 6
3. Comparison between sector growth and VN-index in 2015
Insurance Technology Banking Automobile
Construction Sugar Seaport Plastic
Pharmaceutical Aquaculture Power Fertilizer
Real Estate Tires Cement Textile
-100
10203040506070
T01T03 T05 T07 T09 T11 -10-505
101520253035
T01T03 T05 T07 T09 T11 0
5
10
15
20
25
T01 T03 T05 T07 T09 T11-50
0
50
100
150
200
250
T01
T03
T05
T07
T09
T11
-15
-10
-5
0
5
T01T03 T05 T07 T09 T11
-30
-20
-10
0
10
20
30
40
50
T01T03 T05 T07 T09 T11
-20
-10
0
10
20
30
40
T01T03 T05 T07 T09 T11
-20
-10
0
10
20
30
40
50
T01T03 T05 T07 T09 T11
-25
-20
-15
-10
-5
0T01T03 T05 T07 T09 T11
-30
-25
-20
-15
-10
-5
0T01T03 T05 T07 T09 T11
-25
-20
-15
-10
-5
0T01T03 T05 T07 T09 T11
-30
-25
-20
-15
-10
-5
0T01T03T05T07 T09T11
-16-14-12-10
-8-6-4-20
T01
T03
T05
T07
T09
T11
-25
-20
-15
-10
-5
0
5
10
T01T03 T05 T07 T09 T11
-25
-20
-15
-10
-5
0
5
10
T01
T03
T05
T07
T09
T11
-25
-20
-15
-10
-5
0
T01
T03
T05
T07
T09
T11
B S C R E S E A R C H Vietnam Sector Outlook 2016 Part 1
7 // www.bsc.com.vn
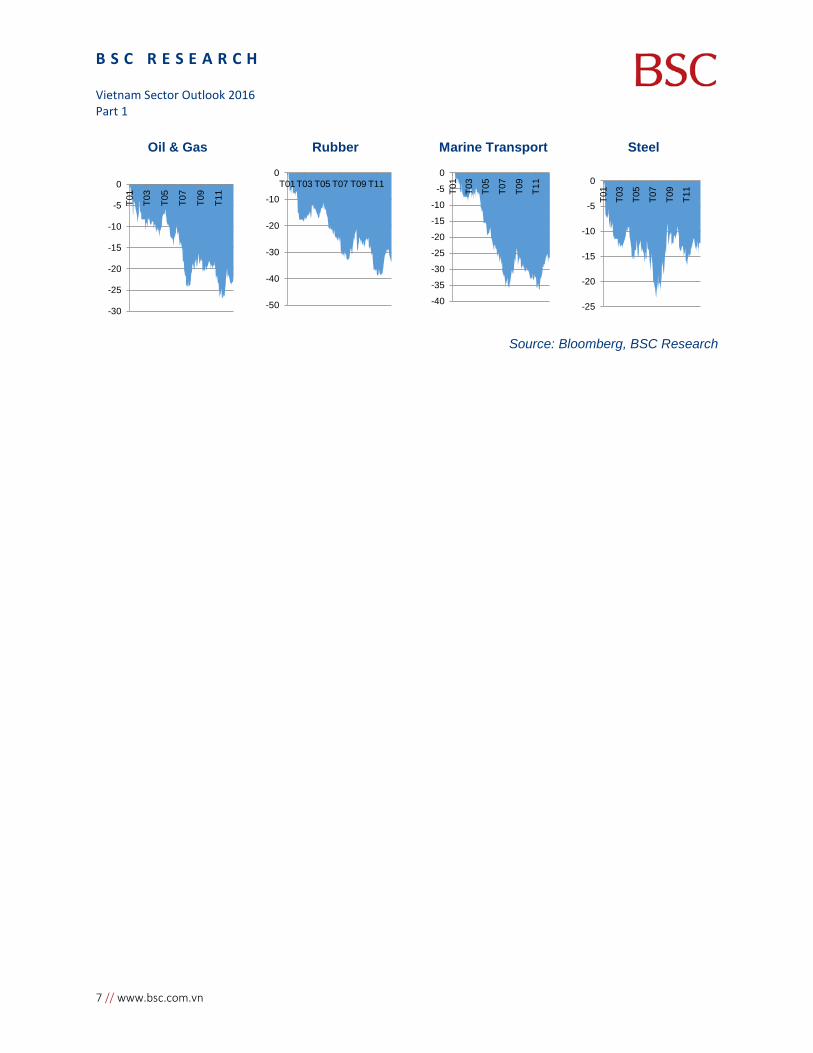
Oil & Gas Rubber Marine Transport Steel
Source: Bloomberg, BSC Research
-30
-25
-20
-15
-10
-5
0
T01
T03
T05
T07
T09
T11
-50
-40
-30
-20
-10
0T01T03 T05 T07 T09 T11
-40
-35
-30
-25
-20
-15
-10
-5
0
T01
T03
T05
T07
T09
T11
-25
-20
-15
-10
-5
0
T01
T03
T05
T07
T09
T11

B S C R E S E A R C H
Vietnam Sector Outlook 2016 Part 1
www.bsc.com.vn // 8
3. Top stocks in 2015
TOP 5 MOVERS POSITIVE ON VN - INDEX
CK Giá 31/12/2015 Thay đổi giá trong 12T (%)
Index pt
VNM 128.000 + 62.1 +31.1
VCB 43.900 +42.8 +20.1
BID 20.600 +69.3 +13.7
BVH 53.000 +70.3 +8.3
VIC 45.700 +22.8 +5.5
TOP 5 MOVERS POSITIVE ON HNX - INDEX
CK Giá 31/12/2015 Thay đổi giá trong 12T (%)
Index pt
ACB 19.800 +25.9 +2.2
VCS 74.000 +157.0 +1.3
PVI 25.500 +41.0 +0.9
PHP 21.100 +32.5 +0.9
DGC 52.000 +110.0 +0.6
TOP 5 MOVERS NEGATIVE ON VN - INDEX
CK Giá 31/12/2015 Thay đổi giá trong 12T (%)
Index pt
GAS 36.200 -48.2 -34.4
PVD 26.500 --51.2 -5.0
HAG 10.400 -47.8 -4.1
KDC 24.300 -49.8 -3.4
HPG 29.200 -13.3 -1.7
TOP 5 MOVERS NEGATIVE ON HNX - INDEX
CK Giá 31/12/2015 Thay đổi giá trong 12T (%)
Index pt
PVS 16.700 -35.3 -2.4
OCH 12.500 -48.6 -1.5
SHB 6.500 -18.4 -0.7
KLS 6.600 -34.3 -0.4
NVB 6.000 -10.5 -0.3
TOP 5 LEADERS ON VN-INDEX (Price > 10,000 dong. Average volume >70,000 share/session)
CK Giá đầu năm Giá cuối năm %Chg
SVC 16.000 41.400 158
TTF 10.300 29.000 181
VSC 41.600 77.000 85
BMP 73.000 131.000 79
SBT 12.900 24.100 86
TOP 5 LEADERS ON HNX (Price > 10,000 dong. Average volume >20,000 share/session)
CK Giá đầu năm Giá cuối năm %Chg
VCS 27.100 74.000 173
CTX 10.100 24.500 142
PTI 15.600 23.900 53
TPP 13.500 19.600 45
CHP 14.400 20.100 39
TOP 5 LAGGERS ON VN-INDEX (Price > 10,000 dong. Average volume >70,000 share/session)
CK Giá đầu năm Giá cuối năm %Chg
JVC 16.700 5.300 -68
HAI 11.700 5.200 -56
PVD 56.000 26.500 -53
HAG 22.100 10.400 -53
PPI 10.600 5.300 -50
TOP 5 LAGGERS ON HNX (Price > 10,000 dong)
CK Giá đầu năm Giá cuối năm %Chg
ITQ 28.000 5.700 -80
NDF 13.800 2.700 -80
VMI 30.600 6.400 -79
SDP 10.900 4.600 -58
KLF 10.100 4.400 -57
TOP 5 VOLUME LEADERS ON VN-INDEX
CK KLGD BQ / phiên CK GTGD BQ / phiên
FLC 11.596.354 FLC 92.603.817.814
OGC 6.631.183 CII 84.455.271.255
HHS 4.383.816 SSI 70.022.121.457
SBT 3.820.263 HHS 43.587.093.117
HQC 3.686.493 VIC 42.305.380.563
TOP 5 VOLUME LEADERS ON HNX
CK KLGD BQ / phiên CK GTGD BQ / phiên
SHB 4.332.562 KLF 37.825.011.741
SCR 3.748.853 PVS 34.860.947.656
KLF 3.529.267 SCR 23.522.970.968
TIG 3.167.114 SHB 22.059.446.769
PVX 1.961.516 PVC 19.593.705.474
Source: BSC Research

B S C R E S E A R C H Vietnam Sector Outlook 2016 Part 1
9 // www.bsc.com.vn
4. Performance of recommended stocks
Sector Ticker Closing price 05/01/2015
Closing price 31/12/2015 % change Average trading
volume 2015
Bank
VCB* 31,200 43,900 40.71% 865,492 BID* 11,600 20,600 77.59% 108,366 CTG 13,200 18,600 40.91% 2,150,014 MBB* 12,200 14,600 19.67% 2,587,447 ACB 14,700 19,800 34.69% 386,714
Real Estate
VIC* 37,800 45,700 20.90% 1,024,665 DXG* 11,810 18,900 60.04% 1,489,485 KBC* 15,600 13,100 -16.03% 1,832,880 KDH 17,200 21,600 25.58% 184,011 UNI 8,400 10,100 20.24% 38,295
Construction
LCG* 8,500 7,000 -17.65% 340,366 HBC 10,800 19,000 75.93% 629,502 CMS 9,900 10,300 4.04% 57,022 HUT* 12,321 11,300 -8.29% 1,085,985
Cement BCC* 14,600 13,400 -8.22% 232,171 HT1* 17,400 26,800 54.02% 237,622 BTS* 7,600 9,000 18.42% N/A
Technology - Telecom
FPT 39,900 48,300 21.05% 758,815 CMG 8,700 14,900 71.26% 90,604 ITD 8,100 17,500 116.05% 74,085 HIG 4,300 5,900 37.21% N/A
Seaport VSC 40,200 77,000 91.54% 91,736 HAH 43,800 43,200 -1.37% N/A GMD 27,200 42,400 55.88% 256,989
Insurance PTI 15,800 23,900 51.27% 60,511 BIC 12,500 18,500 48.00% 161,430 PGI 9,000 16,700 85.56% 56,485
Textile TCM* 31,400 30,800 -1.91% 539,316 TNG* 15,100 19,000 25.83% 322,124 STK* 28,100 31,900 13.52% N/A
Power
NT2* 17,900 26,600 48.60% 1,152,166 CHP 13,400 20,700 54.48% 63,550 SJD 29,000 25,900 -10.69% 17,414 SHP* 19,200 19,000 -1.04% 42,479
Tire DRC* 48,500 43,600 -10.10% 54,582 CSM* 33,700 24,700 -26.71% 196,481
Plastic BMP* 69,900 131,000 87.41% 66,723 NTP* 46,800 60,200 28.63% 33,225
Pharmaceutical TRA 70,200 88,500 26.07% 3,752 IMP 40,200 37,500 -6.72% 16,395
Steel NKG* 13,200 12,600 -4.55% 80,796 HSG* 34,800 31,500 -9.48% 347,259 HPG* 34,500 29,200 -15.36% 1,245,299
Aquaculture FMC* 18,000 25,800 43.33% 105,804 VHC* 36,500 29,200 -20.00% 106,130
Oil & Gas
PXS 17,200 11,600 -32.56% 536,728 PVS* 24,800 16,700 -32.66% 1,438,076 CNG 26,800 31,400 17.16% 21,269 PGS 18,000 17,500 -2.78% 249,580

B S C R E S E A R C H
Vietnam Sector Outlook 2016 Part 1
www.bsc.com.vn // 10
PGD 19,300 36,200 87.56% 860,019
Fertilizer DPM* 27,300 29,100 6.59% 638,415 LAS 29,600 31,000 4.73% 181,044 DCM 13,600 12,900 -5.15% N/A
Sugar LSS 9,000 9,000 0.00% 216,137 SBT 12,400 24,100 94.35% 1,457,043 NHS 11,700 15,800 35.04% N/A
Average 25.23% Source: BSC Research
Notice: (1) “*” stands for tickers mentioned in Sector outlook report 2015, these other stockes were added
quarterly (2) HAH, STK, DCM calculated on listed days. NHS calculated on delisted day.
In 2015, our recommendation and notice stocks witnessed average growth of 25.23%. If only calculated
stocks recommended in Report in early 2015, average growth was 11.9%, still higher than VN-Index returen
of 6.1%.
In our recommendation list, ITD witnessed the most significant growth at 116.05%. Besides, there were
total 14 stocks with growth over 50%, mainly among stocks in IT, Bank, Seaport and Insurance sectors.
These were sectors and stocks BSC recommended during the year. Furthermore, in 56 stocks noticed by
BSC, there were 19 with minus return in 2015. PVS and PXS had the largest losses due to oil’s downtrend
price.
5. Sectors business performance in 9M2015
Sector Total
revenue (VND bil)
%yoy Total
PAT (bil dong)
% yoy Notice
Bank 19,193 7.58%
Profit before provision increased by 73%, provision accounted for 41% of before-provision profit; VCB, MBB had high provision ratio, PAT BID increased by 23.5%
Real Estate 15,900 24.00% 3,600 230.00% Group with outstanding PAT growth: DXG (74% yoy), KDH (142% yoy), CEO (114% yoy)
Construction 65,600 22.00% 2,900 260.00% Improved performance in civil construction (CTD, HBC), industrial construction (LCG, VCG), infrastructure construction (CII)
Cement 12,993 2.75% 884 283.86% HT1 grew the fastest with PAT in 9M2015 reaching VND 534.6 bil (+487.47%yoy)
Tiles 3,082 -0.41% 83 32.68% GPM improved thanks to gas and coal price. 4/7 companies profited.
Technology - Telecom 30,757 16.35% 1,780 8.99% 14.17 firms profited. ITD, CMG gross profit margin
improved. FPT grew faster than 2014.
Seaport 7,182 31% 1,655 9% Except mutant of GMD 2014 earnings, most seaport firms witnessed growth in revenue and PAT.
B S C R E S E A R C H Vietnam Sector Outlook 2016 Part 1
11 // www.bsc.com.vn
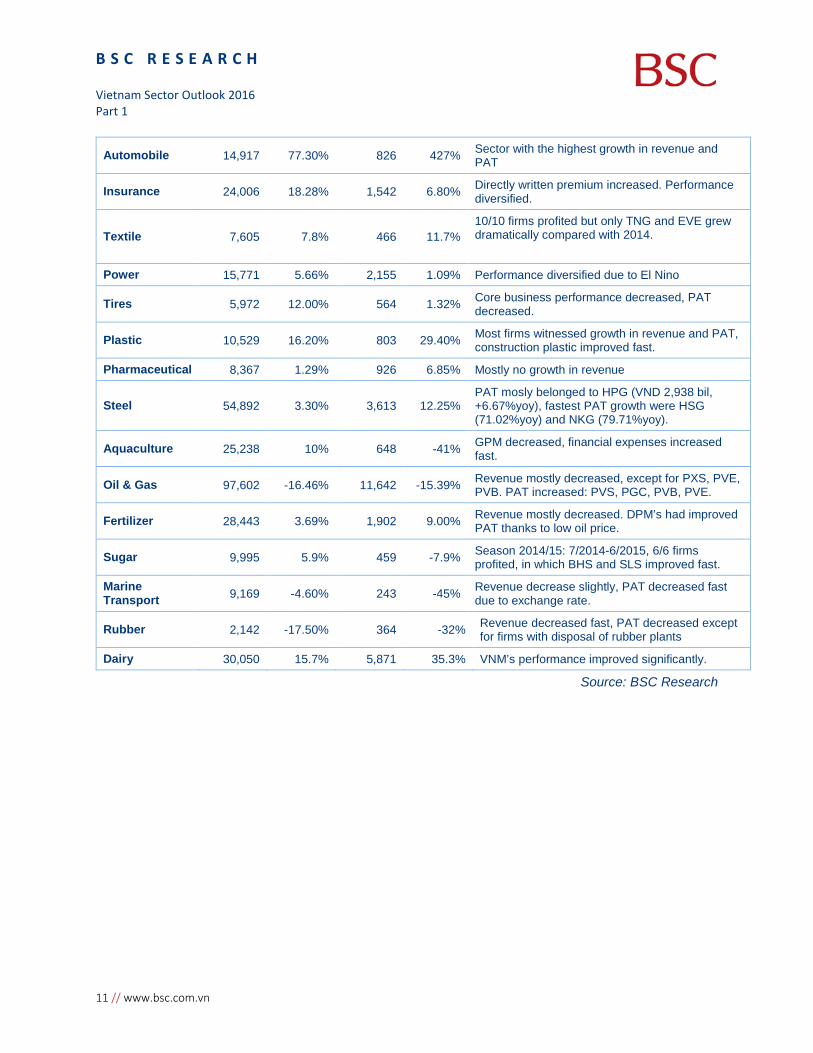
Automobile 14,917 77.30% 826 427% Sector with the highest growth in revenue and PAT
Insurance 24,006 18.28% 1,542 6.80% Directly written premium increased. Performance diversified.
Textile 7,605 7.8% 466 11.7% 10/10 firms profited but only TNG and EVE grew dramatically compared with 2014.
Power 15,771 5.66% 2,155 1.09% Performance diversified due to El Nino
Tires 5,972 12.00% 564 1.32% Core business performance decreased, PAT decreased.
Plastic 10,529 16.20% 803 29.40% Most firms witnessed growth in revenue and PAT, construction plastic improved fast.
Pharmaceutical 8,367 1.29% 926 6.85% Mostly no growth in revenue
Steel 54,892 3.30% 3,613 12.25% PAT mosly belonged to HPG (VND 2,938 bil, +6.67%yoy), fastest PAT growth were HSG (71.02%yoy) and NKG (79.71%yoy).
Aquaculture 25,238 10% 648 -41% GPM decreased, financial expenses increased fast.
Oil & Gas 97,602 -16.46% 11,642 -15.39% Revenue mostly decreased, except for PXS, PVE, PVB. PAT increased: PVS, PGC, PVB, PVE.
Fertilizer 28,443 3.69% 1,902 9.00% Revenue mostly decreased. DPM’s had improved PAT thanks to low oil price.
Sugar 9,995 5.9% 459 -7.9% Season 2014/15: 7/2014-6/2015, 6/6 firms profited, in which BHS and SLS improved fast.
Marine Transport 9,169 -4.60% 243 -45% Revenue decrease slightly, PAT decreased fast
due to exchange rate.
Rubber 2,142 -17.50% 364 -32% Revenue decreased fast, PAT decreased except for firms with disposal of rubber plants
Dairy 30,050 15.7% 5,871 35.3% VNM’s performance improved significantly.
Source: BSC Research

B S C R E S E A R C H
Vietnam Sector Outlook 2016 Part 1
www.bsc.com.vn // 12
Banking Sector [Banking system restructuring] • Credit grew by 17.17% till December, 21st, 2015, while, deposit growth was 6.38% till October,
31st, 2015.
• Good results of the scheme of restructuring the credit institution system: NPL ratio declined to
2.72% by November, 30th, 2015, accumulated NPL sold to VAMC from 2013 till December, 14th,
2015 was VND102,350 billion; liquidity improved.
• Positive performance, high provision for NPLs.
The highest credit growth since 2011. From the beginning of 2015 till December, 21st, 2015, credit grew
17.17%, disbursed VND 4,652 trillion. While credit grew slowly in the first months, then accelerated in the
last month of the year 2013 and 2014; in 2015, the credit grew confidently month by month. This signal
shows that the demand for credit is more reliable than before. The State bank of Vietnam (SBV) estimate
that credit growth 2015 may be at above 18%.
Credit growth
Deposit growth
Source: SBV, BSC estimates
Loans of listed banks
Customer deposits of listed banks
Source: Financial statement of listed banks
-5%
0%
5%
10%
15%
20%
Jan Feb Mar Apr May Jun Jul Aug Sep Oct Nov Dec
2013 2014 2015 2015E -5%
0%
5%
10%
15%
20%
Jan Feb Mar Apr May Jun Jul Aug Sep Oct Nov Dec
2013 2014 2015 2015E
-5%0%5%10%15%20%25%
- 100 200 300 400 500 600
VND
. tril
.
Q3/2015 % growth
0%20%40%60%80%100%120%
- 100 200 300 400 500 600
BID CTG MBB SHB NVB
VND
. tril
.
2014 3Q2015 Loans/ customer deposits
B S C R E S E A R C H Vietnam Sector Outlook 2016 Part 1
13 // www.bsc.com.vn
Liquidity improved but to be noticed. This come from: (1) high credit growth while lower customer deposit
growth of 5.96% by 30th September, 2015. (2) Expectation of USD appreciation raise demand for USD.
• The ratio of credit out of deposit increases to 88.54% on 30th September, 2015, higher
than it was on 31st December, 2014 at 83.67% and above the SBV’s orientation (80% for
Commercial joint stock banks and 90% for State-owned Commercial banks)
• The ratio of short deposit lending for medium and long-term rose to 28.48% on 30th
September, 2015, higher than it was on 31st December, 2014 at 20.15%. However, this ratio is
still lower than the rate stipulated in Circular No. 36 at 60%.
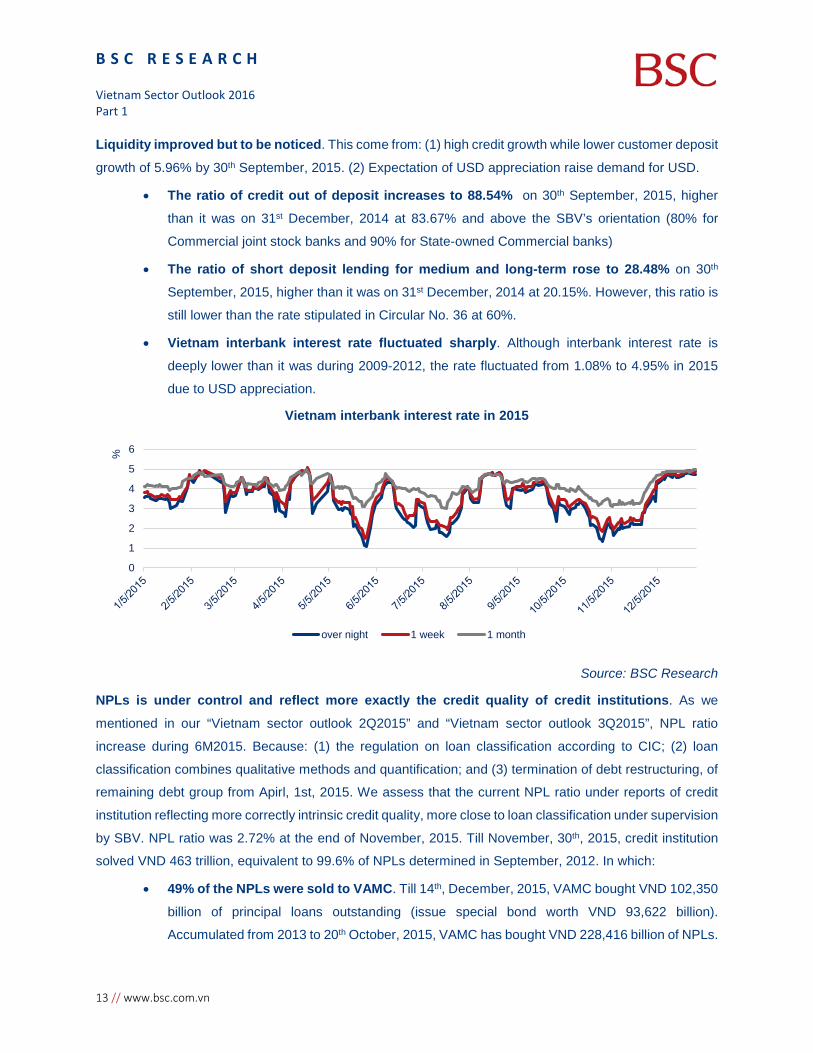
• Vietnam interbank interest rate fluctuated sharply. Although interbank interest rate is
deeply lower than it was during 2009-2012, the rate fluctuated from 1.08% to 4.95% in 2015
due to USD appreciation.
Vietnam interbank interest rate in 2015
Source: BSC Research
NPLs is under control and reflect more exactly the credit quality of credit institutions. As we
mentioned in our “Vietnam sector outlook 2Q2015” and “Vietnam sector outlook 3Q2015”, NPL ratio
increase during 6M2015. Because: (1) the regulation on loan classification according to CIC; (2) loan
classification combines qualitative methods and quantification; and (3) termination of debt restructuring, of
remaining debt group from Apirl, 1st, 2015. We assess that the current NPL ratio under reports of credit
institution reflecting more correctly intrinsic credit quality, more close to loan classification under supervision
by SBV. NPL ratio was 2.72% at the end of November, 2015. Till November, 30th, 2015, credit institution
solved VND 463 trillion, equivalent to 99.6% of NPLs determined in September, 2012. In which:
• 49% of the NPLs were sold to VAMC. Till 14th, December, 2015, VAMC bought VND 102,350
billion of principal loans outstanding (issue special bond worth VND 93,622 billion).
Accumulated from 2013 to 20th October, 2015, VAMC has bought VND 228,416 billion of NPLs.
0
1
2
3
4
5
6%
over night 1 week 1 month

B S C R E S E A R C H
Vietnam Sector Outlook 2016 Part 1
www.bsc.com.vn // 14
However, VAMC only withdraw VND 18 trillion, representing 7.91% of NPLs bought. Selling
NPLs to VAMC improve asset quality in balance sheet of credit institution, push NPL ratio to
the target of below 3%. However, the activity increase provision expense of these institutions.
Some banks have high NPLs sold to VAMC including BIDV (about VND 28 billion), CTG (VND
9 billion), STB (VND 7 billion), EIB (approximately VND 7 billion), SHB (VND 6 billion) and NVB
(over VND 3 billion out of total loans outstanding of VND 17 trillion).
• 51% of the NPLs were solved through writing- off NPLs, foreclosure. Solving NPLs were
boosted by banks in 2015. VCB solved VND 8,400 billion, following by BID (VND 4,200 billion),
MBB (VND 3,000 billion), VPBank (over VND 2,000 billion) and SHB (VND 1,100 billion).
NPL ratio of credit institutions
NPL ratio Supervision by SBV
Under credit
institution reports
12/2014 4.83% 3.25% 01/2015 4.55% 3.49% 02/2015 4.75% 3.59% 03/2015 3.81% 3.81% 06/2015 N/A 3. 2% 08/2015 N/A 3.21% 09/2015 N/A 2.93% 10/2015 N/A 2.91% 11/2015 2.72% 2.72%
NPL ratio of listed commercial banks by 3Q2015
Sources: SBV, Financial reports of Commercial banks,
BSC collects and estimates
Net interest margin (NIM) decrease gradually from 2012-3Q2015 because the interest spread between
lending and mobility falls, Banks disburse more prudently. Till the end of the third quarter, 2015, some listed
banks have NIM (trailing 12 months) increase including VCB, MBB, ACB, SHB, EIB.
0%
5%
10%
15%
20%
25%
VCB CTG BID MBB ACB STB SHB EIB NVB
NPL ratio NPL ratio (including NPLs sold to VAMC)

B S C R E S E A R C H Vietnam Sector Outlook 2016 Part 1
15 // www.bsc.com.vn
Deposit and lending rate 2014-2015
Source: SBV
NIM (TTM) of listed banks from 2012-3Q2015
Source: Financial reports of listed banks
Banking system restructuring by acquisition 3 banks at the price of VND 0 by SBV and other M&As.
8 M&A has conducted during 4 years of 2011-2015. The number of banks decrease from 42 to 34 and may
continue to shorten. In 2015, SBV acquired 3 banks including VNCB, Oceanbank, GPbank at the price of
VND 0 per share and put DongA Bank under special control. Other M&A includes MHB was merged into
BIDV at the ratio of 1:1, Southern Bank was merged into STB at a ratio of 1: 0.7, MDBank was merged into
Maritime Bank and PGbank will be merged into Vietinbank at ratio 1: 0.9 (under proposal). In addition, many
banks such as VPbank, Techcombank, SHB, MBB, etc completed/ submitted the proposal of consumer
finance acquisition/ establishment.
Business performances in 9M2015 were divergence, high provision expenses. End of the third
quarter, 2015, total listed banks’ assets were VND 3,076 trillion (+10.58% ytd). Customer loans grew
strongly by 14.74% ytd (at VND 2,021 trillion). Some listed banks have high lending growth is BID (+
23.47%), SHB (+ 17.74%) and NVB (+ 16.68%). Hence, bank performance was positive in 9M2015.
Operating income before credit provision expenses of listed banks rose 73% to VND 41 trillion. However,
because of huge provision expenses for debts which presents 41% of operating income before credit
provision expenses (VND 17 trillion), net profit only increase by 7.58% to VND 19 trillion. BID is the highest
growth stock in net profit among listed banks (+27.81% yoy), following by VCB (+5,34% yoy), MBB (+4,62%
yoy) và CTG (+ 4,32% yoy), ACB (+1,8% yoy). Meanwhile, some banks such as NVB (-82,18% yoy), EIB
(-28,4% yoy), STB (-11,19% yoy) và SHB (-3,4% yoy) witness earnings decline.
Listed banks’ performance till 30th September, 2015
VCB CTG BID MBB ACB STB SHB EIB NVB
Size
Charter capital (VND. Bil.)
26,650
37,234
34,187
16,000
9,377
12,425
9,486
12,355
3,010
5%6%7%8%9%
10%11%12%
30/1
2/13
-3/1
/14
10-1
4/2/
2014
3-7/
3/20
1424
-28/
3/20
1421
-26/
4/20
142-
6/6/
2014
23-2
7/6/
2014
14-1
8/7/
2014
4-8/
8/20
1425
-29/
8/20
1415
-19/
9/20
146-
10/1
0/20
1427
-31/
10/2
014
1-5/
12/2
014
16-2
0/3/
2015
6-10
/4/2
015
11-1
5/5/
2015
8-12
/6/2
015
6-10
/7/2
015
17/2
1/8/
2015
26-3
0/10
/201
523
-27/
11/2
015
Deposit rate 1M-6M Short term lending rate
0%
1%
2%
3%
4%
5%
6%
STB MBB ACB CTG BID VCB EIB SHB NVB
2012 2013 2014 3Q2015

B S C R E S E A R C H
Vietnam Sector Outlook 2016 Part 1
www.bsc.com.vn // 16
Total assets (VND. Bil.)
615,575
710,692
786,161
207,978
192,997
213,077
183,309
126,983
39,394
Equity/ total assets 7.15% 7.83% 5.05% 10.65% 6.54% 9.15% 6.04% 11.46% 8.16%
Growth (ytd)
Asset growth 6.69% 7.50% 20.88% 3.74% 7.45% 12.26% 8.44% -21.18% 6.94%
Loan growth 10.23% 13.58% 23.47% 13.06% 12.63% 13.87% 17.74% -2.31% 16.68%
Customer deposit growth 15.52% 10.53% 23.30% 4.13% 9.46% 12.80% 17.04% -1.32% 25.11%
Lending/ Customer deposit 73.08% 106.56% 101.32% 65.15% 77.41% 79.26% 84.99% 85.11% 63.50%
Asset quality NPL ratio
2.00% 0.95% 2.17% 1.72% 1.51% 1.61% 2.38% 1.65% 4.94% NPL ratio (including NPL sold to VAMC)* 3.07% 2.68% 6.85% 2.58% 3.42% 6.28% 7.00% 8.73% 20.99% Provision for credit of losses of loans/ total loans 2.16% 0.94% 1.57% 1.56% 1.17% 1.13% 1.03% 0.84% 1.58% Provision for credit of losses of loans / NPLs 107.72% 98.37% 72.40% 90.35% 77.94% 70.41% 43.14% 51.27% 31.96% Interest and fee receivable/ interest income 96.47% 97.26% 98.34% 92.87% 108.62% 97.19% 79.08% 99.29% 48.39%
Performance Operating income before provision expenses in 9M2015
10,442
9,546
9,495
4,253
1,910
3,144
1,113
1,176
72
% yoy 11.24% 19.73% 13.57% 8.69% 17.79% -0.93% 10.29% -4.13% 0.71% Provision expenses in 9M2015 (VND. Bil)
4,566
3,820
3,960
1,700
819
1,004
385
498
11
Net profit 9M2015 (VND. Bil)
4,612
4,450
4,481
2,032
853
1,668
572
525
2
% yoy 5.34% 4.32% 27.81% 4.62% 1.80% -11.19% -3,40% -28.40% -82.18%
NIM (TTM) 2.75% 3.02% 3.06% 4.03% 3.25% 4.05% 2.06% 2.40% 0.83%
EPS (VND/share) (TTM) 1,562 1,315 1,420 1,514 1,070 1,379 817 (123) (1)
ROA (TTM) 0.86% 0.89% 0.86% 1.30% 0.52% 1.00% 0.47% -0.11% 0.00%
ROE (TTM) 11.34% 10.69% 16.53% 13.22% 7.71% 10.76% 7.38% -1.04% -0.01% Sources: Financial reports of listed banks, BSC collected, (*) BSC estimated.

B S C R E S E A R C H Vietnam Sector Outlook 2016 Part 1
17 // www.bsc.com.vn
Real Estate Sector 2015 [Strong growth] • Number of sold apartments sharply increased in HCMC (+133% yoy) and Hanoi (+114% yoy).
• Regulation on property ownership for foreigners has loosened since 01.07.2015.
• Credit for real estate increased sharply (+ 14% yoy), but the risk is still low as it only accounts for
about 8% of total loans outstanding system wide.
• 9 months business results were positive for companies like KDH, DXG, BCI.
Real estate market experienced strong growth in 2015: (1) In the first nine months of the year, around
14,439 apartments were sold (+ 114% yoy) in Ha Noi, while in HCMC 24 675 units sold (+ 133% yoy), the
growth mainly concentrated in the intermediate and premium segment; (2) Selling prices were stable in all
segments; (3) The value of inventories decreased to 53 245 billion (-58% compared with the first quarter of
2013).
Source: CBRE
Loosen the regulations on property purchase and ownership for foreign individuals from July 1st: (1) besides apartments, a foreigner can own townhouses, villas... (2) The number of owned does not
exceed 30% of the total number of apartments in one building; (3) Instead of being only used for residing
purpose, their apartments may be used for leasing, sale, inheritance or mortgage.
Circular 200 does not affect the listed companies: Accordingly, the real estate companies are not
allowed to record the revenues by the advances paid by the customer according to the schedule. The
majority of listed firms are not be affected by this circular since the revenued has recorded when they
handover units to buyers
Foreign capital contributed to increase the market’s supply: as of November, registered FDI in real
estate sector were VND2.32 billion (+ 100% yoy). Notably, capital flows tend to focus on HCMC with major
projects in Thu Thiem area as De Vuong City Complex (USD 1.2 billion), Thu Thiem Smart Complex. In
24% 32% 36%
32%33%
38%
44% 35% 26%
0%
20%
40%
60%
80%
100%
120%
High - end Mid - end Low - end
Real Estate Segment
2013 2014 9M 2015
B S C R E S E A R C H
Vietnam Sector Outlook 2016 Part 1
www.bsc.com.vn // 18
addition to direct investment, foreign firms has such as: Creed Group invested USD 200 million in An Gia,
Gamuda Land (Malaysia) spent 1.400 billion buying Sacomreal’s stake in Celadon City project.
Credit for real estate increases strongly but risks remain low: For 9 months, credit for real estate
increased by 14% compared to the end of 2014 (about 8% of total loans) and is forecasted to reach 18%
in 2015 due to the demand from buyes as well as sellers who need capital to implement their projects.
Despite the strong growth, the risk is still relatively low when compared with 2009 when the real estate
credit increased by 42% and accounted for 19% of total outstanding loans.
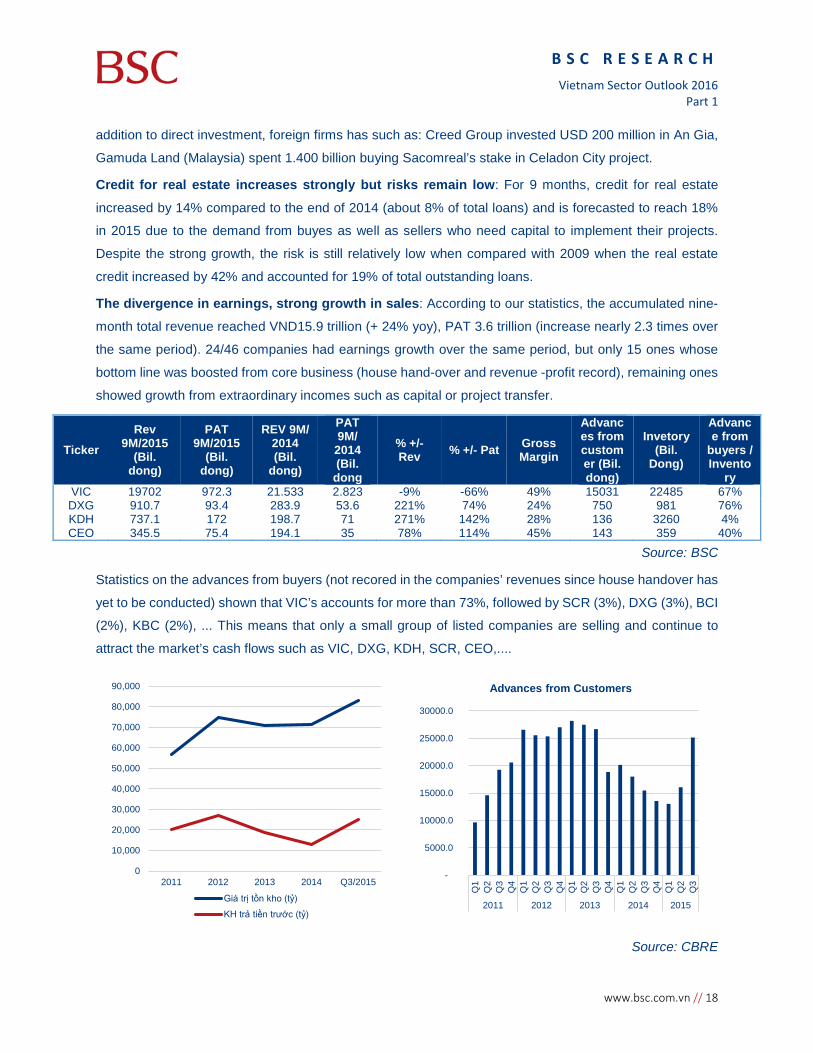
The divergence in earnings, strong growth in sales: According to our statistics, the accumulated nine-
month total revenue reached VND15.9 trillion (+ 24% yoy), PAT 3.6 trillion (increase nearly 2.3 times over
the same period). 24/46 companies had earnings growth over the same period, but only 15 ones whose
bottom line was boosted from core business (house hand-over and revenue -profit record), remaining ones
showed growth from extraordinary incomes such as capital or project transfer.
Ticker Rev
9M/2015 (Bil.
dong)
PAT 9M/2015
(Bil. dong)
REV 9M/ 2014 (Bil.
dong)
PAT 9M/
2014 (Bil.
dong
% +/- Rev % +/- Pat Gross
Margin
Advances from customer (Bil. dong)
Invetory (Bil.
Dong)
Advance from
buyers / Invento
ry VIC 19702 972.3 21.533 2.823 -9% -66% 49% 15031 22485 67% DXG 910.7 93.4 283.9 53.6 221% 74% 24% 750 981 76% KDH 737.1 172 198.7 71 271% 142% 28% 136 3260 4% CEO 345.5 75.4 194.1 35 78% 114% 45% 143 359 40%
Source: BSC
Statistics on the advances from buyers (not recored in the companies’ revenues since house handover has
yet to be conducted) shown that VIC’s accounts for more than 73%, followed by SCR (3%), DXG (3%), BCI
(2%), KBC (2%), ... This means that only a small group of listed companies are selling and continue to
attract the market’s cash flows such as VIC, DXG, KDH, SCR, CEO,....
Source: CBRE
0
10,000
20,000
30,000
40,000
50,000
60,000
70,000
80,000
90,000
2011 2012 2013 2014 Q3/2015
Giá trị tồn kho (tỷ)
KH trả tiền trước (tỷ)
-
5000.0
10000.0
15000.0
20000.0
25000.0
30000.0
Q1
Q2
Q3
Q4
Q1
Q2
Q3
Q4
Q1
Q2
Q3
Q4
Q1
Q2
Q3
Q4
Q1
Q2
Q3
2011 2012 2013 2014 2015
Advances from Customers

B S C R E S E A R C H Vietnam Sector Outlook 2016 Part 1
19 // www.bsc.com.vn
Construction Sector 2015 [Growth together with Real Estate] • The construction sector continued to recover thanks to the real estate industry. The construction
value increased by 9.3% yoy.
• Decree 15/2015 /ND, on investment in the form of public - private partnership (PPP) was enacted.
• 9 month business results are positive for listed companies
Slight growth was seen in construction value: In the first 9 months, construction value estimated at
VND660.9 trillion (at normal price) and reached VND524.4 trillion, increased 9.3% over the same period
2014. The main contribution to the growth is from residential buildings (+ 11.3% yoy) and civil engineering
works (+ 21% yoy).
Source: BSC
Policies paved the way for infrastructure investment with Decree 15/2015 / ND, on investment in the
form of public - private partnership (PPP). It extends many investment areas for PPP (education, culture,
sports…), remove the regulation on the maximum contribution level of the state capital, defined more clearly
the risk-sharing and incentives for private investors.
Many large contruction projects were put to use such as the Hanoi - Hai Phong highway (total
investment of more than VND 45.500 billion), HCN-Long Thanh - Dau Giay highway (VND21.000 billion),
Noi Bai T2 terminal (USD1 billion), ...
Business results were positive: Based on the statistics of 117 listed construction companies, 9 month
sales reached VND65.6 trillion (+ 22% yoy), PAT reached VND2.9 trillion (nearly 2.6 times compared to
2014). Earnings improved due to the fact that the companies receive more contracts and reduce interest
expense. The growth takes place on a large scale with residential buildings (CTD, HBC), Non-residential
Buildings (LCG, VCG), infrastructure buildings (CII).
40%
16%
33%
11%
Market Segments
Residential Buildings Non - Residentail Buildings
Civil engineering works Dedicated Buildings -10.00%
-5.00%
0.00%
5.00%
10.00%
15.00%
20.00%
25.00%
ResidentialBuildings
Non-residentialBuildings
Civilengineering
works
DedicatedBuildings
The growth in comparision to the same period of 2014 (in comparative prices of
2010)

B S C R E S E A R C H
Vietnam Sector Outlook 2016 Part 1
www.bsc.com.vn // 20
Source: BSC
0
1000
2000
3000
4000
5000
6000
7000
8000
9000
PVX VCG CTD HBC CII SDT LCG VNE
Revenue
DT 9T 2015 DT 9T 2014 -400
-200
0
200
400
600
800
1000
PVX VCG CTD HBC CII SDT LCG VNE
Net Income
LN 9T 2015 LN 9 T 2014

B S C R E S E A R C H Vietnam Sector Outlook 2016 Part 1
21 // www.bsc.com.vn
Cement Sector 2015 [Strong growth in the Southern market] • Domestic sales volume increased by 11.38% yoy – the highest level in the last 5 years
• Consumption growth was mainly in the Southern with 17.57% yoy
• The exchange rate movements affected on business results of enterprises
Consumption growth – The support from the domestic market. Total cement consumption in 2015 was
estimated at 72 million tons, up 3.11% compared with 2014, in which contributed mainly from the domestic
market with 55.5 million tons, up 11.38% yoy, the highest increasing in the past five years due to the
recovery of the real estate and construction sector. With cement/clinker exports, contrary to the trend of
growth as in previous years (average growth at 50.23% in the last 3 years), volume of cement/clinker
exports in 2015 decreased 17.5% in 2015 compared to 2014, and only 16.5 million tons.
We believe that the decline in exports due to the competition from China (which accounted for 60% of global
cement production), boosted exports as domestic demand weakened. Currently the Chinese cement
enterprises cut capacity down to 65%, in the first 3 quarters of 2015, the number of losses cement
enterprises in China amounted to 1,339 (40% of total cement business, according to Vice President of
China Cement Association).
Source: Vietnam Steel Association, BSC Research
Domestic cement consumption – Regional growth distribution. Although the Northern accounted for
40.85% of total consumption in the country in 10 months of 2015, but growth over the same period in 2014
was only 3.9%, much lower than the average of 17.57% yoy of the Southern market. The reason was
explained by the recovery of residential real estate market with many new projects being implemented,
besides, boosting investment in building factories by FDI enterprises in key economic zone as Ho Chi Minh
0
10
20
30
40
50
60
2011 2012 2013 2014 2015
Cement Consumption (mil ton)
Domestic Consumption Export
- 2 4 6 8
10 12 14 16 18 20
The North The Central The South
Cement Consumption in Region (mil ton)
10M2014 10M2015

B S C R E S E A R C H
Vietnam Sector Outlook 2016 Part 1
www.bsc.com.vn // 22
City, Dong Nai, and Binh Duong to catch FTAscreated growth effort for the Southern building materials
sector higher than in other regions of the country.
Unit: ton 10M2014 10M2015 Growth Market share The North 17,486,601 18,168,627 3.90% 40.85% The Central 10,527,550 10,620,952 0.89% 23.88% The South 13,339,445 15,682,721 17.57% 35.26%
Source: Vietnam Cement Association, BSC Research
Financial income form exchange rates movement – Still be recorded in 2015. Estimated with selling
rate of VCB, VND/EUR difference between 31/12/2014 and 18/12/2015 was 1,894 dong. With the expected
outstanding balanced at 31/12/2015 of cement enterprises were HT1 – EUR64 million, BCC – EUR28.6
million and BTS – EUR34 million, the unrealized interest rate differences gain for 2015 would be VND 113
billion, VND 51 billion and VND 60 billion.
Business results assessment
In 9 months of 2015, 8/8 cement enterprises listed on the HSX and HNX were profitable, without any losses
business as in previous years. Total net sales of listed enterprises reached VND 12,993 billion (+ 2.75%
yoy) and profit after tax reached VND 884 billion (+ 283.86% yoy).
Ticker
Total Asset
9M2015 (bil
dong)
Equity (bil
dong)
Rev 9M2015
(bil dong)
% Rev Price
17/12/15 EPS T12M BVPS PE
trailing PB
ROA 9M
ROE 9M Gross
margin Interest expense
Selling expense
Ad ministrative
expense Net
margin
HT1 12,324 4,222 5,572 22% 6% 1% 3% 10% 28,200 2,366 13,280 11.92 2.12 4.34% 12.66%
BCC 5,341 1,617 2,911 19% 4% 6% 4% 6% 13,500 2,975 16,901 4.54 0.80 3.14% 10.38%
BTS 4,413 1,216 2,104 19% 5% 4% 5% 6% 8,600 1,945 11,148 4.42 0.77 2.77% 10.05%
HOM 2,052 906 1,302 19% 2% 7% 6% 4% 6,400 834 13,089 7.67 0.49 2.26% 5.12%
SCJ 533 281 234 9% 4% 1% 3% 2% 8,200 646 14,382 12.69 0.57 0.87% 1.65%
Source: Financial Report, BSC Research
Gross profit margin of businesses was opposite. With HT1, gross profit margin in 9 months of 2015
reached 22.06%, higher 18.08% than the same period in 2014, primarily caused by in 2015 the Southern
demand rose sharply, and stable operation chain and uninterrupted production of breakdown machinery as
of 2014. With HOM, gross profit margin in 9 months of 2015 reached 18.95%, higher 15.77% than the same
period in 2014, caused by the reduction of calories consumption, before was 889.4 kcal/kg clinker fell to
869 Kcal/kg clinker and increase the structure of cement bags instead of bulk cement.
Contrary to HT1 and HOM, gross profit margin of BCC and BTS decreased over the same period in 2014,
mainly due to maintenance and repair chain (BCC) and increased sales volume bulk cement (BTS).

B S C R E S E A R C H Vietnam Sector Outlook 2016 Part 1
23 // www.bsc.com.vn
Ceramic Sector 2015 [Recovery with Real Estate] • One of the most tiles production countries in the world
• Domestic market has been competed by Chinese
• Taiwan is the largest export partner
• Domestic market has been in recovery cycle due to the benefits from the real estate and
construction sectors
Vietnam is one of the most tiles production countries in the world. At present, with the production
capacity of 447 million m2/year and the average operating capacity over 80% of planned capacity, Vietnam
ranked eighth in the top ten tile production countries in the world accounting for 2.9% of global production
in 2014. Export of Vietnam tiles was also in the top 10 with CARG = 21.32% from 2010 to 2013.
Tile production businesses of Vietnam are the mostly small enterprises with capacity under 10 million
m2/year. Currently, Prime Group is the largest enterprise with capacity of 75 million m2/year (of which 85%
of the shares of SCG Thailand).
Output over years (mil m2)
Vietnam tiles output (mil m2)
2009 2010 2011 2012 2013 2014
Production 292 375 380 290 300 360 Consumption 240 330 360 254 251 310
Export 28 28 42 41 50 N/A
Capacity (mil m2/year)
Company Ticker Capacity
CMC Jsc CVT 15
Viglacera Tien Son Jsc VIT 6.5
Thanh Thanh Jsc TTC 5.5
Taicera Jsc TCR 15
Chang Yih Jsc CYC 4
Prime Group 75
Source: World Production and Consumption of Ceramic Tiles - third edition 2015, BSC Research
The domestic tile market has been competed by China. China is the biggest tile production country in
the world with the output of 6 billion m2 (accounting of 48.35% of total global output). Besides, the
geographical position nearing and cheap prices were creating the steady advantages for Chinese tiles
dominating Vietnam market. With granite tile line, Chinese products accounted for 40-45% of the market
share (the first type of smuggled goods are cheaper than domestic goods about 15%).
Taiwan is one of the biggest export partners. In Taiwan, the creamic tile is on the list of prohibited import
items from China, so good quality and reasonable price have created the market development opportunity
for tile busieness of Vietnam. TCR and VIT are among the listed tile companies exporting mailly to Taiwan
market (accounting for over 50% of the total export volume of the business). In 2014, ceramic products of
Vietnam exported to Taiwan was about USD68 million (+ 0.7% yoy) and accounted for 3% of the total export
turnover of Vietnam to Taiwan.
The domestic market has been in recovery cycle due to the growth of real estate and construction sector. After the warm up phase of real estate and construction sector (2014 - 2015), the ongoing projects

B S C R E S E A R C H
Vietnam Sector Outlook 2016 Part 1
www.bsc.com.vn // 24
has started entering the completion stage, thereby creating growth engines for finishing construction
materials group in general and tile sector in particular. Estimating completed floor area of housing
construction in 2015 is about 101 million m2, up 10% yoy.
Source: Vietnam Customs, GSO, BSC Research
Business results assessment in 9M2015
Ticker Total Asset
9M2015 Rev
9M2015
% Rev 9M2015 EPS T12M BVPS PE
T12M PB ROE 9M
ROA 9M Gross
margin Interest Expense
Selling expense
Administrative Expense
Net margin
Price 18/12/15
CVT 814 512 17% 3% 1% 3% 9% 25,400 3,164 14,150 8.03 1.80 16.34% 5.45%
VIT 607 493 16% 5% 1% 2% 5% 19,200 2,864 12,182 6.70 1.58 14.36% 4.32%
TTC 173 290 14% 0% 4% 4% 6% 14,000 3,062 15,637 4.57 0.90 17.57% 9.45%
TCR 1,559 1,561 18% 2% 9% 5% 1% 5,900 283 13,832 20.85 0.43 1.74% 0.69%
CYC 345 226 6% 4% 3% 4% -6% 3,600 N/A 9,794 N/A 0.37 -16.4% -4.2%
Source: Financial reports, BSC
Total net revenue of the listed companies reached VND 3,082 billion (-0.41% yoy) and profit after tax
reached VND 83 billion (+ 32.68% yoy). At total of 7 the listed tile companies in HSX and HNX, of 9 months
in 2015, there was 4 profitable businesses (accounting for 57.14%), 3 unprofitable enterprises (CYC, BHV
and DAC, accounting for 42.86%). 4 profitable businesses were CVT, VIT, TTC and TCR having the
improvement of businedd results compared to the same period in 2014, it shows tile industry also is
benefiting from the recovery of real estate and construction sector.
Source: BSC Research
-
20
40
60
80
2011 2012 2013 2014
Ceramic products exporting to Taiwan(mil USD)
-
20
40
60
80
100
120
2005 2007 2008 2009 2010 2011 2012 2013 2014 2015
mil
m2
Housing floor completed over the years
0%
5%
10%
15%
20%
CVT VIT TTC TCR
Gross margin comparison
Gross margin 9M2015 Gross margin 9M2014
0%
2%
4%
6%
8%
10%
CVT VIT TTC TCR
Net margin comparison
Net margin 9M2015 Net margin 9M2014
B S C R E S E A R C H Vietnam Sector Outlook 2016 Part 1
25 // www.bsc.com.vn
Technology Sector 2015 [Positive] • The level of Internet penetration in Vietnam is higher than the average in Asia and the World
• Continuing to be an attractive destination for Outsourcing sector
• The integrated system recovered after difficult period
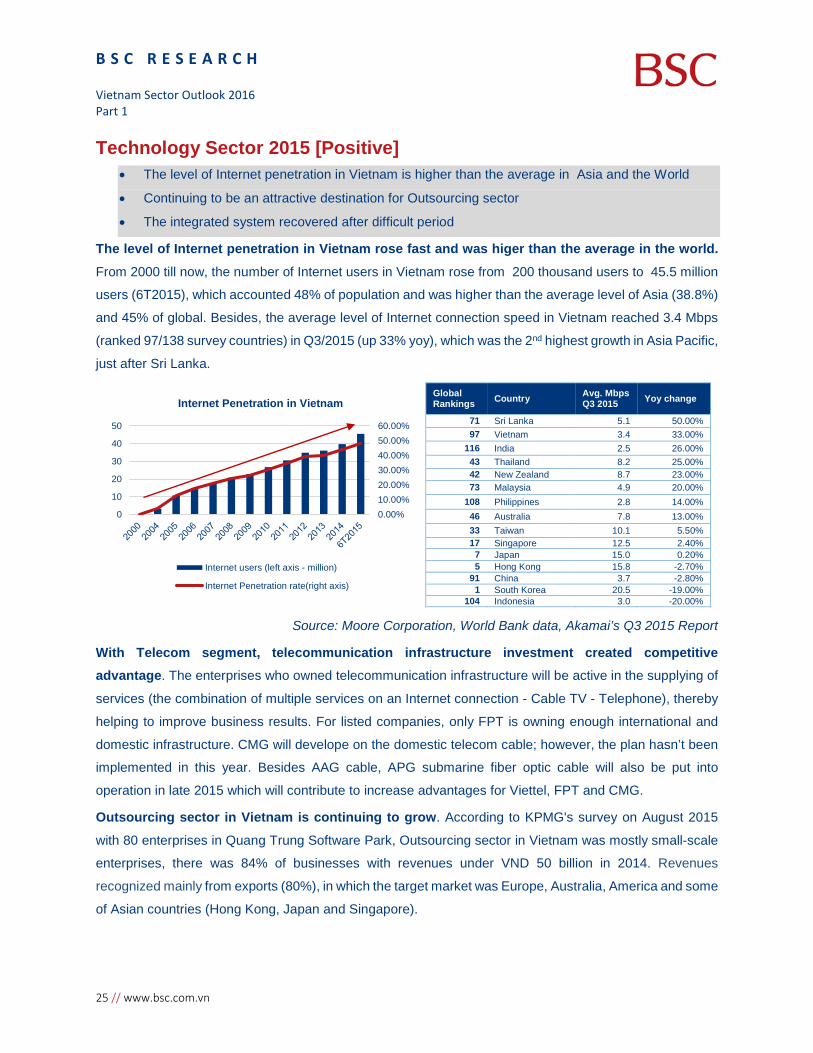
The level of Internet penetration in Vietnam rose fast and was higer than the average in the world. From 2000 till now, the number of Internet users in Vietnam rose from 200 thousand users to 45.5 million
users (6T2015), which accounted 48% of population and was higher than the average level of Asia (38.8%)
and 45% of global. Besides, the average level of Internet connection speed in Vietnam reached 3.4 Mbps
(ranked 97/138 survey countries) in Q3/2015 (up 33% yoy), which was the 2nd highest growth in Asia Pacific,
just after Sri Lanka.
Global Rankings Country Avg. Mbps
Q3 2015 Yoy change
71 Sri Lanka 5.1 50.00% 97 Vietnam 3.4 33.00%
116 India 2.5 26.00% 43 Thailand 8.2 25.00% 42 New Zealand 8.7 23.00% 73 Malaysia 4.9 20.00%
108 Philippines 2.8 14.00% 46 Australia 7.8 13.00% 33 Taiwan 10.1 5.50% 17 Singapore 12.5 2.40%
7 Japan 15.0 0.20% 5 Hong Kong 15.8 -2.70%
91 China 3.7 -2.80% 1 South Korea 20.5 -19.00%
104 Indonesia 3.0 -20.00%
Source: Moore Corporation, World Bank data, Akamai’s Q3 2015 Report
With Telecom segment, telecommunication infrastructure investment created competitive advantage. The enterprises who owned telecommunication infrastructure will be active in the supplying of
services (the combination of multiple services on an Internet connection - Cable TV - Telephone), thereby
helping to improve business results. For listed companies, only FPT is owning enough international and
domestic infrastructure. CMG will develope on the domestic telecom cable; however, the plan hasn’t been
implemented in this year. Besides AAG cable, APG submarine fiber optic cable will also be put into
operation in late 2015 which will contribute to increase advantages for Viettel, FPT and CMG.
Outsourcing sector in Vietnam is continuing to grow. According to KPMG's survey on August 2015
with 80 enterprises in Quang Trung Software Park, Outsourcing sector in Vietnam was mostly small-scale
enterprises, there was 84% of businesses with revenues under VND 50 billion in 2014. Revenues
recognized mainly from exports (80%), in which the target market was Europe, Australia, America and some
of Asian countries (Hong Kong, Japan and Singapore).
0.00%10.00%20.00%30.00%40.00%50.00%60.00%
0
10
20
30
40
50
Internet Penetration in Vietnam
Internet users (left axis - million)
Internet Penetration rate(right axis)

B S C R E S E A R C H
Vietnam Sector Outlook 2016 Part 1
www.bsc.com.vn // 26
Besides, with particular by youth population, macroeconomic is stable and income is still low, Vietnam
continues to be rated as one of the attractive destinations. According to Tholons’s report about ratings of
Outsourcing destinations in 2015, Hanoi ranked No.20 and Ho Chi Minh City ranked No.18. In addition,
Vietnam outsourcing market for the first time was ranked the world most attractive in terms of cost, risk and
operating conditions (reported by C & W).
IT Manager Monthly Salary - 2015
Source: Adecco salary guide 2015, BSC Research
Integration sector have grown after difficult period. Beside traditional integration sector for the customer
of tax authorities, financial institutions ... , intelligent transportation systems (ITS) is also being boosted by
the development projects of transport infrastructure. At present, the number of experienced ITS bidders are
not much in Vietnam. Two listed conpanies were ITD (accounting for 80% of the MTC fee collecting
intergration) and ELC (balanced load), which had the positive improvement of business results in 2015. In
addition, FPT started participating in this field with the pilot implementation of surveillance system, handling
violations of traffic on Noi Bai - Lao Cai route (Hanoi - Phu Tho) from November 2015.
Business Results Assessment
Ticker Total Asset 30/09
Rev 30/09
% Accumulated Rev 30/09 Price
18/12/15 EPS T12M BVPS PE
T12M PB ROE ROA Gross margin
Interest Expense
Selling Expense
Adminis Expense
Net margin
FPT 23,677 27,497 20% 1% 6% 6% 6% 48,900 4,344 25,090 11.26 1.95 16.62% 7.00% ELC 1,041 410 27% 1% 4% 13% 4% 25,800 1,820 16,406 14.18 1.57 2.21% 1.43% ONE 309 348 10% 1% 1% 5% 2% 9,000 1,785 13,290 5.04 0.68 11.81% 2.51% CMG 2,066 1,648 14% 1% 6% 4% 4% 14,500 1,661 15,340 8.73 0.95 5.81% 2.90% ITD 530 203 30% 1% 10% 9% 9% 17,000 1,695 16,736 10.03 1.02 7.11% 3.44%
Source: BSC Research
CMG and ITD have fiscal year started from 01/04/2015
Regarding business results of listed IT-telecommunication companies in 2015, there were a total of 14
profitable businesses (accounting for 82.35%) and 3 loss-making enterprises (accounting for 17.65%) as
LTC, SRA and VTC. Regarding 5 notable businesses (above table), net revenues in 2015 reached 56.11%
B S C R E S E A R C H Vietnam Sector Outlook 2016 Part 1
27 // www.bsc.com.vn
average growth rate over the same period in 2014 in which FPT, CMG and ITD had a higher gross margin
than the same period. Net profit margin of only ITD and CMG improved. CMG reached 3.64% (6 months in
2015) higher than 2.94% (6 months in 2014) due to the growth of Telecommunication segment. ITD reached
8.97% (6 months in 2015) higher than 1.18% (6 months in 2014) due to profit was recorded from the ITS
project of Hanoi - Hai Phong expressway.
B S C R E S E A R C H
Vietnam Sector Outlook 2016 Part 1
www.bsc.com.vn // 28
Seaport Sector 2015 [Fast growth] • In the first half of 2015, cargo volume and container throughout still witnessed rapid growth trend
at 10.43% and 26.3% respectively.
• Goods import and export, the recovered economy and government’s floor price application have
been positively impacting goods flow through port system.
• Many Northern ports operated over capacity while Southern ports remained in a state of excess
capacity.
• Listed seaport companies continue recording high business results.
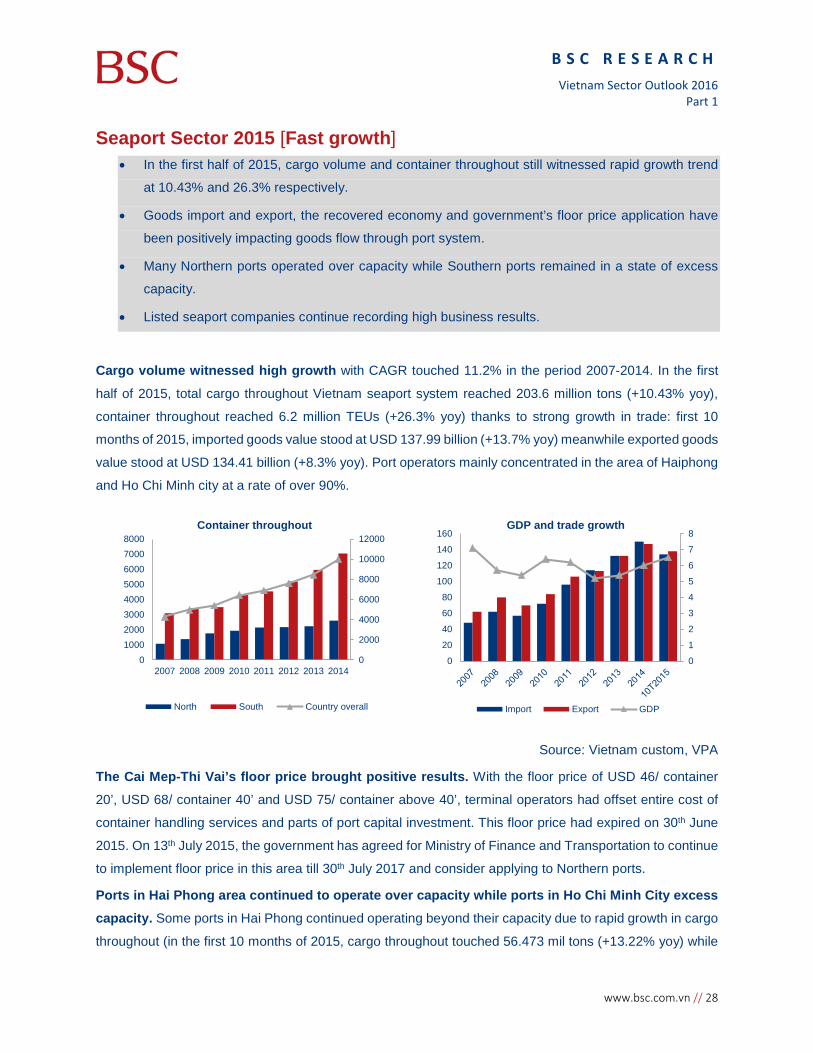
Cargo volume witnessed high growth with CAGR touched 11.2% in the period 2007-2014. In the first
half of 2015, total cargo throughout Vietnam seaport system reached 203.6 million tons (+10.43% yoy),
container throughout reached 6.2 million TEUs (+26.3% yoy) thanks to strong growth in trade: first 10
months of 2015, imported goods value stood at USD 137.99 billion (+13.7% yoy) meanwhile exported goods
value stood at USD 134.41 billion (+8.3% yoy). Port operators mainly concentrated in the area of Haiphong
and Ho Chi Minh city at a rate of over 90%.
Source: Vietnam custom, VPA
The Cai Mep-Thi Vai’s floor price brought positive results. With the floor price of USD 46/ container
20’, USD 68/ container 40’ and USD 75/ container above 40’, terminal operators had offset entire cost of
container handling services and parts of port capital investment. This floor price had expired on 30th June
2015. On 13th July 2015, the government has agreed for Ministry of Finance and Transportation to continue
to implement floor price in this area till 30th July 2017 and consider applying to Northern ports.
Ports in Hai Phong area continued to operate over capacity while ports in Ho Chi Minh City excess capacity. Some ports in Hai Phong continued operating beyond their capacity due to rapid growth in cargo
throughout (in the first 10 months of 2015, cargo throughout touched 56.473 mil tons (+13.22% yoy) while
0
2000
4000
6000
8000
10000
12000
010002000300040005000600070008000
2007 2008 2009 2010 2011 2012 2013 2014
Container throughout
North South Country overall
0
1
2
3
4
5
6
7
8
0
20
40
60
80
100
120
140
160GDP and trade growth
Import Export GDP

B S C R E S E A R C H Vietnam Sector Outlook 2016 Part 1
29 // www.bsc.com.vn
there are not enough room to open up production area). In contrast, ports in Ho Chi Minh City are remained
over supply as a result of inappropriate investment calculation in the past.
9 months 2015 business results aggregation. Aggregated listed companies’ revenue touched VND
7,182 bil (+31%yoy), after tax profit reached VND 1,655 bil (+9%yoy). These outstanding results had truly
reflected sector growth expectation ( except for GMD with significant decline in after tax profit due to no
longer recording disposal of assets as it did in 2014). Among listed companies, PHP witnessed the fastest
revenue growth at 75% yoy, followed by HAH, DXP and GMD.
9M2015 business results of seaport listed companies
Ticker Revenue Gross profit margin PAT P/E
P/B
9M2015 %yoy 9M2015 9M2014 9M2015 %yoy
GMD 2,660 25% 14% 19% 355 -36% 14.84 0.8
PHP 1,759 75% 29% 25% 432 30% 41.4 1.6
VSC 697 7.8% 40% 29% 224 39% 10.02 2.07
DVP 492 26.8% 51% 47% 228 33% 10.31 2.39
HAH 374 35% 34% 33% 113 38% 6.1 1.7
TMS 360 8% 30% 15% 124 36% 12.47 1.72
VGP 259 14% 20% 6% 37 270% 3.51 0.82
PDN 229 18% 19% 22% 41 5% 9.65 1.39
CLL 193 13.5% 34% 43% 55 -4% 9.44 1.75
DXP 159 31% 35% 29% 46 64% 7.47 1.43
Average 31% 28% 12.52 1.57
Source: BSC Research

B S C R E S E A R C H
Vietnam Sector Outlook 2016 Part 1
www.bsc.com.vn // 30
Automobile Sector 2015 [Phenomenal growth] • Automobile consumption surged by 56.6% yoy in 11M2015, in which imported vehicles grew
by 77% yoy
• Selling price at year end increased by 5-15% compared to year beginning
• Business results of all listed companies are positive
Automobile consumption had strong growth in 2015. According to Vietnam Automobile Manufacturing
Association (VAMA), automobile consumption reached 215,517 cars (+56.6% yoy), in which 126,597
passenger cars (+45% yoy) and 77,880 commercial cars (+72.7% yoy), and 11,040 special-purpose cars
(+108.5% yoy). The high growth across all types of vehicles are thanks to: (1) the economic expansion in
Vietnam (2) The improvement in GDP per capita (3) Supply shortages caused by the strict control of truck
gross weight, along with the increase in transportation needs boosted up demand for commercial vehicles.
Source: VAMA, BSC
Imported vehicles achieved a strong growth, especially from China. In 11M2015, sales of local
assembled vehicles reached 154,257 units (+49.6% yoy), while 61,260 imported cars were sold (77.4%
yoy). The number of vehicles imported from China in 10M2015 increased by 54% yoy to 21,265 units, and
China became the countries will largest proportion of 22% total imported cars. Korea ranked second with
21,155 units, up +26% compared to sales in 2014. The main reason for the surge in Chinese vehicles
imported to Vietnam is the ACFTA, effective in Jan 1st 2015, which applied a preferential tax rate for
vehicles imported from China. The new tax policy brought most types of commercial vehicles down to 5-
15%, significantly lower than the tax rate 30-70% applied for other countries.
Selling price of cars in December increased slightly. Surveying best-selling cars shows that the price
as of December has increased by 5-15%, depends on the type of cars. The selling price depends on various
YTM 2012 YTM 2013 YTM 2014 YTM 2015
Car sales - 11M
Passenger cars commercial cars special-purpose cars
China22%
Korea22%ASEAN
25%
India18%
Japan6%
EU3%
USA3%
Major import markets

B S C R E S E A R C H Vietnam Sector Outlook 2016 Part 1
31 // www.bsc.com.vn
factor, such as exchange rate, tax changes, or promotion programs. The fluctuation of exchange rate in
2015 has partly caused the price of imported cars, as well as price of automobile parts increased.
Business results of automobile companies are positive in 2015. Automobile sector currently has only
5 listed companies: 2 are passenger car distributors (SVC and HAX); 2 are commercial car businesses
(TMT and HHS) ; and 1 is for special purposes vehicles (HTL). Thanks to the overall growth, all companies
has positive business results in 2015. In 9M2015, total revenue of all 5 companies reached VND 14,917
billion (+77.3% yoy) and Profit after tax reached VND 826 billion (+427% yoy)
Ticker Rev 9M2015 % yoy PAT 9M
2015 % yoy P/E P/B Notes
SVC 6,811 26% 147.4 82% 11.0 1.3
Revenue from car distribution increased by 26%, the divestment from real estate projects contributed VND 15 bil in profit before tax, and helped decrease the interest expense
HAX 1,216 40% 23.6 144% 8.2 1.8 Bonus profit from achieving sales target contributed VND 8 Bil to the PBT
TMT 2,833 239% 225.0 411% 7.3 4.1 HTL 1,261 190% 130.7 360% 8.3 6.8
HHS 2,797 229% 441.1 557% 4.9 2.3 Benefited from the lower tax for vehicles imported from China, according to FTA Asean-China
Source: BSC Research

B S C R E S E A R C H
Vietnam Sector Outlook 2016 Part 1
www.bsc.com.vn // 32
Non-life Insurance Sector 2015 [Strong growth] • Strong growth in direct written premiums in 10M2015 (+17.7%), especially in retail segments:
Vehicle insurance premiums (+26% yoy); health insurance premium (+32% yoy)
• Claim ratio on direct written premium increased, but claim ratio on net premium slightly decreased
• Income from insurance activities diverged among listed companies; investment results were
affected by low interest rate environment.
The total non-life insurance premiums had a strong increase in the first 10 months of 2015. The total
direct written premium is estimated at VND 26,899 billion, up 17.8% yoy, which is higher than the average
growth of 12.4% in the period 2005 -2014. The proportion of insurance premium ceded abroad1 in the total
written premiums increased slightly from 20% in 2014 to 22.5% in 6M2015.
Source: Administration and Supervision of Insurance
Claim ratio on direct written premiums increased, but net claim ratio on net premiums slightly decreased. The claims paid in 10M2015 was at VND 11,156 billion, equivalent to the claim ratio of 41.5%,
higher than the number of the same period last year of 36.9%. However, the claim ratio on net premiums
(excluding ceded premiums) was well controlled at 38.6%, slightly down from 38.7% in 2014. The reason
for the this divergence is due to 30% of the total claims came from property & casualty segment, which has
high ceded proportion of approximately 70%. Claim ratio for property & casualty segment increased
dramatically to 72%, since insurers started to pay out claims of large losses in 2014. Besides, insurers also
began paying out claims for losses related to the Binh Duong, Ha Tinh incident. However, since most of
1 The premium ceded abroad from non-life insurers, excluding the premium ceded by reinsurers like Vinare and PVI Re
37%
42%
39%
44%
40%
45%
37% 39%
40%
45%
39%
39%
35%
37%
39%
41%
43%
45%
47%
2010 2011 2012 2013 2014 6T 2015
Claim ratios
Loss ratio on direct written premiums Loss ratio on net premiums

B S C R E S E A R C H Vietnam Sector Outlook 2016 Part 1
33 // www.bsc.com.vn
them has been ceded, loss ratio on net insurance premiums of property & casualty insurance was
maintained at a reasonable level of 33%.
Source: Administration and Supervision of Insurance
The growth of non-life insurance sector mainly came from the retail segments, thanks to favorable
factors in the environment, as well as the objectives of most large insurers on developing their retail system:
• Motor Vehicle insurance premiums in 9M2015 reached VND 7,005 billion (+ 26% yoy). The
strong growth in car consumption (56.6% yoy in 11T2015) boosted up the insurance premium for
vehicles. Claim ratio of this segment declined significantly from 45.2% in 2014 to 39.3% in 6T
2015.
• Health care insurance revenues grew by 32% yoy in 9M 2015, thanks to the focus on developing
sales channels of large insurers and improvement in income per capita. Loss ratio of 6M2015 was
39.4%, down slightly from 37.9% in 2014.
• Property and Casualty Insurance only expanded for 4% in direct premiums, with high loss ratio,
from 34% in 2014 to 72% in 6M2015. A large portion of the claims paid do not affect net income
of insurers, since they are covered by provision in 2014.
• Fire Insurance grew strongly by 35% yoy in 9M2015, thanks to the Joint Circular 214 set out
compulsory fire insurance for buildings, constructions, combined with the recovery of real estate
market. However, claim ratio for this segment is high, up slightly from 57% in 2014 to 59.6% in
6M2015.
Business results of insurance businesses were mostly promising, mainly due to the improvement in the
insurance business
• The insurance activity results show divergence, depends on the ability to control claim ratio. 4 insurers with low claim ratio produced good insurance activity results in 9M2015: BVH;
PVI; PGI; PTI. In contrast, BIC and BMI had high claim ratio, and showed declines in profit from
insurance operation. Please note that in the year 2014/2015, some accounting changes made
7005
5491
4716
2148
5549
4167
4521
1591
Vehicle
Health
Property
Fire
Gross premiums of main products ( in VND Bil)
9M 2014 9M 2015 0% 20% 40% 60% 80% 100%
Vehicle
Health
Property
Fire
Total
Market share for each products
BMI BVH BIC PGI PTI PVI Others

B S C R E S E A R C H
Vietnam Sector Outlook 2016 Part 1
www.bsc.com.vn // 34
commission costs in 2014 plummeted to half. In 2015, the costs rising back to normal levels has
affected the growth in profit for the year.
• Investment activities faced hardship in 2015 due to the low level of interest rates. The
investment composition does not have much change, with deposits accounted for 70% of total
investment value. Therefore, excluding abnormal profits, the interest rates at low levels in 2015
has caused investment revenue decline. Specifically:
BVH PVI BMI PTI PGI BIC Insurance activities
Premium 9M 2015 (VND Bil) 11,618 5,888 2,064 1,766 1,580 1,090
% yoy 18% 17% 4% 64% 5% 29% % Claim ratio1 46.6% 36.6% 43.7% 45.4% 51.7% 43.2%
+/- compared to 9M 2014 Decrease 0.4%
Decrease 4.1%
Increase 1.1%
Decrease 1.0%
Decrease 1.7%
Increase 6.2%
Combined ratio (9M 2015)2 105% 99% 99.5% 100.6% 99.8% 99.2%
Investment activity Total investment (VND Bil) Q3/2015 45,798.9 11,621.9 2,747.7 1,851.1 2,676.4 2,725.7
% compared to Q42014 0.143 0.147 0.043 0.083 1.02 0.704 Investment profit 9M2015( VND Bil) 1,905.7 326.2 96.8 81.7 77.9 88.7
% yoy -0.02 -0.17 0.59 0.114 0.237 -0.009 Investment return 0.079 0.057 0.065 0.071 0.064 0.071 Increase/decrease compared to 2014
Decrease 1.3%
Decrease 1.2%
Increase 0.04%
Decrease 0.5%
Decrease 1.4% Decrease 2.1%
PBT 9M2015 (VND Bil) 1,203 360 129 129 89 94 % yoy 0% 44% 20% 20% 14% -13% P/E 27.1 15.7 15.8 16.4 12.3 17.3 P/B 2.6 0.9 1.0 1.1 1.4 1.7
Notes
Profit margin
on insurance activities
increased by 7%, but still yield a
loss
Profit from insurance activities
increased by 53.2%
Extraordinary income from
reversal of provision for impairment
of investment. Gross profit
from insurance activities
declined by 24.7%
Investment income
increased by 21% yoy
thanks to the large
capital from Dongbu
Recognize income
from sales of long
term investment
Income from insurance activities
declined by 70% sine claim ratio rises. The
capital from Fairfax is
received since Nov, therefore not contribute much to 2015
profit
1 Claim ratio = Total claim expenditure (including provisions) / net insurance premium
2 Combined ratio = (Total insurance expenditure +SG&A expense)/Total net revenue from insurance business
3 Investment return = Trailing 12M Investment revenue/Average investment capital as of Q3 2015

B S C R E S E A R C H Vietnam Sector Outlook 2016 Part 1
35 // www.bsc.com.vn
Textile Sector 2015 [Growth slowdown] • The growth of Vietnam’s textile exports reduced, reaching 8.44% yoy in 10M2015
• Vietnam’s textile imports growth also declined, reaching 6.92% yoy in 10M2015
• World cotton prices continued to fall 22% in the 2014/2015 crop year
• There are four trade agreements signed or completed negotiations including VN-AEAU FTA,
VKFTA, VN-EU FTA, TPP
• Listed textile enterprises had a differentiation in business results in 9M2015
The textile export value grew at lower rate: In 10M2015, total export value reached USD 22,208 million,
up 8.44% yoy. Estimates in 2015, textile exports reach about USD 27,200 million, up 10.2% yoy, much
lower than the average growth rate of 22%/year over the period 2010-2014. The partly cause of this
slowdown is competing export countries with textiles Vietnam such as China, India, Indonesia, ...
devaluated their currencies, causing prices of Vietnam’s textile products fall to compete with the other
countries.
The exports growth in key markets also reduced (chart below), but the US remains the largest export market
of Vietnam. In 2015, the estimated exports value to the US reached USD 11,100 million, representing 40.8%
of total exports. The 2nd largest market is the EU market with export value of USD 3,603 million, representing
13.2% of total value. Exports to Japan and South Korea reached USD 2,830 and USD 2,273 million
respectively, accounting for 10.4% and 8.4% of total export value.
Export turnover and export growth in the period 2010-2015
Export turnover and growth by market
(2014-2015)
Source: General Department of Vietnam Customs
11.20
15.83 17.02
21.09
24.6927.20
23%
41%
7%
24%17%
10%0%10%20%30%40%50%60%70%80%90%100%
0.00
5.00
10.00
15.00
20.00
25.00
30.00
2010 2011 2012 2013 2014 2015
bil USD
Export Growth
9.82
3.4
2.62 2.09
11.09
3.60 2.832.27
14%
25%10%
27%13%
6% 8%9%
0%10%20%30%40%50%60%70%80%90%100%
0
2
4
6
8
10
12
The US EU Japan Korea
bil USD
2014 2015 yoy 2014 yoy 2015

B S C R E S E A R C H
Vietnam Sector Outlook 2016 Part 1
www.bsc.com.vn // 36
Textile imports growth also dropped: Total imports value in 10M2015 is USD 13,791 million, up 6.92%
yoy, lower than the increase of 15.3% in 2014 as imported materials demand for production, especially for
export, decreased. In particular, imports to export accounted for about 80% of imports value, reached USD
10,971 million, rising only 7.55% yoy, lower than the increase of 17.6% yoy in the same period in 2014.
The import value of textile material such as fabrics, cotton… rose slightly, while fibers import value
decreased slightly compared to the same period. Specifically, fabrics import in 10T2015 reached USD 8,395
million (+ 7.92% yoy) and cotton import reached USD 1,453 million, +43.2% yoy in volume and +17.6% yoy
in value since the price of imported cotton fell 17.9% from the same period. Fibers imports in 10M2015
reached USD 1,263 million, up 6.5% in volume and 2.5% in value over the same period due to the average
import price of yarn fell 8.4% in 10M2015 yoy.
World cotton prices continued to decline during the 2014/2015 crop year: The average world cotton
price during the 2014/15 crop year (from August 2014-July 2015) was 66 cents/pound, down 22% compared
to the average cotton price in the 2013/14. The reason are (1) Cotton production continued to increase
slightly by 3.4% to reach 26.4 million tons, 9.5% higher than cotton demand, while global cotton inventories
was still very large (2) China, which is the largest cotton importing country, cut cotton import quotas to
encourage the use of domestic cotton (3) Crude oil prices continued to decline, making synthetic yarn
derived from oil become more competitive than cotton yarn.
In 2015, 4 FTAs were signed or completed negotiations, includes (1) VN-AEAU FTA signed on 29 May
2015 and will officially take effect on 1st Jan 2016 (2) VKFTA signed in May 2015 and has taken effect since
20 Dec 2015 (3) VN-EU FTA was concluded negotiations in 2015 and is expected to take effect in 2018
and (4) TPP was concluded negotiations in 2015, would sign on Feb 2016 and will formally take effect from
the first half of 2018. Successfully negotiating and signing those FTAs will help import and export
commodities of Vietnam, including Textiles, enjoy many tax incentives and promote export growth in the
coming time.
Listed textile enterprises had differentiation in business results 9M2015:
As of the end of Q3 2015, all 10 listed textile stocks were profitable. In 9M2015, 5 shares had revenue
growth including TNG (+ 38.3%), TCM (+ 11%), EVE (+ 23%), KMR (+ 4.4%) and GMC (+0.5 %); 3 shares
had revenue reduction including GIL (-3.4%), NPS (-24%) and TET (-11%) (STK and G20 are two new
listed stocks in 2015).
The level of changes in profit margin in those firms were different: gross margin of GIL and KMR surged
from 14.2% and 20.2% to 17.9% and 22.3% respectively, while gross margin of TCM, GMC and EVE slightly
increased of 0.4% - 0.5% over the previous year. TNG’s gross margin has decreased slightly by 0.7% while
NPS’s and TET’s plummeted from 19.5% and 57% in 9M2014 down to 12.4% and 30% respectively in
9M2015.

B S C R E S E A R C H Vietnam Sector Outlook 2016 Part 1
37 // www.bsc.com.vn
Ticker Total asset
9M2015
Net Rev
9M2015
% of Net Rev 9M2015
Price 31 Dec 15
EPS T12M BVPS PE PB ROE ROA Gross
profit Int exp
Selling exp
Admin exp
Net income
TCM 2,370 2,144.3 15.6% 0.9% 2.9% 4.2% 6.5% 30,800 3,470 17,798 8.9 1.7 15.1% 5.6%
STK 1,694 925.3 17.3% 0.4% 2.3% 3.2% 6.7% 31,900 2,441 14,619 13.1 2.2 9.1% 3.6%
TNG 1,543 1,424.2 18.1% 2.8% 2.0% 8.4% 4.2% 19,000 3,762 16,574 5.1 1.1 16.3% 3.8%
GMC 844 1,114.2 15.7% 0.4% 2.1% 6.7% 5.6% 36,800 5,742 20,445 6.4 1.8 26% 7.3%
EVE 1,112 630.3 33.3% 0.03% 8.7% 10.8% 11.0% 27,000 3,964 31,512 6.8 0.9 8.0% 6.3%
GIL 855 787.0 17.9% 1.1% 1.8% 6.2% 6.3% 35,000 4,939 27,118 7.1 1.3 13.2% 5.8%
KMR 691 314.4 22.3% 1.7% 5.9% 7.3% 6.6% 4,500 279 10,624 16.1 0.4 4% 3%
NPS 76.4 32.9 12.4% 1.5% 3% 8.9% 0.5% 14,500 455 15,349 31.9 0.9 0.5% 0.2%
G20 331 216.8 12.2% 4.5% 0.9% 1.5% 4.3% 9,400 1,248 11,345 7.5 0.8 8.5% 2.8%
TET 75.5 30.5 30% 0% 2.5% 29.1% 31.7% 19,400 2,366 12,111 8.2 1.6 14% 12.8%
Source: Financial statement of the firms, BSC collected
Note: unit of total asset and Net revenue – bil dong

B S C R E S E A R C H
Vietnam Sector Outlook 2016 Part 1
www.bsc.com.vn // 38
Electricity Sector 2015 [Business results diversification between thermal power and hydro power]
• Production output and consumption witnessed stable growth at 12%.
• Hydro power production decreased by 6% due to El Nino while thermal power production
increased by 17%.
• Electricity price on competitive electricity market increased by 5 dong/ kWh.
• Gas input price decreased by 15-45%.
• Exchange rate fluctuation and application of Circular 200 made electricity firms experience
exchange rate loss.
Power production output remained stable growth. In 11M2015, electricity production output and
purchased by EVN reached 146.49 bil kWh, increased by 12% over the same period 2014. In particular:
Hydropower production output decreases slightly due to El Nino. Hydropower production output is
estimated to reach 54 bil kWh (-6%yoy). Due to El Nino, rainy season was 1 month later than usual in the
South and the Central. In addition, the river water level in the second half of year was lower than average
of many years causing hydropower production output to decrease lightly.
Thermal power production increased significantly because new plants were into production. Hydropower production output is estimated to reach 48 bil kWh (+57%yoy). In 2015, some large thermal
power were put into production, helping Vietnam total capacity of thermal power increase 28% to reach
12,492 MW. In August 2015, despite disrupted coal supply for thermal power and electricity distribution in
the North due to serious flood in Quang Ninh, large thermal powers were not affected strongly thanks to
rich coal reserves and rapidly recovered flood consequences.
Gas thermal power production increased slightly. Gas thermal production output is estimated to reach
43 bil kWh (+8%yoy). Because the hydro powers in the South and the Central were affected more
significantly than the ones in the North, hydro power production deficit. As a result, the gas thermal power
(mainly located in the South) were more mobilized. Also, in 2015, gas supplies from PM3 was stable with
stop-gas-supply days down from 14 to 9 and only cut gas supply one time in August 2015 while cutting 2
times in 2014 ( July and October). In addition, gas supply from Nam Con Son also decreased/stopped gas
supply in 3 days in Sep 2015.
Oil thermal power increased dramatically by 29%, reaching 0.42 bil kWh: stopped gas supplies
happened in the peak time forced EVN to mobilize the oil thermal power. In addition, in June 2015, Unit 2-
O Mon thermal power with capacity of 330 MW was put into production, increasing oil thermal power
production.

B S C R E S E A R C H Vietnam Sector Outlook 2016 Part 1
39 // www.bsc.com.vn
Electricity imported from China fell sharply. In 11M2015, electricity imported from China touched 1.6 bil
kWh (-15%yoy). At the same time, electricity import contracts with China assigned for 13 Northern provinces
will be ended in 2015.
Into-production new power plants 2015
Name Type Capacity
Operation time
Mong Duong- unit 1 thermal 540 Jan 2015
Duyen Hai 1 – Unit 1 Coal thermal 622.5 Feb 2015 Duyen Hai 1 - Unit 2 Coal thermal 622.5 Apr 2015 Mong Duong- Unit 2 Coal thermal 540 Jun 2015 O Mon 1- Unit 2 Gas thermal 330 Jun 2015 Formosa - Unit 2 Coal thermal 150 Jul 2015 Nam Muc- Unit 1 Hydro power 22 Jul 2015 An Khanh- Unit 2 Coal thermal 57.5 Aug 2015 Formosa - Unit 3 Coal thermal 100 Sep 2015 Formosa - Unit Coal thermal 100 Dec 2015 Lai Chau- Unit Hydro power 400 Dec 2015 Huoi Quang- Unit 1 Hydro power 260 Dec 2015
Source: EVN
Commercial electricity output increased by 12%yoy. Vietnam consumed aboat 131 bil kWh commercial
electricity in 11M2015. Similar to electricity production, Vietnam’s electricity consumption remained at stable
growth. In particular, agricultural electricity demand witnessed rapid growth by 24%, followed by commercial
electricity-23%. Power demand for industry and construction and management-consumer were up 11%.
Electricity retailing price increased by 7.5% from 16th Mar 2015. After being kept stable in 2014,
electricity retailing price was increased from 1508.85 dong/kWh to 1622.01 dong/kWh according to official
decision issued on 12th Mar 2015 of the Ministry of industry and Trade.
The average electricity purchase price of EVN on the competitive electricity market tends to rise. The average electricity purchase price of EVN on the competitive electricity market in 10M2015 was 1,183
dong/kWh, higher than average of 3 years which was 1,087 dong/kWh. Due to El Nino, the hydro power
with low price was into shortage, EVN was forced to mobilize gas thermal and coal thermal with higher
price.
.
0
10
20
30
40
50
60
70
The electricity volume produced and imported in 11M2015
11M2015 11M2014

B S C R E S E A R C H
Vietnam Sector Outlook 2016 Part 1
www.bsc.com.vn // 40
Source: EVN
Coal price for thermal power was stable. After increasing by 5-7% in Oct 2014, coal price selling to
thermal power was stable in 2015.
Water resource tax’s based price increased. According to decision No. 567/QĐ-BTC, from 16th mar
2015, the average commercial electricity price used to calculate natural water resource tax was 1,622.01
dong/kWh, increased 113.21 dong/kWh or 7.5% increase compared with the price applied on 1st Aug 2013.
Gas and oil prices selling for electricity production decreased sharply. In 2015, average gas selling
price to thermal power stood at USD 4.8 per mmbtu for Cuu Long and Nam Con Son mine’s offtake gas
price, decreased by 15% yoy; stood at USD 3.6 per mmbtu with PM3-Ca Mau gas mine, decreased by 45%
yoy. According government decision, from 1st Apr 2014, purchase offtake gas price in Cuu Long and Nam
Con Son mines would be equal to 70% market price (46% of MFO-averager oil price of last month in
Singapore market+transportation cost), from 1st Jul 2014 equal to 80% market price, from 1st Oct 2014
equal to 90% market price and from 1st Jan 2015 equal to 100% market price. Therefore, offtake gas selling
price in Cuu Long and Nam Con Son mines and gas selling price to power production in PM3 mine depends
directly on oil price. However, from Jul 2015, Nhon Trach 2 (NT2) started to calculate prices at market rate
and from Oct 2015 would apply synchronization for gas power plants. With dramatic downtrend in oil price
from Jun 2014, the average FO and DO price in 2015 decreased 30%yoy and 34%yoy respectively.
.
842
890
948.5
1058
1242
1304
1369
1437
1508.85
1622.01
0200400600800
10001200140016001800
The average retail electricity price (dong/kWh)
1,137.481,138.43
1,210.66
1,078.14
1,290.501,237.69
1,195.96
1,248.981,143.45
1,150.40
9501,0001,0501,1001,1501,2001,2501,3001,350
Jan Feb Mar Apr May Jun Jul Aug Sep Oct
The average purchase electricity price of EVN in 2015 (dong/kWh)
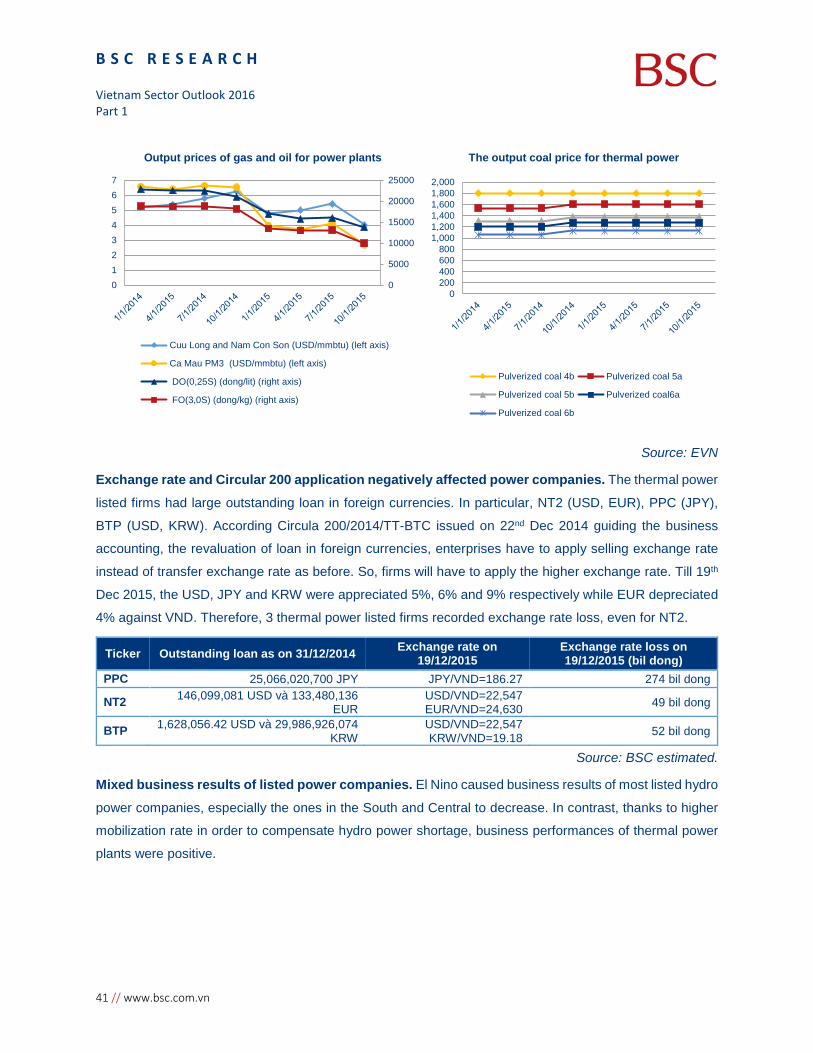
B S C R E S E A R C H Vietnam Sector Outlook 2016 Part 1
41 // www.bsc.com.vn
Source: EVN
Exchange rate and Circular 200 application negatively affected power companies. The thermal power
listed firms had large outstanding loan in foreign currencies. In particular, NT2 (USD, EUR), PPC (JPY),
BTP (USD, KRW). According Circula 200/2014/TT-BTC issued on 22nd Dec 2014 guiding the business
accounting, the revaluation of loan in foreign currencies, enterprises have to apply selling exchange rate
instead of transfer exchange rate as before. So, firms will have to apply the higher exchange rate. Till 19th
Dec 2015, the USD, JPY and KRW were appreciated 5%, 6% and 9% respectively while EUR depreciated
4% against VND. Therefore, 3 thermal power listed firms recorded exchange rate loss, even for NT2.
Ticker Outstanding loan as on 31/12/2014 Exchange rate on 19/12/2015
Exchange rate loss on 19/12/2015 (bil dong)
PPC 25,066,020,700 JPY JPY/VND=186.27 274 bil dong
NT2 146,099,081 USD và 133,480,136 EUR
USD/VND=22,547 EUR/VND=24,630 49 bil dong
BTP 1,628,056.42 USD và 29,986,926,074 KRW
USD/VND=22,547 KRW/VND=19.18 52 bil dong
Source: BSC estimated.
Mixed business results of listed power companies. El Nino caused business results of most listed hydro
power companies, especially the ones in the South and Central to decrease. In contrast, thanks to higher
mobilization rate in order to compensate hydro power shortage, business performances of thermal power
plants were positive.
0
5000
10000
15000
20000
25000
01234567
Output prices of gas and oil for power plants
Cuu Long and Nam Con Son (USD/mmbtu) (left axis)
Ca Mau PM3 (USD/mmbtu) (left axis)
DO(0,25S) (dong/lit) (right axis)
FO(3,0S) (dong/kg) (right axis)
0200400600800
1,0001,2001,4001,6001,8002,000
The output coal price for thermal power
Pulverized coal 4b Pulverized coal 5a
Pulverized coal 5b Pulverized coal6a
Pulverized coal 6b

B S C R E S E A R C H
Vietnam Sector Outlook 2016 Part 1
www.bsc.com.vn // 42
Ticker Type capacity (MW) Location
Rev 9M 2015 (Bildong)
%y.o.y PAT 9M2015 (Bildong)
%y.o.y Notice
PPC Thermal power 1040 Hai Duong 6,046 7% 443 -11%
Exchange rate loss, low production output in first quarter, recorded loss from joint ventures
NT2 Gas tubine 750 Dong Nai 5,341 15% 692 20%
Production output and price increased sharply.
BTP Gas tubine 388 Vung Tau 1,321 -15% 3 -97%
Falling production output and exchange rate loss
NBP Thermal power 100 Ninh Binh 525 -30% 9 -66%
Decreased production output and increased coal consumed
TMP Hydropower 150 Binh Phuoc 492 1% 186 25% Increase selling price
CHP Hydropower 170 Hue 432 54% 149 Sharp increase consumption
SHP Hydropower 122.5 Lam Dong 417 -1% 115 -29% Decreased consumption
VSH Hydropower 136 Binh Dinh 363 73% 216 129%
Increased production out and took part in competitive market
SJD Hydropower 104 Binh Phuoc, Gia Lai, Dien Bien
306 -3% 156 6% New factory
TBC Hydropower 120 Yen Bai 192 -18% 93 -15% Decreased production
HJS Hydropower 12 Ha Giang 120 15% 23 77% Increase selling price
SBA Hydropower 73 Quang Nam, Phu Yen
99 -29% 11 -75% Decreased production
GHC Hydropower 28.2 Gia Lai 75 -17% 35 -7% Decreased production
DRL Hydropower 16 Dac Nong 42 -5% 24 -6% Decreased production
Source: BSC Research
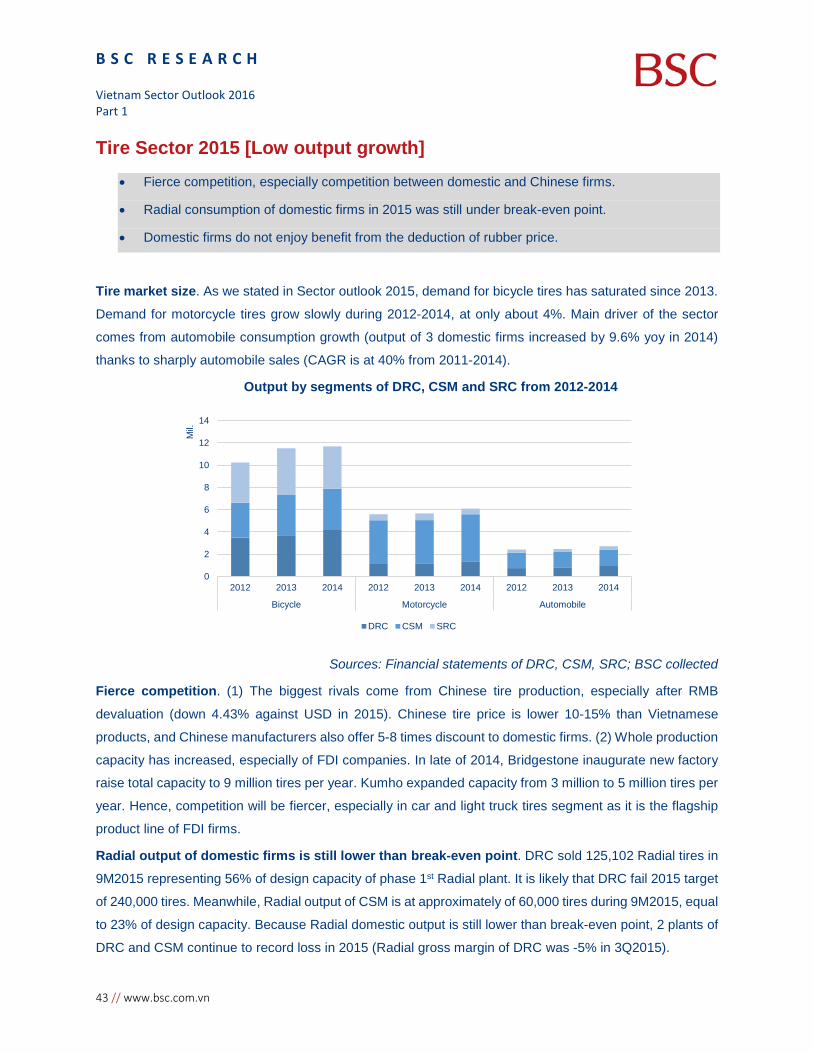
B S C R E S E A R C H Vietnam Sector Outlook 2016 Part 1
43 // www.bsc.com.vn
Tire Sector 2015 [Low output growth] • Fierce competition, especially competition between domestic and Chinese firms.
• Radial consumption of domestic firms in 2015 was still under break-even point.
• Domestic firms do not enjoy benefit from the deduction of rubber price.
Tire market size. As we stated in Sector outlook 2015, demand for bicycle tires has saturated since 2013.
Demand for motorcycle tires grow slowly during 2012-2014, at only about 4%. Main driver of the sector
comes from automobile consumption growth (output of 3 domestic firms increased by 9.6% yoy in 2014)
thanks to sharply automobile sales (CAGR is at 40% from 2011-2014).
Output by segments of DRC, CSM and SRC from 2012-2014
Sources: Financial statements of DRC, CSM, SRC; BSC collected
Fierce competition. (1) The biggest rivals come from Chinese tire production, especially after RMB
devaluation (down 4.43% against USD in 2015). Chinese tire price is lower 10-15% than Vietnamese
products, and Chinese manufacturers also offer 5-8 times discount to domestic firms. (2) Whole production
capacity has increased, especially of FDI companies. In late of 2014, Bridgestone inaugurate new factory
raise total capacity to 9 million tires per year. Kumho expanded capacity from 3 million to 5 million tires per
year. Hence, competition will be fiercer, especially in car and light truck tires segment as it is the flagship
product line of FDI firms.
Radial output of domestic firms is still lower than break-even point. DRC sold 125,102 Radial tires in
9M2015 representing 56% of design capacity of phase 1st Radial plant. It is likely that DRC fail 2015 target
of 240,000 tires. Meanwhile, Radial output of CSM is at approximately of 60,000 tires during 9M2015, equal
to 23% of design capacity. Because Radial domestic output is still lower than break-even point, 2 plants of
DRC and CSM continue to record loss in 2015 (Radial gross margin of DRC was -5% in 3Q2015).
0
2
4
6
8
10
12
14
2012 2013 2014 2012 2013 2014 2012 2013 2014
Bicycle Motorcycle Automobile
Mil.
DRC CSM SRC
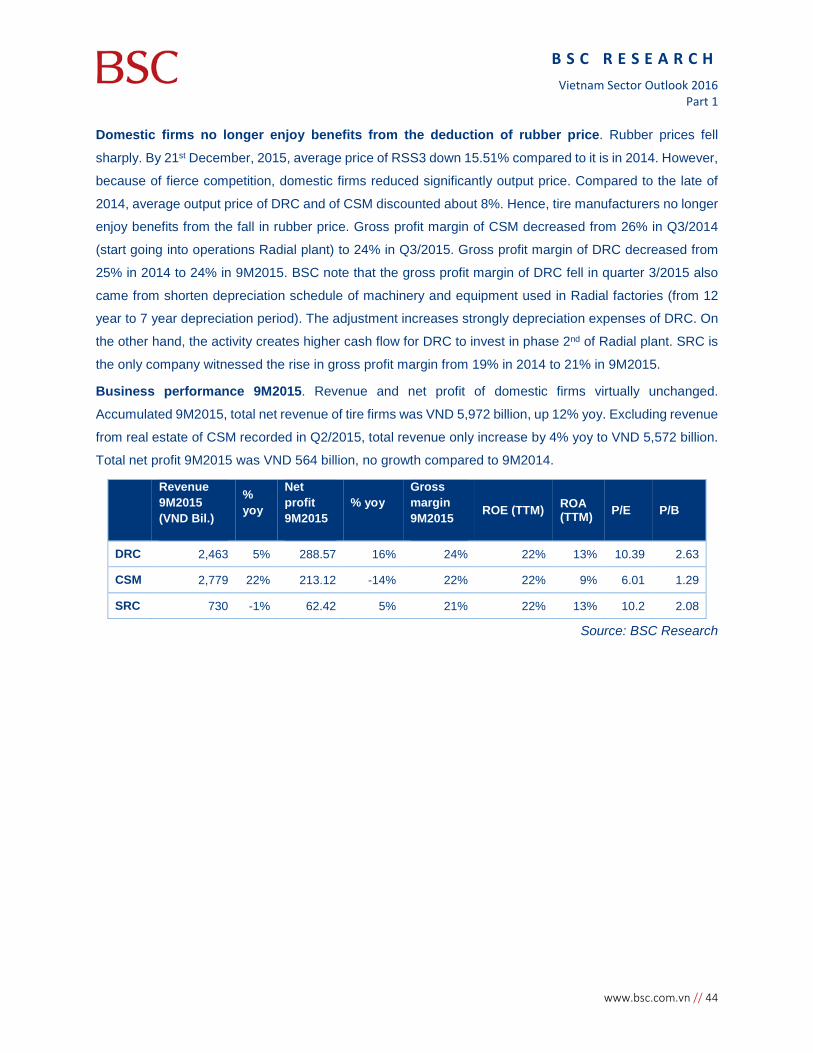
B S C R E S E A R C H
Vietnam Sector Outlook 2016 Part 1
www.bsc.com.vn // 44
Domestic firms no longer enjoy benefits from the deduction of rubber price. Rubber prices fell
sharply. By 21st December, 2015, average price of RSS3 down 15.51% compared to it is in 2014. However,
because of fierce competition, domestic firms reduced significantly output price. Compared to the late of
2014, average output price of DRC and of CSM discounted about 8%. Hence, tire manufacturers no longer
enjoy benefits from the fall in rubber price. Gross profit margin of CSM decreased from 26% in Q3/2014
(start going into operations Radial plant) to 24% in Q3/2015. Gross profit margin of DRC decreased from
25% in 2014 to 24% in 9M2015. BSC note that the gross profit margin of DRC fell in quarter 3/2015 also
came from shorten depreciation schedule of machinery and equipment used in Radial factories (from 12
year to 7 year depreciation period). The adjustment increases strongly depreciation expenses of DRC. On
the other hand, the activity creates higher cash flow for DRC to invest in phase 2nd of Radial plant. SRC is
the only company witnessed the rise in gross profit margin from 19% in 2014 to 21% in 9M2015.
Business performance 9M2015. Revenue and net profit of domestic firms virtually unchanged.
Accumulated 9M2015, total net revenue of tire firms was VND 5,972 billion, up 12% yoy. Excluding revenue
from real estate of CSM recorded in Q2/2015, total revenue only increase by 4% yoy to VND 5,572 billion.
Total net profit 9M2015 was VND 564 billion, no growth compared to 9M2014.
Revenue 9M2015 (VND Bil.)
% yoy
Net profit 9M2015
% yoy Gross margin 9M2015 ROE (TTM) ROA
(TTM) P/E P/B
DRC 2,463 5% 288.57 16% 24% 22% 13% 10.39 2.63
CSM 2,779 22% 213.12 -14% 22% 22% 9% 6.01 1.29
SRC 730 -1% 62.42 5% 21% 22% 13% 10.2 2.08
Source: BSC Research

B S C R E S E A R C H Vietnam Sector Outlook 2016 Part 1
45 // www.bsc.com.vn
Plastic Sector 2015 [Positive] • 6M2015, revenue of the whole sector continues to grow rapidly, rising 10.3%, while export growth
slowed, rising only 1.3%.
• Fall in plastic resin prices improve the gross profit margin of plastic firms.
• Positive business performance in 9M2015.
Whole sector rose by 10.3% in revenue in 6M2015. The revenue got USD9.1 billion in 2014 (+8.3% yoy)
and got USD 4.2 billion in 6M2015.
• Domestic consumption increase sharply. The benefit comes from plastic consumption per
capita and the recovery of plastic construction segment (+ 15% in 6T2015). In 2013, plastic
consumption per capita was 35 kg, lower than many countries in regions and in the world (at 66.7
kg per capita)
• Difficulties in export market. After rapid growth of over 20% during 2009-2014, exports increased
by only 1.24% in 11M2015. 2 largest Vietnam export markets including EU and Japan witness a
decline in 11M2015, down 3% and 2%, respectively, because of fierce competition and VND
appreciation over other currencies. On the positive side, US market accounting for 15% of total
export markets maintain high growth rate (+15.24%).
Vietnam plastic export
Vietnam plastic export by market 11M2015
Source: Vietnam custom
The fall in plastic resin price brings opportunity to plastic firms. Plastic resins account for about 70-
80% of operating cost of plastic firms. In 2015, average price of HDPE, LDPE resins down 20%, PVC
-
500
1,000
1,500
2,000
2,500
US
EU Japan US Korea Others
25%
22%
15%4%
34%
EU Japan US Korea Others

B S C R E S E A R C H
Vietnam Sector Outlook 2016 Part 1
www.bsc.com.vn // 46
decreased by 21% and PP declined 25% compared to these price in 2014. These improved gross margin
for many plastic companies.
USD appreciated 5% against VND lead a slight increase in operating expenses. Vietnam imported
about 70% plastic resin, make payment primarily in USD. Therefore, plastic resin price calculated in VND
reduce slower than the price calculated in USD.
Plastic resin import
Plastic resin import by market 11M2015
Source: Vietnam custom
Plastic resin price 2014-2015
Sources: Bloomberg, BSC
0.0
0.5
1.0
1.5
2.0
2.5
3.0
3.5
4.0
mil.
tons +12.2%
20%
19%
15%10%
7%
5%
24%
Arabic Korea Taiwan Thailand
China Singapore Others
0200400600800
10001200140016001800
1/3/
2014
2/3/
2014
3/3/
2014
4/3/
2014
5/3/
2014
6/3/
2014
7/3/
2014
8/3/
2014
9/3/
2014
10/3
/201
411
/3/2
014
12/3
/201
41/
3/20
152/
3/20
153/
3/20
154/
3/20
155/
3/20
156/
3/20
157/
3/20
158/
3/20
159/
3/20
1510
/3/2
015
11/3
/201
512
/3/2
015
HDPE LDPE PVC PP

B S C R E S E A R C H Vietnam Sector Outlook 2016 Part 1
47 // www.bsc.com.vn
Positive performance. By 9M2015, total accumulated revenue of 11 listed companies was VND 10,529
billion, up 16.2% yoy, total accumulated profit after tax was VND 803 billion, rose by 29.4%yoy. As stated
in Sector outlook 2015 report, the business results of the plastic construction firms soared thanks to rapid
growth in consumption and improvement of operating profit margin (BMP, DNP, DPC, DAG). Meanwhile,
the packaging business has small operating margins (1% -7%) and many businesses faced with decline in
margin (AAA, SPP, TPC) due to reduction of output price. Many companies have accelerated earnings
growth such as DNP (+169x thanks to consolidation of business performance of Binh Hiep water company),
RDP (+ 433%), DPC (+ 109% yoy), DAG (+ 46% yoy), BMP (+ 44% yoy), SPP (+ 30% yoy) and VBC (+
21% yoy). Meanwhile, AAA and TPC recorded profits plunge -59% yoy and -19% yoy, respectively.
Main products
Revenue 9M2015 (VND bil.)
% yoy
Net profit 9M2015
% yoy Operating profit margin
ROE ROA P/E P/B
NTP Plastic pump
2,545 20%
261.30 13% 11% 23% 13%
10.93
2.38
BMP Plastic pump
2,069 14%
389.01 44% 24% 27% 24%
12.30
3.12
DNP Plastic pump
653 82%
6.00 16824% 7% 30% 9%
5.96
1.05
DPC Plastic pump
60 0%
1.07 109% 2% 4% 4%
42.85
1.61
DAG
Profile bars, plastic doors & windows
973 21%
35.23 46% 4% 14% 5%
6.50
0.95
AAA Packaging export
1,155 3%
18.84 -59% 2% 3% 1%
16.77
0.55
RDP Packaging
836 3%
45.93 433% 7% 23% 8%
7.74
1.62
TPP Packaging
633 37%
11.76 26% 2% 16% 4%
8.46
1.40
SPP Packaging
615 12%
6.93 30% 1% 4% 1%
14.31
0.60
TPC Packaging
510 -4%
7.62 -19% 2% 3% 2%
13.44
0.44
VBC Packaging
479 12%
19.58 21% 5% 28% 9%
5.26
1.46
Source: BSC Research

B S C R E S E A R C H
Vietnam Sector Outlook 2016 Part 1
www.bsc.com.vn // 48
Pharmaceutical Sector 2015 [Fiercer competition] • Pharmaceutical sales maintains rapid growth, is estimated at 13.39% in 2015.
• Much of the growth is in the hand of foreign firms (10M2015, pharmaceutical import grew by 11.4%,
while domestic production index of pharmaceutical, medical chemical and botanical product
increase only by 3%).
Vietnam's pharmaceutical consumption maintain high growth rates. As we mentioned in sector
outlook 2015 report, Vietnam's pharmaceutical sector grow fast, but slow down. CAGR was 17.38% from
2009-2014 and is estimated grew by 13.39% in 2015 to USD 4.32 billion (BMI research).
Pharmaceutical size and pharmaceutical import in value from 2009-2014
Pharmaceutical material import 2009-10T20152
Sources: BMI, Vietnam custom
Domestic pharmaceutical companies lose market share to foreign firms. While pharmaceutical
manufacturing grow slowly, pharmaceutical import maintain high growth rate. (1) Pharmaceutical import
presented about 60-70% in value of Vietnam pharmaceutical sales from 2009-2014. CAGR of imported
value was 14.04% during 2009-2014 to USD 2.2 billion and increase by 11.4% in 10M2015 to USD 1.9
billion. On opposite side, the value of pharmaceutical materials imports fell 2.7% yoy in 10M2015 after
prolonged growth from 2011-2014 (CAGR was 13.16%). This signal indicates the decline in domestic
pharmaceutical manufacturing. In the period of 2009-2014, huge pharmaceutical import markets include
Switzerland (CAGR was 17.14%), EU (13.98%) and India (CAGR = 12.43%).
2 Vietnam imports 90% pharmaceutical material.
0%10%20%30%40%50%60%70%80%90%100%
-
500
1,000
1,500
2,000
2,500
3,000
3,500
4,000
2009 2010 2011 2012 2013 2014
mil.
USD
Axis Title
pharmaceutical size pharmaceutical import
market share of import
-
50
100
150
200
250
300
350
400tr
USD

B S C R E S E A R C H Vietnam Sector Outlook 2016 Part 1
49 // www.bsc.com.vn
Circular No. 36 continues to impact negatively on the ETC channel of pharmaceutical companies. 2
key pharmaceutical distribution channels in Vietnam are ETC and OTC. In which, ETC accounted for 74%
of market value. Circular No. 36 divided pharmaceuticals into 7 auction packages of different techniques.
Domestic firms are not eligible to be on the GMP-EU, PIC packages (the higher value segment), and must
be on the same packages with Indian, Pakistan, Chinese firms with fierce completion on price. This reduces
ETC sales in both volume and product prices, thereby reduce gross margins of domestic pharmaceutical
companies. ETC revenue of IMP fell 16% yoy in 6M2015, of DHG down 61.7% yoy in 9M2015. Many
pharmaceutical companies have turned to OTC channel as DMC, IMP, etc put more competitive on OTC
channel.
Business performance. Accumulated 9M2015, total revenue of 11 listed firms virtually unchanged due to
high competition (rose by 1%). Some leading enterprises such as DHG, DMC declined sharply in sales.
9M2015 operating profit margin also fall because of fierce competition, VND depreciation 5% against USD.
Some businesses witnessed 9M2015 positive results are PPP (+ 253% yoy), OPC (+ 22% yoy), DBT (+
26% yoy), DCL (+ 18% yoy), TRA (+19 %, rebounded thanks to more effective distribution system).
Ticker Rev 9M2015 (bil đ) % yoy PAT 9M2015
(bil đ) % yoy Gross margin 9M2015
ROA (TTM)
ROE (TTM) P/E P/B
DHG 2,459 -5% 424 3% 40% 17% 23% 10.32 2.37
TRA 1,441 27% 123 19% 47% 15% 22% 13.27 2.24
DMC 861 -22% 101 5% 33% 14% 20% 11.43 1.22
DHT 711 14% 23 -4% 14% 7% 19% 7.55 1.40
IMP 629 6% 71 11% 41% 9% 11% 9.48 1.88
OPC 525 10% 57 22% 47% 13% 17% 6.33 0.86
DCL 481 -6% 40 18% 30% 7% 14% 6.67 21.45
DBT 398 4% 10 26% 23% 4% 14% 9.59 1.70
LDP 353 3% 13 -13% 12% 8% 22% 7.83 1.58
PMC 282 6% 47 2% 43% 27% 34% 9.95 1.19
DP3 154 10% 14 -18% 46% 0% 0% 10.78 1.31
PPP 71 -17% 5 253% 21% 5% 13% 4.21 0.73
Source: BSC Research

B S C R E S E A R C H
Vietnam Sector Outlook 2016 Part 1
www.bsc.com.vn // 50
Steel Sector 2015 [Difficulty] • Global steel consumption fell by 1.7% yoy, China Steel downed 5.7% yoy
• China reduced steel production capacity, increased exports by 22% yoy, Vietnam was the second
largest import
• Iron ore prices fell by 79.62% after 5 years, still higher than before 2008
• Steel consumption Vietnam was growth, market shares continued to be divided again
• Gross profit margin of construction steel enterprises decreased, coated steel sheet/steel pipes rose
Global steel consumption reduced – Impacted from China demand. According to World Steel
Association (WSA), the global steel consumption in 2015 reached about 1,513 million tons, downed 1.7%
yoy, mainly caused by a decrease from China, which accounted for 46.23% of total production global
consumption; in 10 months of 2015, China consumed 590.47 million tons (-5.7% yoy).
Source: World Steel Association, BSC Research
China steel sector - Cut capacity and step up exports. Although China steel exports in the first 11
months of 2015 amounted to 101.7 million tons (+22% yoy), but not enough to balance the pressure of
declining demand of domestic market. In 2015, China cut 50 million tons of steel production capacity, only
respectively more than 4% of the total steel production capacity (1.14 billion tons). HSBC estimated that
China should cut another 120 million to 160 million tons of capacity to the market on a more balanced state.
-
200
400
600
800
1,000
1,200
1,400
1,600
1,800
2007 2008 2009 2010 2011 2012 2013 2014
Steel Production - Consumption (mil ton)
Crude Steel Production Finished steel consumption
- 200 400 600 800
1,000 1,200 1,400 1,600 1,800
2007 2008 2009 2010 2011 2012 2013 2014
Tiêu thụ Thép Thế giới
China
Developing countries (excluding China)
Developed countries

B S C R E S E A R C H Vietnam Sector Outlook 2016 Part 1
51 // www.bsc.com.vn
Capacity utilization ratios (the World and China)
Source: World Bank, World Steel Association, BSC Research
As reported by the United States Department of Commerce, in 10 months of 2015, China exported about
90.1 million tons (+25.4% yoy), South Korea was the biggest importer with about 11.1 million tons (+4.1%
yoy). The quantity of China steel exports rose the most in Turkey (+204.7% yoy), Vietnam (+65.2% yoy)
and Indonesia (+59.2% yoy)
Unit: mil ton 2010 2011 2012 2013 2014 10M2015 11M2015 China Crude Steel Production
639 702 731 822 823 675 N/A
China Steel Export 24 47.9 54.8 61.5 92.9 90.1 101.7 % Export / Production 3.76% 6.82% 7.50% 7.48% 11.29% 13.63%
Source: World Steel Association, Financial Times, BSC Research
Source: International Trade Administration, Department of Commerce, USA
Iron ore prices – Continued slump but still higher than before 2008. The deceleration of the Chinese
economy with the peak of the investment in the iron ore mining sector (2012 to 2013) had led iron ore prices
continued to fall, specifically, 62% Fe ore prices fell 79.62%, from a peak of USD191.7/ton (17/02/2011) to
USD39.06/ton (14/12/2015).
Due to the nature of the steel industry was that output price has moved in the same direction as raw
materials price, so finished steel price was also under reducing price pressure, in Vietnam the average
selling price of construction steel was VND 18.5 million/ton (2011), now reduced to about VND 9.5

B S C R E S E A R C H
Vietnam Sector Outlook 2016 Part 1
www.bsc.com.vn // 52
million/ton (-48.65%), showed that iron ore prices affected directly the value of inventories and profit margin
of the business.
Source: Bloomberg, WSA, BSC Research
In Vietnam, the consumption growth - Benefit from the real estate sector. Calculated in 10 months of
2015, (1) with steel construction, consumption reached 5.30 million tons (+23.78% yoy), market shares
continued to be divided again when the majority share of the businesses were shrunk, only the market
share of HPG increased from 18.6% HPG (10 months of 2014) up to 21.7% (10 months of 2015) and TISCO
increased from 9.1% (10 months of 2014) up to 10.4% (10 months of 2015 ); (2) with coated steel sheet,
sales volume reached 1.68 million tons (+11.91% yoy), Hoa Sen - Nam Kim and Dong A continued to lead
the market; (3) with steel pipes, sales volume reached 1.15 million tons (+26.31% yoy), Hoa Phat leaded
the market with market share increased from 19.77% (10 months of 2014) up to 23.04 % (10 months of
2015).
Source: VSA, BSC Research
Steel imported from China to Vietnam - increase rapidly. According to the General Department of
Customs in 10 months of 2015, Vietnam imported about 7.71 million tons of steel from China (+62.1% yoy)
and accounted for 61.09% of total imported steel. From 2009 – 10 months of 2015, the proportion of Iron
0
50
100
150
200
1/1/
2000
11/1
/200
09/
1/20
017/
1/20
025/
1/20
033/
1/20
041/
1/20
0511
/1/2
005
9/1/
2006
7/1/
2007
5/1/
2008
3/1/
2009
1/1/
2010
11/1
/201
09/
1/20
117/
1/20
125/
1/20
133/
1/20
141/
1/20
1511
/1/2
015
Iron Ore price
-
500
1,000
1,500
2,000
2,500
2005 2006 2007 2008 2009 2010 2011 2012 2013 2014
Iron ore output (mil ton)
Iron ore exploitation Iron ore exporting
21.70%
13.00%
4.30%5.00%4.60%10.40%
8.30%
32.70%
Construction Steel Market share
Hòa Phát Pomina Việt Ý SSE
Việt Đức TISCO Vinakyoei Others
38.60%
13.80%12.10%
6.30%
6.50%
22.70%
Galvanized Steel Sheet Market share
Hoa Sen Nam Kim Đông Á
Phương Nam Maruichi SunSteel Others

B S C R E S E A R C H Vietnam Sector Outlook 2016 Part 1
53 // www.bsc.com.vn
and Steel imported from China rose 4.55 times, up from 13.44% (2009), we expect output as well as the
proportion of steel imported from China would continue increase in the future as Vietnam was the 2nd
largest steel importer of China.
Source: Vietnam Customs
Control steel imports standard – Not effective. As in previous years, this issue had not been resolved,
instead of declare HS code of billets usually 7207, a rate of 5% - 9%, the importers declared HS code 7224
to receive tax interest 0% for alloy steel billets. Currently Vietnam had no national standards for the quality
of steel, as didn’t promote technical barriers to control of steel imports from China.
Business Results Assessment:
By the end of 3 quarters of 2015, a total of 16 steel listed companies on the HSX and HNX, there were 13
profitable enterprises (accounted 81.25%) and 3 losses business (accounted 18.75%). Total net sales of
listed enterprises reached VND54,892 billion (+3.3% yoy) and profit after tax reached VND3,613 billion
(+12.25% yoy).
Notably, the average gross profit margin was in the opposite movements between manufacturing Steel
Construction enterprises and manufacturing coated steel sheet/steel pipes enterprises. Specifically, gross
profit margin of Construction steel enterprises tended to reduce with HPG in 9 months of 2015 was 21.03%,
down from 21.92% of 9 months of 2014; in addition VIS and VGS were also similar reduction. Meanwhile,
gross profit margin of HSG reached 15.78% (9 months of 2015), a significant increasing compared to the
11.51% (9 months of 2014); and gross profit margin of NKG also reached 8.23% (9 months of 2015), up
sharply from 5.39% of 9 months of 2014.
Thus showed that although a reduced prices and input prices trend but coated steel sheet/steel pipes
businesses had export benefit, be able to keep gross profit margin better than steel Construction production
enterprises.
8.269.75 9.09
7.39 7.6
9.4610.43
12.62
3.09
1.31 2.19 1.67 2.34
3.50
5.37
7.71
0
2
4
6
8
10
12
14
2008 2009 2010 2011 2012 2013 11T 2014 10T 2015
Imported Steel of Vietnam (mil ton)
Total Import Imported from China

B S C R E S E A R C H
Vietnam Sector Outlook 2016 Part 1
www.bsc.com.vn // 54
Ticker Total Asset
9M2015 bil dong
Rev 9M2015 bil dong
% Rev 9M2015 Price
15/12/15 EPS T12M BVPS PE T12M PB ROE
9M ROA 9M Gross
margin Interest Expense
Selling Expense
Adminis Expense
Net margin
HPG 24,597 20,331 21% 1% 2% 2% 14% 30,600 4,640 19,190 6.60
1.59 21% 12%
HSG
9,335 13,032 16% 1% 5% 3% 4% 32,800
6,461
28,863
5.08
1.14 18% 6%
NKG
3,406
3,924 8% 1% 2% 1% 3% 13,200
2,873
14,122
4.59
0.93 17% 3%
VGS
1,310
2,637 4% 1% 1% 1% 1% 5,500
736
14,332
7.48
0.38 5% 2%
POM 7,910 7,703 5% 3% 0% 1% 0% 6,700 74 12,688 90.54 0.53 1% 0%
DTL 2,524 1,308 10% 1% 1% 2% 0% 8,700 101 14,099 86.51 0.62 1% 0%
VIS 1,978 2,311 5% 3% 2% 2% -1% 7,200 (389) 12,762 (18.51) 0.56 -4% -1%
Source: BSC Research

B S C R E S E A R C H Vietnam Sector Outlook 2016 Part 1
55 // www.bsc.com.vn
Aquaculture Sector 2015 [Negative] • Seafood export turnover dropped dramatically (-18%yoy) in which shrimp and catfish export value
decreased by 28%yoy and 12% yoy respectively, due to difficulties in output market such as USA,
EU, Japan and Korea
• Aquaculture companies‘ business results fell sharply in comparison with these in 2014.
Seafood export drecreased significantly. Total Vietnam seafood export value in 10M2015 touched USD
5.45 bil, in which shrimp and catfish export value stood at USD2.4 bil (-28%yoy) and USD 1.3 bil (-12%yoy)
respectively.
• Most of Vietnam’s major export markets were reduced, in which USA experienced the most
significant drecrease (22%), followed by EU (19%) and Japan (11.2%). The main reasons: (1)
10M2015, seafood demand of USA and Japan were only USD 15 bil (-8%yoy) and USD 9.4 bil (-
10.4%yoy) respectively, except for Korean with slight increase of 2.5%. (2) Japanese Yen, Euro,
Bath, Yuan were devalued 1.24%, 9.78%, 7.5% and 3.75% respectively against USD making
Vietnam’s seafood more expensive relatively. (3) Shrimp POR 8 and catfish POR 10 antidumping
tax are still remaining at high level , affecting Vietnam’s seafood competitiveness.(4) Aquaculture
demand fell because of increase in natural seafood supply as a result of low oil price.
• Shrimp and catfish export decrease. (1) 9M2015, tiger prawn export reached USD 711.4 mil (-
31.7%yoy), vannamei export reached USD 1.2 bil (-27.5%yoy). Reasons: shrimp price fell 25.2%
standing at 10.14 cent/lb due to increase in supply from Thailand and China after influencing by
EMS; in addition, domestic production decreased by 4.1% yoy as a result of disadvantage weather
in Cuu Long Delta and surged in FDA returned orders ( 10M2015, 377 orders bounces, equal to
1.8 times compared with the year 2014). (2) 10T2015, pangasius exports plummeted by 12%, in
which export value to USA reached USD 260.7 mil (- 4.6%yoy) and EU reached USD 245.9 mil (-
15%yoy); smaller markets such as Asean, Mexico or Braxil also witnessed decrease by 1.9%, 10%
and 44.5% respectively. The explaination were pangasius production fell by 5% standing at 1 mil
tons and high competition from other kinds such as tilapia, whitefish and salmon.

B S C R E S E A R C H
Vietnam Sector Outlook 2016 Part 1
www.bsc.com.vn // 56
Source: BSC Research
Catfish benefited from falling corn price (-7%yoy) and fresh bean cake (-15.9%yoy) due to increase in
supply from India and China while demand decreased significantly.
Business results saw diversification. Leading companies such as HVG and VHC recorded quite well
revenue growth at 20% and 8% respectively, but profits witnessed deeply fall due to significant increase in
financial expenses (HVG) and no longer recording profit from transfer of subsidiary as the same period in
2014. Notably, FMC recorded decreased revenue but sharp increase in profit (105%) thanks to initiative of
input raw materials from its parent company-HVG and suppliers‘ damages repayment relating to export
shipment in 2014.
Business results 9M2015
Name Rev(VND bil) Gross profit margin PAT (VND Bil )
P/E P/B 9M2015 %yoy 9M2015 9M2014 9M2015 %yoy
HVG 13,013 20% 0.84% 3.99% 118 -74% 20.87 1.18
VHC 4,664 8% 6.62% 11.77% 250 -37% 10.97 1.68
FMC 2,096 -3% 3.56% 2.31% 78 105% 5.86 1.28
IDI 1,900 18% 4.16% 5.25% 91 14% 6.03 0.62
ANV 1,833 -5% 2.24% 1.93% 29 -36% 12.08 0.48
ACL 852 41% 3.19% 2.28% 25 127% 7.58 0.54
TS4 517 -6% 0.76% 2.23% 3 -73% 11.63 0.54
ABT 355 1% 16.81% 19.87% 54 -13% 7.83 1.44 Average
4.77% 6.2% 10.36 0.97
Source: BSC Research
01000200030004000500060007000
2011 2012 2013 2014 11M201411M2015
Export value to main markets
USA EU Japan Korea China Russia
20%
17%
16%
9%7%
1%
51%
Main markets' share
USA EU Japan Korea China Russia Others

B S C R E S E A R C H Vietnam Sector Outlook 2016 Part 1
57 // www.bsc.com.vn
Oil & Gas Sector 2015 [Down trend] • Oil price fell 39% and LPG decreased by 47% in CP and 36% in domestic price.
• Capex in oil& gas sector was cut by 15%
• The production rose by 9% in crude oil and 5% in natural gas
• The change in gas price police leaded to a decrease of 10-30% in input price of industry gas
companies.
• The revenue of oil& gas companies down.
Down trend in oil price continued in 2015: as of the date 12/11/2015, oil price fell by 39% in 2015 from
60 USD/bbl to 37 USD/bbl in WTI and from 65 USD/bbl to 39 USD/bbl in Brent. The export price of Vietnam
crude oil also decreased strongly from 69 to 48 USD/bbl in the first 11 months of 2015.
Source: BSC Research
LPG price also decreased: LPG is the product of oil refinery. Therefore the price of LPG depends on the
price of crude oil. Moreover, the demand of LPG witnessed a slow growth, especially in heating LPG due
to the warmer weather. Therefore, the average price of CP in 2015 fell by 47% y.o.y and the LPG price in
Vietnam also fell by about 36% y.o.y.
Oil& gas CAPEX was cut: under the pressure from the sharp decrease in oil price, the budgets of oil& gas
companies shrunk and the CAPEX was cut. According to McKinsey, the global oil gas CAPEX in 2Q2015
reduced 25% y.o.y. Moreover, Standard& Poor’s estimated that the total oil& gas CAPEX in Asia Pacific
was cut by 15%y.o.y
0
20
40
60
80
100
120
WTI và Brent oil price (usd/bbl)
WTI Brent
- 200 400 600 800
1,000 1,200 1,400
CP price- LPG Saudi Aramco price (USD/ton)
Probane Butane

B S C R E S E A R C H
Vietnam Sector Outlook 2016 Part 1
www.bsc.com.vn // 58
Global oil& gas CAPEX (billion USD)
Total CAPEX for leading oil& gas companies,2014-2015 (bil.USD)
Source: BSC Research
Increasing production to offset the decrease in price: in the first 11 months of 2015, PVN produced
35.5 million tones of oil equivalent including 17.19 million tones of crude oil, up 9%y.o.y and 9.7 billion m3
of natural gas, up 5%y.o.y. The import crude oil of Vietnam was 7.99 million tones as of date 11/15/2015,
up 3%y.o.y. the LPG production was 662.1 thousand tones, up 16.9% y.o.y. The growth rate in oil& gas
production was higher than 2014.
New gas fields were started operating: while the exploration and exploitation of new oil fields have been
slowdown, a number of new gas fields were started operating such as Thai Binh Block 102-106 (capacity
of 200 million cubic meters/year) and Dai Hung (capacity of 70 million m3/year)
Source: Vietnam General Statistic Office
-2%0%2%4%6%8%
10%12%
2010 2011 2012 2013 2014 2015
The growth rate of Vietnam total oil and gas production (oil equivalent)
-5%
0%
5%
10%
15%
20%
25%
2010 2011 2012 2013 2014 2015
The growth rate of Vietnam total oil and gas production
Oil Natural gas

B S C R E S E A R C H Vietnam Sector Outlook 2016 Part 1
59 // www.bsc.com.vn
Change in the policy about gas price: in 2015, the input price of industry gas companies including PGD,
PGS and CNG was calculated based on the discount fuel oil, instead of fixed price. With the decrease in
oil price, the input price of these companies reduced by 10-30%.
The revenue of oil& gas companies declined: in the first 9 months of 2015, the revenue of most listed
oil& gas companies fell sharply. Listed oil& gas companies in Vietnam are service supplier and gas trading.
Therefore, the impact of downtrend in oil price is later. The low oil price leaded to the cut in service price
and service demand. In addition, the output price of gas trading companies is calculated based on the oil
price and the international LPG price, which were decrease in 2015. In term of profit, GAS, PVD, PGS,
PVC, PXS, CNG and PCG recorded a sharply fall due to the decrease in selling volume and price. However,
PVS, PGD, PVG, PGC, PVB and PVE recorded a growth thanks to the internal factors such as reversal of
warranty provision (PVS, PVB), decrease in input price (PGD, PVG, PGC) and new foreign contracts (PVE).
The business performance of oil& gas companies in 9M2015
Order Sticker Core business Rev.
9M2015 (bil. dongs)
%y.o.y NPAT 9M2015 (bil. dong) %y.o.y
1 GAS Gas 47,094 -14% 7,731 -19% 2 PVS Oil& gas services 19,324 -16% 1,292 9% 3 PVD Drilling services 12,010 -22% 1,665 -17% 4 PGS LPG and CNG 4,529 -20% 148 -15% 5 PGD Low pressure gas 3,747 -26% 191 26% 6 PVC Drilling mud 2,906 -13% 167 -34% 7 PVG LPG 2,003 -43% 21 8 PGC LPG 1,824 -21% 77 20% 9 PXS M&C 1,456 9% 93 -10%
10 PVB Pipe coating 915 21% 142 7% 11 CNG CNG 692 -15% 88 -3% 12 PVE Engineering 634 44% 23 44% 13 PCG LPG 468 -29% 4 -61%
Source: BSC Research

B S C R E S E A R C H
Vietnam Sector Outlook 2016 Part 1
www.bsc.com.vn // 60
Fertilizer Sector 2015 [Difficult] • Oversupply increased slightly with production output increased by 1% while consumption
remained stable
• Selling price of fertilizer decreased by 1-7%
• Gas and sulfur price plummeted by 20-32%
• Exemption from VAT reduced profits of fertilizer companies
• Business results of most fertilizer companies declined, except for DPM and QBS
Domestic fertilizer market is still in oversupply state
• Production output rose slightly: For 11M2015, Vietnam produced 6,018 thousand tons of
fertilizers, up 1% yoy. Specifically, DAP production achieved the highest growth of 68% and
reached 429 thousand tons, thanks to DAP No.2 plant going into operation. The second highest
growth was achieved by urea fertilizer production, with 3% increase to 2,049 thousand tons.
Conversely, phosphate and NPK production decreased by 12% and 1% respectively.
Source: Ministry of Industry and Trade
Source: Ministry of Agriculture and Rural
Development
• Consumption output remained stable: For 11M2015, Vietnam was estimated to consume 9,346
thousand tons of fertilizer. Estimated for the year of 2015, Vietnam consumed 10,760 thousand
tons of fertilizer, which was equivalent to the level of 2014.
0.0 500.0 1,000.0 1,500.0 2,000.0 2,500
NPK
Urea
Phosphate
DAP
The volume of fertilizer production in 11 m(tons)
11TM014 11M2015
NPK36%
Urea20%
Phosphate17%
Potash9%
DAP9%
SA9%
Vietnam fertilizer demand structure in 2015

B S C R E S E A R C H Vietnam Sector Outlook 2016 Part 1
61 // www.bsc.com.vn
• Fertilizer exports plummeted: Vietnam was estimated to export 722 thousand tons of fertilizer in
11M2015, valued at $ 258 million, down 26% yoy.
• Fertilizer imports regained its growth: After falling in 2014, Vietnam fertilizer imports reached
4,050 tons in 11M2015 (+14% yoy), equivalent to $1,282 million(+10% yoy). In particular, the import
volume of urea surged to 522 thousand tons, worth $ 157 million (+144% yoy) since a series of
plants conducted repair and maintenance in 2015: Phu My Fertilizer, Ha Bac Fertilizer, and Ninh
Binh Fertilizer in the second quarter; and Ca Mau Fertilizer in the third quarter. SA and potassium
fertilizer were still top 2 imported fertilizer products since Vietnam is unable to produce domestically.
China continued to be Vietnam’s largest fertilizer importer with approximately 50% proportion.
Source: Vietnam General Department of Customs
Fertilizer prices continued to decline slightly in 2015: Influenced by the downtrend of the global
fertilizer market, the price of fertilizer in Vietnam decreased, but at lower percentage. As of November
2015, the urea price in China, the DAP price in China, and the potassium price in Canada had fell by
respectively 16%, 1% and 10%, compared with the beginning of 2015. Meanwhile, the price of these
products declined by 7%, 4% and 1% respectively in Vietnam for the same period.
0 200 400 600 800 1,000
SA
Potash
DAP
Urea
NPK
The volume of imported fertilizers (thousand tons)
10M2014 10M2015
- 500 1,000 1,500 2,000
China
Russia
Lithuania
Japan
Indonesia
Laos
The volume of imported fertilizers by countries (thousand tons)
10M2014 10M2015

B S C R E S E A R C H
Vietnam Sector Outlook 2016 Part 1
www.bsc.com.vn // 62
Source: BSC’s research, Bloomberg
The increase in USD/VND exchange rate, along with the expansion of exchange rate bandwidth enhanced the competitiveness of domestic fertilizer products: prior to the change in exchange rate,
fertilizer products imported from China were priced generally lower than domestic products by VND 100-
500/kg. Although China devalued the yuan, the depreciation of VND, and the wider bandwidth of USD/VND
helped the price of domestic fertilizer products equal to fertilizer imported from China.
Input prices fell sharply: Impacted by the downward trend of crude oil prices, as of Dec 21st 2015, fuel oil
prices in the Singapore market fell by 41% compared with the beginning of the year. The low fuel oil price
had led to gas prices sold to DPM3 decrease by 32%. Similarly, sulfur prices for phosphate production was
down by 20% during the same period.
3 Gas cost for DPM is calculated as 46% of the average FO market price in Singpaore market for the previous month according to Platt magazine, plus transportation cost of 0.92 USD/MMBTU
0
2000
4000
6000
8000
10000
12000
14000D
ec-1
4
Jan-
15
Feb-
15
Mar
-15
Apr-1
5
May
-15
Jun-
15
Jul-1
5
Aug-
15
Sep-
15
Oct
-15
Nov
-15
Fertilizer price in Vietnam
Phu My Urea DAP Canada Potash
0100200300400500600700800900
Dec
-14
Jan-
15
Feb-
15M
ar-1
5
Apr-1
5
May
-15
Jun-
15
Jul-1
5
Aug-
15
Sep-
15
Oct
-15
Nov
-15
Dec
-15
Global fertilizer price (USD/ton)
China urea Canada Potash
China DAP

B S C R E S E A R C H Vietnam Sector Outlook 2016 Part 1
63 // www.bsc.com.vn
Source: BSC’s research, Bloomberg
Exemption from Value Added Tax for fertilizer products created difficulties for fertilizer businesses:
Since Jan 1st 2015, fertilizer products were not be subject to VAT from the import stage to production and
commerce stage, instead of the 5% VAT rate as before. With the tax exemption, companies that
manufacture and trade fertilizers were unable to deduct VAT for input costs, such as electricity, coal,
additives, enclosure, sales and management cost... Estimated non-deductible tax expense of LAS and
DPM were respectively about VND 100 billion and VND 400 billion in 2015.
Many fertilizer production companies were securitized and listed: in 2015, many companies that
manufacture and trade fertilizers conducted equitization and became listed, which expanded the scale and
increased the diversity of fertilizer sector on the stock market. There were many large companies such as
Ca Mau fertilizer, Binh Dien fertilizer, and 4 subsidiaries of DPM including JSC fertilizers and petroleum
chemical Southeast, Southwest, Central and Northern.
Disappointing business results of listed fertilizer companies: For 9M2015, the majority of listed
fertilizer businesses reported disappointing results, due to the reduction in fertilizer price and the increase
in input cost caused by the non-deductible VAT. However, DPM achieved a strong growth in profits thanks
to the decline in gas prices as a result of low oil prices. QBS business result was positive thanks to the
increase in sales volume.
0
1
2
3
4
5
6
Jan-
15
Feb-
15
Mar
-15
Apr-1
5
May
-15
Jun-
15
Jul-1
5
Aug-
15
Sep-
15
Oct
-15
Nov
-15
Dec
-15
The input price of gas for DPM (USD/mmbtu)
0
20
40
60
80
100
120
140
160
180
200
Jan-
15
Feb-
15
Mar
-15
Apr-1
5
May
-15
Jun-
15
Jul-1
5
Aug-
15
Sep-
15
Oct
-15
Nov
-15
Dec
-15
Vancover sulphur price (USD/ton)

B S C R E S E A R C H
Vietnam Sector Outlook 2016 Part 1
www.bsc.com.vn // 64
Main products Revenue 9M2015 %y.o.y
Profit after tax 2015
%y.o.y Gross margin 9M 2015
Gross margin 9M 2014
P/E P/B
DPM Ure 7,470 5% 1203 24% 31.59% 25.72% 8.98 1.31
BFC NPK 4,711 -6% 201 -6% 12.05% 10.03% 4.91 1.50
DCM Ure 3,950 466 32.34% 8.08 1.19
LAS NPK, phosphate 3,486 -7% 203 -15% 23.81% 18.31% 5.57 1.66
QBS Commerce 2,755 77% 70 17% 3.62% 7.51% 3.69 0.90
PSE Commerce 2,019 -7% 20 -9% 4.04% 3.74% 4.99 0.93
PCE Commerce 1,898 1% 16 -45% 3.36% 3.94% 3.53 0.82
PSW Commerce 1,879 10% 22 -8% 3.17% 3.22% 5.49 1.19
SFG NPK, phosphate 1,786 0% 75 -9% 10.40% 12.64% 6.00 1.02
PMB Commerce 1,146 13% 22 0% 5.22% 5.45% 5.69 1.30
VAF phosphate 895 0% 56 -7% 24.36% 20.07%
NFC phosphate 398 -22% 14 -48% 20.23% 22.16% 6.50 1.08
Source: BSC Research

B S C R E S E A R C H Vietnam Sector Outlook 2016 Part 1
65 // www.bsc.com.vn
Sugar Sector Situation in the crop 2014/15 [Signs of recovery] • Size of the world sugar surplus reduced 81% compared to the previous crop, inventories were large.
• World sugar prices continued the downward trend, down 11.7% compared to the previous crop.
• The domestic oversupply reduced by 38% compared to the previous crop, inventories were still high.
• The average domestic sugar prices fell slightly, by 9.15% with RS sugar and 3.5% with RE sugar.
• Two merger deals: SEC merged into SBT, NHS merged into BHS.
• Business results of listed sugar companies were mostly positive.
World sugar market
Supply continued to exceed demand but the scale was down from the previous crop, high inventories: In the crop 2014/2015 (T7/2014- T6/2015), total production in the world reached about 172.5
million tons (-1.5% yoy), while total consumption reached about 171.0 million tons (+ 2.2% yoy). Thus, the
excess supply was about 1.46 million tons, down 81% from 7.73 million tons of surplus in the crop 2013/14.
Inventory reduced to 42.2 million tons in the end of the crop 2014/15.
World sugar prices for the crop 2014/15 continued the downward trend from the previous crops: world sugar prices continued to fall from the average of 18.84 cents/pound in the crop 2013/14 to 16.64
cents/pound in the 2014/15 (- 11.7%) due to (1) the supply still exceeded demand, particularly in two most
exporting countries India and Brazil, Thailand (2) Brazil is the largest sugar exporter, in 2015 the Real -
Brazilian currency - devalued sharply against the dollar, which increased the supply (sugar prices are listed
in dollars) (3) India, the 2nd largest sugar producer in the world after Brazil encourage exports with the
provisions that manufacturers must spend at least 4 million tons of sugar for export,, making sugar supplies
increase.
Total supply and demand of sugar worldwide in the period 2010-2015
World raw sugar prices in the period 2010-2015
0
50
100
150
200
2010/11 2011/12 2012/13 2013/14 2014/15
mil tons
Supply Demand Inventory
0
5
10
15
20
25
30
35
40
06/1
009
/10
12/1
003
/11
06/1
109
/11
12/1
103
/12
06/1
209
/12
12/1
203
/13
06/1
309
/13
12/1
303
/14
06/1
409
/14
12/1
403
/15
06/1
509
/15
cent/pound
Last Price MA (200)

B S C R E S E A R C H
Vietnam Sector Outlook 2016 Part 1
www.bsc.com.vn // 66
Source: USDA, BSC Source: Bloomberg, BSC
Domestic sugar market
Total supply were greater than total demand at reducing surplus, while inventories were still large:
During the crop 2014/15, 41 domestic sugar factories with a design capacity of 105,000 ton of sugarcane
per day (+ 7.1% yoy) produces 1.42 million tons of sugar (-10.8% yoy), in which 700,000 tons were refined
sugar (-6.7%) since the areas of sugarcane reduced by 4,400ha to 305,000 ha (-1.4%) although the
average sugarcane production increased slightly to 65.3 tons/ha (+1%). Sugar imported under the quota
were 81,000 tons. Thus, the total sugar supply in 2014/15 was approximately 1.5 million tons. Meanwhile,
domestic demand approximately was 1.40 million tons, including 70,000 tons for export. Thus, excess
supply was 100,000 tons, down 38% compared to the previous crop. Inventories as of 15 June 2015 was
about 389,000 tons, still high but fell by 160,000 tons compared to the previous crop (-29%).
The average sugar prices in the crop 2014/15 continued to decline slightly compared to the previous crop. Namely, RS sugar wholesale price was at 12,780 VND/kg, down 9.15% and the RE price was at
14,240 VND/kg, down 3.5% compared to previous season. However, those prices were still more than 1.5
times the global sugar price. The reason is domestic production cost is higher than the cost in other
countries due to (1) The yield of sugarcane in Vietnam belongs to the lowest group in the world with 5.5
tons/ha, while Thailand reaches 7.1 tons/ha, Brazil is approximately 8.1 tons/ha; (2) The low level of
mechanization, only about 10-20% compared to 80-90% of the world's major producers (3) Small production
with average capacity of a plant is 3,250 tons sugarcane per day, much lower than 7,000- 8,000 tons
sugarcane per day of a factory in Thailand, India, Brazil; and (4) Recovery of valuable by-products from
sugarcane has not been properly exploited.
Domestic sugar supply and demand in the crop year 2014/15
Domestic wholesale price of sugar in the crop year 2012/13 - 2014/15
Source: Sugarcane Research Institiutue, BSC Source: Sugarcane Research Institiutue, BSC
0
500
1000
1500
2000
1,000 tons
0
5
10
15
201,000 VND/kg
RS RE

B S C R E S E A R C H Vietnam Sector Outlook 2016 Part 1
67 // www.bsc.com.vn
Two large merger deals took place in 2015 in the sector were SEC merged into SBT and NHS merged into BHS. In 2015, SBT completed the share exchange at the ratio of SBT: SEC = 1: 1.05 to bring SEC a
subsidiary 100% owned by SBT. Charter capital of SBT then increased by 25% to VND 1,856 billion,
becoming the largest capitalization and production resources enterprise in the sugar sector. In 2015, BHS
also issue shares at ratio of 1: 1 for the swap acquisition of 100% NHS, to increase raw materials and
expand production scale.
Reviewed earnings of listed sugar companies
By the end of 3Q 2015, the entire six sugar companies listed on the market are profitable, better than 3Q
2014 with just 5/6 enterprises being profitable (except KTS).
In 9M2015, Net sales of SBT decreased slightly by 1.3%, of LSS decreased 10% compared to the same
period in 2014 due to reduced sugarcane production. Meanwhile, Net revenues of SLS surged 50%, of
BHS increased 20.56% compared to 9M2014.
Gross margin generally have improved compared to the same period last year, partly due to domestic sugar
prices rose slightly. Notably, SLS had the highest gross profit margin of 16.4%, nearly twice the 8.78% in
2014; KTS had gross margin of 14%, 3 times the 4.7% margin in 9M2014. BHS and SBT had the gross
profit margin improved from 9.1% and 12% respectively in 2014 to 12% and 15.7% in 2015. Except LSS
had gross profit margin decreased from 14.5% to 12.2% partly due to increasing sugar production from raw
sugar which had low gross margins.
Ticker Total asset 9M2015
Net sales
9M2015
% of Net sales 9M2015 Closed price 31/12/15
EPS T12M BVPS PE PB ROE ROA Gross
profit Interest cost
Selling expense
Admin expense
Net income
SBT 5,273 1,737 16% 3% 3% 3% 10% 24,100 1,277 13,654 18.87 1.77 7% 3%
BHS 2,461 2,704 12% 2% 3% 4% 4% 19,500 1,718 7,701 11.35 2.53 10% 4%
SLS 271 516 16% 0% 1% 2% 7% 51,500 9,969 32,265 5.17 1.60 33% 27%
LSS 2,369 1,090 12% 3% 3% 3% 3% 9,000 409 21,113 22.00 0.43 2% 1%
KTS 140 203 14% 3% 1% 5% 6% 15,500 2,320 25,049 6.68 0.62 9% 8%
Source: Financial statement of the businesses, BSC collected
Note: The unit of Total asset and Net sales – bil dong

B S C R E S E A R C H
Vietnam Sector Outlook 2016 Part 1
www.bsc.com.vn // 68
Marine Transportation Sector 2015 [Negative] • World marine transportation experienced difficulties because of slowdown in demand from China
• USD appreciation had strong negative impact on listed marine transportation companies
• Business results remained grey prospects.
BDI index reached the lowest ever bottom. In order to maintain profitability, BDI index should remain at
2,000 points. However, till 4th Dec 2015, closing BDI index stood at 563. We believe the main reasons are
(1) demand of bulk cargo shipping decreased as a result of slowdown in Chinese’s production and imports
( which is the leading importer of iron ore (50%), coal (25%) and minerals). 8M2015, Chinese coal imported
fell by 31% compared with 2014. Iron ore trade also witnessed the slowest growth since 2001 due to
reduction in steel production. (2) Dry bulk ship supply continued to rise. Total newbuilding ship tonnage
reached 23.8 million DWT while removed ship tonnage was only 23.8 million DWT, corresponding to 2.1%
growth.
BCTI index increased fast. 3rd Oct 2015, BDTI index stood at 745 (+15%yoy). Low oil price helped
increase demand since countries, especially China, increased oil purchase for reserves, in addition with
reducing input costs for tanker cargo fleets in the world.
BDI index BCTI index
Source: Bloomberg
Transported goods witnessed high growth while total revenue fell sharply. 9M2015, marine
transportation goods reach 21.4 mil tonnages (+104%yoy), domestic transportation increase by 8-10% yoy
in which all 34 container ships were put in use. However, sector’s revenue only stood at VND 13,227 bil (-
21%yoy) due to falling freight rates.
0
200
400
600
800
1000
1200
1400
0
200
400
600
800
1000
1200

B S C R E S E A R C H Vietnam Sector Outlook 2016 Part 1
69 // www.bsc.com.vn
Tanker fleets benefited from Dung Quat oil refinery expansion. Oil production increased is an important
source of demand as fleets mostly have term contracts with Dung Quat refinery. 80% of tanker fleet were
estimated to be put into operation thanks to Dung Quat production expansion to 6.8 million tonnages of oil
(+25%yoy).
Domestic marine transportation companies accounted for only 10% of market share, 12% for dry
bulk, 8% for container and 8% for tankers. Vietnam marine fleets mainly transport goods to China, South
East Asia and some Asia countries, leaving big market such as US or EU for foreign firms. The main
reasons should be (1) Buy FOB sell FOB Vietnamese’s commercial custom. (2) Asynchronous fleet with
lion share of small and dry bulk fleet, resulting limitation on transporting in long distance. 6M2015, Vietnam
had 1,809 marine ships in which 1,200 bulk carriers, 33 container ships, 165 chemical ships and only 500
ships operated in long-distance routes. (3) lacks of connection between logistics chain elements, causing
shortages of goods transported when demand still remained.
Business result 9M2015.
9M2015, listed companies’ business result witness diversification. While oil and gas transport
companies had rapid revenue growth such as SKG, GSP thanks to stable term contracts, increased in
Dung Quat production and low foreign loan outstanding, most dry bulk company and trip contracts
witnessed decrease in revenue and profit due to slowdown of Chinese economy and 5% appreciation of
USD.
Business result 9M2015
Ticker Core business Rev Gross profit margin PAT
P/E P/B 9M2015 %yoy 9M2015 9M2014 9M2015 %yoy
PVT Tanker 4,043,381 4% 7% 6% 252 -12% 7.89 0.82
VTO Tanker 997,211 -14% 2% 4% 30 -26% 12.41 0.49
PJT Tanker 288,982 4% 7% 3% 16 48% 5.46 0.71 GSP Tanker ( LPG) 756,334 6% 10% 7% 60 64% 8.3 1.05
VIP Tanker , real estate, oil commercial
432,843 -18% 8% 6% 30 25% 3.63 0.56
SKG Passenger 236,770 38% 60% 48% 137 73% 13 4.23
TJC Dry bulk 149,781 -12% 8% 4% 12 -25% 4.89 0.61
VFR Ship leases 280,907 -35% -1% -3% -3 N/A N/A 0.88
VNA Dry bulk 468,749 -12% -15% -9% -58 N/A N/A 0.36
VOS Dry bulk 1,233,139 -29% -23% -9% -273 N/A 5.55 0.47 HTV Dry bulk 151,507 4% 17% 10% 21 108% 5.78 0.53
TCO Dry bulk 130,134 -8% 16% 14% 19 13% 7.3 0.91
Average 8% 7% 7.42 0.97
Source: BSC Research

B S C R E S E A R C H
Vietnam Sector Outlook 2016 Part 1
www.bsc.com.vn // 70
Natural Rubber Sector 2015 [Difficult] • Global supply of natural rubber declined slightly by 0.9% yoy; global demand for rubber grew by
1.8% in 2015
• Rubber price plummeted during the second half of 2015 to the lowest level since 2008
• Vietnam rubber export volume increased by 7.4% yoy for 11M2015, but export value declined by -
12.9% yoy
• Vietnam rubber export price continues to fall, with the 2015 average price decreased by -21% yoy
• Business results of listed companies declined in 9M2015
The global rubber industry - Difficult
Rubber supply fell slightly. In the 10M2015, rubber production of the Association of Natural Rubber
production (ANRPC), which represents 92% of global rubber output, fell by 0.9% yoy. Influential factors
include:
• Policies to control supply of ITRC (International Tripartite Rubber Council) including Thailand,
Indonesia and Malaysia, providing 70% of global rubber output. Specifically: (1) adjust rubber export
volume to reach a reasonable rubber price (2) Cut down rubber trees outside of state plan and (3)
strengthen domestic rubber consumption, which was up 5.9 % yoy in 2015 in IRTC countries.
• Rubber farmers cut down their trees: The unfavorable weather, and rubber prices remaining at low
level for several years caused many people in India and Indonesia (30% of the output supply of rubber
in the world) to cut down rubber trees. For the 2015 harvest season, the estimated rubber production of
these two countries fell respectively -13.4% yoy and -10% yoy.
Source: IRSG, Bloomberg
The growth of rubber demand slowed down to 1.8% in 2015, according to forecasts of IRGS, which was
significantly lower than the 6.7% growth of 2014 due to the decrease in China consumption and the low oil
price. China, the country consumes 40% of the total rubber production, had imported 2,172 tons of natural
-
1,000
2,000
3,000
4,000
-
5,000
10,000
15,000
'10 '11 '12 '13 '14 '15 - 1H
Trend of rubber supply-demand in the world
production ( mil tons)consumption ( mil tons)Rubber stock ( Mil tons - right axis)
90110130150170190210230
Jan-
13M
ar-1
3
May
-13
Jul-1
3
Sep-
13
Nov
-13
Jan-
14M
ar-1
4
May
-14
Jul-1
4
Sep-
14
Nov
-14
Jan-
15M
ar-1
5
May
-15
Jul-1
5
Sep-
15
Nov
-15
Global RSS3 price ( $/ton)

B S C R E S E A R C H Vietnam Sector Outlook 2016 Part 1
71 // www.bsc.com.vn
rubber in 10T2015, up 3% yoy, significantly lower than the average increase 12.04% / year from 2010-
2014. Besides, the oil price has reduced cost production of synthetic rubber, a substitute product of natural
rubber in many areas. In 2015, the synthetic rubber price decrease led to a 35% yoy increase in the
consumption of synthetic rubber in China, indirectly reducing demand for natural rubber.
Rubber prices recovered slightly in the first half of 2015, before falling to the lowest level in 6 years. The measures to regulate supply of IRTC in Nov 2014 helped restore the rubber prices in the first months
of 2015 to $141 per ton, up 12.4% compared with 2014 year-end. In the second half of 2015, a decline in
Chinese demand, along with the falling crude oil prices in the last 6 months caused a sharp fall in rubber
prices, currently at $95 per ton.
Vietnam natural rubber sector 2015 – Difficult
Volume of rubber export increased, but the value dropped: According to preliminary statistics of the
General Administration of Customs, exports of natural rubber in 11M2015 was estimated at 1.02 Million
tonnes (+ 7.4% yoy), equivalent to VND 1.4 billion (-12.9% yoy), due to rubber export prices decreased on
average by 21% yoy. Export volume in Vietnam contributes about 80-85% of the total national consumption
of rubber. Volume of rubber exports grew by 23% yoy in 2015H1 due to the decrease in global supply in
this period (-2.5% yoy). However, volume of rubber export fell slightly by -2% yoy in the second half due to
(1) Export activities to China was disruppted the first half of August due Quang Ninh floods and (2) Low
crude oil price for 2015H2 increased synthetic rubber demand, thereby reduced the demand of natural
rubber.
0
50
100
150
200
250
-10
10
30
50
70
90
110
130
150
Jan Feb Mar Apr May Jun Jul Aug Sep Oct Nov Dec
Rubber export of Vietnam
Export volume 2015 - Thousand tonsExport volume 2014 - thousand tonsexport value 2015 ($ bil) - right axisexport value 2014 ( $bil) - right axis
1.20 1.30 1.40 1.50 1.60 1.70 1.80 1.90 2.00 2.10 2.20
Average export price of rubber ( $/kg)
Source: Bloomberg

B S C R E S E A R C H
Vietnam Sector Outlook 2016 Part 1
www.bsc.com.vn // 72
Domestic supplies remain high. According to the Ministry of Agriculture and Rural Development, in 2014-
2015, Vietnam has more than 6,000 hectares cut down under the pressure of low prices. However, the
cutout area occupied only 0.6% of the total rubber plant area in Vietnam, which is currently at 977,000
hectares. Rubber plant area in Vietnam is actually 20% higher than the state’s projected area for the period
2015-2020.
Export price of rubber has recovered during 2015H1, before falling since August. The volume of
exports increased in the first half has help rubber prices recovered slightly from an average of $1.41 / kg
early on $ 1.51 / kg in the month 6/2015 (+7%). However, the impact of low oil prices in 2015H2 caused a
deep fall in rubber price to the bottom level in 6 years. At an average of 11 months of the year, rubber prices
of $ 1.4 / kg (-21% yoy).
Source: BSC Research
China continued to be the largest export market of Vietnam rubber. The volume of exports to China in
10M2015 reached 374.7 tons (+25% yoy). Exports to the US also achieved a good growth of 17% yoy. The
remaining countries such as Malaysia, India and Germany show decline in volume, respectively -12%, -8%
and -5%.
Operating results of natural rubber enterprises are declining, under the impact of falling rubber prices.
Only TNC recorded good profit growth, but thanks to contribution from the liquidation of rubber trees.
Ticker Revenue
9T2015 (VND Bil)
% yoy PBT 9T2015 (VND Bil) %yoy Main
products Notes
TNC 64.5 32.7% 19.0 34.3% SVR3L, SVR5, RSS
Good growth in revenue thanks to the cashew operations. Rubber related revenue declined by 2% yoy. Profit from rubber tree liquidation contributed VND 27.5 Bil, while core business yielded a loss of VND 2.4 Bil
TRC 244.3 -28.7% 36.3 -68.8% Latex Gross margin declined due to decrease in rubber price
China48%
Malaysia16%
India8%
Germany3%
South Korea3%
USA3% Others,
16.5%
The main export market of Vietnam 10M2015

B S C R E S E A R C H Vietnam Sector Outlook 2016 Part 1
73 // www.bsc.com.vn
DPR 496.8 -23.0% 176.2 -2.2% SVR 3L;SVR 10; latex
Profit from rubber tree liquidation contributed 88% total profit. Profit from core business declined by -50%
HRC 58.2 -52.2% 37.1 -20.8% SVR 3L; SVR 10
PHR 834.0 -26.0% 82.4 -58.9% CV50, CV 60, CVR
Source: BSC Research

B S C R E S E A R C H Vietnam Sector Outlook 2016 Part 1
Disclaimer The information, statements, forecasts and projections contained herein, including any expression of opinion, are based upon sources believed to be reliable but their accuracy completeness or correctness are not guaranteed. Expressions of opinion herein were arrived at after due and careful consideration and they were based upon the best information then known to us, and in our opinion are fair and reasonable in the circumstances prevailing at the time. Expressions of opinion contained herein are subject to change without notice. This document is not, and should not be construed as, an offer or the solicitation of an offer to buy or sell any securities. BSC and other companies in the BSC and/or their officers, directors and employees may have positions and may affect transactions in securities of companies mentioned herein and may also perform or seek to perform investment banking services for these companies. This document is for private circulation only and is not for publication in the press or elsewhere. BSC accepts no liability whatsoever for any direct or consequential loss arising from any use of this document or its content. The use of any information, statements forecasts and projections contained herein shall be at the sole discretion and risk of the user. No part of this material may be (i) copied, photocopied or duplicated in any form by any mean or (ii) redistributed without the prior written consent of BIDV Securities Company (BSC).
Le Thi Hai Duong Sales & Advisory
Tel: 0439352722 (155) Email: [email protected]
Tran Thang Long Head of Research
Tel: 0439352722 (118) [email protected]
EQUITY ANALYSTS
Luong Thu Huong Steel, Cement, Tiles, Technology
[email protected] Nguyen Hong Ha
Real Estate, Construction [email protected]
Le Thi Trang Textile, Sugar, Dairy [email protected]
Tran Thi Hong Tuoi Banking, Pharmaceutical,
Plastic, Tire [email protected] Chu Tuan Phong
Seaport, Marine Transport, Aquaculture
Vu Thu Ha Oil & Gas, Fertilizer, Power
[email protected] Nguyen Bao Hoang Le
Insurance, Automobile, Rubber [email protected]
CONTACT
BSC Head Office 10th, 11th Floor – BIDV Tower
35 Hang VoiStr – Hanoi Tel: 84 4 39352722 Fax: 84 4 22200669
Website: www.bsc.com.vn
BSC Ho Chi Minh Branch 9th Floor – 146 Nguyen Cong Tru Str.
District 1, Ho Chi Minh City Tel: 84 8 3 8218885 Fax: 84 8 3 8218510
Facebook: www.facebook.com/BIDVSecurities