BS.1194-1 - System for multiplexing frequency modulation ... · rec. itu-r bs.1194-1 1...
25
Rec. ITU-R BS.1194-1 1 RECOMMENDATION ITU-R BS.1194-1 SYSTEM FOR MULTIPLEXING FREQUENCY MODULATION (FM) SOUND BROADCASTS WITH A SUB-CARRIER DATA CHANNEL HAVING A RELATIVELY LARGE TRANSMISSION CAPACITY FOR STATIONARY AND MOBILE RECEPTION (Question ITU-R 71/10) (1995-1998) Rec. ITU-R BS.1194-1 The ITU Radiocommunication Assembly, considering a) that many countries use the radio-data system (RDS) according to Recommendation ITU-R BS.643; b) that although RDS is able to accommodate many of the data services required, the data capacity is nevertheless limited; c) that it is a fundamental requirement that compatibility be achieved between FM stereophonic services including RDS and any new additional sub-carrier system; d) that a much larger data capacity may be needed for some applications; e) that sub-carrier data radio channel systems can provide a much larger capacity compared to RDS and are capable of meeting the requirement stated in § c) as regards protection ratios and interference levels; f) that high-speed data systems have already been put into operation, recommends 1 that one of the systems to be used for high capacity FM multiplex broadcasting for stationary and mobile reception is the Data Radio Channel (DARC) System, as specified in Annex 1 (see Notes 2 and 3). NOTE 1 – Tests have indicated that at certain sub-carrier amplitudes, the ability of the receivers to reject interference from adjacent channels is affected by the presence of the DARC signal on the interfering source. For example, when an interfering signal on an adjacent channel was carrying a DARC signal which deviates the main FM carrier by ± 7.5 kHz, as well as an RDS signal which deviates the main FM carrier by ± 3 kHz, the required level of C/I for the range of receivers tested increased by up to 3 dB, but this was still below the criteria given in Recommendation ITU-R BS.412. In the case of high injection levels, attention will need to be paid to levels of deviation of sub-carriers to ensure conformance with protection ratios on which service planning is based. Information regarding the operational characteristics of DARC is given in Annex 2. NOTE 2 – Within the ITU-R extensive work is going on in the field of data services in FM broadcasting. Draft new Recommendation ITU-R BS.1350 specifying the system requirements will assist broadcasters in evaluating how to meet their service requirements with the available high-speed data systems. NOTE 3 – Several additional high-speed data sub-carrier systems (such as HSDS and STIC systems) are already in use or under development in several countries, meeting different service requirements.
Transcript of BS.1194-1 - System for multiplexing frequency modulation ... · rec. itu-r bs.1194-1 1...
Rec. ITU-R BS.1194-1 1
RECOMMENDATION ITU-R BS.1194-1
SYSTEM FOR MULTIPLEXING FREQUENCY MODULATION (FM) SOUNDBROADCASTS WITH A SUB-CARRIER DATA CHANNEL HAVING
A RELATIVELY LARGE TRANSMISSION CAPACITYFOR STATIONARY AND MOBILE RECEPTION
(Question ITU-R 71/10)
(1995-1998)
Rec. ITU-R BS.1194-1
The ITU Radiocommunication Assembly,
considering
a) that many countries use the radio-data system (RDS) according to Recommendation ITU-R BS.643;
b) that although RDS is able to accommodate many of the data services required, the data capacity is neverthelesslimited;
c) that it is a fundamental requirement that compatibility be achieved between FM stereophonic servicesincluding RDS and any new additional sub-carrier system;
d) that a much larger data capacity may be needed for some applications;
e) that sub-carrier data radio channel systems can provide a much larger capacity compared to RDS and arecapable of meeting the requirement stated in § c) as regards protection ratios and interference levels;
f) that high-speed data systems have already been put into operation,
recommends
1 that one of the systems to be used for high capacity FM multiplex broadcasting for stationary and mobilereception is the Data Radio Channel (DARC) System, as specified in Annex 1 (see Notes 2 and 3).
NOTE 1 – Tests have indicated that at certain sub-carrier amplitudes, the ability of the receivers to reject interferencefrom adjacent channels is affected by the presence of the DARC signal on the interfering source. For example, when aninterfering signal on an adjacent channel was carrying a DARC signal which deviates the main FM carrier by ± 7.5 kHz,as well as an RDS signal which deviates the main FM carrier by ± 3 kHz, the required level of C/I for the range ofreceivers tested increased by up to 3 dB, but this was still below the criteria given in Recommendation ITU-R BS.412. Inthe case of high injection levels, attention will need to be paid to levels of deviation of sub-carriers to ensureconformance with protection ratios on which service planning is based.
Information regarding the operational characteristics of DARC is given in Annex 2.
NOTE 2 – Within the ITU-R extensive work is going on in the field of data services in FM broadcasting. Draft newRecommendation ITU-R BS.1350 specifying the system requirements will assist broadcasters in evaluating how to meettheir service requirements with the available high-speed data systems.
NOTE 3 – Several additional high-speed data sub-carrier systems (such as HSDS and STIC systems) are already in useor under development in several countries, meeting different service requirements.

2 Rec. ITU-R BS.1194-1
ANNEX 1
Specifications of the data radio channel (DARC)
1 Modulation characteristics (physical layer)
1.1 Sub-carrier frequency
The sub-carrier frequency is 76 kHz locked in phase to the fourth harmonic and, in the case of stereophonic services, isof pilot tone.
The frequency tolerance shall be within 76 kHz ± 7.6 Hz (0.01%) and the phase difference shall not exceed ± 5° for thephase of pilot tone.
1.2 Method of modulation
Level-controlled minimum shift keying (LMSK) modulation is used with a spectrum shaping according to Fig. 1. LMSKis a form of MSK in which the amplitude is controlled by stereo sound signals of left minus right. A frequency of 76kHz + 4 kHz is used when the input data is 1 and 76 kHz - 4 kHz is used when the input data is 0.
1194-01
– 80
– 60
– 40
– 20
0
20
50 60 70 80 90 100
56 58 64 88 94 97
0.5
– 0.5
FIGURE 1
Spectrum-shaping filter
Baseband frequency (kHz)
Rel
ativ
e am
plitu
de (d
B)
Lower bound
Upper bound
1.3 Bit rate
The bit rate is 16 kbit/s ± 1.6 bit/s.
1.4 Sub-carrier level
The sub-carrier level is varied depending on the level of the stereo L-R signals (see Fig. 2). If the deviation of the mainFM carrier when modulated by the stereo L-R signals is less than 2.5%, the sub-carrier is deviated by 4% (± 3 kHz) ofthe main FM carrier. If the deviation of the main FM carrier when modulated by the stereo L-R signals is more than 5%,the sub-carrier is deviated by up to 10% (± 7.5 kHz) of the main carrier. Between these limits the deviation has a linearrelation.

Rec. ITU-R BS.1194-1 3
0
5
10
0 1 2 3 4 5 6 7 8
FIGURE 2
Sub-carrier deviation
Inje
ctio
n le
vel (
%)
Deviation of left-rightstereo sound (%) D02
2 Frame structure (data link)
2.1 General features
The largest element of the structure is called a “frame” and consists normally of 78 336 bits in total, organized as190 information blocks of 288 bits each and 82 parity blocks of 288 bits each.
An information block comprises a block identification code (BIC) of 16 bits, information of 176 bits, a cyclicredundancy check (CRC) of 14 bits and parity of 82 bits.
A parity block comprises a BIC of 16 bits and parity of 272 bits.
There are four different types of BIC (see Table 1) to generate block synchronization and frame synchronization.
There are three methods to organize data, methods A and B, which both use product coding (272,190) × (272,190) andmethod C that uses only block code (272,190).
All three methods are identified and distinguished by the sequence of BICs.
TABLE 1
Block identification code (BIC)
2.2 Method A
This method limits the transmission delay on the transmitter side. In method A the frame (called Frame A) consistsnormally of 190 information blocks followed by 82 parity blocks (see Fig. 3) but, for services with strong demand forreal-time transmission it is possible to insert 12 additional information blocks (block coded only) among the parityblocks in the product coded frame.
BIC1 0001 0011 0101 1110
BIC2 0111 0100 1010 0110
BIC3 1010 0111 1001 0001
BIC4 1100 1000 0111 0101

4 Rec. ITU-R BS.1194-1
The 12 inserted blocks are not a part of the product coded frame. They are placed at fixed positions, four blocks at a timeat three positions (see Fig. 4). The first four blocks are placed after 20 parity blocks, the next four after another 21 parityblocks and the last four blocks after another 21 blocks.
The block identification code (BIC) for the inserted blocks is BIC2. The receiver extracts such blocks and decodes themimmediately.
CRC
FIGURE 3
Frame according to method A, without insertion of real-time blocks
BIC3
BIC2
BIC1
BIC4
60blocks
70blocks
82blocks
60blocks
Information
Information
InformationHorizontal
parity
Vertical parity
D03
2.3 Method B
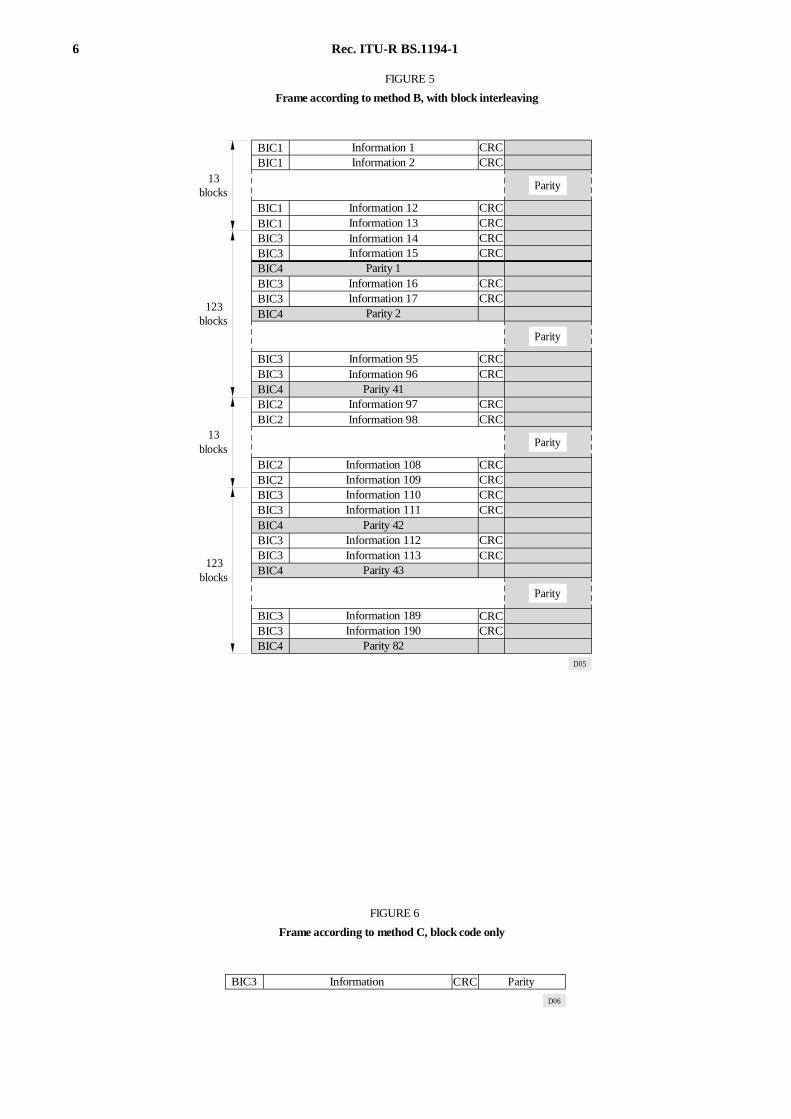
To allow an almost uniform transmission during the whole frame (called Frame B), the parity blocks are interleaved withthe information blocks (see Fig. 5). This method causes a delay (about 5 s) on the transmitter side.
2.4 Method C
Method C comprises only information blocks of 288 bits. BIC3 is used within this method. This method is intended forservices with a strong demand for real-time transmission, but at a lower level of error protection, e.g. for real-timeservices, stationary reception or repetitive information.
2.5 Error correction code
A product code (272,190) × (272,190) is used for the frame in methods A and B to enable the receiver/decoder to detectand correct errors which occur in reception. A block code (272,190) code is used for method C.
The (272,190) code is a shortened majority logic decodable difference set cyclic code. The generator polynomial forthe (272,190) is given by:
g(x) = x82 + x77+ x76 + x71 + x67 + x66 + x56 + x52 + x48 + x40 + x36 + x34 + x24 + x22 + x18 + x10 + x4 + 1
2.6 Error detection
14 bits of CRC are used to enable the receiver/decoder to detect errors. From the 176 information bits, a CRC iscalculated using the generator polynomial:
g(x) = x14 + x11 + x2 + 1

Rec. ITU-R BS.1194-1 5
CRC
CRC
CRC
CRC
Vertical parity
FIGURE 4
Frame according to method A, with static insertion of real-time blocks
60blocks
70blocks
60blocks
82+12
blocks
Information
Information
InformationHorizontal
parity
BIC2 ParityReal time information blocks
BIC2 ParityReal time information blocks
BIC2 ParityReal time information blocks
BIC4
BIC4
Vertical parity
BIC4Vertical parity
BIC4Vertical parity
BIC3
BIC2
BIC1
D04
2.7 Scrambling
To avoid restrictions on the data input format and to spread the modulation spectrum, data should be scrambled by thepseudo-noise (PN) sequence specified by:
g(x) = x9 + x4 + 1
6 Rec. ITU-R BS.1194-1
CRCCRC
CRCCRCCRCCRC
CRCCRC
CRCCRC
CRCCRC
CRCCRCCRCCRC
CRCCRC
CRCCRC
FIGURE 5
Frame according to method B, with block interleaving
13blocks
123blocks
123blocks
13blocks
Information 1Information 2
Information 12Information 13Information 14Information 15
Parity 1Information 16Information 17
Parity 2
Information 95Information 96
Parity 41Information 97Information 98
Information 108Information 109Information 110Information 111
Parity 42Information 112Information 113
Parity 43
Information 189Information 190
Parity 82
BIC1BIC1
BIC1BIC1BIC3BIC3BIC4BIC3BIC3BIC4
BIC3BIC3BIC4BIC2BIC2
BIC2BIC2BIC3BIC3BIC4BIC3BIC3BIC4
BIC3BIC3BIC4
Parity
Parity
Parity
Parity
D05
CRC
FIGURE 6
Frame according to method C, block code only
BIC3 ParityInformation
D06

Rec. ITU-R BS.1194-1 7
ANNEX 2
Operational characteristics of the data radio channel (DARC)
1 Transmission characteristics
1.1 Laboratory transmission tests
Laboratory transmission experiments of bit error rate (BER) characteristics against random noise and multipath fadingwere conducted.
Figure 7 shows BER characteristics in relation to receiver input voltage. It can be seen from the figure that errorcorrection eliminates bit errors where the receiver input voltage is 16 dBµV orabove.
Figure 8 indicates BER characteristics under fading distortion. Without error correction, the error rate does not comebelow 1 × 10⁻³ even if the receiver input voltage is increased. The use of error correction will enable the BER to be keptto an adequately low level for input voltages above 27 dBµV.
15 20 25
10– 1
10– 2
10– 3
10– 4
10– 5
10– 6
2
5
2
5
2
5
2
5
2
5
2
Before error correction
After error correction
Receiver input voltage (dBµV)
FIGURE 7
Bit error characteristics for random noise
BE
R
D07
1.2 Field transmission tests
Figure 9 shows the correct reception time rates for mobile reception. When a page is made up of one packet, a time rateof 90% or over can be secured by using DARC Frame C shown in Fig. 6. When a page is formed with 250 packets(8 500 bytes), DARC Frames A and B would ensure a correct reception time rate of about 85%.

8 Rec. ITU-R BS.1194-1
20 30 40 50
10– 1
10– 2
10– 3
10– 4
2
5
2
5
2
5
Before error correction
After error correction
FIGURE 8
Bit error characteristics for fading distortion
BE
R
Receiver input voltage (dBµV)
Fading frequency:Multipath D/U:Delay time:
3.3 Hz10 dB5 µs D08
0
20
40
60
80
100
1 102102 5 2 5 2
FIGURE 9
Effect of error correction code in the FM service area
Cor
rect
rece
ptio
n tim
e ra
te (
%)
Number of packets per one page
No coding
Frame C
Frames A and B
D09

Rec. ITU-R BS.1194-1 9
2 Compatibility with stereo sound broadcasting
2.1 Questionnaire survey
Compatibility with stereo sound broadcasting is important in deciding the multiplexing level of multiplex signals. A mailquestionnaire survey of more than 2 000 persons was conducted by changing the multiplexing level of the LMSK signalswhich was experimentally multiplexed with the stereo sound signals. Speech and piano music were used as stereo soundsignals.
Table 2 shows the results of the survey in terms of percentage of receivers out of the total number of answers, whichshowed a quality impairment of two grades as a function of six multiplexing levels.
TABLE 2
The number and percentage of impaired receiversas a function of the multiplexing level
The questionnaire survey has shown that the ratio of deteriorated receivers could be controlled at below 0.5% if theminimum multiplexing level of the LMSK was below 4%.
2.2 Subjective assessment of sound quality
The test procedure was based on Recommendation ITU-R BS.562. Three types of programme material were used,namely piano music, pop music and female speech.
Slightly more than 100 persons more or less experts on sound quality responded by listening to the test transmission intheir homes and reporting their assessment on a special form.
Figure 10 gives the main results. The assessment for eight different sub-carrier parameter combinations is shown for thethree types of programme material together. Results for three decay values and with the sub-carrier level controlcharacteristic finally chosen are shown. The outcome of the consistency test cases (without sub-carrier) is shown forcomparison as well as the results for constant sub-carrier levels 3 and 7.5 kHz.
The test has shown that a sub-carrier frequency of 76 kHz and LMSK with the sub-carrier level controlled to give a maincarrier deviation varying between 3-7.5 kHz and with a decay time of 5 ms gives the best result. The mean assessmentgrade is 4.96 on the five-grade impairment scale and the system is therefore considered to be compatible with the FMstereophonic sound-broadcasting system at VHF.
LMSK minimummultiplexing level
(%)
No.of receivers
Ratio(%)
2 7 0.31
3 7 0.31
4 10 0.44
5 14 0.61
6.5 18 0.78
10 27 1.18

10 Rec. ITU-R BS.1194-1
5
543210 0.5 1.5 2.5 3.5 4.5
4.93
4.96
4.91
4.8
4.94
4.98
4.95
FIGURE 10
Test results from subjective assessment of sound quality
Subjective assessment of sound quality
Five-grade impairment scale
Standard deviation
Mean
Subc
arrie
r mod
ulat
ion
Assessment consistency 3
Assessment consistency 2
Assessment consistency 1
L-MSK: Fix 3 kHz
L-MSK: Fix 7.5 kHz
L-MSK: 3-7.5 kHz decay 25 ms
L-MSK: 3-7.5 kHz decay 5 ms
L-MSK: 3-7.5 kHz decay 1 ms
D10
2.3 Multipath distortion
The above compatibility tests have not assessed the effects of multipath propagation. It is to be expected that suchconditions may cause some interference to the main programme signal, as well as, perhaps, the RDS signal if this istransmitted simultaneously. In such circumstances, however, the received programme signal is also expected to beimpaired by multipath distortion.
In this section, compatibility tests of the DARC signal with the main programme under condition of multipathpropagation are described.
Inter-modulation between a DARC signal and the pilot tone of 19 kHz causes interference within the audio frequencyband.
Figure 11 indicates the audio signal-to-noise ratio (S/N) ratio for various sub-carrier frequencies in which the bit rate of16 kbit/s and LMSK modulation scheme are used under the multipath condition. This figure shows that a better S/N ratiocan be obtained when the centre sub-carrier frequency is higher than 73 MHz. This result shows that the DARC has agood performance since its sub-carrier frequency is specified to 76 kHz.
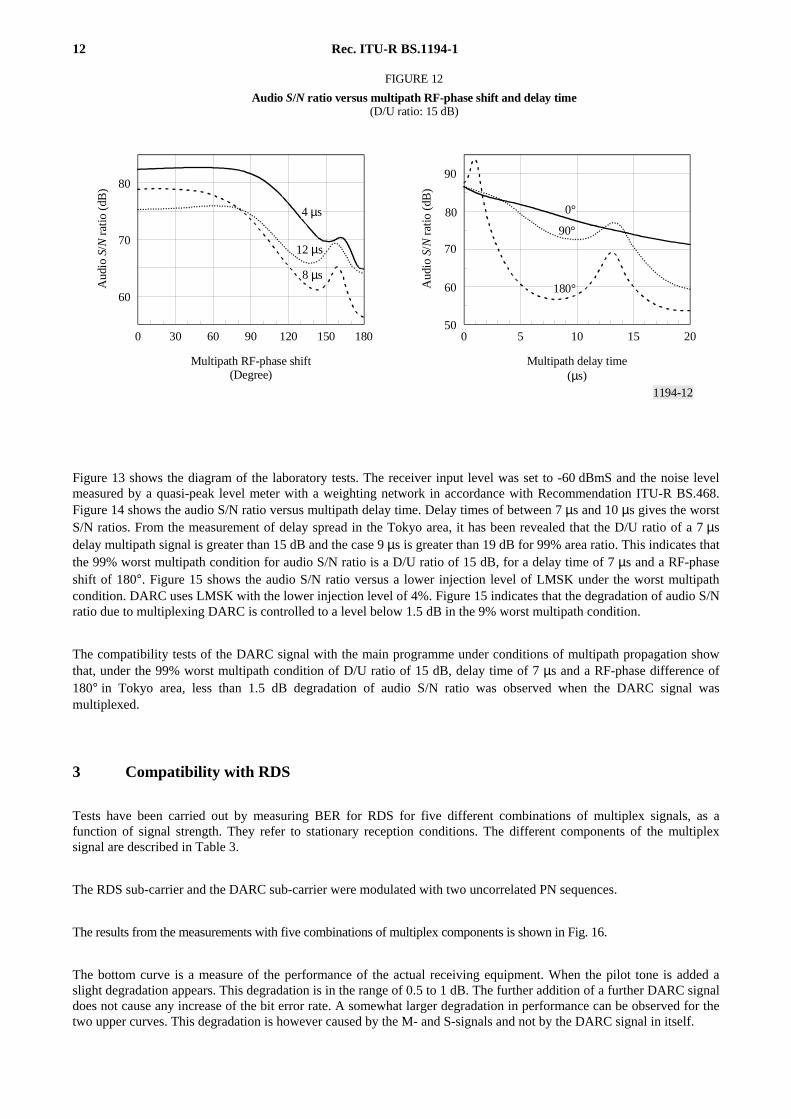
Figure 12 shows the simulation results of the audio S/N ratio. These figures indicate that the worst S/N ratio occurs at aRF-phase shift of 180° and a multipath delay time of 9 µs.

Rec. ITU-R BS.1194-1 11
1194-11
70
60
50
40
50 60 70 80 90 100
DARC
FIGURE 11
Audio S/N ratio for various sub-carrier frequencies
Subcarrier frequency (kHz)
Aud
io S
/N r
atio
(dB
)
Injection level : 4%Desired-to-undesired signal (D/U) :15 dBDelay time : 8 µsRF-phase shift : 0°, 10°, 20°, ..., 180°
12 Rec. ITU-R BS.1194-1
1194-12
0 30 60 90 120 150 180 0 5 10 15 20
80
70
60
90
80
70
60
50
4 µs
8 µs
12 µs
0°
90°
180°
FIGURE 12
Audio S/N ratio versus multipath RF-phase shift and delay time(D/U ratio: 15 dB)
Multipath delay time (µs)
Aud
io S
/N r
atio
(dB
)
Aud
io S
/N r
atio
(dB
)
Multipath RF-phase shift (Degree)
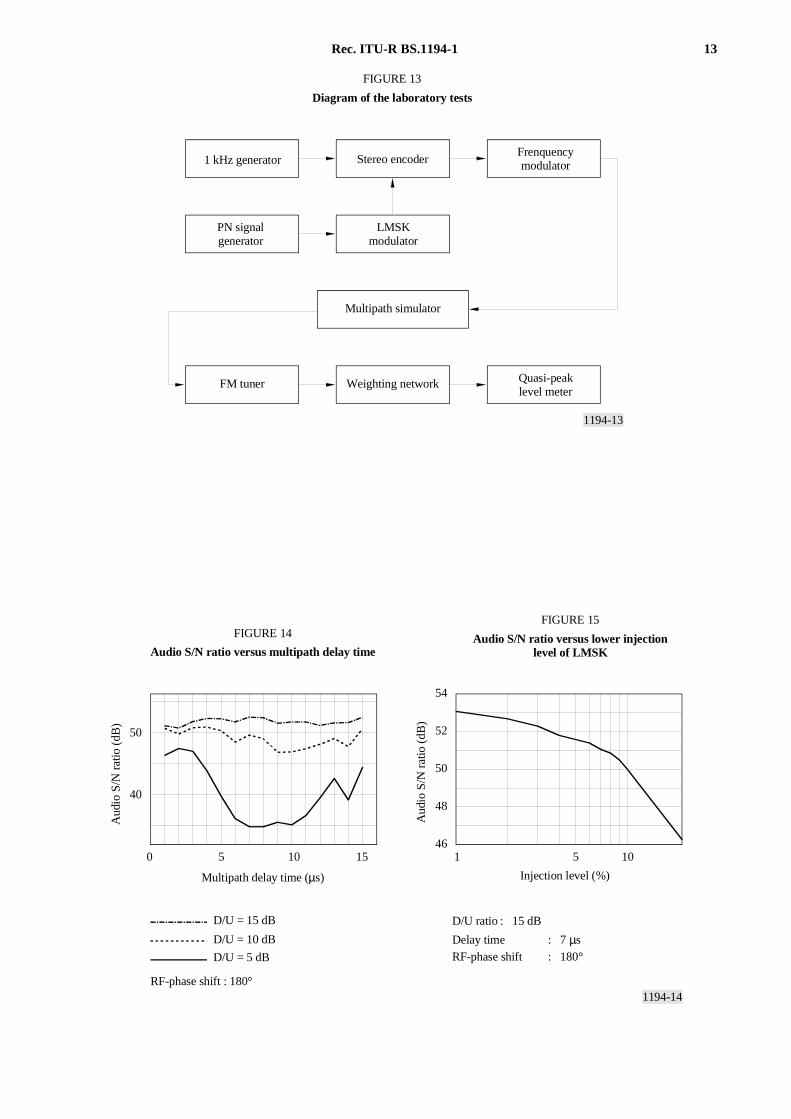
Figure 13 shows the diagram of the laboratory tests. The receiver input level was set to -60 dBmS and the noise levelmeasured by a quasi-peak level meter with a weighting network in accordance with Recommendation ITU-R BS.468.Figure 14 shows the audio S/N ratio versus multipath delay time. Delay times of between 7 µs and 10 µs gives the worstS/N ratios. From the measurement of delay spread in the Tokyo area, it has been revealed that the D/U ratio of a 7 µsdelay multipath signal is greater than 15 dB and the case 9 µs is greater than 19 dB for 99% area ratio. This indicates thatthe 99% worst multipath condition for audio S/N ratio is a D/U ratio of 15 dB, for a delay time of 7 µs and a RF-phaseshift of 180°. Figure 15 shows the audio S/N ratio versus a lower injection level of LMSK under the worst multipathcondition. DARC uses LMSK with the lower injection level of 4%. Figure 15 indicates that the degradation of audio S/Nratio due to multiplexing DARC is controlled to a level below 1.5 dB in the 9% worst multipath condition.
The compatibility tests of the DARC signal with the main programme under conditions of multipath propagation showthat, under the 99% worst multipath condition of D/U ratio of 15 dB, delay time of 7 µs and a RF-phase difference of180° in Tokyo area, less than 1.5 dB degradation of audio S/N ratio was observed when the DARC signal wasmultiplexed.
3 Compatibility with RDS
Tests have been carried out by measuring BER for RDS for five different combinations of multiplex signals, as afunction of signal strength. They refer to stationary reception conditions. The different components of the multiplexsignal are described in Table 3.
The RDS sub-carrier and the DARC sub-carrier were modulated with two uncorrelated PN sequences.
The results from the measurements with five combinations of multiplex components is shown in Fig. 16.
The bottom curve is a measure of the performance of the actual receiving equipment. When the pilot tone is added aslight degradation appears. This degradation is in the range of 0.5 to 1 dB. The further addition of a further DARC signaldoes not cause any increase of the bit error rate. A somewhat larger degradation in performance can be observed for thetwo upper curves. This degradation is however caused by the M- and S-signals and not by the DARC signal in itself.
Rec. ITU-R BS.1194-1 13
1194-13
Multipath simulator
1 kHz generator Stereo encoderFrenquencymodulator
LMSKmodulator
PN signalgenerator
Weighting network Quasi-peaklevel meter
FM tuner
FIGURE 13
Diagram of the laboratory tests
1194-14
1 5 1046
48
50
52
54
40
50
0 5 10 15
D/U = 15 dB
D/U = 10 dB
D/U = 5 dB
Multipath delay time (µs)
RF-phase shift : 180°
Aud
io S
/N r
atio
(dB
)
FIGURE 14
Audio S/N ratio versus multipath delay time
FIGURE 15
Audio S/N ratio versus lower injectionlevel of LMSK
Aud
io S
/N r
atio
(dB
)
Injection level (%)
D/U ratio : 15 dB
Delay time : 7 µsRF-phase shift : 180°

14 Rec. ITU-R BS.1194-1
TABLE 3
1194-16
– 97 – 96 – 95 – 94 – 93
10–1
10–2
10–3
10–4
10–5
10–6
– 96.5 – 95.5 – 94.5 – 93.5– 93,5– 94,5– 95,5– 96,5
FIGURE 16
RDS bit-error rate as a function of receiver input level fordifferent multiplex content
Receiver input level (dBm)
RD
S bi
t err
or ra
te
RDS
RDS + Pilot
RDS + Pilot + DARC(L)
RDS + Pilot + M and S
RDS + Pilot + M and S + DARC(L)
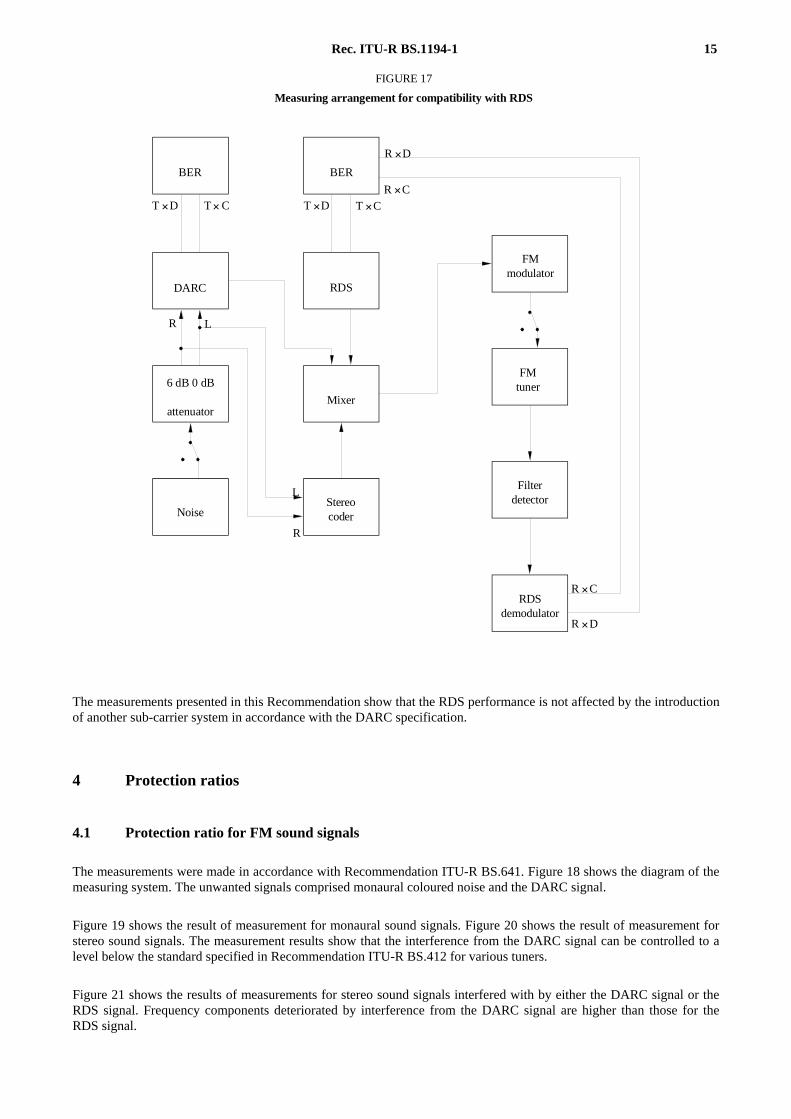
The measuring arrangement is shown in Fig. 17. The DARC modulator used is made by EIDEN. The receiver used wasa STUDER A764 with an external filter and a special product demodulator. For recovery of RDS data (clock and data) aspecial bi-phase demodulator has been used.
MPX component Description
RDS RDS deviates the main carrier 3 kHz (4%)
Pilot tone Pilot tone deviates the main carrier 6.75 kHz (9%)
Stereo signal (M&S) “Normal” stereophonic M- and S-signal created by representative levels of noise weighted inaccordance with Rec. ITU-R BS.559. The deviation thus corresponds to the present-daypractice (see Rec. ITU-R BS.641)
DARC The deviation of the main carrier caused by DARC varies between 3 kHz (4%) and 7.5 kHz(10%), controlled by the S-signal (a feature inherent in the DARC system)
Rec. ITU-R BS.1194-1 15
FIGURE 17
Measuring arrangement for compatibility with RDS
BER BER
DARC RDS
6 dB 0 dB
attenuator
Noise
Mixer
Stereocoder
FMmodulator
FMtuner
Filterdetector
RDSdemodulator
T × D T × C T × CT × D
R × D
R × C
L
R
R × C
R × D
LR
The measurements presented in this Recommendation show that the RDS performance is not affected by the introductionof another sub-carrier system in accordance with the DARC specification.
4 Protection ratios
4.1 Protection ratio for FM sound signals
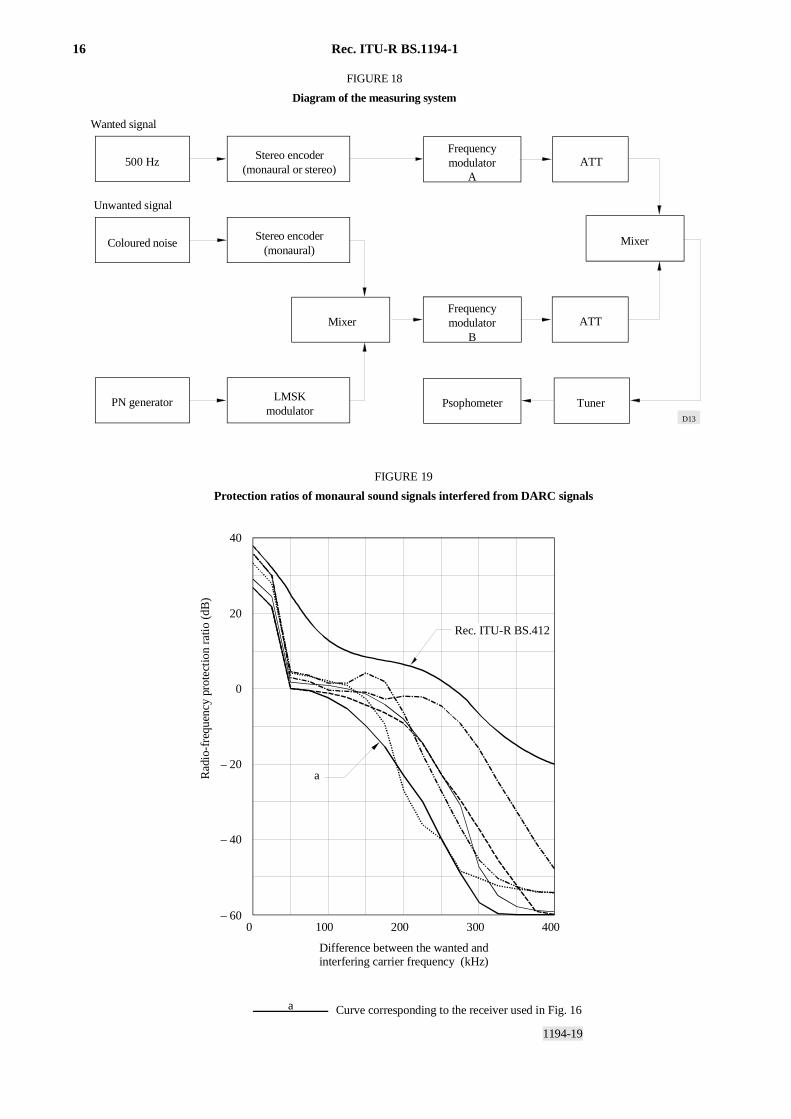
The measurements were made in accordance with Recommendation ITU-R BS.641. Figure 18 shows the diagram of themeasuring system. The unwanted signals comprised monaural coloured noise and the DARC signal.
Figure 19 shows the result of measurement for monaural sound signals. Figure 20 shows the result of measurement forstereo sound signals. The measurement results show that the interference from the DARC signal can be controlled to alevel below the standard specified in Recommendation ITU-R BS.412 for various tuners.
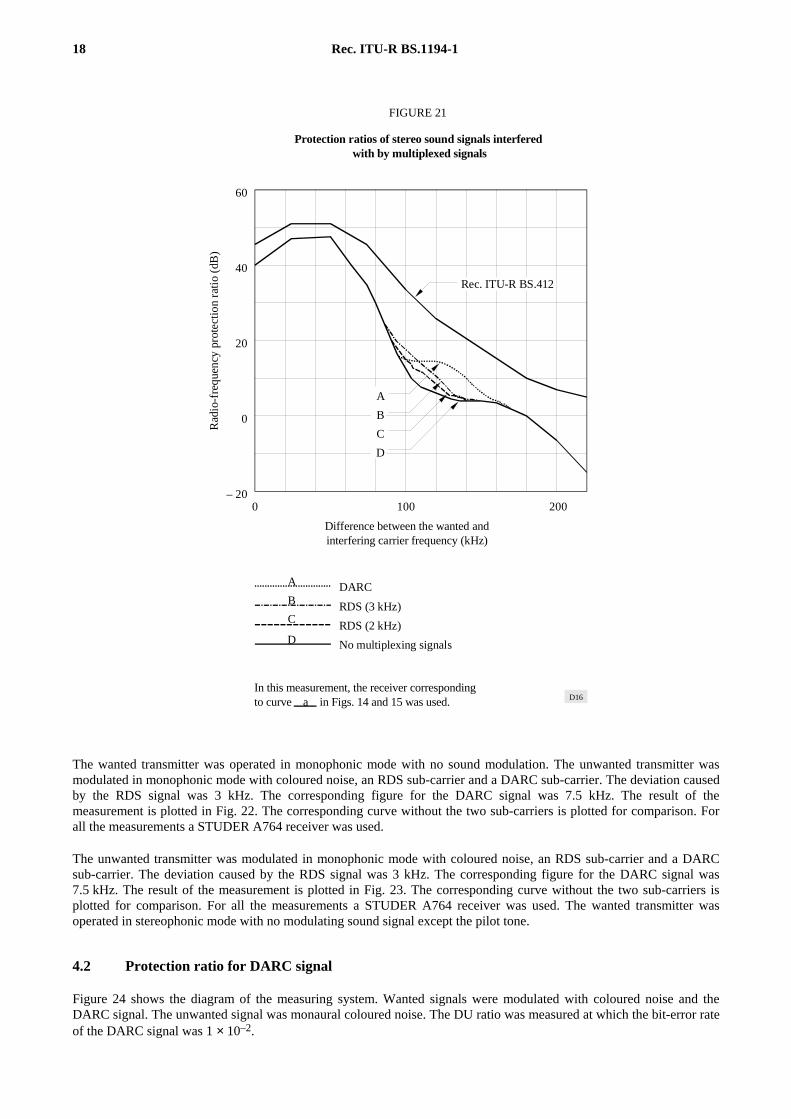
Figure 21 shows the results of measurements for stereo sound signals interfered with by either the DARC signal or theRDS signal. Frequency components deteriorated by interference from the DARC signal are higher than those for theRDS signal.
16 Rec. ITU-R BS.1194-1
FIGURE 18
Diagram of the measuring system
Wanted signal
Unwanted signal
500 Hz
Coloured noise
PN generator
Stereo encoder(monaural or stereo)
Stereo encoder(monaural)
LMSKmodulator
MixerFrequencymodulator
B
Psophometer Tuner
Frequencymodulator
AATT
ATT
Mixer
D13
1194-19
a
a
0 100 200 300 400
40
20
0
– 20
– 40
– 60
FIGURE 19
Protection ratios of monaural sound signals interfered from DARC signals
Rad
io-f
requ
ency
pro
tect
ion
ratio
(dB
)
Difference between the wanted andinterfering carrier frequency (kHz)
Rec. ITU-R BS.412
Curve corresponding to the receiver used in Fig. 16

Rec. ITU-R BS.1194-1 17
a
a
0 100 200 300 400
40
20
0
– 20
– 40
– 60
60
FIGURE 20Protection ratios of stereo sound signals interfered from with by DARC signals
Difference between the wanted andinterfering carrier frequency (kHz)
Rec. ITU-R BS.412
Curve corresponding to the receiver used in Fig. 16
Rad
io-f
requ
ency
pro
tect
ion
rati
o (d
B)
D15
18 Rec. ITU-R BS.1194-1
– 20
0
20
40
60
0 100 200
A
B
C
D
A
B
C
D
Protection ratios of stereo sound signals interfered with by multiplexed signals
FIGURE 21
In this measurement, the receiver correspondingto curve a in Figs. 14 and 15 was used.
DARC
RDS (3 kHz)
RDS (2 kHz)
No multiplexing signals
Difference between the wanted andinterfering carrier frequency (kHz)
Rec. ITU-R BS.412
Rad
io-f
requ
ency
pro
tect
ion
rati
o (d
B)
D16
The wanted transmitter was operated in monophonic mode with no sound modulation. The unwanted transmitter wasmodulated in monophonic mode with coloured noise, an RDS sub-carrier and a DARC sub-carrier. The deviation causedby the RDS signal was 3 kHz. The corresponding figure for the DARC signal was 7.5 kHz. The result of themeasurement is plotted in Fig. 22. The corresponding curve without the two sub-carriers is plotted for comparison. Forall the measurements a STUDER A764 receiver was used.
The unwanted transmitter was modulated in monophonic mode with coloured noise, an RDS sub-carrier and a DARCsub-carrier. The deviation caused by the RDS signal was 3 kHz. The corresponding figure for the DARC signal was7.5 kHz. The result of the measurement is plotted in Fig. 23. The corresponding curve without the two sub-carriers isplotted for comparison. For all the measurements a STUDER A764 receiver was used. The wanted transmitter wasoperated in stereophonic mode with no modulating sound signal except the pilot tone.
4.2 Protection ratio for DARC signal
Figure 24 shows the diagram of the measuring system. Wanted signals were modulated with coloured noise and theDARC signal. The unwanted signal was monaural coloured noise. The DU ratio was measured at which the bit-error rateof the DARC signal was 1 × 10⁻².

Rec. ITU-R BS.1194-1 19
FIGURE 22
– 400 – 300 – 200 – 100 0 100 200 300 400– 20
– 10
0
10
20
30
40
Protection ratios for monophonic sound interfered with by a monophonic broadcast
Pro
tect
ion
rati
o (d
B)
Rec. ITU-R BS.412
No DARC no RDS
With DARC and RDS
Frequency difference (kHz)
D17
– 20
– 10
0
10
20
30
40
50
60
– 400 – 300 – 200 – 100 0 100 200 300 400
Pro
tect
ion
rati
o (d
B)
Frequency difference (kHz)
Rec. ITU-R BS.412
With DARC and RDS
No DARC no RDS
FIGURE 23
Protection ratio for stereophonic sound interfered with by a monophonic broadcast
D18

20 Rec. ITU-R BS.1194-1
FIGURE 24
Diagram of the measuring system
Wanted signal
Unwanted signal
Coloured noise Stereo encoder
PN generatorLMSK
modulator
Mixer
Frequencymodulator B
Mixer
Error rateanalyser Tuner
Coloured noiseStereo encoder
(monaural)
Frequencymodulator A Attenuator
Attenuator
D19
Figure 25 shows the result of measurements taken. The deterioration could also be controlled to a level below thecriteria.
The stereophonic sound and RDS parameters of the wanted VHF/FM channel, which also was carrying the wantedDARC signal, were in accordance with Recommendations ITU-R BS.450 and ITU-R BS.643 using 2 kHz deviation forthe RDS signal. The unwanted signal was a monophonic signal without RDS or DARC. Figure 26 shows the results forDARC deviations of 3 kHz and 7.5 kHz. In both cases the protection ratio is less than that required in Recommenda-tion ITU-R BS.412 for stereophonic broadcast.

Rec. ITU-R BS.1194-1 21
0 100 200 300 400
60
40
20
0
– 20
– 40
– 60
FIGURE 25
Protection ratios of DARC signals interfered with by FM sound signals
Rec. ITU-R BS.412
Difference between the wanted andinterfering carrier frequency (kHz)
Rad
io-f
requ
ency
pro
tect
ion
rati
o (d
B)
D20

22 Rec. ITU-R BS.1194-1
– 20
– 10
0
10
20
30
40
50
60
– 400 – 300 – 200 – 100 0 100 200 300 400
FIGURE 26
Protection ratios for DARC signals interfered with by a monophonic broadcast
Pro
tect
ion
rati
o (d
B)
Rec. ITU-R BS.412
DARC 4%
DARC 10%
Frequency difference (kHz)
D21
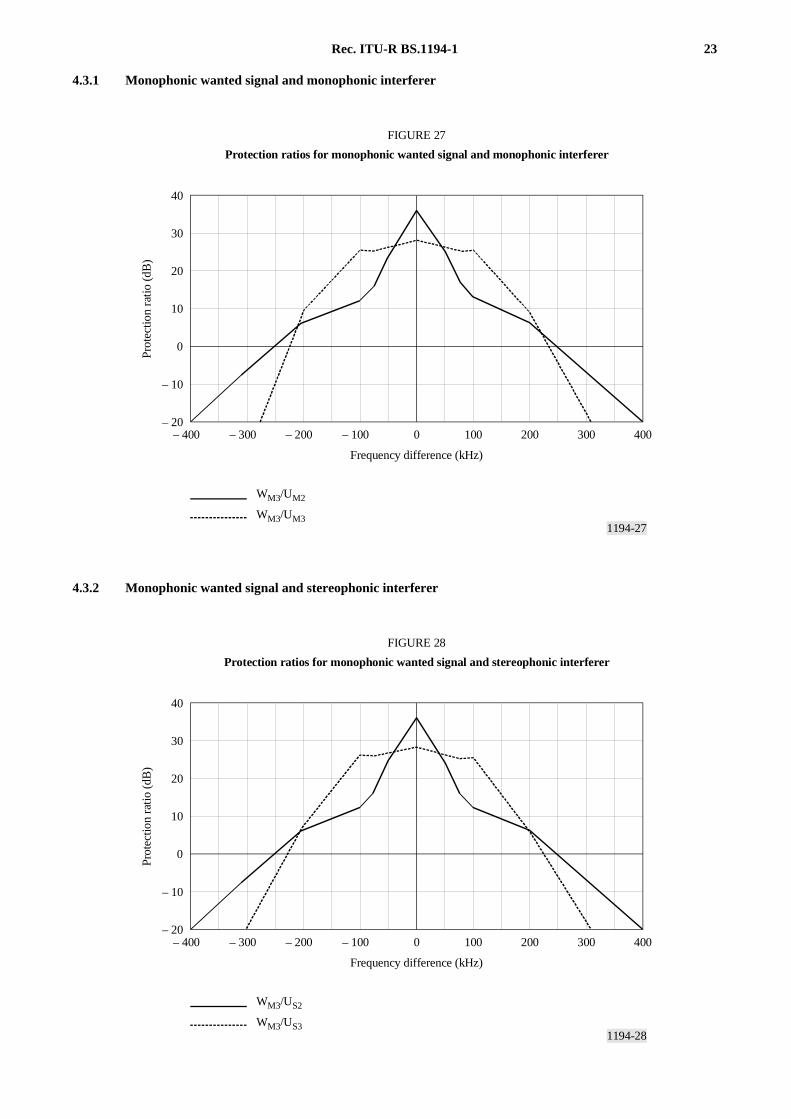
4.3 Protection ratios for a signal interfered with by an RDS or DARC signal
The measurements were undertaken in France in accordance with Recommendation ITU-R BS.641.
RDS and DARC deviations were set to 4 kHz for both the wanted and interfering signals. The protection ratios werederived for a bit error rate of 10-2.
The measurements show that the protection ratios are less than those required by Recommendation ITU-R BS.412 forstereophonic broadcasts but not for monophonic broadcasts.
Abbreviations
W wanted signal
U interferer
M monophonic
S stereophonic
1 audio only
2 audio + RDS
3 audio + RDS + DARC.
Rec. ITU-R BS.1194-1 23
4.3.1 Monophonic wanted signal and monophonic interferer
1194-27
– 20
– 10
0
10
20
30
40
– 400 – 300 – 200 – 100 0 100 200 300 400
WM3/UM2
WM3/UM3
FIGURE 27
Protection ratios for monophonic wanted signal and monophonic interfererPr
otec
tion
ratio
(dB
)
Frequency difference (kHz)
4.3.2 Monophonic wanted signal and stereophonic interferer
1194-28
– 20
– 10
0
10
20
30
40
– 400 – 300 – 200 – 100 0 100 200 300 400
WM3/US2
WM3/US3
FIGURE 28
Protection ratios for monophonic wanted signal and stereophonic interferer
Prot
ectio
n ra
tio (d
B)
Frequency difference (kHz)

24 Rec. ITU-R BS.1194-1
4.3.3 Stereophonic wanted signal and stereophonic interferer
1194-29
– 20
– 10
0
10
20
30
40
50
60
– 400 – 300 – 200 – 100 0 100 200 300 400
WS3/US2
WS3/US3
FIGURE 29
Protection ratios for strereophonic wanted signal and strereophonic interferer
Prot
ectio
n ra
tio (d
B)
Frequency difference (kHz)

Rec. ITU-R BS.1194-1 25
4.3.4 Stereophonic wanted signal and monophonic interferer
1194-30
– 20
– 10
0
10
20
30
40
50
60
– 400 – 300 – 200 – 100 0 100 200 300 400
WS3/UM2
WS3/UM3
FIGURE 30
Protection ratios for stereophonic wanted signal and monophonic interferer
Prot
ectio
n ra
tio (d
B)
Frequency difference (kHz)