Bryan S. Bockmon- Burn Rates in Nano-Composite Energetic Materials
39
BURN RATES IN NANO-COMPOSITE ENERGETIC MATERIALS by BRYAN S. BOCKMON, B.S.M.E. A THESIS IN MECHANICAL ENGINEERING Submitted to the Graduate Faculty of Texas Tech University in Partial Fulfillment of the Requirements for the Degree of MASTER OF SCIENCE IN MECHANICAL ENGINEERING Approved Chairperson of the Committee .Accepted Dean of the Graduate School Mav. :003
Transcript of Bryan S. Bockmon- Burn Rates in Nano-Composite Energetic Materials
BURN RATES IN NANO-COMPOSITE
ENERGETIC MATERIALS
by
BRYAN S. BOCKMON, B.S.M.E.
A THESIS
IN
MECHANICAL ENGINEERING
Submitted to the Graduate Faculty of Texas Tech University in
Partial Fulfillment of the Requirements for
the Degree of
MASTER OF SCIENCE
IN
MECHANICAL ENGINEERING
Approved
Chairperson of the Committee
.Accepted
Dean of the Graduate School
Mav. :003

ACKNOWLEDGEMENTS
I would like to express my sincere gratitude to Dr. Michelle Pantoya for
unselfishly sharing her experience, wisdom, and guidance throughout the duration of this
project. My thanks go out to the Los Alamos National Laboratory, Dr. Steve Son, and Dr.
Blaine Asay for financial support through the Advanced Energetics Initiative and their
valtxable insight. I am also grateful for Mr. James Busse and Mr. Ed Roemer for their
helpful advice and assistance with these experiments. Most of all, I want to thank God for
the opportunity and the abilities to study his creation.
u
TABLE OF CONTENTS
ACKNOWLEDGEMENTS ii
ABSTRACT iv
LIST OF TABLES v
LIST OF FIGURES vi
CHAPTER
L INTRODUCTION 1
n. EXPERIMENTAL 4
Sample Materials 4
Apparatus 7
m. RESULTS 12
Statistical Analysis 17
IV. DISCUSSION..: 20
V. CONCLUSIONS 28
VI. IMPLICATIONS AND FUTURE RESEARCH 30
REFERENCES 31
m
ABSTRACT
Bum rates were experimentally determined for nanocomposite thermite powders
composed of aluminum (Al) fuel and molybdenum tri-oxide (M0O3) oxidizer under well-
confined conditions. Confined pressures were also measured to provide detailed
information about the reaction. Samples of three different fuel particle sizes (44, 80, and
121 nm) were analyzed to determine the influence of particle size on bum rate. Bulk
powder density was varied from approximately 5 to 10 percent of the theoretical
maximum density (TMD). The bum rates ranged from approximately 600 to 1000 m/s.
Results indicate that bum rate increased with decreasing particle size. Pressure
measurements indicate the strong convective and possibly acoustic shock mechanisms are
integral in flame propagation.
IV

LIST OF TABLES
1. Altmiinum particle characteristics and mixture ratio 4
2. Velocity and pressure 17
LIST OF FIGURES
1. SEM Micrographs of Al/MoOsComposites 5
2. Bum-Rate Optimization Series 7
3. Acryhc mounting block: (a) schematic diagram of assembled block (b) photograph of assembled block (c) schematic of data collection assembly 9
4 A-F. Sequence of AI/M0O3 reaction images 12
5. Example 6-chamiel pressure history for an experiment 13
6. Example 6-chaimel light intensity history for an experiment 14
7. Analysis of a single pressure history 15
8. Representative 'Position versus Time' plots used to estimate bum rate 16
9. Velocity (A) and pressure (B) versus density for 44nm AI/M0O3 composite 18
10. Velocity (A) and pressure (B) versus density for 80rmi AI/M0O3 composite 19
11. Velocity (A) and pressure (B) versus density for 121nm AI/M0O3 composite 19
12. Proposed stmcture of reaction wave in nano-composite thermites 25
VI
CHAPTER I
INTRODUCTION
A thermite reaction is a highly exothermic reaction between a metal and another
metal or metallic oxide. When the fuel metal species is aluminimi and the oxidizer is a
metallic oxide (i.e., CuOs, Fe203, M0O3), the reaction temperature and heat of
combustion can be excessively high such that the composite is ideal for ordinance
applications. Thermite composites are of great interest in combustion studies, partially
due to their practical appUcations ranging from igniters to incendiary devices. Wang et al.
(1993) provide a thorough review of thermite reactions and discuss additional thermite
applications.
Nanoscale alimiinimi particles are becoming more readily available and may
provide a new opportimity to enhance the energy density and increase the bum rate of
thermite reactions. Spherical particles of aluminum are considered nano-scale if the
particle diameter is approximately 100 nm or less. Particles with other geometries are
considered nano-scale if one or more of their major dimensions are less than 100 nm.
Nano-scale diameter Al particles have only recently been developed. The two
primary methods for the creation of nano-aluminum particles include gas phase synthesis
and condensed phase synthesis. The methods involving gaseous precursors require an
external energy source such as a flame, RF or DC plasma (Taylor and Vidal, 1999;
Boulos, 1985). In the case of plasma synthesis, the particles are formed in the vapor
phase at very high temperatures (>15,000K) and then rapidly quenched to the sohd phase

and collected. Thin-wire explosion can also be used to produce nano-scale particles, but
tiie size-disti-ibution of the particles is large relative to the other techniques. Vapor
condensation methods appear to be the most successful methods to date for producing
various metal nano-particles (Granquist and Buhrman, 1976). In this method, the metal
vapors are condensed into a flowing stream of inert gas under reduced gas-pressures.
Particle size is controlled by the flow and type of inert gas, total gas pressure,
temperature of the evaporating metal, and the geometry of the vaporizing-condensing
system. In this technique, particle nucleation and growth rates control particle size
distributions (Puszynski, 2002).
Research has shown that increased bum rates can be achieved with smaller
particle composites (Aumann, 1995). For example, Rugunanan and Brown (1994)
showed that pyrotechnic bum rates increased with decreasing particle size (in the micron-
range) of the constituents. In more recent work. Brown (1998) varied the particle size of
the fuel species in the Sb/KMn04 system and foimd that reducing particle size from 14 to
2 microns increased the burning rate from 2-8 mm/s to 2-28 mm/s. These results suggest
that reducing the fuel particle size to the nano-scale range may result in revolutionary
bum rate performance. This theory was further substantiated by Shimizu and Saitou
(1990) in their evaltiation of the effect of contact points on reaction rate. They foimd that
in the Fe203-V205 system, increasing the nimiber of contact points between fuel and
oxidizer particles increased reaction rates. In another study, Aumann et al. (1995)
examined the oxidation behavior of aluminum nano-powders. They suggest that Al
powder mixtures with average particle sizes of 20-50 nm can react 1000 times faster than

conventional powdered thermites owing to reduced diffusion distances between
individual reactant species. Both of these studies indicate that a higher degree of intimacy
in the mixing of fiiel and oxidizer particles results in improved performance of the
energetic composite. Although the previous evidence indicates similar results, it is
important to note that Aumann's studies were performed with loose powdered media,
unlike Brown's compressed pellets. Compressed pellet studies were conducted for nano
composite thermites and the opposite trend was revealed (Granier, 2003). Bum rates
actually decreased with decreasing particle sizes. This phenomenon was attributed to the
larger volimietric percentage of the inert and thermally resistive alvmiinimi oxide shells in
the nano sized particles.
The rate at which energy is released (i.e., reactive power) is related to the bum
rate and depends on a nimiber of factors including particle size distribution, degree of
compaction of the mixture and the degree of intermixing of fuel and oxidizer powders.
The objective of this study is to examine the combustion behavior of nano-composite
powder mixtures of aliuninum and molybdeniun trioxide as a function of altmiinum
particle size. Specifically, bum rate and pressure measurements were analyzed for loose
powder mixtures that are confined in cylindrical tubing. The mechanisms responsible for
flame propagation are also discussed.
CHAPTER II
EXPERIMENTAL
Sample Materials
Three Al samples were mixed individually with a single M0O3 sample to produce
three separate samples of AI/M0O3 mixtures tiiat differ by the Al average particle
diameter. The M0O3 was held constant through all tests. The Al particle characteristics
and stoichiometric fuel to air ratios are hsted in Table 1.
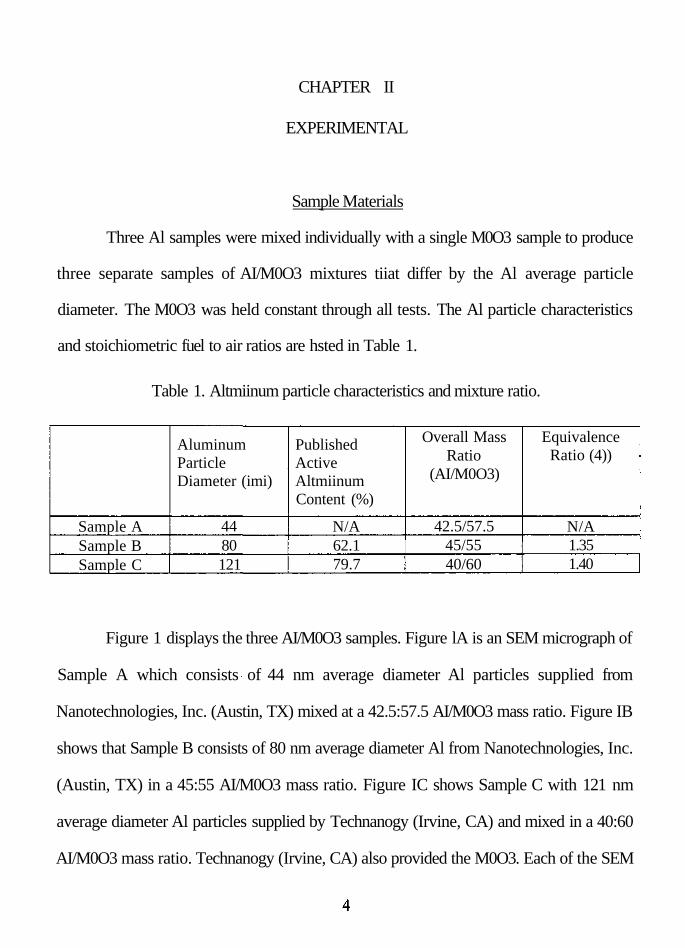
Table 1. Altmiinum particle characteristics and mixture ratio.
Sample A Sample B Sample C
Aluminum Particle Diameter (imi)
44 80 121
Published Active Altmiinum Content (%)
N/A 62.1 79.7
Overall Mass Ratio
(AI/M0O3)
42.5/57.5 45/55 40/60
Equivalence Ratio (4))
N/A 1.35 1.40
Figure 1 displays the three AI/M0O3 samples. Figure lA is an SEM micrograph of
Sample A which consists of 44 nm average diameter Al particles supplied from
Nanotechnologies, Inc. (Austin, TX) mixed at a 42.5:57.5 AI/M0O3 mass ratio. Figure IB
shows that Sample B consists of 80 nm average diameter Al from Nanotechnologies, Inc.
(Austin, TX) in a 45:55 AI/M0O3 mass ratio. Figure IC shows Sample C with 121 nm
average diameter Al particles supplied by Technanogy (Irvine, CA) and mixed in a 40:60
AI/M0O3 mass ratio. Technanogy (Irvine, CA) also provided the M0O3. Each of the SEM

micrographs in Figure 1 was taken at the same magnification to provide visuai
comparison of the particle sizes and the nature of the interaction between the Al
(spherical) and M0O3 (crystalline sheet) structures. The M0O3 particles provide an
example of how particles with a length of near 1 fxm can still be classified as nano-scale
based on the 20 nm sheet thickness.
^" • '̂ S^-iy^: •r fm
B. 80nm Nanotechnologies Al - 45/55 Al/MoOj
Figure 1. SEM Micrographs of AI/MoOiComposites
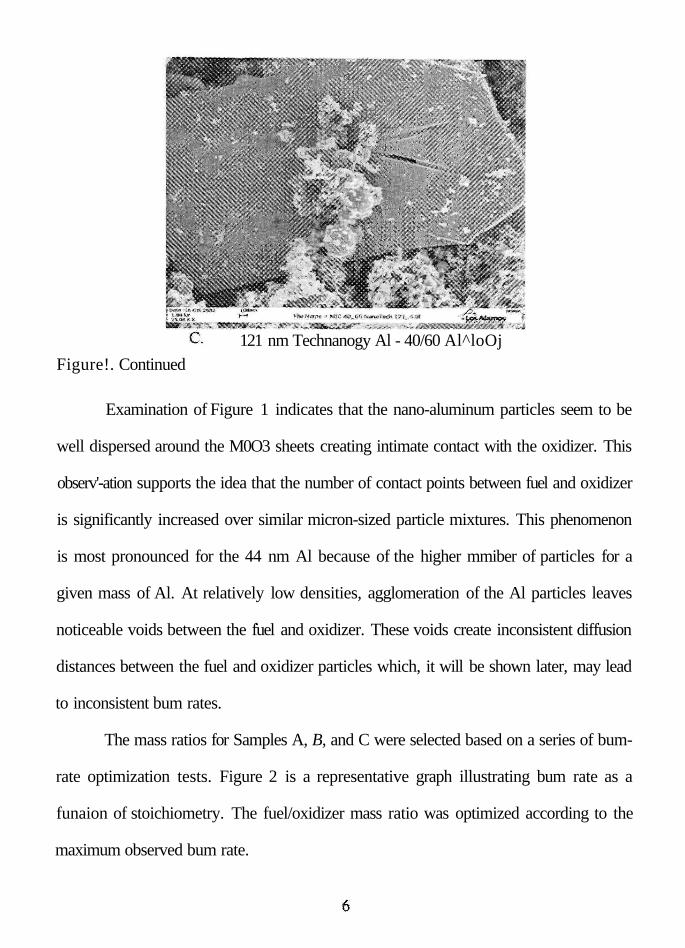
121 nm Technanogy Al - 40/60 Al^loOj Figure!. Continued
Examination of Figure 1 indicates that the nano-aluminum particles seem to be
well dispersed around the M0O3 sheets creating intimate contact with the oxidizer. This
observ'-ation supports the idea that the number of contact points between fuel and oxidizer
is significantly increased over similar micron-sized particle mixtures. This phenomenon
is most pronounced for the 44 nm Al because of the higher mmiber of particles for a
given mass of Al. At relatively low densities, agglomeration of the Al particles leaves
noticeable voids between the fuel and oxidizer. These voids create inconsistent diffusion
distances between the fuel and oxidizer particles which, it will be shown later, may lead
to inconsistent bum rates.
The mass ratios for Samples A, B, and C were selected based on a series of bum-
rate optimization tests. Figure 2 is a representative graph illustrating bum rate as a
funaion of stoichiometry. The fuel/oxidizer mass ratio was optimized according to the
maximum observed bum rate.

900
880
^ 8 6 0 w
S"840
A 820 3 c 800 V 15 780 oi = 760 3
740 •
720 •
700
•
•
o
1 1
D
A
AI/M0O3 mass ratios for 55.5% active Al content.
X
040/60 D 42.5/57.5 A 45/55 X47.5/52.5 0 50/50
0
0.80 0.90 1.00 1.10 1.20 1.30 1.40 Equivalence Ratio - 9
1.50 1.60
Figure 2. Bum-Rate Optimization Series
Apparatus
One goal of this study was to determine the bum rate by measuring the velocity of
a reaction front as it passed through the three confined powder mixtures, each at various
bulk densities. The pressure-increase as the reaction progressed was also measiu^ed.
Powder confinement was provided by open-ended fransparent acrylic tubing that allowed
for visual inspection of the behavior of the reaction front (Figtire 3).
The acrylic tubing had an iimer and outer diameter of 0.3175 and 0.635 cm,
respectively. Each tube was 10.16 cm long and filled with powder. The volume of the
cavity in the tube was 0.8044 cm^ This tube size was sufficiently large for efficient
vistial inspection yet small enough for sample sizes that were within self-imposed safety
limits. Preliminary tests were performed to show that the tube size did not significantly

affect the bum rate. For six tubes with inner diameters ranging from 1 to ~6 mm, bum
rate variation was fotmd to be insignificant. Acrylic was chosen as the tubing material
because of common availability and its mechanical sti-ength advantages over similar glass
tubing, which allowed the reaction to proceed completely through the tube before its
destmction. The ends of the tubing were left open to prevent the impedance of convective
phenomenon. Visual examination of the tubing fragments subsequent to the experiment
revealed little thermal damage, but there remains the possibility for small quantities of
vaporized acrylic to interact with the mam reaction.
For each sample, three bulk densities were studied and were selected by the
physical limitations of filling the tubes with powder. The low-density samples were
prepared by pouring loose powder into the tubes tmtil the entire tube volume was filled.
(This density is commonly referred to as the 'poured density'.) Medimn-density sets were
filled in much the same way, but each tube was vibrated for approximately 5 seconds to
compact the particles and allow more powder to fill the tubes. The high-density sets were
vibrated and filled continuously imtil no additional compaction could be detected. Since
the theoretical maximum density (TMD) for these mixttu-es is approximately 4 g/cm ,̂ the
densities for these experiments ranged from 5 to 10 % TMD.
After the tubes were filled with powder, they were inserted into an acrylic block
instnunented with fiber-optic photo-detectors and piezo-crystal pressure sensors to
facilitate the bum rate and pressure measurements (Figure 3). The six pressure sensors
were installed at 1 cm spacing on one side of the tube and aligned with pre-drilled holes
in the confinement tubes. A photo-detector opposed each of the pressure sensors on the

otiier side of the tube. The resulting 5 cm instrumented section was located in the center
of the length of the tube to allow the reaction to reach steady state and minimize the
effects of the open ends of the tube. Optical fibers (Thoriabs M21L01) ti-ansmitted light
signals to the photo-detectors (Thoriabs DET210). One mm diameter ports were bored
into the acrylic tubing to transmit pressure to the pressure sensors (PCB 113A22). These
ports were filled with standard clear vacuum grease to thermally insulate the piezo-crystal
sensors from the high reaction temperatures. This precaution prevents non-linearities in
the electrical response of the piezo-crystals that can arise from temperature changes in the
sensor. Effects from the grease on the dynamic response of the sensors were assimied to
be negligible. An 8-channel, PCB 482A20 signal conditioner transmitted the pressure
signals to two Tektionix TDS460A 4-channel digital oscilloscopes.
-..i2)-i.°ii£.li2l'-i2ij'5irr
Top
g m I '
172"
^
3m 2dE
I P /jii/jh^A
I - I
Front
A-A
v.
V /
i SEcnoNA-A
1 1 i 1 1
:
A.
Figure 3. Acrylic mounting block: (a) schematic diagram of assembled block (b) photograph of assembled block (c) schematic of data collection assembly

digital oscilloscopes r
2 separate data signals
Photo-detector array
<
optical fibers
block assembly
V- Signal conditioner
laptop computer w/ data acquisition capabilities
C.
Figure 3. Continued
All experiments were performed inside a stainless-steel vessel to contain flying
fragments from the small explosions. A 3-cm thick acrylic-viewing window provided
visual access to the experiment. A Phantom V high-speed camera recorded images at
10

frame rates of 62,500 fjps. This frame rate allowed 16 jxs time resolution between images.
A bare, 51-gauge electric match head supplied the ignition source for the reaction.
11
CHAPTER III
RESULTS
Figure 4 shows a sequence of images taken from the high-speed camera. The first
sensor location can be seen in image B (note [a]), and the others become visible m the
following frames.
Figure 4 A-F. Sequence of AI/M0O3 reaction images.
12

Figure 5 and Figure 6 show sample data recorded from the pressure sensors and
photo-detectors, respectively. It is important to note the maximum pressure, the
pressurization rate, and the duration of the pressure pulse illustrated in Figure 5. These
quantities can provide valuable information for determining the mechanisms that drive
these reactions. The light intensity histories depicted in Figure 6 are used to determine an
accurate average bum rate. Each of those six signals represents the light intensity history
for its respective photo-detector.
0 100 200 300 Time (s)
400
Figure 5. Example 6-channel pressure history for an experiment.
500x10
13
'ift
c *-> c
1 2 -
1 0 -
0 -1^ 0 20 40
Time (sec) 60 80x10'
Figure 6. Example 6-channel light intensity history for an experiment.
Closer inspection of the pressure history reveals that a "pressurization zone" can
be defined for each experiment that corresponds to the thickness over which the pressure
rises from 5 to 95 % of its peak value. Figure 7 shows how the time required for pressure
rise is obtained. When this time is muhiplied by the reaction velocity (bvim rate) obtained
from the experimental data, the result is the pressurization zone thickness (Figure 7). This
result may be significant in determining the reaction propagation mechanisms and is
analyzed later in the discussion.
14
O.E+00 5.E-05 l.E-04 2.E-04 2.E-04
Time (s) 3.E-04 3.E-04
Figure 7. Analysis of a single pressure history.
Burn rate is calculated from the slope of a set of position versus time data from
each experiment. Flame position is known from the location of the sensors optical
sensors. Corresponding times are recorded for each light pulse to reach a specific
intensity. The initial rises in light intensity are the result of light refracting forward from
the approaching reaction front. These effects are negligible because the full acceptance
cone of the fiber-optic cables (46 degrees) is effectively reduced to less than 10 degrees
by the mounting configttration in the acrylic block. Figure 8 shows two representative
graphs that reveal that all the data lie very close to the linear fit whose slope provides the
bum-rate approximation.
15

O.OOE+00 2.00E-05 4.00E-05 6.00E-05 8.00E-05
Time (s )
(a) 80nm Al at Medium Density
O.OOE+OO 2.00E-05 4.00E-05
Time (s)
6.00E-05 8.00E-05
(b) 44mn Al at Medium Density
Figure 8. Representative 'Position versus Time' plots used to estimate bum rate.
Table 2 summarizes the average values for velocity and pressure. The values
reported were averaged over at least three repeatability experiments and the standard
deviation associated with each set of measurements is also shown. Each of the three
AI/M0O3 samples was divided into three subcategories by bulk density. The pressure is
the approximate maximum presstjre reached inside the tube. The actual recorded pressure
16

is approximated from the maxunum sustained pressure (i.e., pressure spikes were
ignored). Also included are the average mass consumption rates for each experiment.
Table 2. Velocity and pressure.
Low
Medium
High
Avg Velocity (m/s) Standard Deviation Pressure (psi) Standard Deviation Mass Cons. Rate (g/s) Avg Velocity (m/s) Standard Deviation Pressure (psi) Standard Deviation Mass Cons. Rate (g/s) Avg Velocity (m/s) Standard Deviation Pressure (psi) Standard Deviation Mass Cons. Rate (g/s)
44nm Al 959.3 27.0
1566.7 88.9 2308 916.0 44.7
2533.3 155.6 2805 950.7 31.6
3200.0 133.3 3600
80 nm Al 988.7 92.2
1800.0 400.0 2665 988.3 43.8
2400.0 266.7 3230 948.7 25.1
2600.0 244.4 3607
121 nm Al 684.4 67.9
1580.0 133.3 1794 784.7 40.4
1800.0 244.4 2522 765.3 16.9
2700.0 366.7 2856
Statistical Analvsis
The statistical significance of the average velocities shown in Table 2 is important
to note. Time and material consfraints allowed for only three repeatability tests for any
given combination of particle size and density. In situations such as this with very small
sample sizes, it becomes necessary to evaluate the confidence interval of the
measurements using the "student's t-distribution" in place of the "standard normal
distribution" curve. The confidence interval is calculated using the follovsdng relationship.
a u = x±n —:n-l U / ,VnJ (1)
17
where \i is the tme mean, x is the average value from the sample, and t is tabulated as a
function of a, the confidence level, and the degrees of freedom r, or n-1 (Hogg and
Ledolter, 1992). The standard deviation of the sample is estimated as s, and n is the
nimiber of tests in the sample.
For the case of the largest standard deviation, the low-density 80 mn batch, it was
found with 90% confidence that the tme mean bum rate will lie within 11% of the
average shown. In tiie case of the smallest deviation, the high-density 121 mn, it is
predicted with 90% confidence that the tme mean bum rate will lie within 2.5% of the
average given. The confidence levels for all other series lie between these two extremes.
Therefore, the measurements for average velocity will be considered accurate. The data
plotted in Figure 9, Figure 10, and Figure 11 show the velocity and pressure
measurements as a fimction of density.
44nm Dia Al
1 0 0 0 •
JQ̂ 800 -E
u o " 4 0 0 •
200 •
[
• •
1 _>__.
2 t 6 8
Density (%TMD)
* •
10 12
3500 -
^ 3000 •
a 2500 •
1 2000 •
S 1500 •
"• 1000 •
500 J
c
44nm Dia Al
•
•
•
• 4»
) 2 4 6 8 10
DensitvCMiTMD)
12
A. B.
Figure 9. Velocity (A) and pressure (B) versus density for 44rmi AI/M0O3 composite.
18
1200 •
1000 •
J^ 800 •
Vel
oci
ty
o
o
o
o
200 -
0 • (
80nni Dia Al
• • • •
1 2 4 6 8
Density (<MiTMD)
/ '
10 12
4000 -
3500 -
^ 3000 -
a 2500 -
1 2000 • M
a 1500 -
1000 -
500 -
C
SOnm Dia Al
• • • • •
*
^^
2 4 6 8 10
Density (<MiTMD)
12
A. B.
Figure 10. Velocity (A) and pressure (B) versus density for 80nm AI/M0O3 composite.
1000 -
^ 800 B
S 600 • 'u
"Z 400
200 •
C
121nm Dia Al
• :* • " . '
) 2 4 6 8 10
Density (•VbTMD)
1 2
3500 -
3000 -
0. 2500 -
1 2000 -
a 1500 •
1000 •
500 -
C
121nm Dia Al
•
• •
•
f *
) 2 4 6 8 10
Density (<MiTMD)
12
A. B.
Figure 11. Velocity (A) and pressvire (B) versus density for 121imi AI/M0O3 composite.
19
CHAPTER IV
DISCUSSION
Figure 9A, Figure lOA, and Figure llA show that varying the Al particle
diameter affects the bum rate of the composite. The bum rate is inversely proportional to
the particle radius squared when combustion is diffusionally conti-olled (Glassman,
1996). This tiieory may not apply as the particle radius approaches zero because the
entire flame propagation mode should become homogeneous. Along these tines, a critical
diameter may exist for which smaller particle diameters do not result in a fiuther increase
in bum rate. From Table 2, the average velocity for the 44 nm and 80 nm Al particle
diameter case is approximately the same (i.e., on the order of 950 m/s) regardless of the
TMD. The bum rate for composites composed of 121 nm Al particles are on the order of
780 m/s which is significantly less than the smaller particle composites. This result
mdicates that as the particle diameter of Al is decreased from 121 to 80 nm, the bum rate
increases by approximately 200 m/s. However, Table 2 also suggests that composites
with Al particle diameter less than 80 rmi do not exhibit fiarther increases in propagation
velocity. Therefore, there may exist some critical particle diameter between 80 and 121
nm, below which mass diffiision is no longer enhanced and bum rate is independent of
particle diameter. This behavior is likely attributed to the coupled effects of increased
surface area to volume ratio of reactant on the diffusion-controlled reaction.
In general. Table 2 shows that the standard deviations in velocity associated with
the smallest particle composite are significantly less than the larger particle composites.
20

Basically, for the 80 and 121 nm Al diameter composites the variability in bum rate is
reduced witii increasing density. This ti-end is illusti-ated in Figure 9A, Figure lOA, and
Figure 11A where it is shown that there is less bum rate variability for the 44 nm samples
than for the larger particle samples at 5% TMD. Also, the dashed lines in Figure 10 and
Figure 11 highlight the observation that the fluctuations in velocity measurements
decrease in the two larger particle samples as tiie powders become more compact (i.e.,
higher TMD).
The variation in velocity v^th respect to density can be partially explained by
examining the SEM micrographs in Figure lA-C. The composites in these images fall
into the low-density category. The spherical 44 nm diameter Al particles in Figure 1A are
clustered more tightiy around the M0O3 sheets creating intimate contact between the fiiel
and oxidizer. This intimate contact results in consistently smaller diffiision distances
between species. Reduced diffiision distances will allow a diffiision-contiolled reaction to
proceed more quickly and ultimately produce faster bum rates. In this way, the reduction
m particle diameter allows more intimate contact between fuel and oxidizer particles and
the mixture homogeneity ultimately increases the bum rate.
The reduced variability in velocity measurements for the smallest nano-composite
(Sample A) when compared to samples with larger particles may be partially understood
by examining Figure 1 A. In this image, the diffusion distance is not only smaller but also
more consistent. This consistency of diffusion distances may result in bum rates that are
more influenced by the particle size than the degree of powder compaction (Figure 9A).
The 80 and 121 nm Al particles in Figtire IB and C are scattered more loosely aroimd the
21

M0O3 which results in larger and more variable diffusion distances and more variable
bum rates. The inconsistency in diffusion distances is most likely the reason for tiie large
velocity variations fotmd in the lower density mixtures. Increasing the degree of
compaction (i.e., the TMD) of the mixtiires decreases the size of voids, therefore
reducing the average diffusion distance to a smaller, more consistent value. As expected.
Figure 10 and Figure 11 show that velocity variations decrease with increasing density.
Figure 9B, Figure lOB, and Figtire IIB depict an increase in pressure with increasing
bulk density. This effect may be a direct result of increasing the mass of reactants
confined within a constant volume. As the reaction propagates, more gaseous
intermediate products are produced. The build up of gaseous reactants, intermediates and
products in the confined region of the tube increases the pressure in the tube.
Most derivations for bum rate as a function of particle size are based on the
assumption that the mechanism responsible for reaction propagation is conduction.
Figure 9B, Figure lOB, and Figure IIB suggest that pressure measurements are
sufficiently high that convection may play a dominant role as the reaction mechanism in
powder composites. This can be verified by examining the Peclet number (Glassman,
1996).
Pe = ^ (2) a
In this equation, u is tiie bum rate, a is the thermal diffusivity of tiie composite
reactants, and 6r is the thickness of the reaction zone. From tiiermophysical property data
22

for Al and M0O3, a was estimated to be 2.3 x lO'̂ m /̂s and considers Al, tiie AI2O3
passivation shell, M0O3 and air. The bum rate is on tiie order of 900 m/s from tiie
experimental data and tiie reaction zone tiiickness is typically taken to be approximately
10% of tiie flame tiiickness. The high speed imaging of the flame front does not provide
enough resolution to distinguish the flame tiiickness. Also, highly luminous products may
simply obscure the flame thickness. However, typical flame thickness for premixed
combustion is approximately 1 mm. For this calculation, a reaction zone thickness was
assumed that is 10% of 1 mm. These approximations are fiirther supported by the results
for pressure zone thickness shown in Figtire 7.
Using these values, an order of magnitude calculation for the Peclet number is
3000, indicating that convection plays a dominant role in the propagation of this reaction.
As a lower limit Peclet number estimate, the reaction zone thickness may be assumed to
be on the order of the particle diameter. In this case, 6r is approximately 100 nm. The
corresponding Pe number is 3, indicating that conduction is nearly as significant as
convection in driving the reaction forward.
In addition, when convective processes are important, a pressure gradient propels
the advective transport of energy forward. The reactants and products of pure AI/M0O3
composite materials are both solids according to the reaction:
2AI + M0O3 ^ AI2O3 + Mo.
However, intermediates or products may be gaseous before they condense as they cool.
Also, initial gas between particles is heated and could behave as a working fluid to
transport heat forward. For example, M0O3 begins to sublime at 973 K and therefore, gas
23

phase reactants are likety present at temperatures well below the adiabatic flame
temperatiire (3253 K). In addition, analysis of high-speed photographic data shows that
for burning of powders confined in quartz tiibes, particulates are ejected from tiie ends of
tiie tiibe tiiroughout tiie reaction (Son et al., 2002). The fact tiiat tiiese materials expel gas
and particulates illustrates tiie significance of convective mechanisms driving the reaction
forward. This, coupled with high-pressure measurements, further supports the idea that
the convective mechanism dominates the reaction propagation by driving molten Al and
gaseous oxidizer into the im-reacted material. Similar phenomena have been known to
lead to high bum rates in other materials (Margolis and Telengator, 2001) and may be
partly responsible for the high bum rates measured here. Energy may also be projected
forward by other mechanisms such as radiation.
Inspection of the pressure histories as depicted in Figure 7 reveals a stmcture very
similar to that described in the Zeldovich, von Neumann, and Doring (ZND) theory for
detonation waves. This suggests that the rapid pressurization as seen in Fig. 6 is evidence
of an acoustic mechanism traveling at supersonic velocities. For example, the speed of
soimd in air is approximately 345 m/s and the reaction velocities observed in these
experiments are approximately 900 m/s. Therefore assuming a gaseous medium (the
mixtures are 90% air by volume), reaction velocities of near Mach 3 are conceivable.
Glassman (1996) states that this shock leaves heated and compressed gases behind it, and
after an induction period, a chemical reaction starts. It is at this point that the temperature
will rise, the pressure and density will fall to the Chapman-Jouguet state, and the reaction
will reach equilibrium. A rarefaction wave whose steepness depends on the distance
24
tiaveled by the wave then sets in; therefore, behind the C-J shock, energy is generated by
tiiermal reaction (Glassman, 1996).
Traditionally, ZND shock theory is applied only to systems with a planar shock in
homogeneous material, but the overall stmcture of a shock, followed by a reaction zone
initiated after an induction period may provide valuable insight into the propagation of
the nano-composite thermite reactions. The ability to measure and continuously record
localized temperature and density in these experiments must be developed to further
substantiate the application of ZND shock theory in this case. Figure 12 illustrates how
the individual zones described above may play a role in nano-composite thermite
combustion.
3-phase products
Pressure zone: 1) pressurization 2) induction
2 \ 1
unbumed AI/M0O3
Figure 12. Proposed stmcture of reaction wave in nano-composite thermites.
25
For comparison, binaiy composite thermites composed of micron-scale and larger
particles exhibit bum rates on the order of 10 mm/s (Brown et al., 1998). Also, at one
atinosphere pressure HMX bums at 2 cm/s and detonates at 9000 m/s (Son et al., 2000).
The bum rate of tiie nano-AlMoOj composites stiidied here fall in between tiiese two
energetic material regimes at approximately 900 m/s. Therefore, these results show tiiat
nano-scale thermite composites exhibit burning behaviors significantly faster than
fraditional pyrotechnics and tiiennites and almost on tiie order of explosives. These
results also suggest that fast buming nanocomposites may allow one to tailor reactive
power by controlling the Al particle diameter and corresponding reaction rate. The ability
to tailor the reactive power of a mixture to a specific application would be highly
beneficial for both military and industiial purposes. The term reactive-power describesthe
energy release rate from a given reaction. Reactive power is defined by tiie following
relationship and is expressed in terms of kW.
P o w e r = (AHcoinb)(Uavg)(pbulk)(Across-section) ( 3 )
AHcomb is the heat of combustion for the AI+M0O3 reaction, Uavg is the average
bum rate, pbuik is the bulk density of the powder, and Across-section is the area perpendicular
to the direction of flame propagation, and in this case, is the cross-sectional area of the
tube. Reactive powers for these nano-composites ranged from over 600 kW in the
experiments that combined lower densities and the slower bum rates to over 1000 kW for
the higher density, high speed experiments. These values are several orders of magnitude
smaller than the 6.72x10^ kW that would be released from a typical explosive. For
26
example. Composition B (59.5% RDX, 39.5% TNT, 1% wax) has a detonation velocity
m excess of 9 km/s that conti-ibutes to a large reactive power. Conversely, micron-scale
thermite composites exhibit very low reactive power due to bum rates on tiie order of 10
mm/s. For tiie Comp B, detonation velocity in excess of 9 km/s is responsible for its large
reactive power. Conversely, reaction velocities of approximately 10 mm/s (Brown, 1998)
result in tiie very small reactive power of micron-scale thermites.
Based on the bum rate and pressure measurements, the following theory is
postulated for the mechanisms involved in the Al and M0O3 powder reaction. The first
stage for this reaction is inert heating of the mixture, primarily from convective heat
transfer, but possibly from acoustic shock as well. The melting point for Al is 660°C and
M0O3 begins to sublime at 700°C. The Al particles are actually surrounded by a 2-4 nm
thick AI2O3 passivation shell. This layer is porous and very stable, with a melting
temperature of 2054 °C. At high temperatures, molten Al and gaseous M0O3 may then
permeate the shell and diffuse toward each other. High pressures can then force the AI2O3
passivation shell to fragment. The mptmring of the shell allows more molten Al to
become exposed to oxidizer. Thermal decomposition of the M0O3 ensues and reactions
between Al and M0O3, M0O2, and O2 as well as intermediates result in the production of
AI2O3 and Mo.
27
CHAPTER V
CONCLUSIONS
The effect of Al particle size on bum rate was examined for nano-scale Al
particles reacting with M0O3. The average bum rate was found to increase from
approximately 750 m/s to 950 m/s when tiie particle size was decreased from 121 nm to
80 nm. Below 80 nm, to 44 nm, further increases m bum rate were not observed. One
factor contributing to the increased bum rate with decreasing particle size is the
corresponding increased intimacy between fuel and oxidizer in the mixture. SEM
micrographs show how smaller particle diameter Al mixtures generally exhibit more
intimate contact between fuel and oxidizer particles. It was fiirther observed that tiie
smallest diameter Al mixtures also exhibit the most consistency in diffusion distances
between fiiel and oxidizer particles. This increased consistency may also be the cause of
the smallest Al particle mixture's smaller variations in bum rate. As the mixtures' TMD
increases, more reactants are present in the constant-volume experiments and the values
for maximum pressure are increased. Less variability in bum rate is also observed with
increasing TMD.
Pressure histories and buming behavior also indicate that convection plays a
significant role in the propagation of the reaction in powder media and is most hkely the
mechanism that controls bum rate. Along with convection, acoustic mechanisms may
play a significant role in reaction propagation. Regarding the reaction mechanism
between Al and M0O3, it was determined that M0O3 sublimes at approximately the same
28

temperature as Al melts. The gaseous build up of M0O3 may be responsible for the
increase in pressure measured during reaction propagation. This gas build up may help
propel unreacted fiiel and oxidizer forward and ultimately enhances flame propagation
and increases the bum rate.
29

CHAPTER VI
IMPLICATIONS AND FUTURE RESEARCH
Previous works have proven that nano-composite thermites are viable altematives to
lead compounds for use in ignition devices such as primers and electiic matches where
only small quantities are needed.() There is a large potential for use in otiier miUtary and
industiial applications, but fiirtiier research is needed to detennine how to best facilitate
scale-up for use in larger quantities. There is currently much effort being applied to
addressing safety issues related to friction and spark sensitivity.
It has been shown in this paper tiiat nano-composite thermites exhibit very fast bum
rates when confined at low desities (5-10% TMD) and related works have shown the
nano-composites' slower bum rates at higher densities (38% TMD). (Granier, 2003) The
difficulties of preparing intermediate-density samples account for the absence of data in
the intermediate density range. In fiiture research, this data would prove exfremely usefiil
in tmderstanding the transition between the low and high-density reaction mechanisms. In
addition to this data, measurements that were beyond the collection capabilities of these
experiments include local temperature and gas-density values that coincide with the
pressure wave data. This information would provide definitive information about the role
of an acoustic mechanism in the reaction.
30
REFERENCES
1. L_L Wang, Z.A. Munir, Y.M. Maximov, "Thermite Reactions: Their UtUization in tiie Synthesis and Processing of Materials," Journal of Material Science (1993).
2. P.R. Taylor and E.E. Vidal, "Thennal Plasma Syntiiesis of Ceramic Powders," Powder Materials: Current Research and Industrial Practices Ed F D S Marquis, TMS, 173-85 (1999).
3. M. Boulos, The Inductively Coupled R.F. (Radio Frequency) Plasma Pure & AppL Chem. 57, 1321 (1985).
4. C.G. Granquist and R.A. Buhrman, "Utoafme Metal Particles," Journal of Appl. Phys. 47(5), 2200-2219 (1976).
5 . J.A. Puszynski, "Formation, Characterization, and Reactivity of Nanoenergetic Powders," 2^^ International Pyrotechnics Seminar Westininster, CO, USA (2002).
6. Rugunanan R.A., and Brown, M.E., "Combustion of Binary and Temary Silicon/Oxidant Pyrotechnic Systems, Part I: Binary Systems with Fe203 and Sn02 as Oxidants," Comb. Sc. & Tech. 95:61-83 (1994).
7. Brown, M.E., Taylor, S.J., and Tribelhom, M.J., "Fuel-Oxidant Particle Contact in Binary Pyrotechnic Reactions," Propellants, Explosives, Pyrotechnics 23: 320-327 (1998).
8. Shimizu, A. and Saitou, J., "Effect of Contact Points Between Particles on the Reaction Rate in tiie Fe203-W205 System," Solid State Ionics 38:261-269 (1990).
9. Aumann, C.E., Skofronick, G.L., and Martin, J.A., "Oxidation Behavior of Aluminum Nanopowders," Journal of Vacuum Science & Technology B 13(2): 1178-1183(1995).
10. Granier, J.J., "Laser Ignition Study of Nano-composite AI/M0O3", Texas Tech University, Lubbock, TX (2003)
11. Hogg, R. V., Ledolter, Johannes, Applied Statistics for Engineers and Physical Scientists, T^ ed., Macmillan PubUshing Company, New York, NY (1992).
31

12. Tomasi, R. and Munir, Z., "Effect of Particle Size on the Reaction Wave Propagation in tiie Combustion Synthesis of Al203-Zr02-Nb Composites," J. Am. Ceram. Soc. 82(8): 1985-1992 (1999).
13. Makino, A. and Law, C. K., "Heterogeneous Flame Propagation in tiie Self-Propagating High-Temperature Synthesis (SHS) Process: Theory and Experimental Comparisons," Twenty-Fourth Symposium (International) on Combustion, The Combustion Institute, Pittsburgh, PA, 1883 (1992).
14. Glassman, I., Combustion, 3"^ ed.. Academic Press, California (1996).
15. S. F. Son, H. L., B. W. Asay, J. R. Busse, B. S. Jorgensen, B. Bockmon, and M. Pantoya, "Reaction Propagation Physics of AI/M0O3 Nanocomposite Thermites," The Twenty-Eighth International Pyrotechnics Seminar, The Intemational Pyrotechnics Society, Adelaide, Ausfralia, November 4-9 (2001).
16. Margolis S. and Telengator, A. M., "Influence of Sublimation and Pyrolysis on Quasi Steady Deflagrations in Confined Porous Energetic Materials," Comb. Flame 127: 2135-3156 (2001)
17. Son, S. F., Berghout, H. L., Bohne, C. A., Chavez, D. E., Naud, D., Hiskey, M. A., Symposium (Intemational) on Combustion, 28th International Symposium on Combustion 28(1): 919-924 (2000).
18. Son, S.F., Hiskey, M.A., Naud, D. L., Busse, J.R., Asay, B.W., "Lead-Free Electric Matches", The Twenty-Ninth International Pyrotechnics Seminar, The Intemational Pyrotechnics Society, Westmmster, CO, USA, July (2002)
32

PERMISSION TO COPY
In presenting tiiis tiiesis in partial fiilfilhnent of tiie requirements for a
master's degree at Texas Tech University or Texas Tech University Healtii Sciences
Center, I agree that the Library and my major department shall make it freely
available for research purposes. Permission to copy this thesis for scholarly purposes
may be granted by the Director of the Library or my major professor. It is
understood that any copying or publication of this thesis for financial gain shall not
be allowed without my fiirther written permission and that any user may be Uable for
copyright iofiingement.
Agree (Permission is granted.)
S^dent Signature Date
Disagree (Permission is not granted.)
Student Signature Date