BRRH Corporation and Affiliates Management’s Discussion ...
39
BRRH Corporation and Affiliates Management’s Discussion and Analysis of Financial Condition and Results of Operations For the Quarter Ended December 31, 2018 Page 1 of 19 INTRODUCTION The information contained herein is being filed by BRRH Corporation and Affiliates (BRRH) for the purpose of complying with its obligations under the Continuing Disclosure Undertaking entered into in connection with the issuance of $89,570,000 of Palm Beach County Health Facilities Authority Hospital Revenue Refunding Bonds, Series 2014. BRRH includes the following principal entities: Boca Raton Regional Hospital, Inc. (Hospital), a not-for-profit corporation. BRRH Corporation (Corporation), a not-for-profit, parent holding company and sole voting member of the Hospital and Foundation. Boca Raton Regional Hospital Foundation, Inc. (Foundation), a not-for-profit corporation formed to raise funds to support the Hospital and other related organizations. BocaCare, Inc. (BocaCare), a taxable not-for-profit corporation formed to operate a primary care network of physician practices. Other affiliates within the BRRH consolidated entity include: BRRH Home Health Services, Inc., a not-for-profit, full service home health agency formed to assist the Hospital in the furtherance of specialized home care; BRRH Oaks Plaza, LLC, a limited liability company and owner of medical office properties; and Palm Accountable Care Organization, LLC, a limited liability company that was formed to perform, advance, and support the charitable, educational, and scientific missions of the Hospital, its affiliated entities, and the communities they serve. The Corporation and the Hospital are the members of the Obligated Group under the Master Trust Indenture dated September 1, 2014. Pursuant to the Master Trust Indenture and First Supplemental Master Trust Indenture, the Foundation, a Designated Affiliate, can be directed by the members of the Obligated Group to transfer funds, as necessary, to pay principal and interest on its long term debt in accordance with its terms. The Corporation, the Hospital and the Foundation represent 95% of the total revenues of BRRH. As of December 31, 2018, $66.1 million of the Palm Beach County Health Facilities Authority Hospital Revenue Refunding Bonds, Series 2014, is outstanding. The following financial data as of and for the quarters ended December 31, 2018 and 2017, is derived from the unaudited, consolidated financial statements of BRRH. Operating results for the quarter ended December 31, 2018 are not necessarily indicative of the results that may be expected for any future periods.
Transcript of BRRH Corporation and Affiliates Management’s Discussion ...

BRRH Corporation and Affiliates Management’s Discussion and Analysis of
Financial Condition and Results of Operations
For the Quarter Ended December 31, 2018
Page 1 of 19
INTRODUCTION
The information contained herein is being filed by BRRH Corporation and Affiliates (BRRH) for the purpose of complying with its obligations under the Continuing Disclosure Undertaking entered into in connection with the issuance of $89,570,000 of Palm Beach County Health Facilities Authority Hospital Revenue Refunding Bonds, Series 2014. BRRH includes the following principal entities: Boca Raton Regional Hospital, Inc. (Hospital), a not-for-profit corporation. BRRH Corporation (Corporation), a not-for-profit, parent holding company and sole voting
member of the Hospital and Foundation. Boca Raton Regional Hospital Foundation, Inc. (Foundation), a not-for-profit corporation
formed to raise funds to support the Hospital and other related organizations. BocaCare, Inc. (BocaCare), a taxable not-for-profit corporation formed to operate a primary
care network of physician practices.
Other affiliates within the BRRH consolidated entity include: BRRH Home Health Services, Inc., a not-for-profit, full service home health agency formed to assist the Hospital in the furtherance of specialized home care; BRRH Oaks Plaza, LLC, a limited liability company and owner of medical office properties; and Palm Accountable Care Organization, LLC, a limited liability company that was formed to perform, advance, and support the charitable, educational, and scientific missions of the Hospital, its affiliated entities, and the communities they serve.
The Corporation and the Hospital are the members of the Obligated Group under the Master Trust Indenture dated September 1, 2014. Pursuant to the Master Trust Indenture and First Supplemental Master Trust Indenture, the Foundation, a Designated Affiliate, can be directed by the members of the Obligated Group to transfer funds, as necessary, to pay principal and interest on its long term debt in accordance with its terms. The Corporation, the Hospital and the Foundation represent 95% of the total revenues of BRRH. As of December 31, 2018, $66.1 million of the Palm Beach County Health Facilities Authority Hospital Revenue Refunding Bonds, Series 2014, is outstanding.
The following financial data as of and for the quarters ended December 31, 2018 and 2017, is derived from the unaudited, consolidated financial statements of BRRH. Operating results for the quarter ended December 31, 2018 are not necessarily indicative of the results that may be expected for any future periods.

BRRH Corporation and Affiliates Management’s Discussion and Analysis of
Financial Condition and Results of Operations
For the Quarter Ended December 31, 2018
Page 2 of 19
EXECUTIVE SUMMARY BRRH reported an operating income of $2.5 million for the quarter ended December 31, 2018 as compared to an operating income of $3.5 million in the same quarter of fiscal year 2018. The overall financial results for the quarter were impacted by a favorable case and payer mix, reduced length of stay, patient volumes reflecting continued growth over the prior year, and a favorable impact of the clinical documentation improvement initiative (CDI). These improvements were offset by a decrease in other operating revenue. The net loss for the quarter was $7.3 million, compared to a net income of $6.5 million in the same quarter of the prior year. The current year net loss included $8.8 million net realized and unrealized investment losses, due to a decline in market conditions. The prior year included $3.6 million of net realized and unrealized investment gains. The current year net loss also included $0.4 million of expenses related to the strategic partnership process, described in the Strategic Affiliations section below, as compared to $0.1 million incurred in the prior year. BRRH is an advanced academic tertiary institution with an expanding geographic reach, growing market share, and a reputation for excellence in patient care and satisfaction. BRRH has continued to make investments in clinical programs focusing resources and growth initiatives in neurosciences, oncology, cardiac services, women’s services and physician integration:
The Marcus Neuroscience Institute is one of a select number of neurological institutes nationally that has access to both intraoperative MRI and intraoperative CT for use in advanced neurosurgical procedures of the brain and spine. Program development and service expansion included the recruitment of three physicians during the first quarter of fiscal year 2019. The primary focus of the Institute during fiscal year 2019 is on the growth of subspecialties in neurovascular/stroke, central nervous system tumor, spine/pain, epilepsy and seizure disorders, and Multiple Sclerosis, as well as the addition of new clinical trials for brain tumors.
The Christine E. Lynn Heart & Vascular Institute introduced two new procedures over the last year for patients unable to undergo open heart surgery, Transcatheter Aortic Valve Repair (TAVR) and Transcatheter Mitral Valve Repair (TMVR); additionally, BRRH was the first hospital in Palm Beach County to offer the world’s smallest pacemaker for patients with bradycardia, the Medtronic Micra® Transcatheter Pacing System.
The Christine E. Lynn Women’s Health and Wellness Institute is home to five centers of excellence, including the Schmidt Center for Breast Care, the Jean and David Blechman Center for Specialty Care, the Phyllis Sandler Center for Living Well, the Barbara Gutin Center for Pelvic Health and the Center for Imaging. The Women’s Institute has evolved into a sophisticated, multi-disciplinary center for the diagnosis and treatment of the entire range of women’s medical needs.

BRRH Corporation and Affiliates Management’s Discussion and Analysis of
Financial Condition and Results of Operations
For the Quarter Ended December 31, 2018
Page 3 of 19
The Hospital initiated and designed its BocaCare Physician Network to strengthen the relationship between the physicians and the Hospital, expand market reach, and moderate the seasonality and Medicare dependence of the organization. BocaCare is comprised of 97 providers (71 physicians, 15 mid-levels and 11 faculty preceptors) practicing in 27 specialty areas at 35 locations within Palm Beach and Broward Counties.
The Gloria Drummond Physical Rehabilitation Institute has been operating in its newly renovated space for 18 months. Services including outpatient rehabilitation services, cardiac and pulmonary rehabilitation, diabetes education and nutrition, wound care and hyperbaric medicine are housed in a 35,000 square foot state-of-the-art ambulatory facility.
The Florida Atlantic University (FAU) College of Medicine Graduate Medical Education Consortium (the “GME Consortium”) is comprised of three health system partners, including BRRH as the principal facility for the internal medicine, surgery and neurology residency programs. The newly approved neurology residency program began July 1, 2018.
The Foundation was established in 1984 to raise funds to support the Hospital’s mission
of providing superior, compassionate health care through the cultivation and stewardship of philanthropic gifts and raising the public’s awareness of the Hospital and its related organizations, programs and services. During the first half of fiscal year 2019, the Foundation raised 3,100 gifts totaling $30.1 million in cash and pledges, of which $10.3 million has not been recorded in the financial statements due to timing or other conditions.
The Hospital is the recipient of numerous awards and accolades. Most recently, the hospital was listed by U.S. News & World Report for the fourth consecutive year as a Top-Ranked Regional Hospital in South Florida. BRRH is ranked #1 in Palm Beach County, #3 in the Miami–Ft. Lauderdale metro area and #13 in Florida.
In December 2018, respectively, Fitch Ratings upgraded the Hospital’s rating to A-, with a Positive outlook. The prior rating was BBB+ with a Stable outlook. Standard & Poor’s Ratings Services (S&P) currently rates BRRH as BBB+ with a Stable outlook, and is scheduled to complete their annual review during the third quarter of fiscal year 2019.

BRRH Corporation and Affiliates Management’s Discussion and Analysis of
Financial Condition and Results of Operations
For the Quarter Ended December 31, 2018
Page 4 of 19
MANAGEMENT DISCUSSION AND ANALYSIS
Consolidated Statement of Revenue and Expenses (Summarized) (in $000’s)
(Amounts in $000’s) 2018 2017 2018 2017
Net patient revenue 138,448$ 126,803$ 263,525$ 239,418$
Other revenue 3,110 5,510 5,586 8,968
Total operating revenue 141,558 132,313 269,111 248,386
Salaries, wages and benefits 62,264 58,568 122,509 116,139
Supplies 45,066 37,752 83,699 71,657 Physician fees, professional fees and purchased services 14,895 16,574 29,753 31,062
Insurance and other expenses 9,622 8,742 18,706 17,447
Depreciation and amortization 6,370 6,352 12,788 12,791
Interest 828 788 1,685 1,515
Total expenses 139,045 128,776 269,140 250,611
Operating Income (Loss) 2,513 3,537 (29) (2,225)
Other non-operating items (net) (9,766) 2,932 (9,051) 5,929
Net Income (Loss) (7,253)$ 6,469$ (9,080)$ 3,704$
December 31
For the Quarter Ended For the Year Ended
December 31
BRRH Corporation and Affiliates Management’s Discussion and Analysis of
Financial Condition and Results of Operations
For the Quarter Ended December 31, 2018
Page 5 of 19
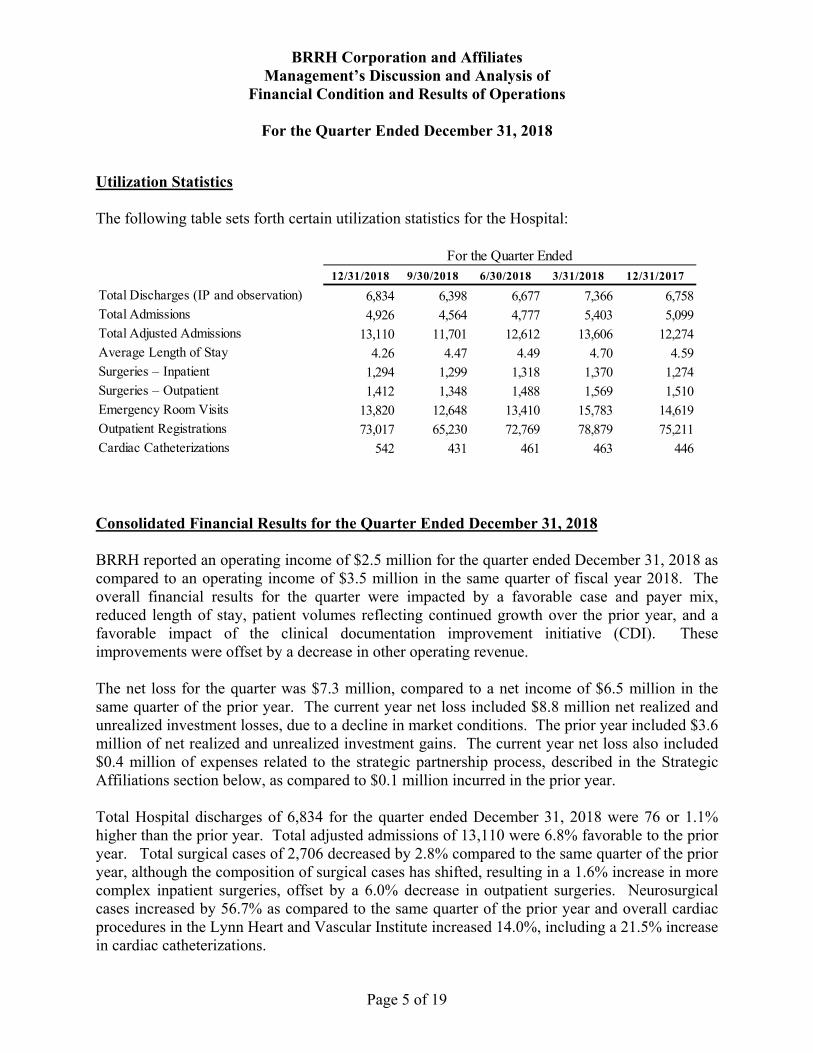
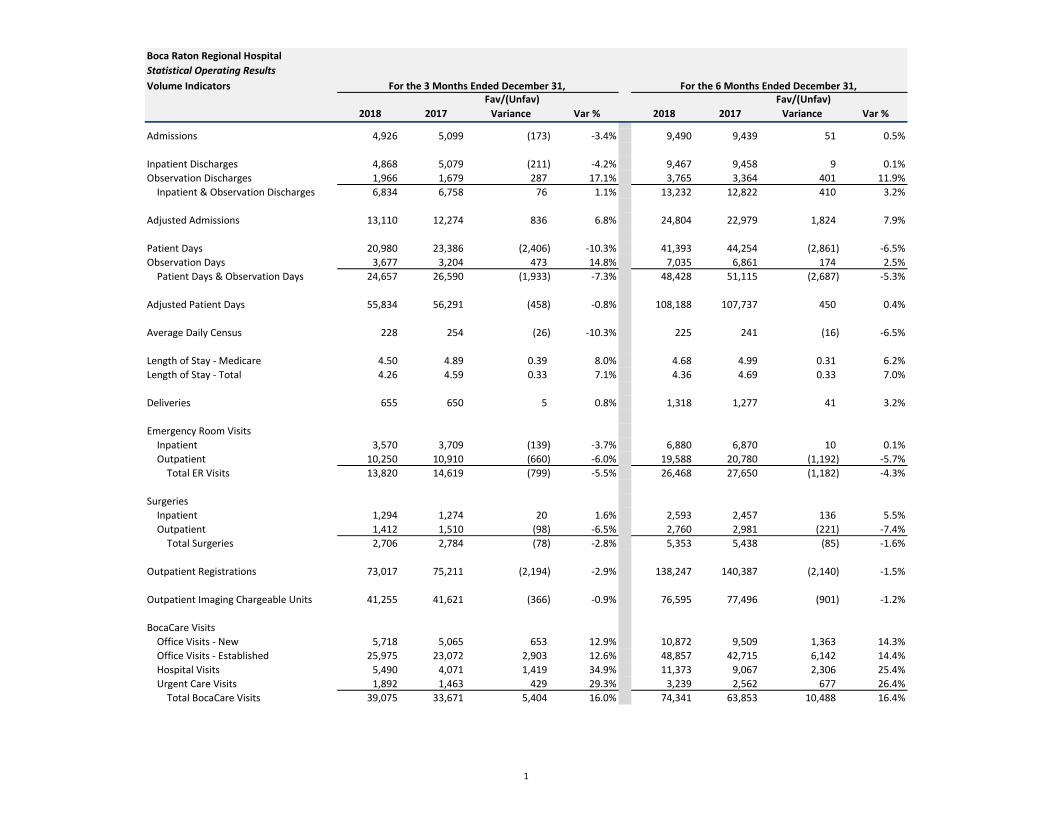
Utilization Statistics The following table sets forth certain utilization statistics for the Hospital:
Consolidated Financial Results for the Quarter Ended December 31, 2018 BRRH reported an operating income of $2.5 million for the quarter ended December 31, 2018 as compared to an operating income of $3.5 million in the same quarter of fiscal year 2018. The overall financial results for the quarter were impacted by a favorable case and payer mix, reduced length of stay, patient volumes reflecting continued growth over the prior year, and a favorable impact of the clinical documentation improvement initiative (CDI). These improvements were offset by a decrease in other operating revenue. The net loss for the quarter was $7.3 million, compared to a net income of $6.5 million in the same quarter of the prior year. The current year net loss included $8.8 million net realized and unrealized investment losses, due to a decline in market conditions. The prior year included $3.6 million of net realized and unrealized investment gains. The current year net loss also included $0.4 million of expenses related to the strategic partnership process, described in the Strategic Affiliations section below, as compared to $0.1 million incurred in the prior year. Total Hospital discharges of 6,834 for the quarter ended December 31, 2018 were 76 or 1.1% higher than the prior year. Total adjusted admissions of 13,110 were 6.8% favorable to the prior year. Total surgical cases of 2,706 decreased by 2.8% compared to the same quarter of the prior year, although the composition of surgical cases has shifted, resulting in a 1.6% increase in more complex inpatient surgeries, offset by a 6.0% decrease in outpatient surgeries. Neurosurgical cases increased by 56.7% as compared to the same quarter of the prior year and overall cardiac procedures in the Lynn Heart and Vascular Institute increased 14.0%, including a 21.5% increase in cardiac catheterizations.
12/31/2018 9/30/2018 6/30/2018 3/31/2018 12/31/2017
Total Discharges (IP and observation) 6,834 6,398 6,677 7,366 6,758Total Admissions 4,926 4,564 4,777 5,403 5,099Total Adjusted Admissions 13,110 11,701 12,612 13,606 12,274Average Length of Stay 4.26 4.47 4.49 4.70 4.59Surgeries – Inpatient 1,294 1,299 1,318 1,370 1,274Surgeries – Outpatient 1,412 1,348 1,488 1,569 1,510Emergency Room Visits 13,820 12,648 13,410 15,783 14,619Outpatient Registrations 73,017 65,230 72,769 78,879 75,211Cardiac Catheterizations 542 431 461 463 446
For the Quarter Ended

BRRH Corporation and Affiliates Management’s Discussion and Analysis of
Financial Condition and Results of Operations
For the Quarter Ended December 31, 2018
Page 6 of 19
Ancillary volume statistics demonstrated improvement in most areas as compared to the same quarter of the prior year. BocaCare physician visits increased by 16.0%, medical oncology volumes increased by 14.8%, and outpatient physical rehabilitation volumes increased by 21.4%. Outpatient imaging volumes (excluding women’s imaging services) were flat, while women’s imaging volumes increased by 11.9%. Radiation oncology procedures decreased by 19.6% due to the recent opening of a competing center in the area by the hospital’s former medical director. Net patient service revenue increased by $11.6 million or 9.2% compared to the same quarter of the prior year, due to the overall increase in patient volumes, certain rate increases, the implementation of clinical documentation improvement initiatives, and graduate medical education reimbursement related to the growth of the internal medicine, surgery and neurology residency programs. Other operating revenue decreased by $2.4 million due to lower levels of restricted funding used for operations. Total operating revenue, inclusive of net patient service revenue, increased by $9.2 million, or 7.0%. Total operating expenses of $139.0 million were $10.3 million or 8.0% higher than the same quarter of the prior year. Major variances are described as follows:
Salaries, wages and benefits of $62.3 million were $3.7 million or 6.3% higher than the same quarter of the prior year, due primarily to increased patient volumes and an increase in the number of employed physicians in BocaCare. Hospital labor expense as a percentage of net patient service revenue decreased from 40.6% in the prior year to 38.6% for the second quarter.
Supplies expense of $45.1 million was $7.3 million or 19.4% higher than the same quarter of the prior year as a result of increased patient volumes, particularly in supply costs for more complex surgical cases, and pharmacy expenses related to the increased volume in medical oncology services.
Physician fees, professional fees and purchased services were $1.7 million, or 10.1% lower as compared to the same period of the prior year. During the prior year, $0.9 million in support costs was incurred related to the go-live of the Cerner clinical information system.
Insurance and other expenses of $9.6 million were $0.9 million or 10.1% higher than the same period of the prior year, primarily due to increased self-insurance malpractice claims exposure.
A net non-operating loss of $9.8 million was $12.7 million unfavorable to the same quarter of the prior year. Non-operating expenses included $0.4 million of costs incurred related to the strategic partnership process, described in the Strategic Affiliations section below. The current year results included $12.5 million higher net realized and unrealized losses on investment values as compared to the same quarter of the prior year, due to a decline in market conditions.
BRRH Corporation and Affiliates Management’s Discussion and Analysis of
Financial Condition and Results of Operations
For the Quarter Ended December 31, 2018
Page 7 of 19
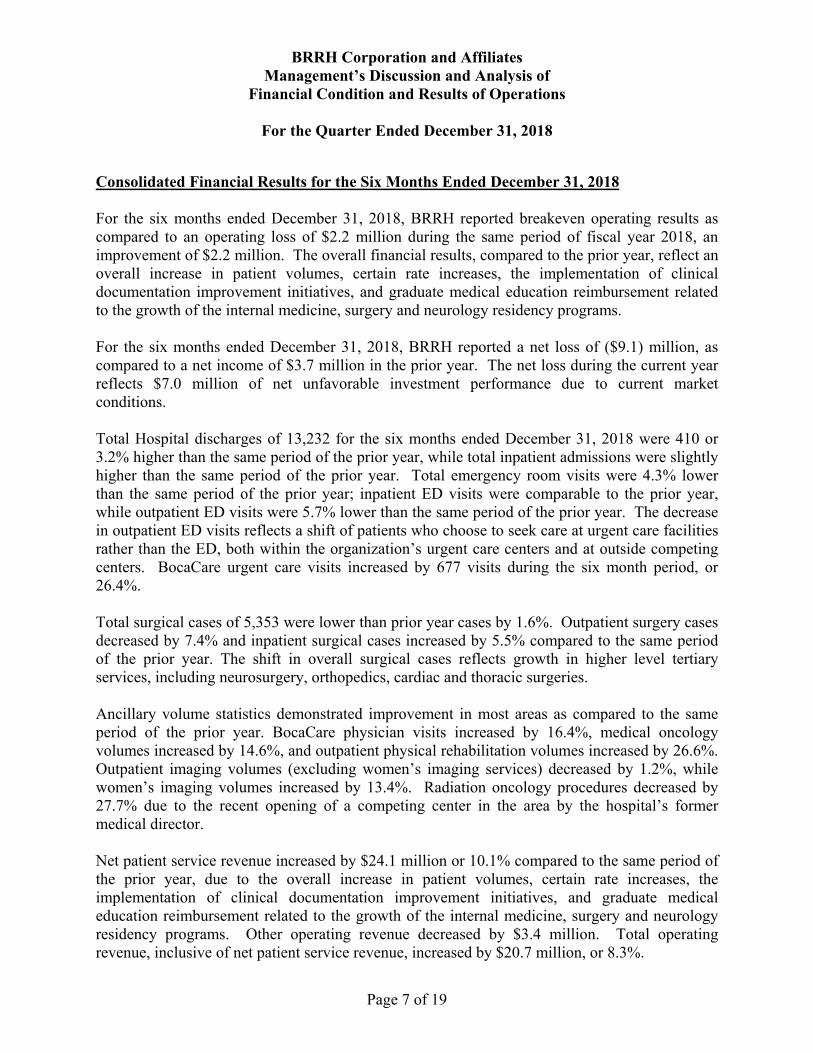
Consolidated Financial Results for the Six Months Ended December 31, 2018 For the six months ended December 31, 2018, BRRH reported breakeven operating results as compared to an operating loss of $2.2 million during the same period of fiscal year 2018, an improvement of $2.2 million. The overall financial results, compared to the prior year, reflect an overall increase in patient volumes, certain rate increases, the implementation of clinical documentation improvement initiatives, and graduate medical education reimbursement related to the growth of the internal medicine, surgery and neurology residency programs. For the six months ended December 31, 2018, BRRH reported a net loss of ($9.1) million, as compared to a net income of $3.7 million in the prior year. The net loss during the current year reflects $7.0 million of net unfavorable investment performance due to current market conditions. Total Hospital discharges of 13,232 for the six months ended December 31, 2018 were 410 or 3.2% higher than the same period of the prior year, while total inpatient admissions were slightly higher than the same period of the prior year. Total emergency room visits were 4.3% lower than the same period of the prior year; inpatient ED visits were comparable to the prior year, while outpatient ED visits were 5.7% lower than the same period of the prior year. The decrease in outpatient ED visits reflects a shift of patients who choose to seek care at urgent care facilities rather than the ED, both within the organization’s urgent care centers and at outside competing centers. BocaCare urgent care visits increased by 677 visits during the six month period, or 26.4%. Total surgical cases of 5,353 were lower than prior year cases by 1.6%. Outpatient surgery cases decreased by 7.4% and inpatient surgical cases increased by 5.5% compared to the same period of the prior year. The shift in overall surgical cases reflects growth in higher level tertiary services, including neurosurgery, orthopedics, cardiac and thoracic surgeries. Ancillary volume statistics demonstrated improvement in most areas as compared to the same period of the prior year. BocaCare physician visits increased by 16.4%, medical oncology volumes increased by 14.6%, and outpatient physical rehabilitation volumes increased by 26.6%. Outpatient imaging volumes (excluding women’s imaging services) decreased by 1.2%, while women’s imaging volumes increased by 13.4%. Radiation oncology procedures decreased by 27.7% due to the recent opening of a competing center in the area by the hospital’s former medical director. Net patient service revenue increased by $24.1 million or 10.1% compared to the same period of the prior year, due to the overall increase in patient volumes, certain rate increases, the implementation of clinical documentation improvement initiatives, and graduate medical education reimbursement related to the growth of the internal medicine, surgery and neurology residency programs. Other operating revenue decreased by $3.4 million. Total operating revenue, inclusive of net patient service revenue, increased by $20.7 million, or 8.3%.
BRRH Corporation and Affiliates Management’s Discussion and Analysis of
Financial Condition and Results of Operations
For the Quarter Ended December 31, 2018
Page 8 of 19
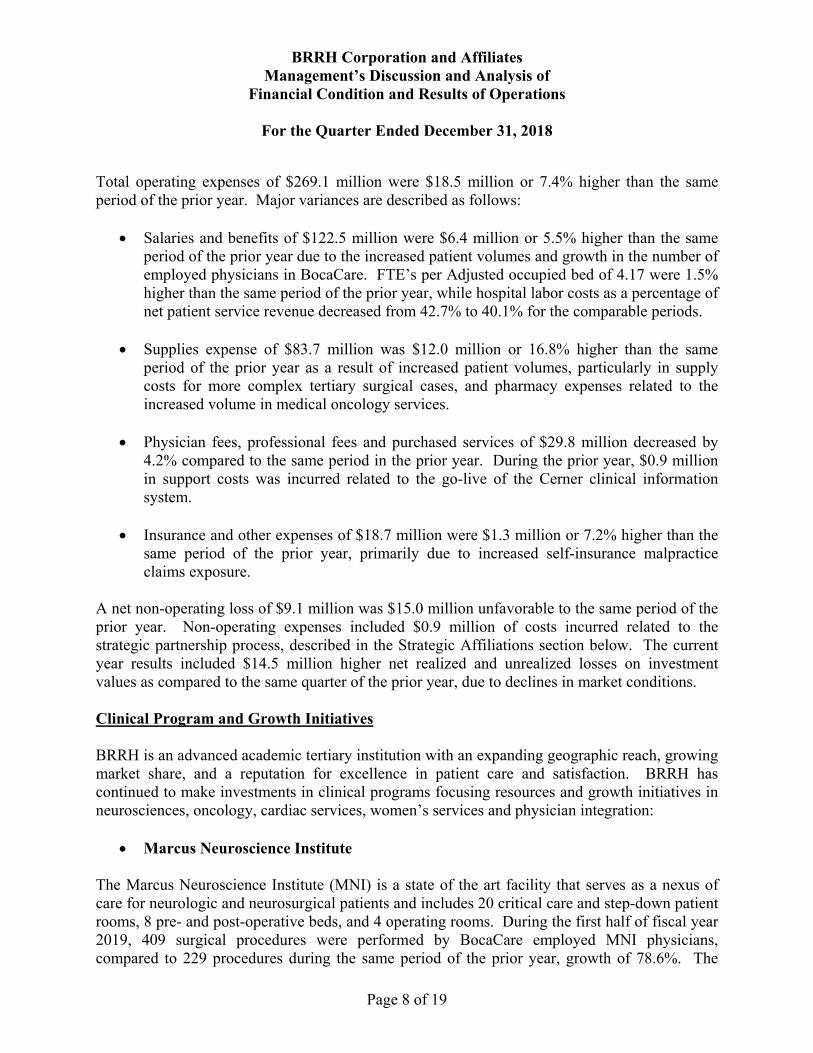
Total operating expenses of $269.1 million were $18.5 million or 7.4% higher than the same period of the prior year. Major variances are described as follows:
Salaries and benefits of $122.5 million were $6.4 million or 5.5% higher than the same period of the prior year due to the increased patient volumes and growth in the number of employed physicians in BocaCare. FTE’s per Adjusted occupied bed of 4.17 were 1.5% higher than the same period of the prior year, while hospital labor costs as a percentage of net patient service revenue decreased from 42.7% to 40.1% for the comparable periods.
Supplies expense of $83.7 million was $12.0 million or 16.8% higher than the same period of the prior year as a result of increased patient volumes, particularly in supply costs for more complex tertiary surgical cases, and pharmacy expenses related to the increased volume in medical oncology services.
Physician fees, professional fees and purchased services of $29.8 million decreased by 4.2% compared to the same period in the prior year. During the prior year, $0.9 million in support costs was incurred related to the go-live of the Cerner clinical information system.
Insurance and other expenses of $18.7 million were $1.3 million or 7.2% higher than the same period of the prior year, primarily due to increased self-insurance malpractice claims exposure.
A net non-operating loss of $9.1 million was $15.0 million unfavorable to the same period of the prior year. Non-operating expenses included $0.9 million of costs incurred related to the strategic partnership process, described in the Strategic Affiliations section below. The current year results included $14.5 million higher net realized and unrealized losses on investment values as compared to the same quarter of the prior year, due to declines in market conditions. Clinical Program and Growth Initiatives BRRH is an advanced academic tertiary institution with an expanding geographic reach, growing market share, and a reputation for excellence in patient care and satisfaction. BRRH has continued to make investments in clinical programs focusing resources and growth initiatives in neurosciences, oncology, cardiac services, women’s services and physician integration:
Marcus Neuroscience Institute The Marcus Neuroscience Institute (MNI) is a state of the art facility that serves as a nexus of care for neurologic and neurosurgical patients and includes 20 critical care and step-down patient rooms, 8 pre- and post-operative beds, and 4 operating rooms. During the first half of fiscal year 2019, 409 surgical procedures were performed by BocaCare employed MNI physicians, compared to 229 procedures during the same period of the prior year, growth of 78.6%. The

BRRH Corporation and Affiliates Management’s Discussion and Analysis of
Financial Condition and Results of Operations
For the Quarter Ended December 31, 2018
Page 9 of 19
institute is one of a select number of hospitals nationally that has both intraoperative MRI and intraoperative CT for use in advanced neurosurgical procedures of the brain and spine. Program leadership was focused on program development and service expansion starting in fiscal year 2018, which included the recruitment of two established community neurosurgeons and five respected area neurologists, the addition of tele-stroke services, and the establishment of an MNI satellite office located at the Deerfield Ambulatory Care Center. Three new physicians were hired in the first quarter of fiscal year 2019: Dr. Timothy Miller, Functional Neurosurgery, Dr. Brian Snelling, Endovascular/Cerebrovascular Neurosurgery and Dr. Joshua Chalkley, Multiple Sclerosis specialist. The primary focus of the Institute during fiscal year 2019 is on the growth of subspecialties in neurovascular/stroke, central nervous system tumor, spine/pain, epilepsy and seizure disorders, and Multiple Sclerosis, as well as the addition of new clinical trials for brain tumors. The BocaCare MNI Practice visits grew to 14,130 visits during the first half of fiscal year 2019, compared to 10,971 visits during the same period of the prior year, growth of 28.8%. BRRH has received the American Heart Association/American Stroke Association’s Get With The Guidelines®-Stroke Gold Plus Quality Achievement Award. The award recognizes the hospital’s commitment to ensuring stroke patients receive the most appropriate treatment according to nationally recognized, research-based guidelines based on the latest scientific evidence. An epilepsy monitoring unit, designed to evaluate, diagnose and treat intractable seizures in adult patients, was established in January 2018 and has resulted in increased referral volumes and treatment of intractable seizure patients. MNI has established a plan for their Comprehensive Spine/Pain program which will kick off by recruitment and hiring of a strong Nurse navigator. Although already an AHCA Comprehensive Stroke Program in the state of FL, in March 2018, BRRH/MNI achieved a successful Joint Commission survey as a Primary Stroke Center. Plans for moving forward to be a Thrombectory capable Stroke Center are underway and the Joint Commission will be coming back to resurvey as early as the third quarter of fiscal year 2019.
Christine E. Lynn Heart & Vascular Institute
The Lynn Heart and Vascular Institute had overall growth of 16.6% during the first half of fiscal year 2019, compared to the same period of the prior year. The Institute’s cardiac surgery program remains robust. Last year, the Structural Heart Disease Intervention program introduced two new procedures to patients unable to undergo open heart surgery: Transcatheter Aortic Valve Repair (TAVR) and Transcatheter Mitral Valve Repair (TMVR). The Arrhythmia Center was the first hospital in Palm Beach County to offer the world’s smallest pacemaker for patients with bradycardia. The Medtronic Micra® Transcatheter Pacing System (TPS) is a new type of heart device that provides patients with the most advanced pacing technology at one-tenth the size of a traditional pacemaker.
BRRH Corporation and Affiliates Management’s Discussion and Analysis of
Financial Condition and Results of Operations
For the Quarter Ended December 31, 2018
Page 10 of 19
BRRH has purchased a CardioInsight Noninvasive 3D Mapping System which is a non-invasive mapping system that collects chest ECG signals prior to the procedure by the patient wearing a vest. The mapping enables physicians to more accurately characterize abnormal rhythms of the heart.
The Vascular surgery program provides cutting-edge, tertiary care treatments, and is one of only nine sites in the nation providing endovascular repair of thoracoabdominal aortic aneurysms. This revolutionary therapy is performed in a minimally-invasive manner with two small groin incisions and a one-inch incision in the left armpit; the treatment is only available at nine sites nationwide. Traditional open heart surgery for these types of aneurysms can be extremely morbid and are associated with high mortality.
Eugene M. and Christine E. Lynn Cancer Institute The Hospital’s Eugene M. & Christine E. Lynn Cancer Institute (LCI) is one of the leading cancer centers in Florida and is accredited as a Comprehensive Cancer Center by the American College of Surgeons. More than 25 oncologists and a full complement of oncology professionals provide care at the Institute, which treats more than 4,000 newly diagnosed cancer patients each year in facilities such as the Harvey & Phyllis Sandler Pavilion, our state-of-the-art cancer center, as well as our satellite locations in Delray Beach. With a vision to be recognized as a national leader and the premier provider of cancer care in South Florida, LCI offers the latest technology, sophisticated diagnostic services and the most advanced cancer treatments available in medicine today. The Center for Hematology & Oncology (CHO) provides contracted physician and management services for LCI: LCI volumes for new patient visits continue to increase and were 7.5% higher during the first six months of fiscal year 2019, compared to the same period last year. Additionally, initial infusions were 14.6% higher during the first six months of this year as compared to the same period of the prior year. A new physician was added to the medical oncology team in fiscal year 2018, bringing the total number of Medical Oncology physicians practicing at LCI to 16 as compared to 10 physicians in 2008 when the center opened. Urological Oncology is expanding services. A second Board certified Urologist joined the LCI Surgical Oncology clinical space in the second quarter of fiscal year 2019. He brought a large patient practice with him and has helped bring additional patient volume and increased visibility to the Lynn Cancer Institute. A Prostate Health Center of Excellence is under development. Renovation and construction of a newly expanded space for the CHO lab and pharmacy departments is well underway with completion expected during the third quarter of fiscal year 2019. This will allow for continued growth of the medical oncology program as well as bring the pharmacy up to the USP 800 requirements expected of all pharmacies by next year. LCI will have one of the first USP 800 pharmacy’s in South Florida.

BRRH Corporation and Affiliates Management’s Discussion and Analysis of
Financial Condition and Results of Operations
For the Quarter Ended December 31, 2018
Page 11 of 19
During the first half of fiscal year 2019, the LCI research program increased the number of clinical research trials to 33, including new neuro-oncology and radiation therapy trials. They also opened a unique clinical trial for lung utilizing a vaccine – one of the first centers in the country to do this. In November 2018, the LCI research program successfully passed a routine audit by the National Cancer Institute.
Christine E. Lynn Women’s Health & Wellness Institute The Christine E. Lynn Women’s Health and Wellness Institute is a 46,000 square foot exquisitely designed facility which serves as a gateway for women in the community to access multidisciplinary services. The Lynn Women’s Institute is home to five centers of excellence including the Schmidt Family Foundation Center for Breast Care, Jean and David Blechman Center for Specialty Care and Preventive Cardiology, Phyllis Sandler Center for Living Well, Barbara Gutin Center for Pelvic Health, and the Ellman Center for Imaging.
Volumes continue to grow compared to the prior year. During the first half of fiscal year 2019, total women’s imaging procedures increased 13.4% as compared to the same period of the prior year. Patient Satisfaction remains at the 99th percentile of the Press Ganey results. New physicians have joined the Blechman Center for Specialty care including an additional fellowship trained breast surgeon and a Board Certified primary care physician. Programming continues to evolve and grow. The new MammoVan is allowing for increased outreach into the South Florida community including to more underserved parts of BRRH’s service area. Since opening in July 2015 more than 266,000 people have been to the Women’s Institute to receive service, or attend a special program or event.
Graduate Medical Education
The Florida Atlantic University (FAU) College of Medicine Graduate Medical Education Consortium (the “GME Consortium”) is comprised of three health system partners, including BRRH as the principal facility for the internal medicine, surgery and neurology residency programs. The newly approved neurology residency program began July 1, 2018. During fiscal year 2019, BRRH will train an average of 47 internal medicine residents, 15 surgery residents and 3 neurology residents daily. The integration of the Hospital’s medical staff into the program also continues to expand, with over 100 physicians actively participating.
BocaCare Physician Network
Boca Raton Regional Hospital initiated and designed its BocaCare Physician Network to strengthen the relationship between the physicians and the Hospital, expand market reach, and moderate the seasonality and Medicare dependence of the organization. BocaCare is now comprised of 97 providers (71 physicians, 15 mid-levels and 11 faculty preceptors) practicing in 27 specialty areas at 35 locations within Palm Beach and Broward Counties. During the first six months of fiscal year 2019, BocaCare physicians accounted for 2,003 inpatient and observation discharges, performed a total of 2,827 surgeries, and performed 780 endoscopies.

BRRH Corporation and Affiliates Management’s Discussion and Analysis of
Financial Condition and Results of Operations
For the Quarter Ended December 31, 2018
Page 12 of 19
Ambulatory Care Network BRRH has developed a robust Ambulatory Care Network that includes a 25,000 square foot comprehensive outpatient center in north Broward County, 5 multi-modality imaging centers, 3 breast care centers, 2 radiation therapy sights, 2 urgent care centers, and a comprehensive outpatient rehabilitation center. These outpatient service offerings have supported BRRH diversification as a comprehensive acute care provider, moderated seasonality and expanded market reach and commensurate market share.
BRRH’s multi-site outpatient imaging division offers a complete range of diagnostic imaging capabilities in the South Florida market. The footprint of services is spread across five locations from Deerfield Beach in Broward County, to Delray Beach in Palm Beach County. During the second quarter of fiscal year 2019, 41,255 procedures were performed (exclusive of women’s imaging services), representing a 0.9% decrease compared to the same period of the prior year. BRRH’s imaging market share continues to grow year over year in a very competitive industry, despite intense competition, copayment advantages of free-standing imaging centers, and adverse steerage from insurers. Outpatient imaging is an important entry point to access primary and secondary markets and drives multidisciplinary referrals back to the Hospital.
The Gloria Drummond Physical Rehabilitation Institute The Gloria Drummond Physical Rehabilitation Institute has been operating in its newly renovated space for 18 months. The current complement of services including outpatient rehabilitation services, cardiac and pulmonary rehabilitation, diabetes education and nutrition, wound care and hyperbaric medicine are housed in a 35,000 square foot state-of-the-art ambulatory facility. Overall volumes increased by 26.6% during the first half of fiscal year 2019, as compared to the same period of the prior year. BRRH’s aim of facilitating transitions to ambulatory settings and into the community has been accomplished by integrating Drummond Institute services with the cardiac, oncologic, neurological, orthopedic, and women’s health programs at BRRH. The 10.2% year over year improvement in volume for our Diabetes Program and 12.2% year over year improvement in our Cardiac/Pulmonary Programs highlight the demand for initiatives designed to effectively manage chronic conditions. Quality and Patient Safety
BRRH continues to strive to be one of the highest rated hospitals nationally for both quality and patient safety. The Quality department is focused on the CMS Hospital Value-Based Purchasing Program that incentivizes acute care hospitals with payment adjustments for quality care. Specific areas of focus include best clinical practices, readmission reduction, reducing hospital acquired conditions, and coordinating teams to improve performance in structure, process, and outcomes for the organization. The quality team is integrating daily concurrent review processes with quality clinicians, clinical documentation improvement specialists, the

BRRH Corporation and Affiliates Management’s Discussion and Analysis of
Financial Condition and Results of Operations
For the Quarter Ended December 31, 2018
Page 13 of 19
Health Information Management coding team, and clinical teams. The concurrent processes focus on achieving the most timely and thorough documentation and improving information and data submissions to external sources to more accurately reflect the care and services provided to complex and high acuity patients. A major focus of nursing leadership has been to promote the professional development of bedside nurses which has had significant impact on patient experience and quality of care. Nurses are encouraged and supported to obtain board certification in their specialty. BRRH participated in the Medicare Comprehensive Joint Replacement program earning a modest financial incentive for performance in the first year. BRRH entered a gainsharing partnership with a physician group under the Medicare Bundled Payments for Care Improvement Program which provides incentives to improve quality, patient experience, and cost-effectiveness of care. These initiatives define the future of healthcare delivery. BRRH’s participation at these early stages provides important educational opportunities in addition to financial incentives. The Hospital continues to earn numerous awards and accolades recognizing its quality of care, the most recent of which include:
2018-2019 Listed by U.S. News & World Report for the fourth consecutive year as a Top-Ranked Regional Hospital in South Florida. BRRH is ranked #1 in Palm Beach County, #3 in the Miami–Ft. Lauderdale metro area and #13 in Florida. 2018-2019 Listed by U.S. News & World Report among nation's High Performing Hospitals in abdominal aortic aneurysm repair, chronic obstructive pulmonary disease (COPD), colon cancer surgery, heart failure and lung cancer surgery 2018 Listed by Becker’s Hospital Review as one of “150 Top Places to Work in Healthcare” for the second consecutive year 2018 Boca Regional had the most primary-affiliated physicians of any hospital in Palm Beach County recognized as Top Doctors by Castle Connolly for the sixth year in a row
Patient Satisfaction
The Hospital has consistently focused on improving patient satisfaction, with a goal of meeting or exceeding the 80th percentile in patient satisfaction judged in comparison to national peer benchmarks. The following table shows patient satisfaction results in key areas of the hospital:
Department YTD Fiscal Year 2019 Fiscal Year 2018 Fiscal Year 2017 Fiscal Year 2016Emergency Department 99th Percentile 84th Percentile 93rd Percentile 99th PercentileOutpatient Department 93rd Percentile 95th Percentile 93rd Percentile 89th PercentileOncology Department 61st Percentile 95th Percentile 81st Percentile 84th PercentileInpatient Department 65th Percentile 55th Percentile 78th Percentile 66th Percentile
BRRH Corporation and Affiliates Management’s Discussion and Analysis of
Financial Condition and Results of Operations
For the Quarter Ended December 31, 2018
Page 14 of 19
BRRH has partnered with Press Ganey to conduct organization-wide training for employees. This partnership included rounding with various leaders with a focus on coaching staff. BRRH is also addressing recent employee engagement survey results, and recognizes that high employee engagement leads to improved patient experiences. The Hospital continues to develop action plans to ensure each priority is addressed and communicated. The results of the survey indicated positive movement since the Hospital’s prior survey scores. BRRH has developed Service Excellence Trainers to be able to conduct training of new employees during our Employee Orientations. This will ensure that all organization-wide training for employees is consistent. The organization is focused on best practices such as team huddles, nursing bedside report, unit-based patient quiet time, noise reduction, hourly nurse rounding, improved interdisciplinary seasonal staffing, improved patient communication, improved hospital throughput, and post-discharge calls. The organization has developed an ongoing patient satisfaction taskforce that consists of all department leaders that impact the inpatient experience. Initiatives include rolling out comfort kits throughout the units, mandatory staff education, physician engagement, first impressions, unit-based scorecards, ancillary leader rounding, commitment, discharge calls, discharge folders and competencies among departments. BRRH experienced challenges during fiscal year 2018 in maintaining inpatient satisfaction levels during the transition from the McKesson to Cerner EMR that resulted in revisions in workflow for clinical ancillary departments serving patients. Boca Raton Regional Hospital Foundation The Foundation was established in 1984 to raise funds to support the Hospital’s mission of providing superior, compassionate health care through the cultivation and stewardship of philanthropic gifts and raising the public’s awareness of the Hospital and its related organizations, programs and services. During the first half of fiscal year 2019, the Foundation raised 3,100 gifts totaling $30.1 million in cash and pledges, of which $10.3 million has not been recorded in the financial statements due to timing or other conditions. Information Systems Update The Hospital is focused on providing services and information systems that enhance the patient experience and provide operational efficiency, while meeting regulatory standards. The strength of such systems is generally determined by the user community that deploys them in their daily operations. Staff, physicians, volunteers and patients collaborate to create and maintain comprehensive electronic records that make critical information available at the point of decision making. In 2016, BRRH selected Cerner as the replacement for the existing platform, McKesson Horizon Clinicals. The first phase of implementation, which included the Horizon products that were no longer supported as of March 2018, went live on October 21, 2017. This first phase included

BRRH Corporation and Affiliates Management’s Discussion and Analysis of
Financial Condition and Results of Operations
For the Quarter Ended December 31, 2018
Page 15 of 19
patient scheduling, the emergency department, computerized physician order entry, nursing and physician documentation, surgical services, endoscopy, health information management and pharmacy applications. Phase 1B, inclusive of Promoting Interoperability for Stage 3, Single Sign On and Remote Report Distribution (RRD), continues with the successful go live to date of RRD and Single Sign On. Phase 2 implementations, scheduled to begin in June 2019, will include the Cerner solutions for Laboratory, Infection Control and Radiology. Strategic Affiliations The Corporation’s management completed an overall assessment of the Corporation’s ability to secure the necessary resources to complete a master facility plan and continue its overarching strategic objective to become the preeminent academic tertiary provider in the region. Based on this assessment, management facilitated a dialogue with the Corporation’s Board of Trustees (Board) relative to the merits of seeking a strategic affiliation that could accelerate, elevate, and assure that the Corporation can achieve its vision and complete the needed facility improvements. As a result of this discussion, a Special Committee of the Board was appointed and expanded to include community representation to further evaluate the strategic partnership opportunity. Under the oversight of the Special Committee, the Corporation developed a list of key strategic partnership objectives. In July 2018, the Board selected Baptist Health South Florida as its recommendation for further strategic affiliation discussions and executed a non-binding Letter of Intent to Affiliate with Baptist Health in December 2018, to be followed by completed transaction documents and expected closing by the end of fiscal year 2019. Market Share The latest inpatient market share data has been released for the quarter ending June 30, 2018. During fiscal year 2018, BRRH achieved overall market share of 20.7% in the defined Primary Service Area, comparing favorably to 20.2% market share in fiscal year 2017. This marks the continuation of increasing market share with a gain of approximately 3 market share points since 2012; each point represents approximately 800 discharges.

BRRH Corporation and Affiliates Management’s Discussion and Analysis of
Financial Condition and Results of Operations
For the Quarter Ended December 31, 2018
Page 16 of 19
Management Team In April 2018, Mindy Shikiar, MBA, MSN, was appointed as Chief Operating Officer effective with the retirement of Karen Poole. Ms. Shikiar joined BRRH in 2003 and has served in various leadership positions including Vice President of Oncology Services, Ambulatory Services and Business Development. She previously served as Chief Executive Officer and Chief Operating Officer at Kindred/Vencor Hospital, a long-term acute care facility in Ft. Lauderdale, Florida.
Jerry Fedele, President and Chief Executive Officer previously announced his plan to retire in August 2018. The Board asked him to delay his retirement, in order to facilitate the strategic partnership process. Mr. Fedele agreed and has deferred his retirement date to August 2019. The Board has formed a CEO search committee, and the search in underway.
Dan Sacco, Vice President, Strategic Affairs, announced his retirement effective March 31, 2019. Dan's responsibilities will be reassigned within the hospital.

BRRH Corporation and Affiliates Management’s Discussion and Analysis of
Financial Condition and Results of Operations
For the Quarter Ended December 31, 2018
Page 17 of 19
Liquidity / Days Cash on Hand The following tables set forth BRRH’s unrestricted cash and investment balances, restricted cash and investment balances and days of cash on hand ratio for the most recent five (5) quarters. Restricted cash and investments consist of amounts restricted by donors, and limited use assets, such as assets held in the self-insurance trust, and are excluded from the days cash on hand ratio. From December 31, 2017 to December 31, 2018, total unrestricted cash and investments increased by $0.2 million, while Days Cash on Hand decreased by 8.5 days. Cash collections have been strong throughout the first half of fiscal year 2019; however, daily operating cash requirements have increased compared to prior year, and market conditions have negatively impacted investment market values as of December 31, 2018. Unrestricted cash and investments (dollars in millions):
(1) Daily expenses are calculated as total expenses, excluding depreciation expense, for the rolling twelve month period, divided by 365 or 366 days.
(2) Days cash on hand is calculated as unrestricted cash and investments divided by daily expenses and is calculated in accordance with the Master Trust Indenture dated September 1, 2014. BRRH is required to maintain a minimum of 60 days cash on hand.
Total cash and investments (dollars in millions):
12/31/2018 9/30/2018 6/30/2018 3/31/2018 12/31/2017
Cash and cash equivalents $ 38.3 $ 34.3 $ 40.9 $ 32.2 $ 30.1 Unrestricted Investments $ 111.5 $ 121.4 $ 119.4 $ 120.7 $ 119.5
Total unrestricted cash and investments $ 149.8 $ 155.7 $ 160.3 $ 152.9 $ 149.6
Daily expenses (1) $ 1.4 $ 1.4 $ 1.4 $ 1.3 $ 1.3
Days cash on hand ratio (2) 104.9 110.8 116.3 114.2 113.4
12/31/2018 9/30/2018 6/30/2018 3/31/2018 12/31/2017Cash and cash equivalents $ 38.3 $ 34.3 $ 40.9 $ 32.2 $ 30.1 Unrestricted Investments $ 111.5 $ 121.4 $ 119.4 $ 120.7 $ 119.5 Subtotal $ 149.8 $ 155.7 $ 160.3 $ 152.9 $ 149.6 Restricted cash and investments $ 124.0 $ 124.0 $ 117.4 $ 116.8 $ 111.8 Total Cash and Investments $ 273.8 $ 279.7 $ 277.7 $ 269.7 $ 261.4

BRRH Corporation and Affiliates Management’s Discussion and Analysis of
Financial Condition and Results of Operations
For the Quarter Ended December 31, 2018
Page 18 of 19
Accounts Receivable Total Days in Accounts Receivable (365 day rolling average) were 39.6 as of December 31, 2018, as compared to 45.0 as of December 31, 2017, reflecting improvements in cash collection processes and the implementation of new automated work queue tools. Historical Debt Service Coverage Ratio The calculations provided below are based on a rolling 12 month period and are prepared in accordance with the terms of the Master Trust Indenture dated September 1, 2014. BRRH is required to maintain a minimum Debt Service Coverage Ratio of 1.10 to 1.00. The Master Trust Indenture requires an annual calculation of the Debt Service Coverage Ratio as of June 30.
$ in 000s, based on a rolling 12-month period 12/31/2018 9/30/2018 6/30/2018 3/31/2018 12/31/2017
Excess of unrestricted revenue and nonoperating gains over expenses ($9,063) $4,659 $3,722 $17,687 $20,800
Add back:
Interest expense 3,209 3,169 3,038 3,029 3,046
Depreciation and amortization expense 25,549 25,532 25,552 25,331 25,711Gain or loss resulting from any reappraisal, revaluation, or write down/write up of assets, including unrealized gains or losses on investments, or resulting from early extinguishment of debt. 12,634 (1,016) (2,978) (9,342) (9,260) Net assets released from restriction for capital purposes 8,691 7,052 6,477 2,524 7,904
Income Available for Debt Service $41,020 $39,396 $35,811 $39,229 $48,201
Actual annual debt service $9,719 $9,772 $9,777 $9,754 $9,734
Historical debt service coverage ratio 4.22 4.03 3.66 4.02 4.95
BRRH Corporation and Affiliates Management’s Discussion and Analysis of
Financial Condition and Results of Operations
For the Quarter Ended December 31, 2018
Page 19 of 19
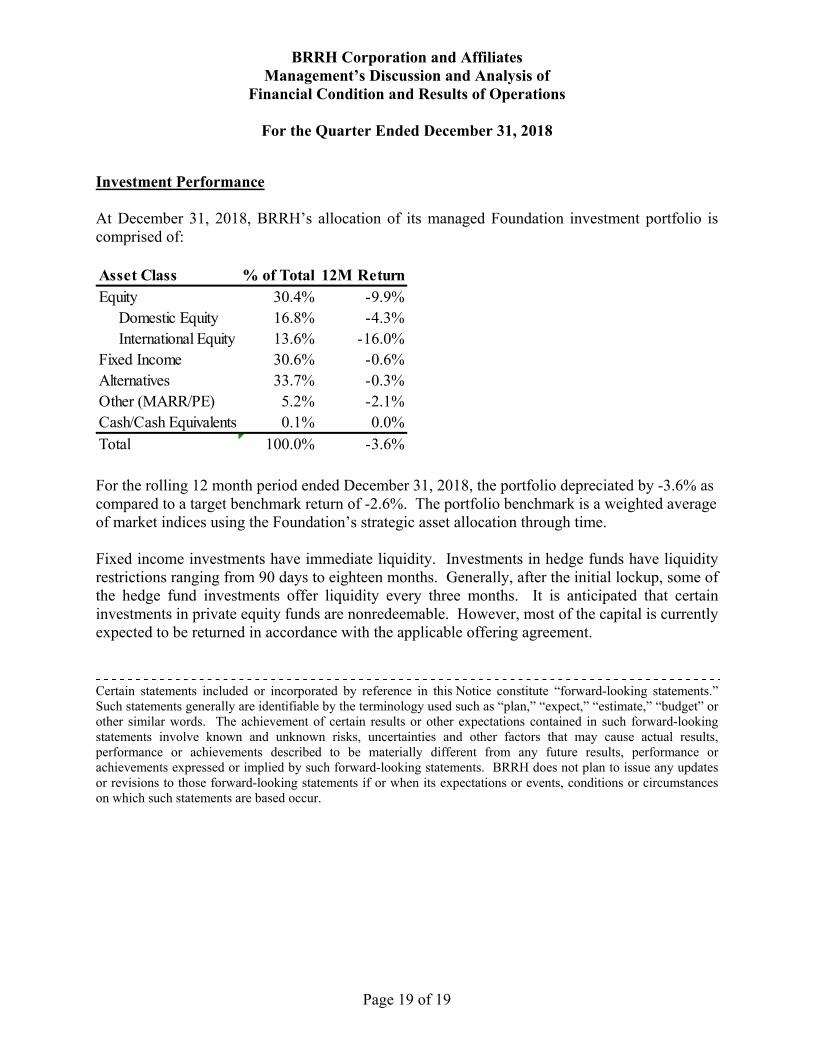
Investment Performance At December 31, 2018, BRRH’s allocation of its managed Foundation investment portfolio is comprised of:
For the rolling 12 month period ended December 31, 2018, the portfolio depreciated by -3.6% as compared to a target benchmark return of -2.6%. The portfolio benchmark is a weighted average of market indices using the Foundation’s strategic asset allocation through time. Fixed income investments have immediate liquidity. Investments in hedge funds have liquidity restrictions ranging from 90 days to eighteen months. Generally, after the initial lockup, some of the hedge fund investments offer liquidity every three months. It is anticipated that certain investments in private equity funds are nonredeemable. However, most of the capital is currently expected to be returned in accordance with the applicable offering agreement. Certain statements included or incorporated by reference in this Notice constitute “forward-looking statements.” Such statements generally are identifiable by the terminology used such as “plan,” “expect,” “estimate,” “budget” or other similar words. The achievement of certain results or other expectations contained in such forward-looking statements involve known and unknown risks, uncertainties and other factors that may cause actual results, performance or achievements described to be materially different from any future results, performance or achievements expressed or implied by such forward-looking statements. BRRH does not plan to issue any updates or revisions to those forward-looking statements if or when its expectations or events, conditions or circumstances on which such statements are based occur.
Asset Class % of Total 12M ReturnEquity 30.4% -9.9% Domestic Equity 16.8% -4.3% International Equity 13.6% -16.0%Fixed Income 30.6% -0.6%Alternatives 33.7% -0.3%Other (MARR/PE) 5.2% -2.1%Cash/Cash Equivalents 0.1% 0.0%Total 100.0% -3.6%

FINANCIAL STATEMENTS
FOR THE SECOND QUARTER ENDED DECEMBER 2018(Unaudited)

BRRH CORPORATION AND AFFILIATES
Statistical Operating Results Summary…………………..………...……………….………...……………….……..………………Page 1
Financial Indicators…………………..…………………………………….…………...…...………………...……………………..…………….Page 5
Consolidated Statement of Operations……………………………………………………….……..………..……………..…...…….…Page 6
Quarter-to-Date Consolidating Statement of Operations by Company………………………………….…..……....…Page 7
Year-to-Date Consolidating Statement of Operations by Company………………………………….…..……....…Page 8
Consolidated Balance Sheet…………………………..…...…………………………………….….....…………………….………..Page 9
Consolidating Balance Sheet ……………..………………………………………………………………..…….………………...…….Page 10
Consolidated Statement of Cash Flows…………………………………………….…..……………...…………..………………..Page 11
Table of Contents
Boca Raton Regional Hospital
Statistical Operating Results
Volume Indicators For the 3 Months Ended December 31, For the 6 Months Ended December 31,
2018 2017
Fav/(Unfav)
Variance Var % 2018 2017
Fav/(Unfav)
Variance Var %
Admissions 4,926 5,099 (173) -3.4% 9,490 9,439 51 0.5%
Inpatient Discharges 4,868 5,079 (211) -4.2% 9,467 9,458 9 0.1%
Observation Discharges 1,966 1,679 287 17.1% 3,765 3,364 401 11.9%
Inpatient & Observation Discharges 6,834 6,758 76 1.1% 13,232 12,822 410 3.2%
Adjusted Admissions 13,110 12,274 836 6.8% 24,804 22,979 1,824 7.9%
Patient Days 20,980 23,386 (2,406) -10.3% 41,393 44,254 (2,861) -6.5%
Observation Days 3,677 3,204 473 14.8% 7,035 6,861 174 2.5%
Patient Days & Observation Days 24,657 26,590 (1,933) -7.3% 48,428 51,115 (2,687) -5.3%
Adjusted Patient Days 55,834 56,291 (458) -0.8% 108,188 107,737 450 0.4%
Average Daily Census 228 254 (26) -10.3% 225 241 (16) -6.5%
Length of Stay - Medicare 4.50 4.89 0.39 8.0% 4.68 4.99 0.31 6.2%
Length of Stay - Total 4.26 4.59 0.33 7.1% 4.36 4.69 0.33 7.0%
Deliveries 655 650 5 0.8% 1,318 1,277 41 3.2%
Emergency Room Visits
Inpatient 3,570 3,709 (139) -3.7% 6,880 6,870 10 0.1%
Outpatient 10,250 10,910 (660) -6.0% 19,588 20,780 (1,192) -5.7%
Total ER Visits 13,820 14,619 (799) -5.5% 26,468 27,650 (1,182) -4.3%
Surgeries
Inpatient 1,294 1,274 20 1.6% 2,593 2,457 136 5.5%
Outpatient 1,412 1,510 (98) -6.5% 2,760 2,981 (221) -7.4%
Total Surgeries 2,706 2,784 (78) -2.8% 5,353 5,438 (85) -1.6%
Outpatient Registrations 73,017 75,211 (2,194) -2.9% 138,247 140,387 (2,140) -1.5%
Outpatient Imaging Chargeable Units 41,255 41,621 (366) -0.9% 76,595 77,496 (901) -1.2%
BocaCare Visits
Office Visits - New 5,718 5,065 653 12.9% 10,872 9,509 1,363 14.3%
Office Visits - Established 25,975 23,072 2,903 12.6% 48,857 42,715 6,142 14.4%
Hospital Visits 5,490 4,071 1,419 34.9% 11,373 9,067 2,306 25.4%
Urgent Care Visits 1,892 1,463 429 29.3% 3,239 2,562 677 26.4%
Total BocaCare Visits 39,075 33,671 5,404 16.0% 74,341 63,853 10,488 16.4%
1

Boca Raton Regional Hospital
Statistical Operating Results
Volume Indicators by Center of Excellence For the 3 Months Ended December 31, For the 6 Months Ended December 31,
2018 2017
Fav/(Unfav)
Variance Var % 2018 2017
Fav/(Unfav)
Variance Var %
Lynn Heart & Vascular Institute
Open Heart Surgeries 53 55 (2) -3.6% 121 95 26 27.4%
TAVR 11 11 - 0.0% 18 21 (3) -14.3%
TMVR/MitraClip 4 1 3 300.0% 6 6 - 0.0%
Vascular Surgeries 203 208 (5) -2.4% 422 416 6 1.4%
Thoracic Surgeries 96 52 44 84.6% 181 103 78 75.7%
Pacemakers 124 98 26 26.5% 210 198 12 6.1%
Defibrillators 27 53 (26) -49.1% 72 88 (16) -18.2%
Cardiac Caths 542 446 96 21.5% 973 867 106 12.2%
EP Studies 80 82 (2) -2.4% 167 142 25 17.6%
Ablations 95 80 15 18.8% 192 166 26 15.7%
Other Cath/EP Lab Procedures 733 640 93 14.5% 1,395 1,119 276 24.7%
Total 1,968 1,726 242 14.0% 3,757 3,221 536 16.6%
Hybrid OR Cases 229 199 30 15.1% 456 383 73 19.1%
Marcus Neuroscience Institute
Surgeries
MNI MDs* 214 117 97 82.9% 409 229 180 78.6%
Community Neuro/Spine MDs 65 61 4 6.6% 117 136 (19) -14.0%
Total Surgeries 279 178 101 56.7% 526 365 161 44.1%
MNI ICU & MNI Stepdown
Patient Days 1,247 1,347 (100) -7.4% 2,499 2,633 (134) -5.1%
Observation Days 47 76 (29) -38.2% 83 125 (42) -33.6%
Total Patient Days and Observation Days 1,294 1,423 (129) -9.1% 2,582 2,758 (176) -6.4%
BocaCare MNI Practice Visits
Office Visits - New 1,145 907 238 26.2% 2,202 1,669 533 31.9%
Office Visits - Established 3,838 3,146 692 22.0% 7,538 5,822 1,716 29.5%
Hospital Visits 2,027 1,701 326 19.2% 4,390 3,480 910 26.1%
Total BocaCare MNI Practice Visits 7,010 5,754 1,256 21.8% 14,130 10,971 3,159 28.8%
*Includes procedures performed in Interventional Radiology & Endoscopy suites
2

Boca Raton Regional Hospital
Statistical Operating Results
Volume Indicators by Center of Excellence For the 3 Months Ended December 31, For the 6 Months Ended December 31,
2018 2017
Fav/(Unfav)
Variance Var % 2018 2017
Fav/(Unfav)
Variance Var %
Lynn Cancer Institute
Total Radiation Oncology Procedures 12,293 15,281 (2,988) -19.6% 21,150 29,255 (8,105) -27.7%
Radiation Oncology New Patients 308 362 (54) -14.9% 527 684 (157) -23.0%
CHO - Initial Infusions
Boca Raton 2,946 2,688 258 9.6% 5,669 5,291 378 7.1%
Delray Beach 1,260 977 283 29.0% 2,465 1,808 657 36.3%
Total 4,206 3,665 541 14.8% 8,134 7,099 1,035 14.6%
BocaCare LCI Practice Visits
Office Visits - New 909 627 282 45.0% 1,578 1,124 454 40.4%
Office Visits - Established 2,114 1,694 420 24.8% 3,859 2,945 914 31.0%
Hospital Visits 385 144 241 167.4% 691 318 373 117.3%
Total BocaCare LCI Practice Visits 3,408 2,465 943 38.3% 6,128 4,387 1,741 39.7%
Lynn Women's Health and Wellness Institute
Breast Imaging & Procedures 24,269 21,627 2,642 12.2% 42,880 37,696 5,184 13.8%
Other Women's Imaging 2,798 2,569 229 8.9% 5,211 4,711 500 10.6%
Total 27,067 24,196 2,871 11.9% 48,091 42,407 5,684 13.4%
BocaCare WHWI Practice Visits
Office Visits - New 820 631 189 30.0% 1,389 1,060 329 31.0%
Office Visits - Established 2,483 1,562 921 59.0% 4,225 2,672 1,553 58.1%
Hospital Visits - - - 0.0% 4 (1) 5 -500.0%
Total BocaCare WHWI Practice Visits 3,303 2,193 1,110 50.6% 5,618 3,731 1,887 50.6%
Drummond Physical Rehabilitation Institute
Outpatient Rehab Units 31,063 23,703 7,360 31.1% 60,509 44,630 15,879 35.6%
Cardiac & Pulmonary Rehab Units 6,937 6,659 278 4.2% 13,926 12,408 1,518 12.2%
Wound Care Procedures (including Hyperbaric) 4,318 4,414 (96) -2.2% 9,031 8,614 417 4.8%
Diabetes Program Units 1,129 1,010 119 11.8% 2,281 2,070 211 10.2%
Total 43,447 35,786 7,661 21.4% 85,747 67,722 18,025 26.6%
Outpatient Rehab New Patients 985 783 202 25.8% 1,961 1,534 427 27.8%
3
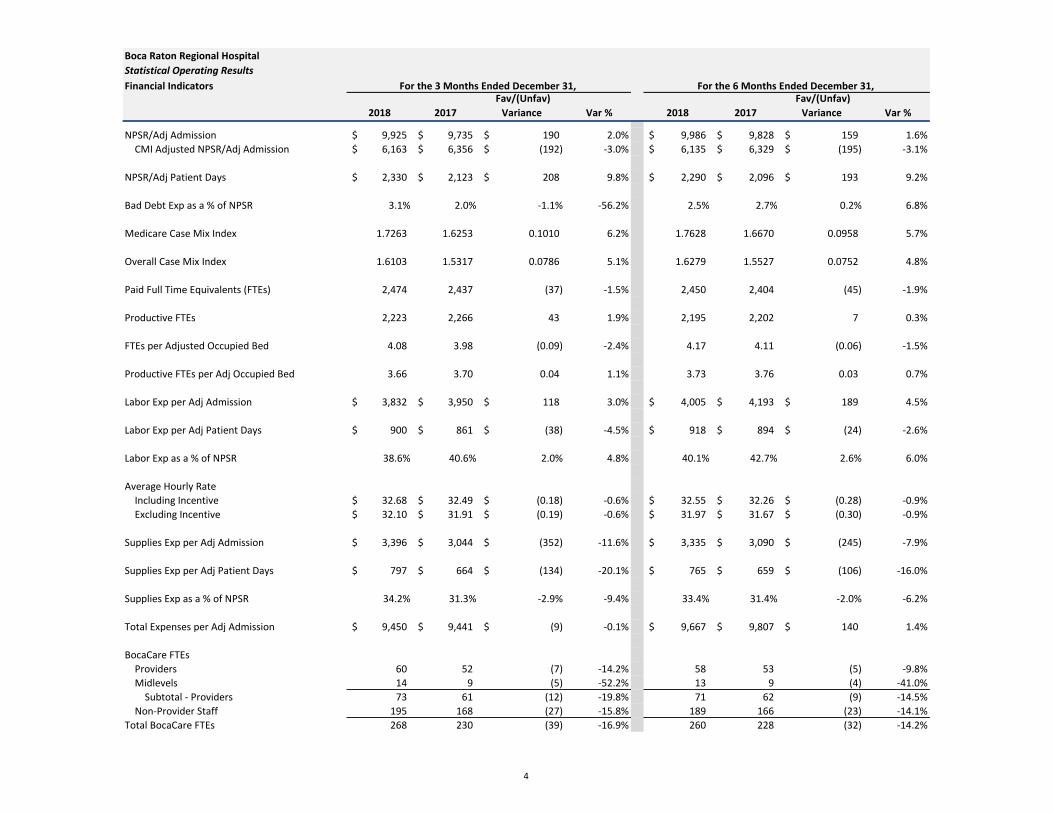
Boca Raton Regional Hospital
Statistical Operating Results
Financial Indicators For the 3 Months Ended December 31, For the 6 Months Ended December 31,
2018 2017
Fav/(Unfav)
Variance Var % 2018 2017
Fav/(Unfav)
Variance Var %
NPSR/Adj Admission 9,925$ 9,735$ 190$ 2.0% 9,986$ 9,828$ 159$ 1.6%
CMI Adjusted NPSR/Adj Admission 6,163$ 6,356$ (192)$ -3.0% 6,135$ 6,329$ (195)$ -3.1%
NPSR/Adj Patient Days 2,330$ 2,123$ 208$ 9.8% 2,290$ 2,096$ 193$ 9.2%
Bad Debt Exp as a % of NPSR 3.1% 2.0% -1.1% -56.2% 2.5% 2.7% 0.2% 6.8%
Medicare Case Mix Index 1.7263 1.6253 0.1010 6.2% 1.7628 1.6670 0.0958 5.7%
Overall Case Mix Index 1.6103 1.5317 0.0786 5.1% 1.6279 1.5527 0.0752 4.8%
Paid Full Time Equivalents (FTEs) 2,474 2,437 (37) -1.5% 2,450 2,404 (45) -1.9%
Productive FTEs 2,223 2,266 43 1.9% 2,195 2,202 7 0.3%
FTEs per Adjusted Occupied Bed 4.08 3.98 (0.09) -2.4% 4.17 4.11 (0.06) -1.5%
Productive FTEs per Adj Occupied Bed 3.66 3.70 0.04 1.1% 3.73 3.76 0.03 0.7%
Labor Exp per Adj Admission 3,832$ 3,950$ 118$ 3.0% 4,005$ 4,193$ 189$ 4.5%
Labor Exp per Adj Patient Days 900$ 861$ (38)$ -4.5% 918$ 894$ (24)$ -2.6%
Labor Exp as a % of NPSR 38.6% 40.6% 2.0% 4.8% 40.1% 42.7% 2.6% 6.0%
Average Hourly Rate
Including Incentive 32.68$ 32.49$ (0.18)$ -0.6% 32.55$ 32.26$ (0.28)$ -0.9%
Excluding Incentive 32.10$ 31.91$ (0.19)$ -0.6% 31.97$ 31.67$ (0.30)$ -0.9%
Supplies Exp per Adj Admission 3,396$ 3,044$ (352)$ -11.6% 3,335$ 3,090$ (245)$ -7.9%
Supplies Exp per Adj Patient Days 797$ 664$ (134)$ -20.1% 765$ 659$ (106)$ -16.0%
Supplies Exp as a % of NPSR 34.2% 31.3% -2.9% -9.4% 33.4% 31.4% -2.0% -6.2%
Total Expenses per Adj Admission 9,450$ 9,441$ (9)$ -0.1% 9,667$ 9,807$ 140$ 1.4%
BocaCare FTEs
Providers 60 52 (7) -14.2% 58 53 (5) -9.8%
Midlevels 14 9 (5) -52.2% 13 9 (4) -41.0%
Subtotal - Providers 73 61 (12) -19.8% 71 62 (9) -14.5%
Non-Provider Staff 195 168 (27) -15.8% 189 166 (23) -14.1%
Total BocaCare FTEs 268 230 (39) -16.9% 260 228 (32) -14.2%
4
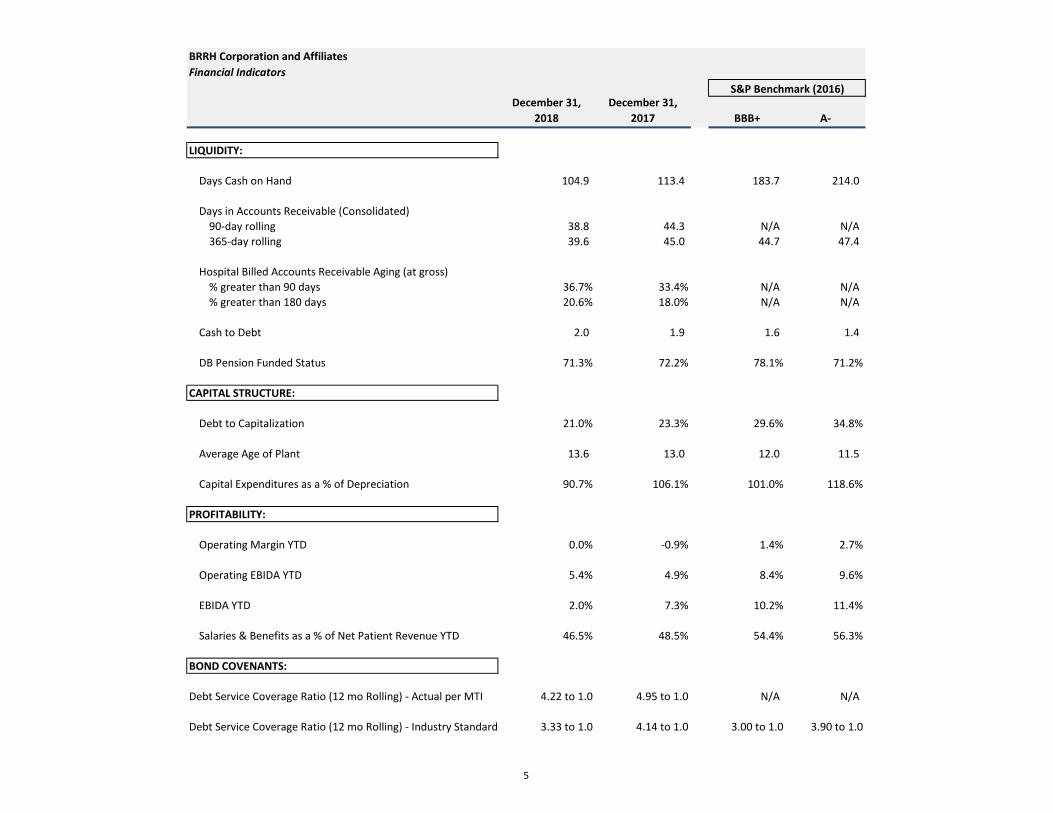
BRRH Corporation and Affiliates
Financial Indicators
S&P Benchmark (2016)December 31,
2018
December 31,
2017 BBB+ A-
LIQUIDITY:
Days Cash on Hand 104.9 113.4 183.7 214.0
Days in Accounts Receivable (Consolidated)
90-day rolling 38.8 44.3 N/A N/A
365-day rolling 39.6 45.0 44.7 47.4
Hospital Billed Accounts Receivable Aging (at gross)
% greater than 90 days 36.7% 33.4% N/A N/A
% greater than 180 days 20.6% 18.0% N/A N/A
Cash to Debt 2.0 1.9 1.6 1.4
DB Pension Funded Status 71.3% 72.2% 78.1% 71.2%
CAPITAL STRUCTURE:
Debt to Capitalization 21.0% 23.3% 29.6% 34.8%
Average Age of Plant 13.6 13.0 12.0 11.5
Capital Expenditures as a % of Depreciation 90.7% 106.1% 101.0% 118.6%
PROFITABILITY:
Operating Margin YTD 0.0% -0.9% 1.4% 2.7%
Operating EBIDA YTD 5.4% 4.9% 8.4% 9.6%
EBIDA YTD 2.0% 7.3% 10.2% 11.4%
Salaries & Benefits as a % of Net Patient Revenue YTD 46.5% 48.5% 54.4% 56.3%
BOND COVENANTS:
Debt Service Coverage Ratio (12 mo Rolling) - Actual per MTI 4.22 to 1.0 4.95 to 1.0 N/A N/A
Debt Service Coverage Ratio (12 mo Rolling) - Industry Standard 3.33 to 1.0 4.14 to 1.0 3.00 to 1.0 3.90 to 1.0
5
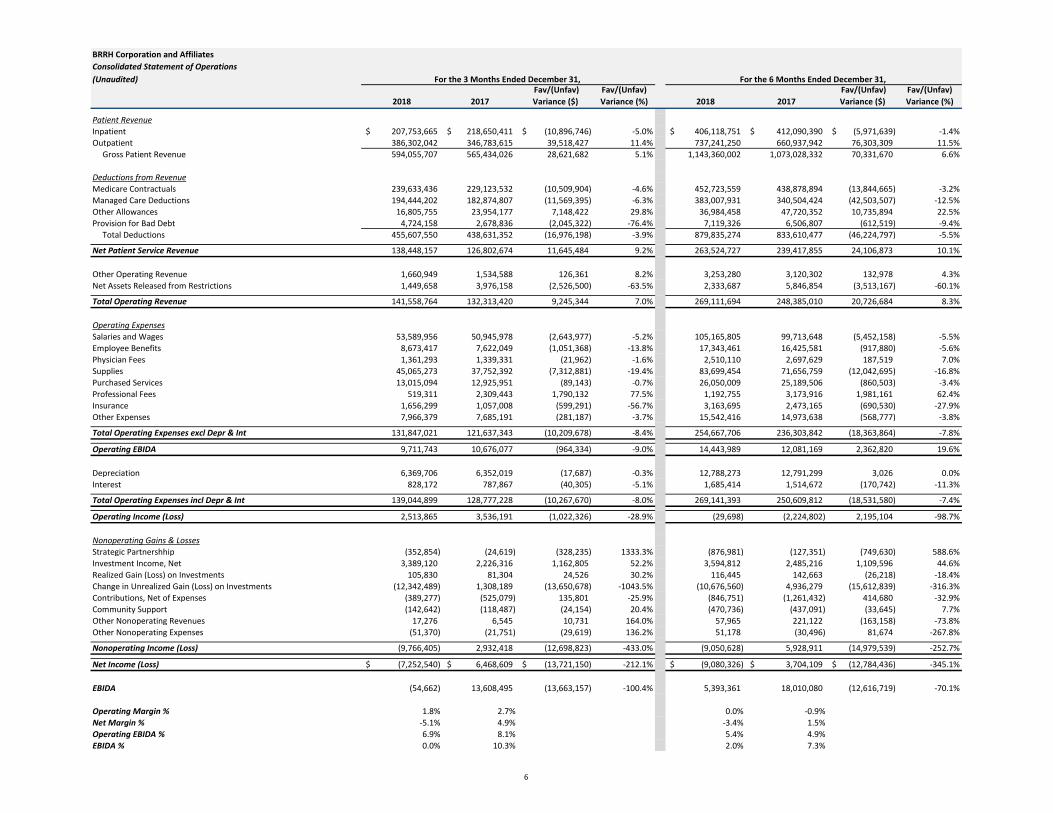
BRRH Corporation and Affiliates
Consolidated Statement of Operations
(Unaudited) For the 3 Months Ended December 31, For the 6 Months Ended December 31,
2018 2017
Fav/(Unfav)
Variance ($)
Fav/(Unfav)
Variance (%) 2018 2017
Fav/(Unfav)
Variance ($)
Fav/(Unfav)
Variance (%)
Patient Revenue
Inpatient 207,753,665$ 218,650,411$ (10,896,746)$ -5.0% 406,118,751$ 412,090,390$ (5,971,639)$ -1.4%
Outpatient 386,302,042 346,783,615 39,518,427 11.4% 737,241,250 660,937,942 76,303,309 11.5%
Gross Patient Revenue 594,055,707 565,434,026 28,621,682 5.1% 1,143,360,002 1,073,028,332 70,331,670 6.6%
Deductions from Revenue
Medicare Contractuals 239,633,436 229,123,532 (10,509,904) -4.6% 452,723,559 438,878,894 (13,844,665) -3.2%
Managed Care Deductions 194,444,202 182,874,807 (11,569,395) -6.3% 383,007,931 340,504,424 (42,503,507) -12.5%
Other Allowances 16,805,755 23,954,177 7,148,422 29.8% 36,984,458 47,720,352 10,735,894 22.5%
Provision for Bad Debt 4,724,158 2,678,836 (2,045,322) -76.4% 7,119,326 6,506,807 (612,519) -9.4%
Total Deductions 455,607,550 438,631,352 (16,976,198) -3.9% 879,835,274 833,610,477 (46,224,797) -5.5%
Net Patient Service Revenue 138,448,157 126,802,674 11,645,484 9.2% 263,524,727 239,417,855 24,106,873 10.1%
Other Operating Revenue 1,660,949 1,534,588 126,361 8.2% 3,253,280 3,120,302 132,978 4.3%
Net Assets Released from Restrictions 1,449,658 3,976,158 (2,526,500) -63.5% 2,333,687 5,846,854 (3,513,167) -60.1%
Total Operating Revenue 141,558,764 132,313,420 9,245,344 7.0% 269,111,694 248,385,010 20,726,684 8.3%
Operating Expenses
Salaries and Wages 53,589,956 50,945,978 (2,643,977) -5.2% 105,165,805 99,713,648 (5,452,158) -5.5%
Employee Benefits 8,673,417 7,622,049 (1,051,368) -13.8% 17,343,461 16,425,581 (917,880) -5.6%
Physician Fees 1,361,293 1,339,331 (21,962) -1.6% 2,510,110 2,697,629 187,519 7.0%
Supplies 45,065,273 37,752,392 (7,312,881) -19.4% 83,699,454 71,656,759 (12,042,695) -16.8%
Purchased Services 13,015,094 12,925,951 (89,143) -0.7% 26,050,009 25,189,506 (860,503) -3.4%
Professional Fees 519,311 2,309,443 1,790,132 77.5% 1,192,755 3,173,916 1,981,161 62.4%
Insurance 1,656,299 1,057,008 (599,291) -56.7% 3,163,695 2,473,165 (690,530) -27.9%
Other Expenses 7,966,379 7,685,191 (281,187) -3.7% 15,542,416 14,973,638 (568,777) -3.8%
Total Operating Expenses excl Depr & Int 131,847,021 121,637,343 (10,209,678) -8.4% 254,667,706 236,303,842 (18,363,864) -7.8%
Operating EBIDA 9,711,743 10,676,077 (964,334) -9.0% 14,443,989 12,081,169 2,362,820 19.6%
Depreciation 6,369,706 6,352,019 (17,687) -0.3% 12,788,273 12,791,299 3,026 0.0%
Interest 828,172 787,867 (40,305) -5.1% 1,685,414 1,514,672 (170,742) -11.3%
Total Operating Expenses incl Depr & Int 139,044,899 128,777,228 (10,267,670) -8.0% 269,141,393 250,609,812 (18,531,580) -7.4%
Operating Income (Loss) 2,513,865 3,536,191 (1,022,326) -28.9% (29,698) (2,224,802) 2,195,104 -98.7%
Nonoperating Gains & Losses
Strategic Partnershhip (352,854) (24,619) (328,235) 1333.3% (876,981) (127,351) (749,630) 588.6%
Investment Income, Net 3,389,120 2,226,316 1,162,805 52.2% 3,594,812 2,485,216 1,109,596 44.6%
Realized Gain (Loss) on Investments 105,830 81,304 24,526 30.2% 116,445 142,663 (26,218) -18.4%
Change in Unrealized Gain (Loss) on Investments (12,342,489) 1,308,189 (13,650,678) -1043.5% (10,676,560) 4,936,279 (15,612,839) -316.3%
Contributions, Net of Expenses (389,277) (525,079) 135,801 -25.9% (846,751) (1,261,432) 414,680 -32.9%
Community Support (142,642) (118,487) (24,154) 20.4% (470,736) (437,091) (33,645) 7.7%
Other Nonoperating Revenues 17,276 6,545 10,731 164.0% 57,965 221,122 (163,158) -73.8%
Other Nonoperating Expenses (51,370) (21,751) (29,619) 136.2% 51,178 (30,496) 81,674 -267.8%
Nonoperating Income (Loss) (9,766,405) 2,932,418 (12,698,823) -433.0% (9,050,628) 5,928,911 (14,979,539) -252.7%
Net Income (Loss) (7,252,540)$ 6,468,609$ (13,721,150)$ -212.1% (9,080,326)$ 3,704,109$ (12,784,436)$ -345.1%
EBIDA (54,662) 13,608,495 (13,663,157) -100.4% 5,393,361 18,010,080 (12,616,719) -70.1%
Operating Margin % 1.8% 2.7% 0.0% -0.9%
Net Margin % -5.1% 4.9% -3.4% 1.5%
Operating EBIDA % 6.9% 8.1% 5.4% 4.9%
EBIDA % 0.0% 10.3% 2.0% 7.3%
6
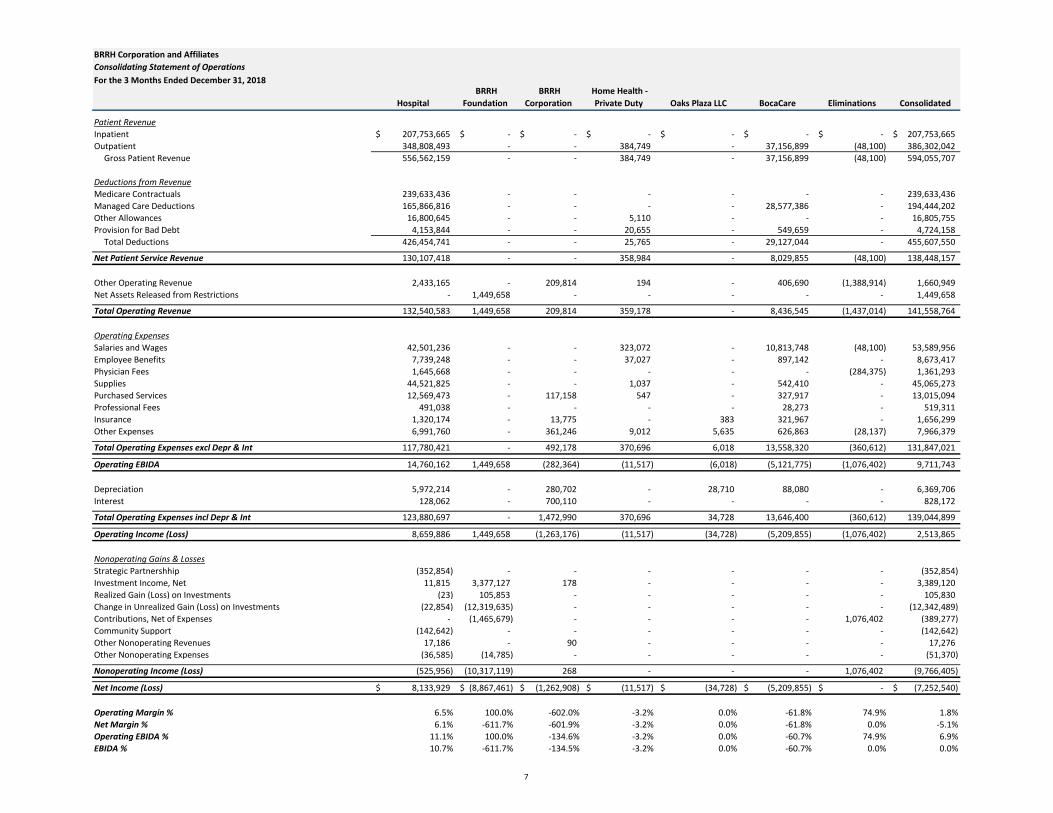
BRRH Corporation and Affiliates
Consolidating Statement of Operations
For the 3 Months Ended December 31, 2018
Hospital
BRRH
Foundation
BRRH
Corporation
Home Health -
Private Duty Oaks Plaza LLC BocaCare Eliminations Consolidated
Patient Revenue
Inpatient 207,753,665$ -$ -$ -$ -$ -$ -$ 207,753,665$
Outpatient 348,808,493 - - 384,749 - 37,156,899 (48,100) 386,302,042
Gross Patient Revenue 556,562,159 - - 384,749 - 37,156,899 (48,100) 594,055,707
Deductions from Revenue
Medicare Contractuals 239,633,436 - - - - - - 239,633,436
Managed Care Deductions 165,866,816 - - - - 28,577,386 - 194,444,202
Other Allowances 16,800,645 - - 5,110 - - - 16,805,755
Provision for Bad Debt 4,153,844 - - 20,655 - 549,659 - 4,724,158
Total Deductions 426,454,741 - - 25,765 - 29,127,044 - 455,607,550
Net Patient Service Revenue 130,107,418 - - 358,984 - 8,029,855 (48,100) 138,448,157
Other Operating Revenue 2,433,165 - 209,814 194 - 406,690 (1,388,914) 1,660,949
Net Assets Released from Restrictions - 1,449,658 - - - - - 1,449,658
Total Operating Revenue 132,540,583 1,449,658 209,814 359,178 - 8,436,545 (1,437,014) 141,558,764
Operating Expenses
Salaries and Wages 42,501,236 - - 323,072 - 10,813,748 (48,100) 53,589,956
Employee Benefits 7,739,248 - - 37,027 - 897,142 - 8,673,417
Physician Fees 1,645,668 - - - - - (284,375) 1,361,293
Supplies 44,521,825 - - 1,037 - 542,410 - 45,065,273
Purchased Services 12,569,473 - 117,158 547 - 327,917 - 13,015,094
Professional Fees 491,038 - - - - 28,273 - 519,311
Insurance 1,320,174 - 13,775 - 383 321,967 - 1,656,299
Other Expenses 6,991,760 - 361,246 9,012 5,635 626,863 (28,137) 7,966,379
Total Operating Expenses excl Depr & Int 117,780,421 - 492,178 370,696 6,018 13,558,320 (360,612) 131,847,021
Operating EBIDA 14,760,162 1,449,658 (282,364) (11,517) (6,018) (5,121,775) (1,076,402) 9,711,743
Depreciation 5,972,214 - 280,702 - 28,710 88,080 - 6,369,706
Interest 128,062 - 700,110 - - - - 828,172
Total Operating Expenses incl Depr & Int 123,880,697 - 1,472,990 370,696 34,728 13,646,400 (360,612) 139,044,899
Operating Income (Loss) 8,659,886 1,449,658 (1,263,176) (11,517) (34,728) (5,209,855) (1,076,402) 2,513,865
Nonoperating Gains & Losses
Strategic Partnershhip (352,854) - - - - - - (352,854)
Investment Income, Net 11,815 3,377,127 178 - - - - 3,389,120
Realized Gain (Loss) on Investments (23) 105,853 - - - - - 105,830
Change in Unrealized Gain (Loss) on Investments (22,854) (12,319,635) - - - - - (12,342,489)
Contributions, Net of Expenses - (1,465,679) - - - - 1,076,402 (389,277)
Community Support (142,642) - - - - - - (142,642)
Other Nonoperating Revenues 17,186 - 90 - - - - 17,276
Other Nonoperating Expenses (36,585) (14,785) - - - - - (51,370)
Nonoperating Income (Loss) (525,956) (10,317,119) 268 - - - 1,076,402 (9,766,405)
Net Income (Loss) 8,133,929$ (8,867,461)$ (1,262,908)$ (11,517)$ (34,728)$ (5,209,855)$ -$ (7,252,540)$
Operating Margin % 6.5% 100.0% -602.0% -3.2% 0.0% -61.8% 74.9% 1.8%
Net Margin % 6.1% -611.7% -601.9% -3.2% 0.0% -61.8% 0.0% -5.1%
Operating EBIDA % 11.1% 100.0% -134.6% -3.2% 0.0% -60.7% 74.9% 6.9%
EBIDA % 10.7% -611.7% -134.5% -3.2% 0.0% -60.7% 0.0% 0.0%
7

BRRH Corporation and Affiliates
Consolidating Statement of Operations
For the 6 Months Ended December 31, 2018
Hospital
BRRH
Foundation
BRRH
Corporation
Home Health -
Private Duty
Oaks Plaza
LLC BocaCare Eliminations Consolidated
Patient Revenue
Inpatient 406,118,751$ -$ -$ -$ -$ -$ -$ 406,118,751$
Outpatient 662,338,367 - - 808,985 - 74,232,627 (138,729) 737,241,250
Gross Patient Revenue 1,068,457,119 - - 808,985 - 74,232,627 (138,729) 1,143,360,002
Deductions from Revenue
Medicare Contractuals 452,723,559 - - - - - - 452,723,559
Managed Care Deductions 324,787,039 - - - - 58,220,892 - 383,007,931
Other Allowances 36,949,320 - - 35,138 - - - 36,984,458
Provision for Bad Debt 6,295,588 - - 30,440 - 793,298 - 7,119,326
Total Deductions 820,755,506 - - 65,578 - 59,014,190 - 879,835,274
Net Patient Service Revenue 247,701,612 - - 743,407 - 15,218,437 (138,729) 263,524,727
Other Operating Revenue 4,746,250 - 401,469 355 - 748,710 (2,643,504) 3,253,280
Net Assets Released from Restrictions - 2,333,687 - - - - - 2,333,687
Total Operating Revenue 252,447,862 2,333,687 401,469 743,762 - 15,967,147 (2,782,233) 269,111,694
Operating Expenses
Salaries and Wages 83,834,293 - - 653,492 - 20,816,750 (138,729) 105,165,805
Employee Benefits 15,495,556 - - 75,264 - 1,772,641 - 17,343,461
Physician Fees 3,023,847 - - - - - (513,737) 2,510,110
Supplies 82,731,020 - - 1,230 - 967,204 - 83,699,454
Purchased Services 25,211,074 - 232,896 547 - 605,492 - 26,050,009
Professional Fees 1,124,642 - - - - 68,112 - 1,192,755
Insurance 2,500,670 - 27,550 - 766 634,708 - 3,163,695
Other Expenses 13,594,538 - 736,641 15,275 11,910 1,240,377 (56,325) 15,542,416
Total Operating Expenses excl Depr & Int 227,515,640 - 997,087 745,808 12,676 26,105,285 (708,791) 254,667,706
Operating EBIDA 24,932,222 2,333,687 (595,617) (2,046) (12,676) (10,138,138) (2,073,443) 14,443,989
Depreciation 11,999,661 - 557,476 - 57,420 173,716 - 12,788,273
Interest 257,686 - 1,427,728 - - - - 1,685,414
Total Operating Expenses incl Depr & Int 239,772,987 - 2,982,291 745,808 70,096 26,279,002 (708,791) 269,141,393
Operating Income (Loss) 12,674,875 2,333,687 (2,580,821) (2,046) (70,096) (10,311,855) (2,073,443) (29,698)
Nonoperating Gains & Losses
Strategic Partnershhip (876,981) - - - - - - (876,981)
Investment Income, Net (180,788) 3,775,245 355 - - - - 3,594,812
Realized Gain (Loss) on Investments (37) 116,482 - - - - - 116,445
Change in Unrealized Gain (Loss) on Investments (22,852) (10,653,708) - - - - - (10,676,560)
Contributions, Net of Expenses - (2,920,194) - - - - 2,073,443 (846,751)
Community Support (470,736) - - - - - - (470,736)
Other Nonoperating Revenues 57,785 - 180 - - - - 57,965
Other Nonoperating Expenses 86,021 (34,843) - - - - - 51,178
Nonoperating Income (Loss) (1,407,589) (9,717,017) 535 - - - 2,073,443 (9,050,628)
Net Income (Loss) 11,267,286$ (7,383,330)$ (2,580,286)$ (2,046)$ (70,096)$ (10,311,855)$ -$ (9,080,326)$
Operating Margin % 5.0% 100.0% -642.8% -0.3% 0.0% -64.6% 74.5% 0.0%
Net Margin % 4.5% -316.4% -642.7% -0.3% 0.0% -64.6% 0.0% -3.4%
Operating EBIDA % 9.9% 100.0% -148.4% -0.3% 0.0% -63.5% 74.5% 5.4%
EBIDA % 9.3% -316.4% -148.2% -0.3% 0.0% -63.5% 0.0% 2.0%
8

BRRH Corporation and Affiliates
Consolidated Balance Sheet
(Unaudited)December 31, 2018 September 30, 2017 December 31, 2017
Assets
Current Assets:
Cash and Cash Equivalents 38,273,400$ 34,295,134$ 30,072,531$
Restricted Cash 882,094 881,916 1,265,732
Assets Whose Use Is Limited, Current 6,846,625 7,597,564 7,432,236
Investments, Current 73,164,703 80,451,342 79,229,296
Accounts Receivable, Net 58,360,197 58,568,678 61,099,518
Pledges Receivable, Current 6,207,862 5,833,990 6,791,270
Other Receivables 5,878,261 5,746,650 4,525,036
Inventories 10,103,760 9,356,619 9,180,966
Prepaid Expenses and Other Current Assets 6,212,729 5,352,462 4,670,607
Total Current Assets 205,929,632 208,084,356 204,267,192
Assets Whose Use Is Limited, Net of Current Portion:
Under Trust Indenture for Professional Liability Claims, Held by Trustee 2,882,018 2,857,279 2,902,258
Donor Restricted Assets 113,380,639 112,670,032 100,175,446
Investments, Net of Current Portion 38,350,009 40,927,450 40,249,643
Pledges Receivable, Net of Current Portion 35,026,595 32,891,546 31,754,762
Property and Equipment, Net 235,371,562 235,384,500 225,182,861
Other Assets 2,516,367 2,520,090 2,493,832
Total Assets 633,456,821$ 635,335,253$ 607,025,994$
Liabilities and Net Assets
Current Liabilities:
Accounts Payable 31,844,483$ 19,029,185$ 19,137,399$
Accrued Expenses 28,478,502 34,354,352 34,845,115
Reserve for Professional Liability Claims, Current Portion 4,724,000 4,724,000 4,582,400
Current Portion of Long-Term Debt and Capital Leases 6,251,806 6,049,012 6,342,640
Estimated Third Party Settlements 8,613 224,881 (1,113,171)
Other Current Liabilities 2,228,178 2,348,801 256,332
Total Current Liabilities 73,535,583 66,730,231 64,050,714
Long-Term Liabilities:
Reserve for Professional Liability Claims, Net of Current Portion 8,203,092 8,262,338 8,319,021
Long-Term Debt and Capital Leases, Net of Current Portion 67,408,422 72,722,897 73,828,750
Pension Liability 31,814,578 32,626,719 47,418,086
Other Long-Term Liabilities 16,305,292 16,719,393 6,210,877
Total Liabilities 197,266,966 197,061,579 199,827,448
Net Assets (Deficit):
Unrestricted 277,803,762 282,453,901 264,189,379
Temporarily Restricted 158,386,093 155,819,773 143,009,166
Total Net Assets (Deficit) 436,189,854 438,273,674 407,198,545
Total Liabilities and Net Assets 633,456,821$ 635,335,253$ 607,025,994$
9

BRRH Corporation and Affiliates
Consolidating Balance Sheet
December 31, 2018
(Unaudited)
Hospital BRRH Foundation
BRRH
Corporation
Home Health -
Private Duty Oaks Plaza LLC BocaCare Eliminations Consolidated
Assets
Current Assets:
Cash and Cash Equivalents 1,048,595$ 1,404,035$ 31,607,309$ 21,369$ -$ 4,192,092$ -$ 38,273,400$
Restricted Cash 781,211 - 100,883 - - - - 882,094
Assets Whose Use Is Limited, Current 4,724,000 2,122,625 - - - - - 6,846,625
Investments, Current - 73,164,703 - - - - - 73,164,703
Accounts Receivable, Net 54,403,928 - - 169,651 - 3,786,619 - 58,360,197
Pledges Receivable, Current - 6,207,862 - - - - - 6,207,862
Other Receivables 5,654,594 106,908 59,324 - - 57,435 0 5,878,261
Inventories 10,064,245 - - - - 39,515 - 10,103,760
Prepaid Expenses and Other Current Assets 5,222,552 567,500 96,370 - 639 325,669 - 6,212,729
Due from Affiliates 121,663,023 (136,169) (116,211,771) 3,337,586 (8,652,668) - - 0
Total Current Assets 203,562,147 83,437,464 (84,347,886) 3,528,606 (8,652,029) 8,401,330 0 205,929,632
Assets Whose Use Is Limited, Net of Current Portion:
Under Trust Indenture for Professional Liability Claims, Held by Trustee 2,882,018 - - - - - - 2,882,018
Donor Restricted Assets - 113,380,639 - - - - - 113,380,639
Investments, Net of Current Portion - 38,350,009 - - - - - 38,350,009
Pledges Receivable, Net of Current Portion - 35,026,595 - - - - - 35,026,595
Property and Equipment, Net 207,945,322 - 23,663,318 - 1,879,516 1,883,405 - 235,371,562
Beneficial Interest in BRRH Foundation 269,671,885 - - - - - (269,671,885) -
Other Assets 2,516,367 - 89,999,282 - - - (89,999,282) 2,516,367
Total Assets 686,577,740$ 270,194,707$ 29,314,714$ 3,528,606$ (6,772,513)$ 10,284,735$ (359,671,166)$ 633,456,821$
Liabilities and Net Assets
Current Liabilities:
Accounts Payable 30,950,274$ 240,573$ 100,017$ -$ -$ 553,619$ 0$ 31,844,483$
Accrued Expenses 24,897,691 162,064 339,271 22,280 0 3,057,195 - 28,478,502
Reserve for Professional Liability Claims, Current Portion 4,724,000 - - - - - - 4,724,000
Current Portion of Long-Term Debt and Capital Leases 1,286,806 - 4,965,000 - - - - 6,251,806
Estimated Third Party Settlements 8,613 - - - - - - 8,613
Other Current Liabilities 1,770,772 - 457,407 - - - - 2,228,178
Total Current Liabilities 63,638,156 402,637 5,861,695 22,280 0 3,610,813 0 73,535,583
Long-Term Liabilities:
Reserve for Professional Liability Claims, Net of Current Portion 8,203,092 - - - - - - 8,203,092
Long-Term Debt and Capital Leases, Net of Current Portion 1,071,400 - 66,337,021 - - - - 67,408,422
Pension Liability 31,814,578 - - - - - - 31,814,578
Other Long-Term Liabilities 11,854,595 120,185 3,877,779 - - 452,734 - 16,305,292
Total Liabilities 116,581,822 522,822 76,076,495 22,280 0 4,063,547 0 197,266,966
Net Assets (Deficit):
Unrestricted 411,609,825 111,285,847 (46,761,781) 3,506,325 (6,772,513) 6,221,188 (201,285,129) 277,803,762
Temporarily Restricted 158,386,093 158,386,038 - - - - (158,386,038) 158,386,093
Total Net Assets (Deficit) 569,995,918 269,671,885 (46,761,781) 3,506,325 (6,772,513) 6,221,188 (359,671,167) 436,189,854
Total Liabilities and Net Assets 686,577,740$ 270,194,707$ 29,314,714$ 3,528,606$ (6,772,513)$ 10,284,735$ (359,671,166)$ 633,456,821$
10

BRRH Corporation and Affiliates
Consolidating Cash Flow Statement
For the 6 Months Ended December 31, 2018
(Unaudited)Consolidated
Operating Activities
Change in Net Assets 4,732,720$
Adjustments to Reconcile Change in Net Assets
to Net Cash Provided by Operating Activities:
Depreciation & Amortization 12,596,944 Gain on Sale of Equipment (9,142) Gain on Sale of Investments (116,445) Provision for Bad Debts 7,119,326 Change in Net Unrealized Gains on Investments 13,975,368 Change in pension liability - Restricted Contributions (19,445,539) Changes in unrestricted contributions (10,638)
Changes in Operating Assets and Liabilities:
Accounts Receivable (481,357)
Other Receivables 106,305
Inventories (1,106,500)
Prepaid Expenses and Other Current Assets 41,078
Other Assets (1,137)
Accounts Payable (778,569)
Accrued Expenses (1,683,624)
Estimated Third Party Settlements (448,393)
Other Current Liabilities (189,182)
Reserve for Professional Liability Claims (2,233,685)
Other Long-Term Liabilities (407,900)
Pension Liability (1,705,283)
Net Cash Provided by (Used in) Operating Activities 9,954,347$
Investing ActivitiesProceeds from Sales and Maturities of Investments 2,306,908$ Purchases of Investments (8,952,285) Purchases of Property and Equipment (11,804,324) Proceeds from the Sale of Property and Equipment 9,142 Net Increase in Assets Whose Use is Limited and
Donor-Designated Assets (5,843,564) Payments on Gift Annuities (6,292) Change in Restricted Cash (355)
Net Cash Provided by (Used in) Investing Activities (24,290,770)$
Financing ActivitiesRepayments of Long-Term Debt (4,780,000)$ Payments on Capital Leases (647,557) Proceeds from Restricted Contributions 17,077,925
Net Cash Provided by (Used in) Financing Activities 11,650,368$
Increase (Decrease) in Cash (2,686,055)
Cash and Equivalents at Beginning of Year 40,959,455 Cash and Equivalents at End of Period 38,273,400$
Supplemental Disclosure of Noncash Financing and Investing Activities:
Acquisition of Equipment under Capital Lease Obligation 173,707$ Acquisition of equipment through Other Current and Long Term Liabilities 531,994 Acquisition of equipment through AP 136,832 Change in Pledges Receviable (2,303,252) Change in DDA related to bond receipt (75,000)
Supplemental Disclosure of Cash Flow Information
Cash paid for interest 1,949,266
11
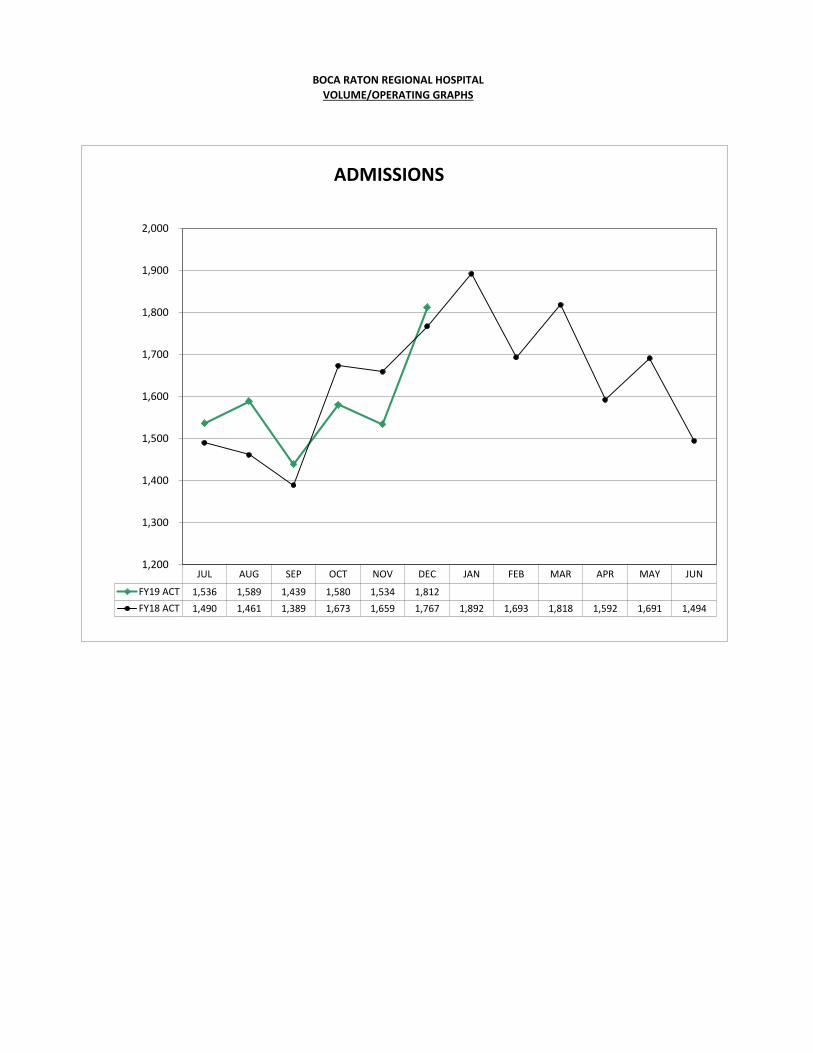
BOCA RATON REGIONAL HOSPITAL
VOLUME/OPERATING GRAPHS
JUL AUG SEP OCT NOV DEC JAN FEB MAR APR MAY JUN
FY19 ACT 1,536 1,589 1,439 1,580 1,534 1,812
FY18 ACT 1,490 1,461 1,389 1,673 1,659 1,767 1,892 1,693 1,818 1,592 1,691 1,494
1,200
1,300
1,400
1,500
1,600
1,700
1,800
1,900
2,000
ADMISSIONS

BOCA RATON REGIONAL HOSPITAL
VOLUME/OPERATING GRAPHS
JUL AUG SEP OCT NOV DEC JAN FEB MAR APR MAY JUN
FY19 ACT 3,940 4,067 3,694 4,261 4,207 4,633
FY18 ACT 3,513 3,795 3,396 4,103 4,038 4,140 4,616 4,365 4,628 4,116 4,602 3,910
3,000
3,250
3,500
3,750
4,000
4,250
4,500
4,750
5,000
ADJUSTED ADMISSIONS

VOLUME/OPERATING GRAPHS
BOCA RATON REGIONAL HOSPITAL
JUL AUG SEP OCT NOV DEC JAN FEB MAR APR MAY JUN
FY19 ACT 418 469 412 443 411 440
FY18 ACT 454 428 301 413 439 422 484 419 467 415 474 429
250
300
350
400
450
500
550
INPATIENT SURGERIES

BOCA RATON REGIONAL HOSPITAL
VOLUME/OPERATING GRAPHS
JUL AUG SEP OCT NOV DEC JAN FEB MAR APR MAY JUN
FY19 ACT 436 479 433 459 506 447
FY18 ACT 486 573 412 501 501 508 549 483 537 476 535 477
370
420
470
520
570
620
OUTPATIENT SURGERIES

BOCA RATON REGIONAL HOSPITAL
VOLUME/OPERATING GRAPHS
JUL AUG SEP OCT NOV DEC JAN FEB MAR APR MAY JUN
FY19 ACT 157 160 114 178 178 186
FY18 ACT 140 170 111 135 151 160 157 153 153 170 139 152
100
110
120
130
140
150
160
170
180
190
CARDIAC CATH

BOCA RATON REGIONAL HOSPITAL
VOLUME/OPERATING GRAPHS
JUL AUG SEP OCT NOV DEC JAN FEB MAR APR MAY JUN
FY19 ACT 25 28 15 13 19 21
FY18 ACT 15 16 9 13 21 21 23 23 25 21 26 18
5
10
15
20
25
30
35
OPEN HEART

BOCA RATON REGIONAL HOSPITAL
VOLUME/OPERATING GRAPHS
JUL AUG SEP OCT NOV DEC JAN FEB MAR APR MAY JUN
FY19 ACT 4,198 4,182 4,268 4,477 4,388 4,955
FY18 ACT 4,286 4,332 4,413 4,556 4,804 5,259 5,506 4,989 5,288 4,718 4,511 4,181
3,750
4,000
4,250
4,500
4,750
5,000
5,250
5,500
5,750
ER VISITS