
Brownstown Town Center Financial PPT 7.16.12 · POWERPOINT PRESENTATIONS ... The subject site was...
224
Brownstown Town Center Market and Financial Study Final Presentation Final Presentation Brownstown Downtown Development Authority | July 19, 2012
Transcript of Brownstown Town Center Financial PPT 7.16.12 · POWERPOINT PRESENTATIONS ... The subject site was...

Brownstown Town Center Market and Financial StudyFinal PresentationFinal Presentation Brownstown Downtown Development Authority | July 19, 2012

Page i E6-12962.00 July 17, 2012
TABLE OF CONTENTS
BACKGROUND AND OBJECTIVES ............................................................................................................................................ 1
SUBJECT SITE ANALYSIS .......................................................................................................................................................... 3
Subject Site Description ................................................................................................................................................ 3
Subject Site History and Development Status ........................................................................................................... 4
MARKET OVERVIEW ................................................................................................................................................................... 5
National Outlook ............................................................................................................................................................. 5
Regional Economic & Demographic Analysis ........................................................................................................... 7
For-Sale Local Competitive Market ............................................................................................................................. 8
For-Rent Local Competitive Market ............................................................................................................................ 9
Office .............................................................................. ........................................................................................ 9
Retail ............................................................................................................................................................. 10
CONCLUSIONS AND RECOMMENDATIONS ........................................................................................................................... 12
Option 1: Town Center Recommendations .............................................................................................................. 12
Option 2: Not Town Center Recommendations....................................................................................................... 14
CRITICAL ASSUMPTIONS ......................................................................................................................................................... 16
GENERAL LIMITING CONDITIONS ........................................................................................................................................... 18
BROWNSTOWN DDA

Page ii E6-12962.00 July 17, 2012
APPENDIX: SUPPORTING EXHIBITS
POWERPOINT PRESENTATIONS
MARKET STUDY
FINANCIAL STUDY
BROWNSTOWN DDA
Page 1 E6-12962.00 July 17, 2012
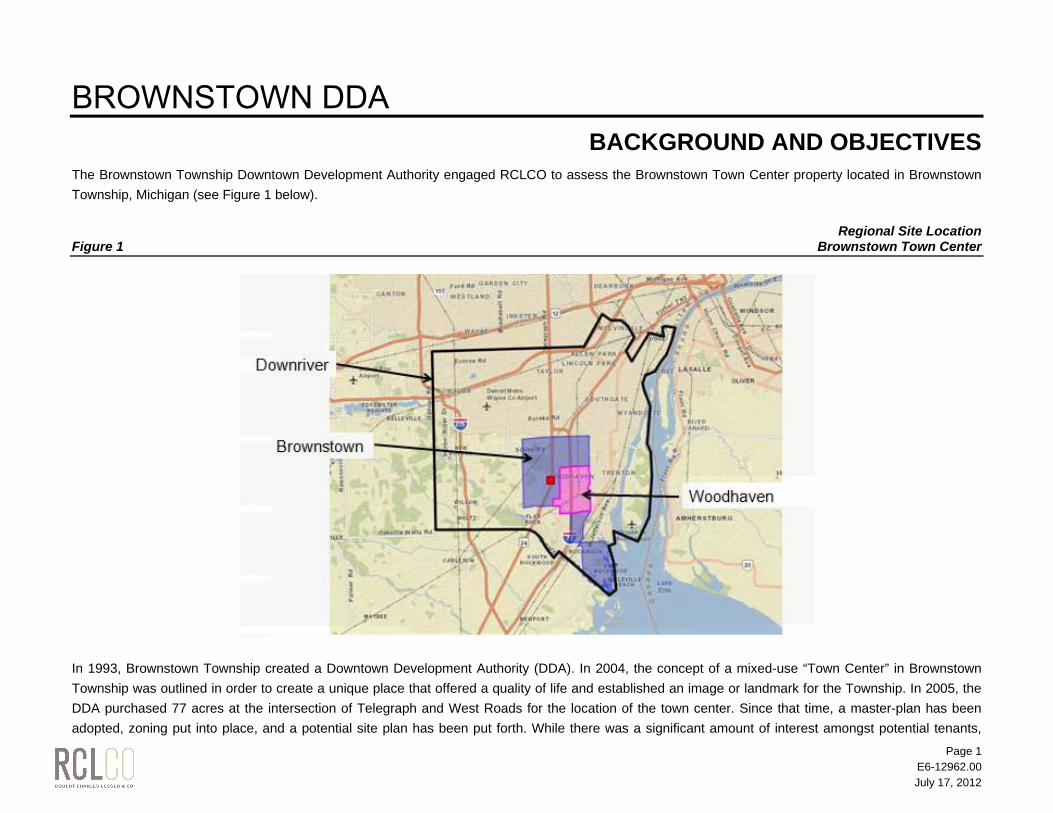
BACKGROUND AND OBJECTIVES The Brownstown Township Downtown Development Authority engaged RCLCO to assess the Brownstown Town Center property located in Brownstown Township, Michigan (see Figure 1 below). Regional Site Location Figure 1 Brownstown Town Center
In 1993, Brownstown Township created a Downtown Development Authority (DDA). In 2004, the concept of a mixed-use “Town Center” in Brownstown Township was outlined in order to create a unique place that offered a quality of life and established an image or landmark for the Township. In 2005, the DDA purchased 77 acres at the intersection of Telegraph and West Roads for the location of the town center. Since that time, a master-plan has been adopted, zoning put into place, and a potential site plan has been put forth. While there was a significant amount of interest amongst potential tenants,
BROWNSTOWN DDA

Page 2 E6-12962.00 July 17, 2012
until 2009, Telegraph Road was under construction making it a north/south road (as opposed to north bound only), hampering the ability to move forward on the project during the top of the last real estate cycle. RCLCO completed a market study and financial analysis to outline the market potential for the Town Center and the potential current value of the property. With the above in mind, the key objectives of this engagement were to:
Determine the timing of the different land uses within the town center;
Recommend the appropriate mix of land uses and total units/square feet;
Understand the future buyers, renters, tenant types, shoppers, and businesses that would likely locate and visit the town center; and
Prepare a financial analysis to clearly demonstrate the potential of the town center.
In order to assess the property, RCLCO completed the following tasks:
Visited the subject property and evaluated its condition and development potential
Compiled and analyzed economic and demographic information on the area to assess future growth drivers and the overall health and opportunities of the larger market
Estimated the demand for new apartments, single-family detached, retail, and office in the market and the site’s potential capture of that demand
Compiled data on the key competitive active and planned projects in the project’s competitive market area
Summarized the above and determined current and projected supply and demand trends, their influence on the timing of opportunities at the subject site, and the best candidate land-uses for the subject property among those evaluated for this engagement
Determined the likely absorption that could be achieved at the project through build-out
Analyzed all of the above and provided recommendations regarding timing of market entry, current and future end-user prices, and likely land values for the identified uses
Completed a financial analysis to determine the value of the land
BROWNSTOWN DDA

Page 3 E6-12962.00 July 17, 2012
SUBJECT SITE ANALYSIS Subject Site Description
The subject site consists of approximately 77 acres of land zoned Town Center, located at the northwest intersection of Telegraph and West Roads. The site also has a signalized intersection at Telegraph and Dix-Toledo Roads. The site is well-located in Brownstown Township, an area that grew by almost 8,000 people between 2000 and 2010. Once the region begins to grow again, Brownstown is likely to be a recipient of the growth. The Southeastern Michigan Council of Governments (SEMCOG) predicts that Brownstown Township will grow by approximately 1,000 people by 2025. The site enjoys great access to both Telegraph and West Roads, and is, for the most part, surrounded by attractive land uses. A summary of strengths and weaknesses is provided in Figure 2. Strengths and Challenges Figure 2 Brownstown Town Center
STRENGTHS CHALLENGES
Good access from West Road to I-75 as well as strong access on Telegraph
New intersection at Telegraph and Dix-Toledo Roads Close to employment, shopping, and other services Located in one of the developing sections of the Downriver area Relatively strong incomes and historical population growth Development activity in the area appears to be picking back up again Nice tree cover on portions of the property
While the area had strong historical growth, and likely strong future
growth, secondary sources suggest stable and/or declining population Site is located west of I-75, away from the bulk of current retail and
office concentrations on West and Allen Roads Hard to create a “sense of place” with the RV storage facility within
the property boundaries While the demand fundamentals are strong for the project, it may be
challenging to find a developer for the project—the development community is just starting to begin to recover and are looking for projects in A+ locations
BROWNSTOWN DDA

Page 4 E6-12962.00 July 17, 2012
Subject Site History and Development Status The subject site was assembled in 2005 to develop the proposed Brownstown Town Center mixed-use project. A master-plan was created, zoning put into place, and a potential site plan developed. There had been a potential developer for the site. The proposed original site plan is shown in Figure 3 and includes the following uses south of the RV storage facility: 23 single-family lots, 56 apartments, 16 townhome units, and land for future development. North of the RV facility the plan included 4.5 acres of stormwater management, 12 acres of senior housing, 20 townhomes, a 50,000 square foot community center, a 26,000 square foot movie theater, and 97,000 square feet of other commercial. The movie theater located on another parcel on Allen Road, eliminates the market potential for a new theater on the property. Original Site Plan Figure 3 Brownstown Town Center
BROWNSTOWN DDA
Page 5 E6-12962.00 July 17, 2012
MARKET OVERVIEW National Outlook
The future success of the project is related to the local and regional outlook for real estate (typically related to the projected job and household growth) and the national outlook for real estate overall. RCLCO expects that residential real estate will bump along the bottom for the next 12 – 24 months, depending on geography—for example some markets in Texas are much farther along in their recovery. The most aggressive employment growth estimates, from Moody’s Analytics, forecast the return to pre-recession employment in 2014. While this results in an addition of six million jobs, the economy will not reach full employment due to increased population and labor force participation. RCLCO expects a slower recovery, with a return to pre-recession employment highs after 2015, and a return to full employment in 2016 or beyond. Regional and sector divergence are expected to continue. Threats to recovery include the price of oil and unrest in the Mideast, a further decline in the housing market, state and local government stress, the European sovereign debt crisis, weakening consumer confidence, and political deadlock. Based upon this national job outlook, housing starts will begin to rise in 2013 while lending standards and regulatory uncertainties loosen. In most markets “normal market conditions” will return in 2013/2014. Another key factor is the return of the Baby Boomers and Gen Y into the housing market starting in 2015 and continuing for 10 or more years. These generations have a significant impact on the underlying demand for real estate given their size and the timing of their entry or re-entry into the housing market. Real estate performance in the U.S. has been consistently cyclical, at least since records on commercial and residential pricing and volume have been tracked. “Peaks” and “valleys” may have different direct causes in every cycle, but consistently result from inevitable buy-side exuberance after a period of steady value increases and associated loosening of capital, particularly credit, resulting in skyrocketing pricing and excessive production. An event triggers an awakening of the market to the untenable situation in which it finds itself, and values, transaction, and production come to a standstill. The most recent real estate boom and bust was exceptionally severe, but very closely repeats patterns of earlier cycles. Figure 4 outlines the projected path of the real estate cycle over the next decade, including the timing for the following stages:
Bottom (2009 – 2012): The real estate bottom is characterized by real estate prices being below replacement costs; the bottom represents the ideal time to acquire existing assets.
Early Recovery (2011 – 2013): During the early recovery, prices begin to exceed replacement costs for many assets; the stage still offers numerous opportunities to acquire assets, as well as to reposition and develop those in preparation for subsequent phases.
BROWNSTOWN DDA

Page 6 E6-12962.00 July 17, 2012
Stability (2013 – 2014): Competition for assets becomes more difficult during the stable phase of the market; the market may offer select investment opportunities, but prices are increasing as cap rates compress.
Peak (2015 – 2016): At market peak, cap rates have compressed to the point that prices exceed reasonable net asset values for assets; the only purchasing opportunities will be highly opportunistic, otherwise, this represents the best opportunity to sell.
Downturn (2017): Investment activity is difficult during the downturn as it is impossible to know when the market will hit bottom and/or how low it will go; the downturn is a good time to start raising and committing funds to take advantage of low prices during the bottom.
Bottom (2018 – 2019)
Regions vary as do submarkets within regions which makes it critical to understand local market dynamics. Figure 4 National Real Estate Outlook
P=Price RC=Replacement Cost NAV=Net Asset Value
BROWNSTOWN DDA

Page 7 E6-12962.00 July 17, 2012
Regional Economic & Demographic Analysis The subject site is located in the Detroit-Warren-Livonia Metropolitan Statistical Area (MSA) that consists of Lapeer, Livingston, Macomb, Oakland, St. Clair, and Wayne Counties. This MSA was hit very hard during the recession, and while signs are positive for growth, it is one of the slower areas to recover in the nation. However, according to the Manpower Employment Outlook Survey from June 2012, “Detroit-Warren-Livonia, MI MSA employers expect to hire at a bullish pace during Quarter 3 2012. Among survey participants, the Detroit-Warren-Livonia, MI MSA employment outlook is the fifth best in the nation. From July to September, 27% of the companies interviewed plan to hire more employees, while 5% expect to reduce staff. Another 68% expect to maintain their current workforce levels and 0% are not certain of their hiring plans. This yields a Net Employment Outlook of 22%.” This is very positive for the region. Brownstown Town Center is located in Brownstown Township, which has just less than 1% of the households in the MSA and approximately 10% of the households in the Downriver Region (see Figure 1), which is Wayne County southwest of the City of Detroit (See Exhibits 2.1 and 2.2). The subject property is located within an area that has higher incomes than the rest of the Downriver area and the Detroit MSA overall (median household income of $53,000 in 2010 compared to $45,500 and $49,800 in Downriver and Detroit MSA respectively). The Detroit-Warren-Livonia MSA is expected to experience continued population decline from 2011 to 2020, according to ESRI and Economy.com, nationally recognized sources and SEMCOG, a locally recognized source (See Exhibit 2.3). However, after 2020, SEMCOG is projecting growth in the Detroit-Warren-Livonia MSA while Economy.com projects a continued decline. ESRI does not make projections out past 2016. However, SEMCOG is projecting Brownstown Township to continue to gain population throughout the entire time period. See Figure 5 below. Brownstown Township Population Projections Figure 5 SEMCOG 2040 Forecast
Change: 2010 - 20402010 2015 2020 2025 2030 2035 2040 Number %
Total Population 30,627 30,960 31,274 31,304 31,945 32,092 32,124 1,497 4.9%
Additional demographic and economic information is provided in Exhibits in Section 2.
BROWNSTOWN DDA

Page 8 E6-12962.00 July 17, 2012
For-Sale Local Competitive Market From 2000 to 2005, average annual permits were approximately 19,000 annually in the Detroit-Warren-Livonia MSA. From 2006 to 2011 permits slid to an average of 4,000 per year with the lowest permitting year in 2009 with just 1,333 permits (see Exhibit 3.1). In terms of detached and attached housing units, from 2006 to 2011, approximately 88% of permits were for single-family homes (See Exhibit 3.1). Wayne County experienced a similar decline in the number of permits from a high of 6,317 in 2004 to a low of 288 in 2009. However, a larger percentage of permits were for multifamily from 2006 to 2011 (25%). See Exhibit 3.2. Permits in Brownstown have been down a considerable amount over the past few years, at an average of 44 per year from 2007 to 2011, compared to an average of 414 from 1995 to 2006 (See Exhibit 3.3). Like the rest of Detroit, the worst year was 2009. Each year since then the number of permits has slowly begun to increase. The majority of permits in Brownstown are for single-family detached housing (90%). As with many parts of the country, there are signs that the market is beginning to slowly recover. Job growth is projected to continue to increase which has an impact on demand for housing and retail. In addition, housing activity has picked up. During first quarter 2012, 21 new homes were sold in Brownstown, compared to 57 new homes overall sold in 2011. New home sales have been down significantly in the Township from an average of 300+ to under 60 the last few years (see Exhibit 3.4). However, this is likely to improve in the coming years. Total home sales have been fairly stable the last few years, with the majority of homes sold between $100,000 and $200,000 (see Exhibit 3.5). In order to determine what prices and absorptions are feasible in this market and at the subject site, RCLCO surveyed 14 nearby single-family detached communities and five attached communities (Exhibit 3.9 to 3.12). Not all of the new projects are actively selling as some have been dormant the last few years during the recession. Of those selling, the bulk of product is offered between $150,000 and $250,000 with an average home size range of 1,500 to 2,500 ($100/SF). The best selling project is Bridgewater, a Del Webb Active Adult Community, which is selling approximately 36 homes per year. Other projects reported that sales are picking back up as well. The attached products have yet to begin to recover. There is one actively selling project at Bradbury Park – The Coves with homes priced at $150,000. Other projects have foreclosures and re-sales on the market for $40,000 to $100,000 per unit. Overall, the market is projected to recover as inventories are burned off, demand returns, and new home activity continues. Anecdotal evidence suggests that builders are back in the market purchasing developed lots and traffic has increased in communities. Once the market recovers, Brownstown Township should again be a central location for new home activity in the Downriver area. The subject site is well located to capitalize on the market when it returns. It has good access to I-75, is near existing residential, and would provide residents with the opportunity to walk to retail. All of the residential exhibits are included in exhibit section three.
BROWNSTOWN DDA

Page 9 E6-12962.00 July 17, 2012
For-Rent Local Competitive Market The overall apartment market in Brownstown is healthy. Brownstown Township is part of the Reis Downriver/South Wayne apartment submarket. Overall effective rent has remained steady in the submarket, with an average of $682/month rent (see Exhibit 3.14). Very few apartments have been constructed in the submarket in the last ten years. Occupancy is high at 95%, and absorption is up (see Exhibit 3.16). In order to determine what rents and sizes are feasible in this market and at the subject site, RCLCO surveyed five of the newest competitive apartment projects and compiled information on their performance (see Exhibit 3.18 through 3.21). Rents for competitive apartment projects averaged $0.98, which is typically a rate barely sufficient to warrant new construction of garden-style product. The highest rent in the market is at Stratford Place Apartments in Brownstown Township at $1.02/SF. Occupancies were also very high at an average of 98%. Three of the projects were built in 2004, and none have been built since that time. Many of them reported recently raising rents, and they expect that trend to continue. Overall, the market is strong for apartments. The challenge has less to do with the supply side which is constrained, but with questions about the demand side. The depth of demand for higher-end apartments in Brownstown appears to be high enough to justify new construction. Exhibit 3.25 outlines the statistical demand RCLCO created for the subject property which suggests the demand for 225 new apartments with an 11% capture of the market. We believe the project could support 250 apartment units at just over $1.00/SF. The location and the walkability to retail would be a strong draw for renters.
Office The office market is relatively weak. The subject site is located in the Reis Detroit Southwest Wayne County Submarket (Exhibit 4.1). Office absorption has been negative in the last few years with the exception of 2011. Going forward, absorption is projected to improve as the economy continues to recover (Exhibit 3.3). Rental rates have dropped from a high of over $20/SF in 2000 to just under $14/SF in 2012. It appears that rental rates have stabilized, but are not expected to grow significantly by 2016 (see Exhibit 4.5). The standard Class A and Class B office market is located north of Brownstown Township, primarily in the Dearborn area of Downriver. Office in Brownstown Township is primarily related to household needs (such as doctors, accountants, etc.). RCLCO examined information on 14 different office buildings/centers in the Downriver area (see Exhibits 4.8 and 4.9). These centers represent approximately 630,000 square feet of office space. The majority of office space closest to the subject site is located along Allen Road. Occupancies in the market vary, based primarily on the age and condition of the centers (0% – 90% occupied) with an average weighted occupancy of 57%. Rents range from $6.73/SF to $19.82/SF, with most around $14/SF.
BROWNSTOWN DDA
Page 10 E6-12962.00 July 17, 2012
The demand for office is generally weak in the overall market as the economy continues to recover. Typical office demand is based upon employment growth. As employment continues to grow in the market, so will the demand for office space, however, there is a significant amount of vacancy in the overall market that needs to be absorbed as well. The statistical demand completed by RCLCO suggests the total demand for approximately 50,000 square feet of office at the subject site (see Exhibit 4.12). Overall the opportunity in the market for office is limited. There is a significant amount of available space in the market, and the area is not a standard office market. In a true town center configuration, the site could be a good location for small, local office users (dentist, accountant, photographer, lawyer, architect) and medical office—perhaps partnering with Henry Ford Health System.
Retail The subject site is located in the Reis Downriver/South Wayne Submarket (Exhibit 5.1). Rental rates have been relatively stable for community1 and neighborhood 2 retail at approximately $14/SF for community retail and $15/SF for neighborhood retail. Both types of retail have relatively high vacancy rates (24% for community and 15% for neighborhood). See Exhibit 5.5. Traffic counts near the subject site are strong with approximately 20,000 cars per day on Telegraph Road (see Exhibit 5.6). The retail market is primarily saturated; however, many of the establishments and shopping centers in the area are in need of renovation and could likely be outperformed by new retail. RCLCO examined information on 30 different shopping centers in the Downriver area (see Exhibits 5.9 and 5.10). These centers represent 3.6 million square feet of retail space. The major centers closest to the subject site are concentrated along Eureka Road and West and Allen Roads. Occupancies in the market vary, based primarily on the age and condition of the centers (36% – 100% occupied) with an average weighted occupancy of 83%. Non-anchor rents range from $10/SF to $25/SF, with most at $15/SF. There is a lot of retail leakage both in the Township and within the Downriver Region for retail. This suggests that residents of the area shop outside of the market for many of their retail needs. This was anecdotally confirmed by talking to residents, business owners, and brokers in the market. The highest leakage within Brownstown Township is for Food Services & Drinking Places, General Merchandise Stores, Clothing, and Motor Vehicles & Parts Dealers.
1 One of the several standard classes of shopping centers recognized by The Urban Land Institute. The community shopping center usually has a junior department store or a
discount store as the major tenant. The community shopping center is typically about 150,000 square feet of store area but ranges from 100,000 square feet to 450,000 square feet. 2 The smallest type of shopping center, comprising 30,000 to 100,000 square feet. It provides for the sale of convenience goods (food, drugs, and sundries) and personal services
that meet the daily needs of an immediate neighborhood trade area. A supermarket is the principal tenant.
BROWNSTOWN DDA

Page 11 E6-12962.00 July 17, 2012
Therefore, although the demand for new space based upon new household growth is somewhat limited by the current economic climate, there is an opportunity to capture some of the retail dollars that are leaving the market. Overall the opportunity in the market for retail is mixed—it is heavily dependent upon the site. The subject site represents a good opportunity for retail. It is at the intersection of two major roads, and with the correct land plan, could capitalize on the intersection, even with the gas station on the corner. If the town center is located on the northern portion of the property at the intersection of Telegraph and Dix-Toledo, it will be necessary to have strong anchors and to create a reason for people to be there. The better location for retail is at West and Telegraph Roads. All of the retail information is included in exhibits in section four.
BROWNSTOWN DDA

Page 12 E6-12962.00 July 17, 2012
CONCLUSIONS AND RECOMMENDATIONS The subject property is well-suited for a development. It is located along a major intersection of Telegraph and West Roads, as well as the intersection of Telegraph and Dix-Toledo Roads. It is adjacent to an established residential neighborhood and enjoys good access to nearby retail and amenities. In addition, it is located adjacent to the Ice Box, an ice skating facility which draws in a large number of users, and close to the Township property. Based upon our analysis, RCLCO provided the Township with two sets of recommendations, one for a town center that roughly followed the initial site plan, and another scenario based upon moving the retail to the intersection of Telegraph and West Roads without a public and/or civic space.
Option 1: Town Center Recommendations The site has the potential to become a mixed-use town center. However, it will be challenging given the economic climate to create a vertically mixed-use town center. Rents are not high enough to justify this type of construction and developers have a hard time financing vertical mixed-use projects. Traffic counts are not as high as the concentration of retail along Allen and West Road, but similar to other town center locations, suggesting enough traffic for retailers to consider the site. In addition, the area is already a proven retail site with retail in the area (Kroger-anchored shopping center and CVS-anchored center across Telegraph). If a town center were created, it would be horizontally mixed (the land uses next to each other), but not vertically mixed (the uses on top of each other). In this scenario, it will be critical to find a key anchor for the town center. This anchor could be a large anchor retail tenant (furniture store, home furnishing store, specialty food store), a collection of restaurants, civic space (park, library, etc.), a strong connection to Ice Box with new soccer fields, and/or a YMCA (another partnering opportunity with Henry Ford Health System). The key would be to have something of scale that would attract other tenants as well as shoppers to the town center. Other key success factors include:
The development should be characterized by civic/other anchors, superior place making, enhanced internal connectivity, pedestrian access to parks and commercial uses, and strong transportation accessibility, and visibility
It is key to create and deliver an experience that the market values and that generates premiums. This includes walking linkages between the uses
Integration of civic uses will create the distinction of a public center, rather than a private development, contributing to a true “town center”
BROWNSTOWN DDA

Page 13 E6-12962.00 July 17, 2012
Civic or other anchor components should be developed in conjunction with or prior to private development to form the “core” or “beach” of the development
Site should be master-planned in anticipation of future uses to create a well-integrated development at build-out
Utilize the largest, open space to create the commercial core at the northern end of the property
Need to have strong entrance off of Dix-Toledo and strong anchors
The single-family detached on the site will buffer the existing single-family to the west
This program would allow for future expansion into the RV storage area as a mix of uses Figure 6 shows the potential location of the various land uses in Option 1. The original detailed program is shown in Exhibit 1.1. The modified program (based upon the results of the financial model) and the results of the financial model are provided in Exhibit 7.1. The financial model suggests the property is worth approximately $5 million, depending on the amount of infrastructure that needs to be included to sell it, it could be closer to $4 million.
Figure 6 Option 1, Potential Site Plan
BROWNSTOWN DDA

Page 14 E6-12962.00 July 17, 2012
Option 2: Not Town Center Recommendations The site is well-suited for a variety of land uses. In addition to the Town Center option above, RCLCO considered an option that did not mix the land uses or create a town center, but broke the development into three different parcels (although someone could buy and develop all of them). In this scenario, each land use would be optimized for location as well as size. This program is less risky than the town center option. Key considerations and means to success of this scenario include the following:
Retail would be along Telegraph and West Roads. It will be important to have a land plan that demonstrates the visibility of the retail from the intersection with the existing gas station
The single-family detached would occupy the largest portion of the property and create a community of scale. Ideally, it would be walkable to the retail and to the Brownstown Township Recreation Campus
Garden-style apartment complex along West Road taking advantage of the wetlands and location off West Road, close to the retail
Provide walking linkages between land uses
Would allow for future expansion into RV storage area as a mix of uses
Additional frontage on Telegraph for commercial—this could be either stand-alone retail (restaurant or bank) or a small office building Figure 7 shows the potential location of the various land uses in Option 2. The original detailed program is shown in Exhibit 1.1. The modified program (based upon the results of the financial model) and the results of the financial model are provided in Exhibit 7.2. The financial model suggests the land is worth approximately $5 million, or $4.5 million, depending on the amount of costs necessary to improve land prior to selling. This is similar to Option 1. However, this scenario is less risky given the type of development and location of land uses.
BROWNSTOWN DDA

Page 15 E6-12962.00 July 17, 2012
Figure 7 Option 2, Potential Site Plan
BROWNSTOWN DDA

Page 16 E6-12962.00 July 17, 2012
CRITICAL ASSUMPTIONS Our conclusions are based on our analysis of the information available from our own sources and from the client as of the date of this report. We assume that the information is correct, complete, and reliable. We made certain assumptions about the future performance of the global, national, and local economy and real estate market, and on other factors similarly outside either our control or that of the client. We analyzed trends and the information available to us in drawing these conclusions. However, given the fluid and dynamic nature of the economy and real estate markets, as well as the uncertainty surrounding particularly the near-term future, it is critical to monitor the economy and markets continuously and to revisit the aforementioned conclusions periodically to ensure that they stand the test of time. We assume that the economy and real estate markets are close to bottoming out for the current cycle, and that they will grow at a stable and moderate rate starting in 2011, more or less in a straight line on average for the duration of the analysis period (to 2020 and beyond). However, history tells us that stable and moderate growth patterns are not sustainable over extended periods of time, and that the economy is cyclical and that the real estate markets are typically highly sensitive to business cycles. Further, it is very difficult to predict when the current economic and real estate downturns will end, and what will be the shape and pace of growth once they are recovered. With the above in mind, we assume that the long term average absorption rates and price changes will be as projected, realizing that most of the time performance will be either above or below said average rates. Our analysis does not take into account the potential impact of future economic shocks on the national and/or local economy, and does not necessarily account for the potential benefits from major "booms,” if and when they occur. Similarly, the analysis does not necessarily reflect the residual impact on the real estate market and the competitive environment of such a shock or boom. Also, it is important to note that it is difficult to predict changing consumer and market psychology. For all the reasons outlined, we recommend the close monitoring of the economy and the marketplace, and updating this analysis as appropriate. Further, the project and investment economics should be “stress tested” to ensure that potential fluctuations in revenue and cost assumptions resulting from alternative scenarios regarding the economy and real estate market conditions will not cause failure.
In addition, we assume that once the current cycle is over, the following will occur in accordance with current expectations:
Economic, employment, and household growth.
BROWNSTOWN DDA

Page 17 E6-12962.00 July 17, 2012
Other forecasts of trends and demographic and economic patterns, including consumer confidence levels.
The cost of development and construction.
Tax laws (i.e., property and income tax rates, deductibility of mortgage interest, and so forth).
The availability and cost of capital and mortgage financing for real estate developers, owners and buyers, at levels present in the market before the most recent run up (i.e., early 2000s levels).
Competitive projects will be developed as planned (active and future) and that a reasonable stream of supply offerings will satisfy real estate demand.
Major public works projects occur and are completed as planned.
Should any of the above change, this analysis should probably be updated, with the conclusions reviewed accordingly (and possibly revised).
BROWNSTOWN DDA

Page 18
E6-12962.00 July 17, 2012
GENERAL LIMITING CONDITIONS Reasonable efforts have been made to ensure that the data contained in this study reflect accurate and timely information and are believed to be reliable. This study is based on estimates, assumptions, and other information developed by RCLCO from its independent research effort, general knowledge of the industry, and consultations with the client and its representatives. No responsibility is assumed for inaccuracies in reporting by the client, its agent, and representatives or in any other data source used in preparing or presenting this study. This report is based on information that to our knowledge was current as of the date of this report, and RCLCO has not undertaken any update of its research effort since such date. Our report may contain prospective financial information, estimates, or opinions that represent our view of reasonable expectations at a particular time, but such information, estimates, or opinions are not offered as predictions or assurances that a particular level of income or profit will be achieved, that particular events will occur, or that a particular price will be offered or accepted. Actual results achieved during the period covered by our prospective financial analysis may vary from those described in our report, and the variations may be material. Therefore, no warranty or representation is made by RCLCO that any of the projected values or results contained in this study will be achieved. Possession of this study does not carry with it the right of publication thereof or to use the name of "Robert Charles Lesser & Co." or "RCLCO" in any manner without first obtaining the prior written consent of RCLCO. No abstracting, excerpting, or summarization of this study may be made without first obtaining the prior written consent of RCLCO. This report is not to be used in conjunction with any public or private offering of securities or other similar purpose where it may be relied upon to any degree by any person other than the client without first obtaining the prior written consent of RCLCO. This study may not be used for any purpose other than that for which it is prepared or for which prior written consent has first been obtained from RCLCO.

APPENDIX: SUPPORTING EXHIBITS
BROWNSTOWN DDA

Page i E6-12962.00 July 17, 2012
LIST OF EXHIBITS
I. RECOMMENDATIONS
Exhibit I-1 Recommendations; Brownstown Town Center; June 2012
II. SOCIOECONOMICS
Exhibit II-1 Location Map; Brownstown Township, Woodhaven, and Downriver Region
Exhibit II-2 Comparative Socioeconomic Characteristics; Brownstown Township, Woodhaven, Downriver Region, and Detroit MSA; 2000 – 2016
Exhibit II-3 Projected Population Growth; Wayne County Excluding Detroit; 2000 – 2035
Exhibit II-4A Households by Age and Income; Brownstown Township, MI; 2010
Exhibit II-4B Households by Age and Income; Woodhaven, MI; 2010
Exhibit II-4C Households by Age and Income; Downriver Region, MI; 2010
Exhibit II-5 Household Shares; Downriver Region, Brownstown Township, and Woodhaven; 2000 – 2015
Exhibit II-6 Housing Unit Trends; Downriver Region, Brownstown Township, and Woodhaven; 2000 – 2015
Exhibit II-7A Compound Annual Growth Rates; Downriver Region, Brownstown Township, and Woodhaven; 2000 – 2015
Exhibit II-7B Household Shares; Downriver Region, Brownstown Township, and Woodhaven; 2000 – 2015
Exhibit II-8 Population 25+ by Educational Attainment; Brownstown Township, Woodhaven, Downriver Region, and Detroit MSA; 2010
Exhibit II-9 Inbound and Outbound Migration; Wayne County, MI; 2010
BROWNSTOWN DDA

Page ii E6-12962.00 July 17, 2012
Exhibit II-10 Place of Employment by Zip Code; Residents Living in Brownstown Township; 2010
Exhibit II-11 Place of Residence by Zip Code; Employees Working in Brownstown Township; 2010
Exhibit II-12 Projected Employment Growth; Wayne County Excluding Detroit; 2000 – 2035
Exhibit II-13 Household Annual Growth Rate by Block Group; Brownstown Township, MI; 2000 – 2010
Exhibit II-14 Household Annual Growth Rate by Block Group; Brownstown Township, MI; 2010 – 2015
Exhibit II-15 Household Density by Block Group; Brownstown Township, MI; 2010
Exhibit II-16 Median Household Income by Block Group; Brownstown Township, MI; 2010
Exhibit II-17 Median Age by Block Group; Brownstown Township, MI; 2010
Exhibit II-18 Median Home Values by Block Group; Brownstown Township, MI; 2010
Exhibit II-19 Employment Density by Block Group; Brownstown Township, MI; 2010
Exhibit II-20 Percent of Rent Occupied Housing Units by Block Group; Brownstown Township, MI; 2010
Exhibit II-21 Number of Employees; Brownstown Township, MI; 2010
Exhibit II-22 Shopping Centers; Brownstown Township, MI; 2010
III. RESIDENTIAL
Exhibit III-1A Historical Single-Family and Multifamily Permits; Detroit MSA; 1990 – YTD 2012
Exhibit III-1B Historical Single-Family and Multifamily Permits; Wayne County, MI; 1990 – YTD 2012
Exhibit III-1C Historical Single-Family and Multifamily Permits; Brownstown Township, MI; 1990 – YTD 2012
Exhibit III-2 Multifamily Share of Permits; Detroit MSA, Wayne County, and Brownstown Township; 1990 – 2011
Exhibit III-3 Geographic Share of Permits; Brownstown Township, Wayne County, and Detroit MSA; 1990 – 2011
BROWNSTOWN DDA

Page iii E6-12962.00 July 17, 2012
Exhibit III-4 Total New Home Sales and Percentage Distribution by Price Range; Brownstown Township; 2004 – YTD 2012
Exhibit III-5 Total Home Sales by Price Range; Brownstown Township and Downriver Region; 2Q 2008 – 1Q 2012
Exhibit III-6 Inventory Analysis of Vacant Developed Lots; Brownstown Township; May 25, 2012
Exhibit III-7 Brownstown Total Home Sales by Price Range as a Percent of the Downriver Region; Brownstown Township and Downriver Region; 2Q 2009 – 1Q 2012
Exhibit III-8 Percentage Breakdown of Home Sales by Price Range; Brownstown Township and Downriver Region; 2Q 2009 – 1Q 2012
Exhibit III-9 For-Sale Communities Map; Detroit Downriver Region; 2012
Exhibit III-10 Summary of Selected Competitive Single-Family Detached Properties; Competitive Market Area; May 2012
Exhibit III-11 Home Price to Unit Size Relationship; Comparable Single-Family Projects; May 2012
Exhibit III-12 Survey of Selected Competitive Attached Properties; Competitive Market Area; May 2012
Exhibit III-13 RESI Submarket Map; Downriver/South Wayne Submarket
Exhibit III-14 Effective Rents; Downriver/South Wayne Submarket; 2000 – 2011
Exhibit III-15 Annual Completions; Downriver/South Wayne Submarket; 2000 – 2011
Exhibit III-16 Annual Absorption and Occupancy Rate Trends; Downriver/South Wayne Submarket; 2000 – 2011
Exhibit III-17 Effective Rent and Occupied Inventory Trends; Downriver/South Wayne Submarket; 2000 – 2011
Exhibit III-18 Map of Competitive Apartment Projects; Detroit Downriver Region, MI; May 2012
Exhibit III-19 Summary of Apartment Market Comparables; Detroit Downriver Region, MI; May 2012
Exhibit III-20 Effective Base Rent to Unit Size Relationship; Competitive Apartments; May 2012
Exhibit III-21 Effective Base Rent to Unit Size Relationship by Unit Type; Competitive Apartments; May 2012
BROWNSTOWN DDA
Page iv E6-12962.00 July 17, 2012
Exhibit III-22 Summary of Older Apartment Developments; Detroit Downriver Region, MI; May 2012
Exhibit III-23 Distribution of Gross Rent; Brownstown Township; 2010
Exhibit III-24 Distribution of Gross Rent; Detroit Downriver Region; 2010
Exhibit III-25 Annual Rental Demand Potential; Detroit Downriver Region
Exhibit III-26 Annual New Home Demand Potential; Detroit Downriver Region and Brownstown Town Center; 2011 – 2016
IV. OFFICE
Exhibit IV-1 Office Submarket Map; Detroit Southwest Wayne County Submarket; 2012
Exhibit IV-2 Historical and Projected Office Stock; Detroit MSA; 1990 – 2016
Exhibit IV-3 Historical and Projected Office Stock; Detroit Southwest Wayne County Submarket; 1995 – 2016
Exhibit IV-4 Historical and Projected Office Absorption; Southwest Wayne County and Detroit MSA; 1995 – 2016
Exhibit IV-5 Effective Rate and Vacancy Rate; Southwest Wayne County and Detroit MSA; 1995 – 2016
Exhibit IV-6 Ratio of Asking Rent to Effective Rent; Southwest Wayne County and Detroit MSA; 1995 – 2016
Exhibit IV-7 Number of Employees; Brownstown Township, MI; 2010
Exhibit IV-8 Comparable Office Developments Map; Detroit Downriver Region; 2012
Exhibit IV-9 Office Comparable Developments; Detroit Downriver Region; 2012
Exhibit IV-10 Business Summary – Number of Businesses; Brownstown Township; 2010
Exhibit IV-11 Business Share; Brownstown Township, MI; 2010
Exhibit IV-12 Office Demand; Brownstown Township; 2012 – 2025
BROWNSTOWN DDA

Page v E6-12962.00 July 17, 2012
V. RETAIL
Exhibit V-1 Retail Submarket Map; Downriver/South Wayne Submarket; 2012
Exhibit V-2 Historical and Projected Neighborhood and Community Retail Stock; Detroit Downriver Submarket; 2000 – 2016
Exhibit V-3 Historical and Projected Neighborhood and Community Retail Stock; Detroit MSA; 1995 – 2016
Exhibit V-4 Submarket Share of Metro Area Retail Stock; Downriver Submarket and Detroit MSA; 2000 – 2016
Exhibit V-5 Historical Effective Rents and Vacancy Rates; Detroit Downriver Submarket; 2000 – 2011
Exhibit V-6 Average Daily Traffic Counts; Detroit Downriver Region; 2010
Exhibit V-7 Grocery and General Merchandise Retail Map; Brownstown Township, MI; 2012
Exhibit V-8 1-, 3-, and 5-Mile Ring; Brownstown Township, MI; 2012
Exhibit V-9 Retail Comparables Map; Detroit Downriver Region; 2012
Exhibit V-10 Neighborhood Center and Community Center Retail Comparables; Brownstown Township, MI; 2012
Exhibit V-11 Retail Business Share; Brownstown Township; 2010
Exhibit V-12 Retail Surplus and Leakage; Brownstown Township and Downriver Region; 2010
Exhibit V-13 Retail Requirements; Grocery Stores
Exhibit V-14 Retail Requirements, Furniture and Electronics
Exhibit V-15 Retail Requirements, Health and Professional Care
Exhibit V-16 Retail Requirements, Department Store
Exhibit V-17 Retail Requirements, Clothing Store
Exhibit V-18 Retail Requirements, Other/Miscellaneous
BROWNSTOWN DDA

Page vi E6-12962.00 July 17, 2012
Exhibit V-19 Retail Requirements, Limited Service Restaurants
Exhibit V-20 Retail Requirements, Full Service Restaurants
Exhibit V-21 Retail Demand Based on Current Unmet Demand by Supply of Retail in Trade Areas; Brownstown Township, MI; 2010
VI. CASE STUDIES
Exhibit VI-1 Summary of Investment Criteria from Steiner and Associates; Compared to Brownstown Town Center; May 2012
Exhibit VI-2 Community Case Studies; Town Center Case Studies; May 2012
VII. FINANCIAL MODEL
Exhibit VII-1 Financial Analysis – Option 1; Brownstown Town Center; July 2012
Exhibit VII-2 Residual Land Value Analysis – Brownstown Town Center; Option 1 Potential Land Use Locations; July 2012
Exhibit VII-3 Financial Analysis – Option 2; Brownstown Town Center; July 2012
Exhibit VII-4 Residual Land Value Analysis – Brownstown Town Center; Option 2 Potential Land Use Locations; July 2012
Exhibit VII-5 Recommendations by Land Use; Brownstown Town Center; July 2012
Exhibit VII-6 Residual Land Value Analysis – Brownstown Town Center; Single-Family Detached; July 2012
Exhibit VII-7 Residual Land Value Analysis – Brownstown Town Center; Garden-Style Apartments; July 2012
Exhibit VII-8 Residual Land Value Analysis – Brownstown Town Center; Retail; July 2012
Exhibit VII-9 Residual Land Value Analysis – Brownstown Town Center; Office ; July 2012
BROWNSTOWN DDA

I. RECOMMENDATIONS
BROWNSTOWN DDA

Exhibit I-1
RECOMMENDATIONSBROWNSTOWN TOWN CENTER
JUNE 2012
Site Acres 78.04Wetland/Drainage Swale 11.23Developable Acres 66.81
Land Use Option 1
Land Use AcresDensity
(FAR/Lot Size)Total
SF/UnitsRent/Price
/Unit/SF 2013 2014 2015 2016 2017 2018 2019 2020Park/Open Space 8Single-Family Detached 22.5 70x140 60 $200,000 30 30Apartments 12.5 20 Units/Acre 250 $1,100 100 150Retail 17.0 0.25 185,000 $20 55,000 55,000 75,000Office 4.6 0.25 50,000 $16 25,000 25,000Total 64.6
Land Use Option 2
Land Use AcresDensity
(FAR/Lot Size)Total
SF/UnitsRent/Price/
Unit/SF 2013 2014 2015 2016 2017 2018 2019 2020Park/Open Space 8Single-Family Detached 32.6 80x150 71 $225,000 30 30 11Apartments 12.5 20 Units/Acre 250 $1,100 100 150Retail 13.8 0.25 150,000 $20 55,000 55,000 40,000Office 0.0 0.25 0 $16Total 66.9
Old PlanApartments & THs 10 7.2 72Single-Family Detached 14 80-150 23Senior Hsg 12 0.1 37,000Townhomes 2.5 8.0 20Community Center 4.4 0.2 50,000Commercial 15.1 0.2 123,000
58Acres
North of RV 32East of Wetland 12West of Wetland,Behind RV 23Wetlands 11Total 78
SOURCE: RCLCORecs
E6-12962.00Printed: 7/16/2012
BROWNSTOWN DDA

II. SOCIOECONOMICS
BROWNSTOWN DDA

Exhibit II-1
LOCATION MAPBROWNSTOWN TOWNSHIP, WOODHAVEN, AND DOWNRIVER REGION
DOWNRIVER REGION
BROWNSTOWNTOWNSHIP
WOODHAVEN
SOURCE: ESRI Business Analyst; RCLCO
WOODHAVEN
MapE6-12962.00
Printed: 7/16/2012
BROWNSTOWN DDA

Exhibit II-2
COMPARATIVE SOCIOECONOMIC CHARACTERISTICS BROWNSTOWN TOWNSHIP, WOODHAVEN, DOWNRIVER REGION, AND DETROIT MSA
2000 - 2016
BROWNSTOWN DOWNRIVERCHARACTERISTIC TOWNSHIP WOODHAVEN REGION DETROIT MSA
2000 Population (Census) 28,463 12,530 358,447 4,452,5572010 Population (Census) 36,179 12,875 357,259 4,296,2502011 Population (ESRI) 36,242 12,897 355,191 4,267,7312016 Population (ESRI) 35,489 12,493 341,467 4,183,875
Pop. Growth Rate, 2000 - 2010 2.4% 0.3% 0.0% -0.4%Pop. Growth Rate, 2011 - 2016 -0.4% -0.6% -0.8% -0.4%
2000 Households (Census) 10,411 4,708 140,515 1,696,9432010 Households (Census) 13,440 5,159 141,759 1,682,1112011 Households (ESRI) 13,435 5,163 140,805 1,670,9492016 Households (ESRI) 13,224 5,074 136,046 1,647,685
Household Growth Rate, 2000 - 2010 2.6% 0.9% 0.1% -0.1%Household Growth Rate, 2011 - 2016 -0.3% -0.3% -0.7% -0.3%
2011 Household Size 2.70 2.50 2.52 2.55
2011 Per Capita Income $24,286 $28,930 $23,215 $26,2302011 Median Household Income $53,434 $57,146 $45,526 $49,7922011 Average Household Income $64,958 $71,352 $58,005 $66,156
2.4%ANNUAL POPULATION GROWTH RATES, 2000-2016
SOURCE: ESRI Business Analyst; RCLCO
2.6%
-0.3%
0.9%
-0.3%
0.1%
-0.7%-0.1% -0.3%
2000-2010 2011-2016
ANNUAL HOUSEHOLD GROWTH RATES, 2000-2016
Brownstown Township Woodhaven Downriver Detroit MSA
-0.4%
0.3%
-0.6%0.0%
-0.8%-0.4% -0.4%
2000-2010 2011-2016
Brownstown Township Woodhaven Downriver Detroit MSA
Pop and HHsE6-12962.00
Printed: 7/16/2012
BROWNSTOWN DDA

Exhibit II-3
PROJECTED POPULATION GROWTHWAYNE COUNTY EXCLUDING DETROIT
2000 - 2035
1,000
1,050
1,100
1,150
1,200
opul
atio
n (T
hous
ands
)
NOTE: Historical Data per SEMCOG. Economy.com projection based on growth rate for Wayne County.
SOURCE: ESRI Business Analyst; Economy.com; SEMCOG; RCLCO
850
900
950
2000
2001
2002
2003
2004
2005
2006
2007
2008
2009
2010
2011
2012
2013
2014
2015
2016
2017
2018
2019
2020
2021
2022
2023
2024
2025
2026
2027
2028
2029
2030
2031
2032
2033
2034
2035
Po
SEMCOG ESRI ECONOMY.COM
Population Proj.E6-12962.00
Printed: 7/16/2012
BROWNSTOWN DDA

Exhibit II-4A
HOUSEHOLDS BY AGE AND INCOMEBROWNSTOWN TOWNSHIP, MI
2010
PROFESSIONALS EMPTY NESTERS RETIREESUNDER 25 25-34 35-44 45-54 55-64 65-74 75 AND OVER TOTAL
INCOME RANGE TOTAL PCT. TOTAL PCT. TOTAL PCT. TOTAL PCT. TOTAL PCT. TOTAL PCT. TOTAL PCT. TOTAL PCT.
Less than $25,000 152 32% 178 8% 195 8% 149 6% 264 12% 323 29% 318 46% 1,579 14%$25,000 - $34,999 64 13% 165 8% 122 5% 108 4% 215 10% 164 15% 97 14% 935 8%$35,000 - $49,999 149 31% 433 20% 283 12% 336 13% 295 13% 243 22% 107 15% 1,846 16%$50,000 - $74,999 54 11% 702 33% 798 33% 726 28% 615 28% 150 14% 61 9% 3,106 27%$75,000 - $99,999 14 3% 398 18% 492 21% 567 22% 273 12% 93 8% 44 6% 1,881 16%
$100,000 - $149,999 26 5% 221 10% 372 16% 579 22% 398 18% 60 5% 20 3% 1,676 14%$150,000 - $199,999 18 4% 23 1% 126 5% 111 4% 122 6% 44 4% 39 6% 483 4%$200,000 - $249,999 3 1% 20 1% 3 0% 10 0% 22 1% 15 1% 8 1% 81 1%$250,000 - $499,999 0 0.0% 12 1% 1 0% 9 0% 9 0% 4 0% 0 0% 35 0%$500,000 and above 0 0.0% 0 0% 0 0% 0 0% 0 0% 0 0% 0 0% 0 0%
TOTAL 480 100% 2,152 100% 2,392 100% 2,595 100% 2,213 100% 1,096 100% 694 100% 11,622 100%Percent of Total 4% 19% 21% 22% 19% 9% 6% 100%
27%
HOUSEHOLDS BY INCOME
21%22%
19%
HOUSEHOLDS BY AGE
SOURCE: ESRI Business Analyst; RCLCO
22%
16% 16%14%
5%
Less than $35,000
$35,000-$49,999
$50,000-$74,999
$75,000-$99,999
$100,000-$149,999
$150,000 and above
4%
19% 19%
9%
6%
Under 25 25-34 35-44 45-54 55-64 65-74 75 and over
Brownstwn AxIE6-12962.00
Printed: 7/16/2012
BROWNSTOWN DDA
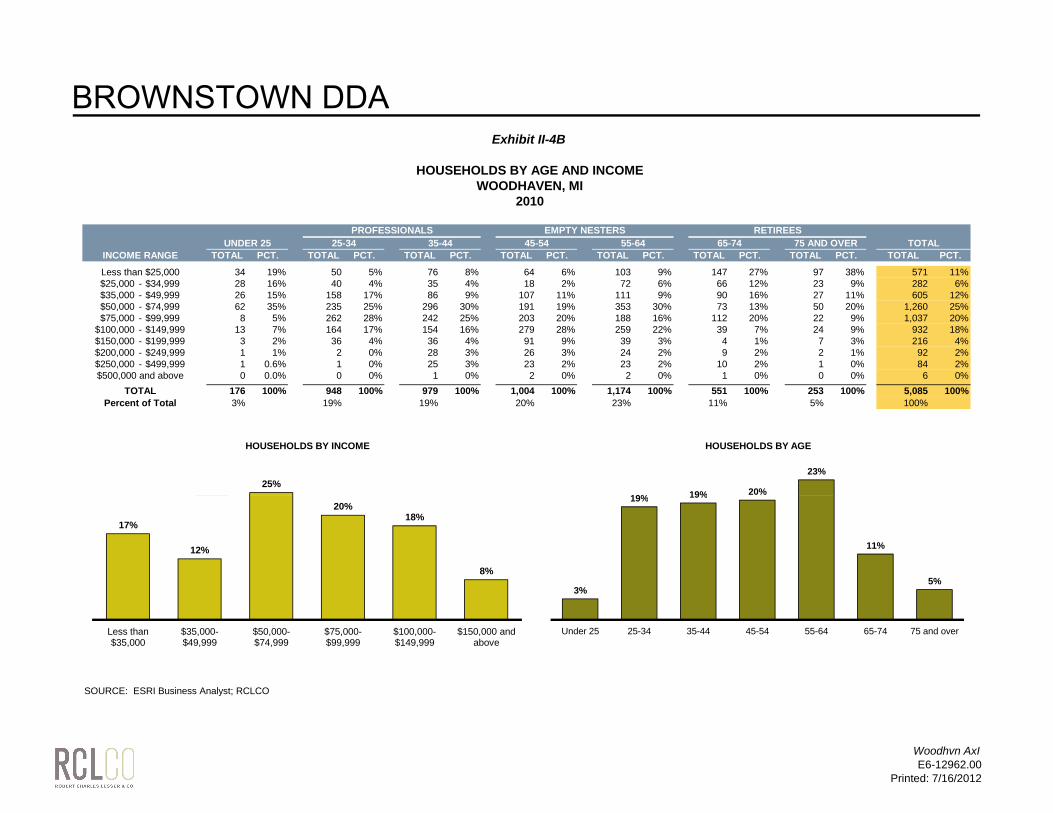
Exhibit II-4B
HOUSEHOLDS BY AGE AND INCOMEWOODHAVEN, MI
2010
PROFESSIONALS EMPTY NESTERS RETIREESUNDER 25 25-34 35-44 45-54 55-64 65-74 75 AND OVER TOTAL
INCOME RANGE TOTAL PCT. TOTAL PCT. TOTAL PCT. TOTAL PCT. TOTAL PCT. TOTAL PCT. TOTAL PCT. TOTAL PCT.
Less than $25,000 34 19% 50 5% 76 8% 64 6% 103 9% 147 27% 97 38% 571 11%$25,000 - $34,999 28 16% 40 4% 35 4% 18 2% 72 6% 66 12% 23 9% 282 6%$35,000 - $49,999 26 15% 158 17% 86 9% 107 11% 111 9% 90 16% 27 11% 605 12%$50,000 - $74,999 62 35% 235 25% 296 30% 191 19% 353 30% 73 13% 50 20% 1,260 25%$75,000 - $99,999 8 5% 262 28% 242 25% 203 20% 188 16% 112 20% 22 9% 1,037 20%
$100,000 - $149,999 13 7% 164 17% 154 16% 279 28% 259 22% 39 7% 24 9% 932 18%$150,000 - $199,999 3 2% 36 4% 36 4% 91 9% 39 3% 4 1% 7 3% 216 4%$200,000 - $249,999 1 1% 2 0% 28 3% 26 3% 24 2% 9 2% 2 1% 92 2%$250,000 - $499,999 1 0.6% 1 0% 25 3% 23 2% 23 2% 10 2% 1 0% 84 2%$500,000 and above 0 0.0% 0 0% 1 0% 2 0% 2 0% 1 0% 0 0% 6 0%
TOTAL 176 100% 948 100% 979 100% 1,004 100% 1,174 100% 551 100% 253 100% 5,085 100%Percent of Total 3% 19% 19% 20% 23% 11% 5% 100%
25%
HOUSEHOLDS BY INCOME
19% 19% 20%
23%
HOUSEHOLDS BY AGE
25%
HOUSEHOLDS BY INCOME
19% 19% 20%
23%
HOUSEHOLDS BY AGE
SOURCE: ESRI Business Analyst; RCLCO
17%
12%
20%18%
8%
Less than $35,000
$35,000-$49,999
$50,000-$74,999
$75,000-$99,999
$100,000-$149,999
$150,000 and above
3%
19% 19%
11%
5%
Under 25 25-34 35-44 45-54 55-64 65-74 75 and over
17%
12%
20%18%
8%
Less than $35,000
$35,000-$49,999
$50,000-$74,999
$75,000-$99,999
$100,000-$149,999
$150,000 and above
3%
19% 19%
11%
5%
Under 25 25-34 35-44 45-54 55-64 65-74 75 and over
Woodhvn AxIE6-12962.00
Printed: 7/16/2012
BROWNSTOWN DDA
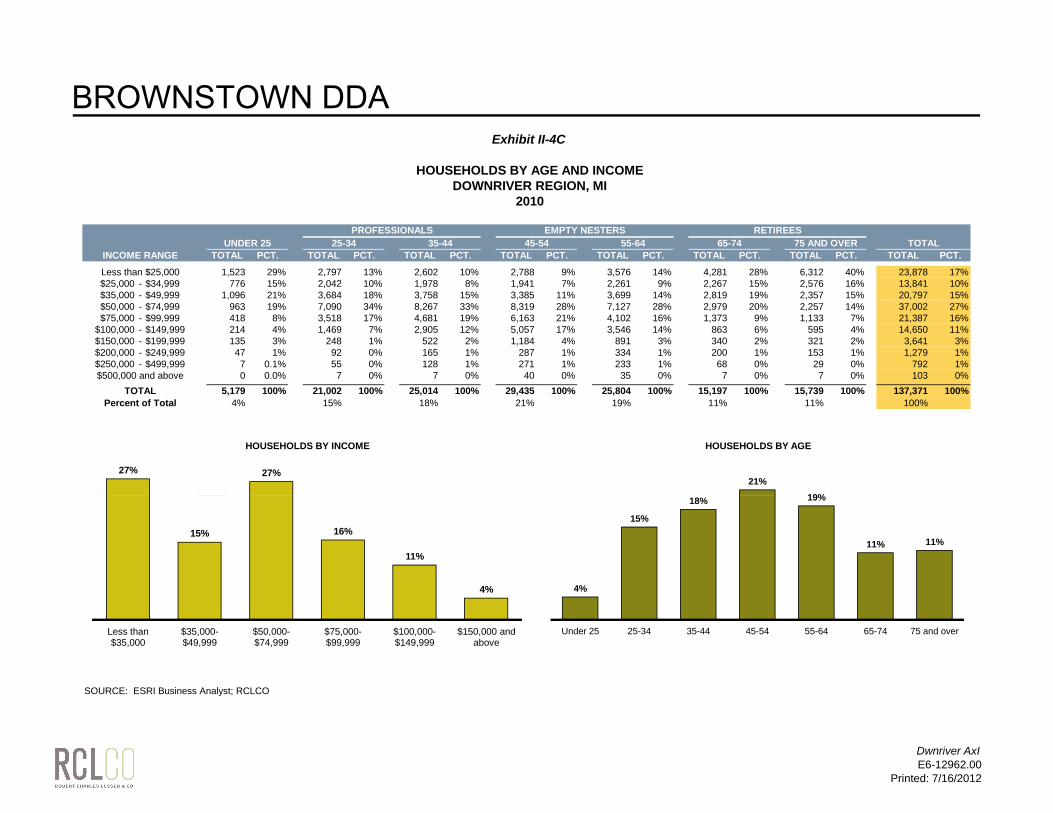
Exhibit II-4C
HOUSEHOLDS BY AGE AND INCOMEDOWNRIVER REGION, MI
2010
PROFESSIONALS EMPTY NESTERS RETIREESUNDER 25 25-34 35-44 45-54 55-64 65-74 75 AND OVER TOTAL
INCOME RANGE TOTAL PCT. TOTAL PCT. TOTAL PCT. TOTAL PCT. TOTAL PCT. TOTAL PCT. TOTAL PCT. TOTAL PCT.
Less than $25,000 1,523 29% 2,797 13% 2,602 10% 2,788 9% 3,576 14% 4,281 28% 6,312 40% 23,878 17%$25,000 - $34,999 776 15% 2,042 10% 1,978 8% 1,941 7% 2,261 9% 2,267 15% 2,576 16% 13,841 10%$35,000 - $49,999 1,096 21% 3,684 18% 3,758 15% 3,385 11% 3,699 14% 2,819 19% 2,357 15% 20,797 15%$50,000 - $74,999 963 19% 7,090 34% 8,267 33% 8,319 28% 7,127 28% 2,979 20% 2,257 14% 37,002 27%$75,000 - $99,999 418 8% 3,518 17% 4,681 19% 6,163 21% 4,102 16% 1,373 9% 1,133 7% 21,387 16%
$100,000 - $149,999 214 4% 1,469 7% 2,905 12% 5,057 17% 3,546 14% 863 6% 595 4% 14,650 11%$150,000 - $199,999 135 3% 248 1% 522 2% 1,184 4% 891 3% 340 2% 321 2% 3,641 3%$200,000 - $249,999 47 1% 92 0% 165 1% 287 1% 334 1% 200 1% 153 1% 1,279 1%$250,000 - $499,999 7 0.1% 55 0% 128 1% 271 1% 233 1% 68 0% 29 0% 792 1%$500,000 and above 0 0.0% 7 0% 7 0% 40 0% 35 0% 7 0% 7 0% 103 0%
TOTAL 5,179 100% 21,002 100% 25,014 100% 29,435 100% 25,804 100% 15,197 100% 15,739 100% 137,371 100%Percent of Total 4% 15% 18% 21% 19% 11% 11% 100%
27% 27%
HOUSEHOLDS BY INCOME
21%19%
HOUSEHOLDS BY AGE
27% 27%
HOUSEHOLDS BY INCOME
21%19%
HOUSEHOLDS BY AGE
SOURCE: ESRI Business Analyst; RCLCO
15% 16%
11%
4%
Less than $35,000
$35,000-$49,999
$50,000-$74,999
$75,000-$99,999
$100,000-$149,999
$150,000 and above
4%
15%
18% 19%
11% 11%
Under 25 25-34 35-44 45-54 55-64 65-74 75 and over
15% 16%
11%
4%
Less than $35,000
$35,000-$49,999
$50,000-$74,999
$75,000-$99,999
$100,000-$149,999
$150,000 and above
4%
15%
18% 19%
11% 11%
Under 25 25-34 35-44 45-54 55-64 65-74 75 and over
Dwnriver AxIE6-12962.00
Printed: 7/16/2012
BROWNSTOWN DDA
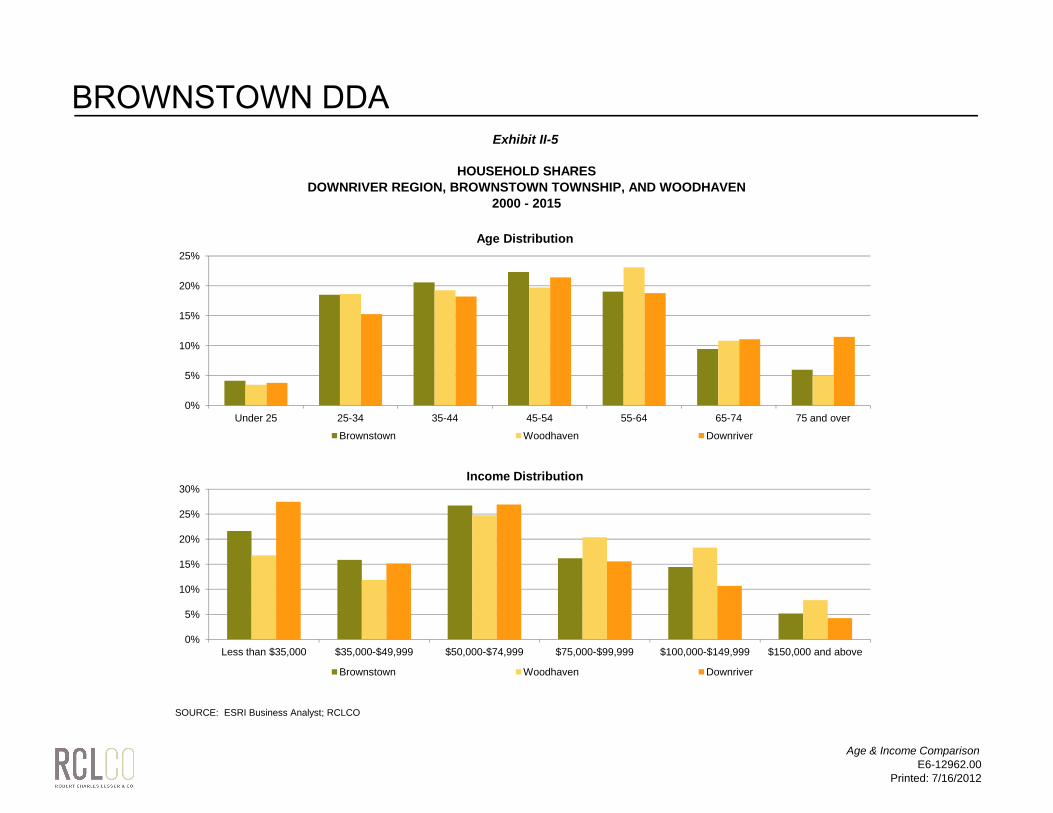
Exhibit II-5
HOUSEHOLD SHARESDOWNRIVER REGION, BROWNSTOWN TOWNSHIP, AND WOODHAVEN
2000 - 2015
0%
5%
10%
15%
20%
25%
Under 25 25-34 35-44 45-54 55-64 65-74 75 and over
Age Distribution
Brownstown Woodhaven Downriver
30%Income Distribution
SOURCE: ESRI Business Analyst; RCLCO
0%
5%
10%
15%
20%
25%
Less than $35,000 $35,000-$49,999 $50,000-$74,999 $75,000-$99,999 $100,000-$149,999 $150,000 and above
Brownstown Woodhaven Downriver
Age & Income ComparisonE6-12962.00
Printed: 7/16/2012
BROWNSTOWN DDA
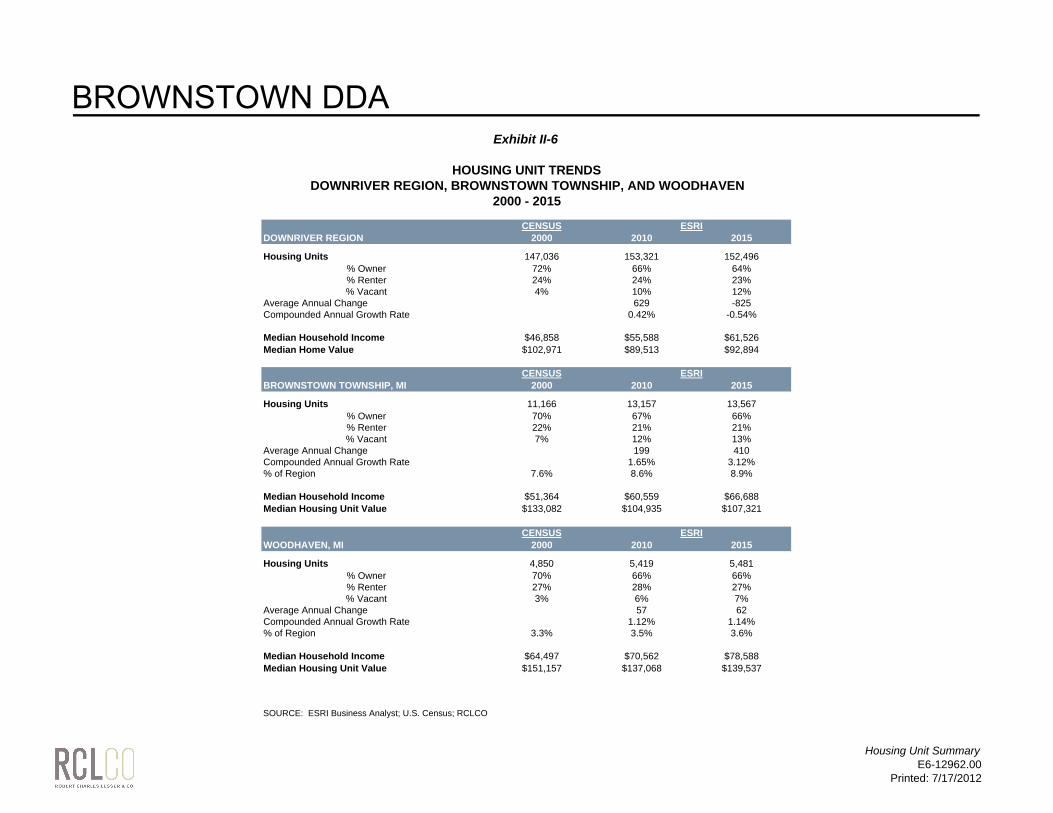
CENSUSDOWNRIVER REGION 2000 2010 2015
Housing Units 147,036 153,321 152,496% Owner 72% 66% 64%% Renter 24% 24% 23%% Vacant 4% 10% 12%
Average Annual Change 629 -825Compounded Annual Growth Rate 0.42% -0.54%
Median Household Income $46,858 $55,588 $61,526Median Home Value $102,971 $89,513 $92,894
CENSUSBROWNSTOWN TOWNSHIP, MI 2000 2010 2015
Housing Units 11,166 13,157 13,567% Owner 70% 67% 66%% Renter 22% 21% 21%% Vacant 7% 12% 13%
Average Annual Change 199 410Compounded Annual Growth Rate 1.65% 3.12%% of Region 7.6% 8.6% 8.9%
Median Household Income $51,364 $60,559 $66,688Median Housing Unit Value $133,082 $104,935 $107,321
CENSUSWOODHAVEN, MI 2000 2010 2015
Housing Units 4,850 5,419 5,481% Owner 70% 66% 66%% Renter 27% 28% 27%% Vacant 3% 6% 7%
Average Annual Change 57 62Compounded Annual Growth Rate 1.12% 1.14%% of Region 3.3% 3.5% 3.6%
Median Household Income $64,497 $70,562 $78,588Median Housing Unit Value $151,157 $137,068 $139,537
SOURCE: ESRI Business Analyst; U.S. Census; RCLCO
ESRI
ESRI
Exhibit II-6
HOUSING UNIT TRENDSDOWNRIVER REGION, BROWNSTOWN TOWNSHIP, AND WOODHAVEN
2000 - 2015
ESRI
Housing Unit SummaryE6-12962.00
Printed: 7/17/2012
BROWNSTOWN DDA

Exhibit II-7A
COMPOUND ANNUAL GROWTH RATESDOWNRIVER REGION, BROWNSTOWN TOWNSHIP, AND WOODHAVEN
2000 - 2015
$0
$10,000
$20,000
$30,000
$40,000
$50,000
$60,000
$70,000
$80,000
$90,0002000 2010 2015
Downriver Region Median Income Brownstown Township Median Income Woodhaven Median Income
$160,000.002000 2010 2015
SOURCE: ESRI Business Analyst; U.S. Census; RCLCO
$0.00
$20,000.00
$40,000.00
$60,000.00
$80,000.00
$100,000.00
$120,000.00
$140,000.00
Downriver Region Median HV Brownstown Township Median HV Woodhaven Median HV
HU and Income GraphsE6-12962.00
Printed: 7/17/2012
BROWNSTOWN DDA

Exhibit II-7B
HOUSEHOLD SHARESDOWNRIVER REGION, BROWNSTOWN TOWNSHIP, AND WOODHAVEN
2000 - 2015
72% 66% 64%
24% 24% 23%
4% 10% 12%
0%
20%
40%
60%
80%
100%2000 2010 2015
Downriver Region Vacant % Downriver Region Renter % Downriver Region Owner %
70% 67% 66%
22% 21% 21%
7% 12% 13%
40%
60%
80%
100%2000 2010 2015
SOURCE: ESRI Business Analyst; U.S. Census; RCLCO
0%
20%
Brownstown Vacant % Brownstown Renter % Brownstown Owner %
70% 66% 66%
27% 28% 27%
3% 6% 7%
0%
20%
40%
60%
80%
100%2000 2010 2015
Woodhaven Vacant % Woodhaven Renter % Woodhaven Owner %
HU Split GraphsE6-12962.00
Printed: 7/17/2012
BROWNSTOWN DDA
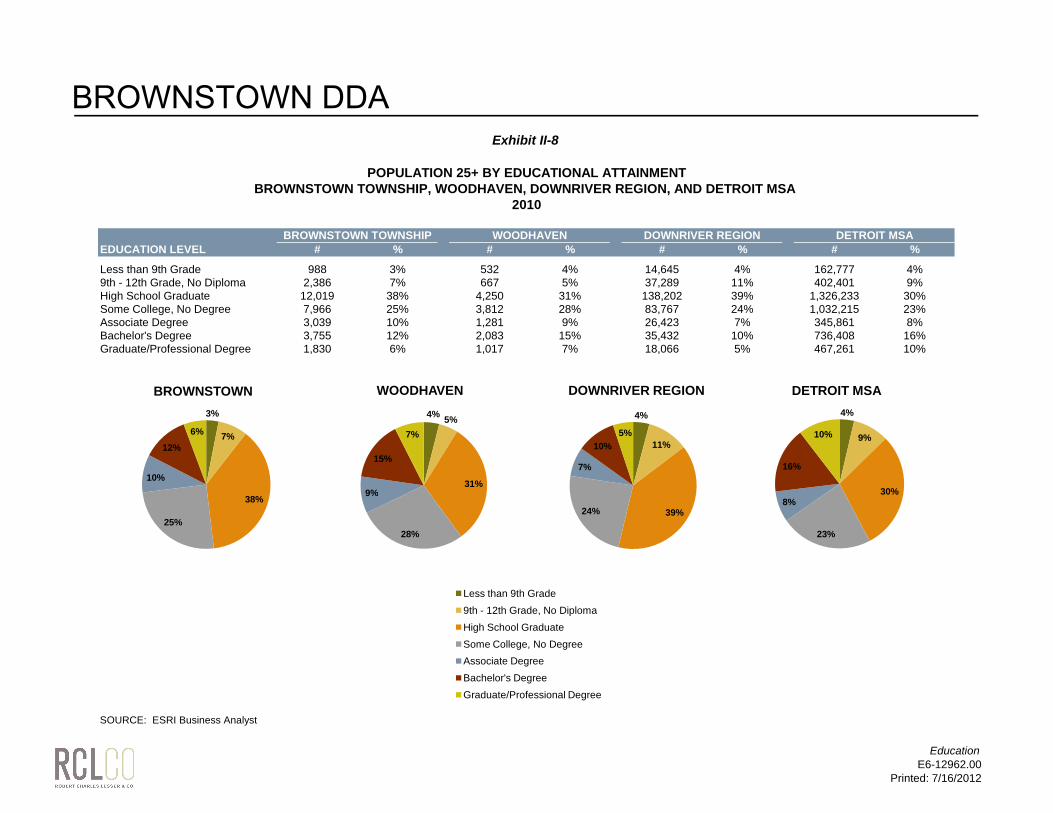
Exhibit II-8
POPULATION 25+ BY EDUCATIONAL ATTAINMENTBROWNSTOWN TOWNSHIP, WOODHAVEN, DOWNRIVER REGION, AND DETROIT MSA
2010
EDUCATION LEVEL # % # % # % # %
Less than 9th Grade 988 3% 532 4% 14,645 4% 162,777 4%9th - 12th Grade, No Diploma 2,386 7% 667 5% 37,289 11% 402,401 9%High School Graduate 12,019 38% 4,250 31% 138,202 39% 1,326,233 30%Some College, No Degree 7,966 25% 3,812 28% 83,767 24% 1,032,215 23%Associate Degree 3,039 10% 1,281 9% 26,423 7% 345,861 8%Bachelor's Degree 3,755 12% 2,083 15% 35,432 10% 736,408 16%Graduate/Professional Degree 1,830 6% 1,017 7% 18,066 5% 467,261 10%
BROWNSTOWN TOWNSHIP WOODHAVEN DOWNRIVER REGION DETROIT MSA
3%
7%
10%
12%6%
BROWNSTOWN 4% 5%
31%9%
15%
7%
WOODHAVEN
4%
11%
7%
10%5%
DOWNRIVER REGION4%
9%
30%
16%
10%
DETROIT MSA
SOURCE: ESRI Business Analyst
38%
25%28%
9%
39%24%
23%
8%
Less than 9th Grade9th - 12th Grade, No DiplomaHigh School GraduateSome College, No DegreeAssociate DegreeBachelor's DegreeGraduate/Professional Degree
EducationE6-12962.00
Printed: 7/16/2012
BROWNSTOWN DDA

Exhibit II-9
INBOUND AND OUTBOUND MIGRATIONWAYNE COUNTY, MI
2010
SOURCE: IRS; US Census; RCLCO
MigrationE6-12962.00
Printed: 7/16/2012
BROWNSTOWN DDA

Exhibit II-10
PLACE OF EMPLOYMENT BY ZIP CODERESIDENTS LIVING IN BROWNSTOWN TOWNSHIP
2010
TOTAL EMPLOYEES
500+
250 - 499
100 - 249
Less than 100
SOURCE: U.S. Census; MapPoint
Where Residents WorkE6-12962.00
Printed: 7/16/2012
BROWNSTOWN DDA

Exhibit II-11
PLACE OF RESIDENCE BY ZIP CODEEMPLOYEES WORKING IN BROWNSTOWN TOWNSHIP
2010
TOTAL RESIDENTS
250+
100 - 249
Less than 100
SOURCE: U.S. Census; MapPoint
Where Emp. LiveE6-12962.00
Printed: 7/16/2012
BROWNSTOWN DDA

Exhibit II-12
PROJECTED EMPLOYMENT GROWTHWAYNE COUNTY EXCLUDING DETROIT
2000 - 2035
580
585
590
595
600
605
610
ploy
men
t (Th
ousa
nds)
NOTE: Historical Data per SEMCOG. Economy.com projection based on growth rate for Wayne County.
SOURCE: ESRI Business Analyst; Economy.com; SEMCOG; RCLCO
560
565
570
575
2005
2006
2007
2008
2009
2010
2011
2012
2013
2014
2015
2016
2017
2018
2019
2020
2021
2022
2023
2024
2025
2026
2027
2028
2029
2030
2031
2032
2033
2034
2035
Emp
SEMCOG ECONOMY.COM
Employmt Proj.E6-12962.00
Printed: 7/16/2012
BROWNSTOWN DDA

Exhibit II-13
HOUSEHOLD ANNUAL GROWTH RATE BY BLOCK GROUPBROWNSTOWN TOWNSHIP, MI
2000 - 2010
SOURCE: Esri Business Analyst
HH Growth 2000-2010E6-12962.00
Printed: 7/16/2012
BROWNSTOWN DDA

Exhibit II-14
HOUSEHOLD ANNUAL GROWTH RATE BY BLOCK GROUPBROWNSTOWN TOWNSHIP, MI
2010 - 2015
SOURCE: Esri Business Analyst
HH Growth 2010-2015E6-12962.00
Printed: 7/16/2012
BROWNSTOWN DDA

Exhibit II-15
HOUSEHOLD DENSITY BY BLOCK GROUPBROWNSTOWN TOWNSHIP, MI
2010
Density = Housholds/Square MileSOURCE: Esri Business Analyst
HH Density 2010E6-12962.00
Printed: 7/16/2012
BROWNSTOWN DDA

Exhibit II-16
MEDIAN HOUSEHOLD INCOME BY BLOCK GROUPBROWNSTOWN TOWNSHIP, MI
2010
SOURCE: Esri Business Analyst
Med HH Inc 2010E6-12962.00
Printed: 7/16/2012
BROWNSTOWN DDA

Exhibit II-17
MEDIAN AGE BY BLOCK GROUPBROWNSTOWN TOWNSHIP, MI
2010
SOURCE: Esri Business Analyst
Med Age 2010E6-12962.00
Printed: 7/16/2012
BROWNSTOWN DDA

Exhibit II-18
MEDIAN HOME VALUES BY BLOCK GROUPBROWNSTOWN TOWNSHIP, MI
2010
SOURCE: Esri Business Analyst
Med HV 2010E6-12962.00
Printed: 7/16/2012
BROWNSTOWN DDA

Exhibit II-19
EMPLOYMENT DENSITY BY BLOCK GROUPBROWNSTOWN TOWNSHIP, MI
2010
Density = Employees/Square MileSOURCE: Esri Business Analyst
Employment Density 2010E6-12962.00
Printed: 7/16/2012
BROWNSTOWN DDA

Exhibit II-20
PERCENT OF RENTER OCCUPIED HOUSING UNITS BY BLOCK GROUPBROWNSTOWN TOWNSHIP, MI
2010
SOURCE: Esri Business Analyst
Renter Percentage 2010E6-12962.00
Printed: 7/16/2012
BROWNSTOWN DDA

Exhibit II-21
NUMBER OF EMPLOYEESBROWNSTOWN TOWNSHIP, MI
2010
SOURCE: Esri Business Analyst
Business CentersE6-12962.00
Printed: 7/16/2012
BROWNSTOWN DDA

Exhibit II-22
SHOPPING CENTERSBROWNSTOWN TOWNSHIP, MI
2010
SOURCE: Esri Business Analyst
Retail CentersE6-12962.00
Printed: 7/16/2012
BROWNSTOWN DDA

III. RESIDENTIAL
BROWNSTOWN DDA

Exhibit III-1A
HISTORICAL SINGLE-FAMILY AND MULTIFAMILY PERMITSDETROIT MSA
1990 - YTD 2012
10,841 10,56212,089 12,801
14,743 15,51017,157 16,322
17,950 17,224 16,06514,009 15,208 16,334 17,399
13,631
7,468
3,8331,937 1261 2,430 2,854
638
4,6362,976
26622,654
3,679 3,276
3,7942,837
4,3803,355
3,248
3,5573,826
3,5664,409
2,761
1,452
492
65372
780504
354
YTDLAND USE 1990 1991 1992 1993 1994 1995 1996 1997 1998 1999 2000 2001 2002 2003 2004 2005 2006 2007 2008 2009 2010 2011 2012 1
RESIDENTIAL-BUILDING PERMITSSingle-Family 10,841 10,562 12,089 12,801 14,743 15,510 17,157 16,322 17,950 17,224 16,065 14,009 15,208 16,334 17,399 13,631 7,468 3,833 1,937 1261 2,430 2,854 638Multifamily 4,636 2,976 2662 2,654 3,679 3,276 3,794 2,837 4,380 3,355 3,248 3,557 3,826 3,566 4,409 2,761 1,452 492 653 72 780 504 354TOTAL 15,477 13,538 14,751 15,455 18,422 18,786 20,951 19,159 22,330 20,579 19,313 17,566 19,034 19,900 21,808 16,392 8,920 4,325 2,590 1,333 3,210 3,358 992
Annual Change -- -1,939 1,213 704 2,967 364 2,165 -1,792 3,171 -1,751 -1,266 -1,747 1,468 866 1,908 -5,416 -7,472 -4,595 -1,735 -1,257 1,877 148MF as % of Total 30% 22% 18% 17% 20% 17% 18% 15% 20% 16% 17% 20% 20% 18% 20% 17% 16% 11% 25% 5% 24% 15%
1 YTD 2012 through March.
SOURCE: U.S. Department of Housing and Urban Development; RCLCO
1990 1991 1992 1993 1994 1995 1996 1997 1998 1999 2000 2001 2002 2003 2004 2005 2006 2007 2008 2009 2010 2011 2012
SINGLE-FAMILY MULTIFAMILY
Permits - MSAE6-12962.00
Printed: 7/16/2012
BROWNSTOWN DDA

Exhibit III-1B
HISTORICAL SINGLE-FAMILY AND MULTIFAMILY PERMITSWAYNE COUNTY, MI
1990 - YTD 2012
1,874 2,058 2,090 2,1902,676 2,795 3,100 3,113 3,347 3,124 2,939 3,006
3,388 3,7294,211
3,138
2,056
919524 264 470 476 93
1,257 7691094 1,185
1,101 743
1,293661
1,5021,063 1,143 1,255
1,454
1,909
2,106
1,436
378
176 37124 265 229 0
YTDLAND USE 1990 1991 1992 1993 1994 1995 1996 1997 1998 1999 2000 2001 2002 2003 2004 2005 2006 2007 2008 2009 2010 2011 2012 1
RESIDENTIAL-BUILDING PERMITSSingle-Family 1,874 2,058 2,090 2,190 2,676 2,795 3,100 3,113 3,347 3,124 2,939 3,006 3,388 3,729 4,211 3,138 2,056 919 524 264 470 476 93Multifamily 1,257 769 1094 1,185 1,101 743 1,293 661 1,502 1,063 1,143 1,255 1,454 1,909 2,106 1,436 378 176 371 24 265 229 0TOTAL 3,131 2,827 3,184 3,375 3,777 3,538 4,393 3,774 4,849 4,187 4,082 4,261 4,842 5,638 6,317 4,574 2,434 1,095 895 288 735 705 93
Annual Change -- -304 357 191 402 -239 855 -619 1,075 -662 -105 179 581 796 679 -1,743 -2,140 -1,339 -200 -607 447 -30MF as % of Total 40% 27% 34% 35% 29% 21% 29% 18% 31% 25% 28% 29% 30% 34% 33% 31% 16% 16% 41% 8% 36% 32%
1 YTD 2012 through March.
SOURCE: U.S. Department of Housing and Urban Development; RCLCO
1990 1991 1992 1993 1994 1995 1996 1997 1998 1999 2000 2001 2002 2003 2004 2005 2006 2007 2008 2009 2010 2011 2012
SINGLE-FAMILY MULTIFAMILY
Permits - WayneE6-12962.00
Printed: 7/16/2012
BROWNSTOWN DDA

Exhibit III-1C
HISTORICAL SINGLE-FAMILY AND MULTIFAMILY PERMITSBROWNSTOWN TOWNSHIP, MI
1990 - YTD 2012
40 67 54 52
165
274 305253
315
451
330413
356 347 385
237 262
58 25 25 35 56 82
0 0 0
0
0 160
56
22
96
64
64
388261
2444
66 0 9 0 0
YTDLAND USE 1990 1991 1992 1993 1994 1995 1996 1997 1998 1999 2000 2001 2002 2003 2004 2005 2006 2007 2008 2009 2010 2011 2012 1
RESIDENTIAL-BUILDING PERMITSSingle-Family 40 67 54 52 165 274 305 253 315 451 330 413 356 347 385 237 262 58 25 25 35 56 8Multifamily 2 0 0 0 0 0 16 0 56 22 96 64 64 388 261 24 44 6 6 0 9 0 0TOTAL 42 67 54 52 165 274 321 253 371 473 426 477 420 735 646 261 306 64 31 25 44 56 8
Annual Change -- 25 -13 -2 113 109 47 -68 118 102 -47 51 -57 315 -89 -385 45 -242 -33 -6 19 12MF as % of Total 5% 0% 0% 0% 0% 0% 5% 0% 15% 5% 23% 13% 15% 53% 40% 9% 14% 9% 19% 0% 20% 0%
1 YTD 2012 through March.
SOURCE: U.S. Department of Housing and Urban Development; RCLCO
1990 1991 1992 1993 1994 1995 1996 1997 1998 1999 2000 2001 2002 2003 2004 2005 2006 2007 2008 2009 2010 2011 2012
SINGLE-FAMILY MULTIFAMILY
Permits - BrownstownE6-12962.00
Printed: 7/16/2012
BROWNSTOWN DDA
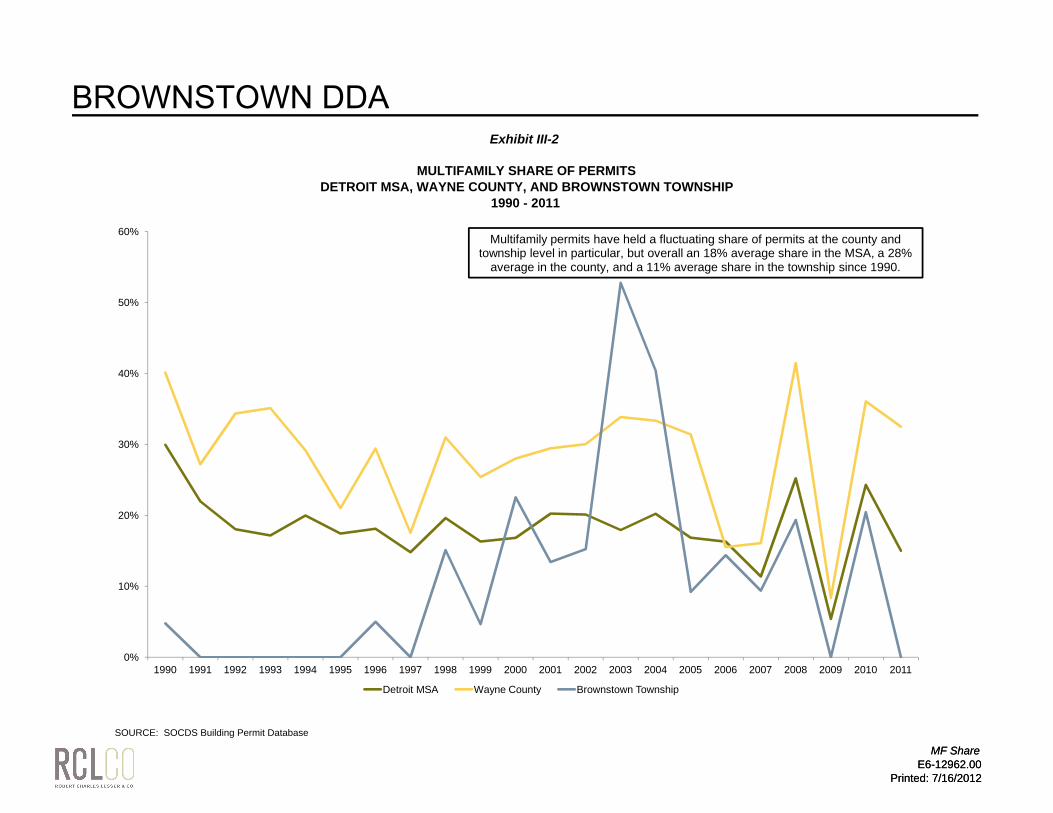
Exhibit III-2
MULTIFAMILY SHARE OF PERMITSDETROIT MSA, WAYNE COUNTY, AND BROWNSTOWN TOWNSHIP
1990 - 2011
30%
40%
50%
60%Multifamily permits have held a fluctuating share of permits at the county and
township level in particular, but overall an 18% average share in the MSA, a 28% average in the county, and a 11% average share in the township since 1990.
MF ShareE6-12962.00
Printed: 7/16/2012
SOURCE: SOCDS Building Permit Database
0%
10%
20%
1990 1991 1992 1993 1994 1995 1996 1997 1998 1999 2000 2001 2002 2003 2004 2005 2006 2007 2008 2009 2010 2011
Detroit MSA Wayne County Brownstown Township
MF ShareE6-12962.00
Printed: 7/16/2012
BROWNSTOWN DDA

Exhibit III-3
GEOGRAPHIC SHARE OF PERMITSBROWNSTOWN TOWNSHIP, WAYNE COUNTY, AND DETROIT MSA
1990 - 2011
15%
20%
25%
30%
35%
40%
45%
50%Wayne County permits hold an increasing share of the MSA's
permits; Brownstown Township also has an increasing share of the County's permits from 1990 to 2011.
Geographic SharesE6-12962.00
Printed: 7/16/2012
SOURCE: SOCDS Building Permit Database
0%
5%
10%
15%
1990 1991 1992 1993 1994 1995 1996 1997 1998 1999 2000 2001 2002 2003 2004 2005 2006 2007 2008 2009 2010 2011Wayne Co. % of MSA Brownstown Township % of County Linear (Wayne Co. % of MSA) Linear (Brownstown Township % of County)
Geographic SharesE6-12962.00
Printed: 7/16/2012
BROWNSTOWN DDA
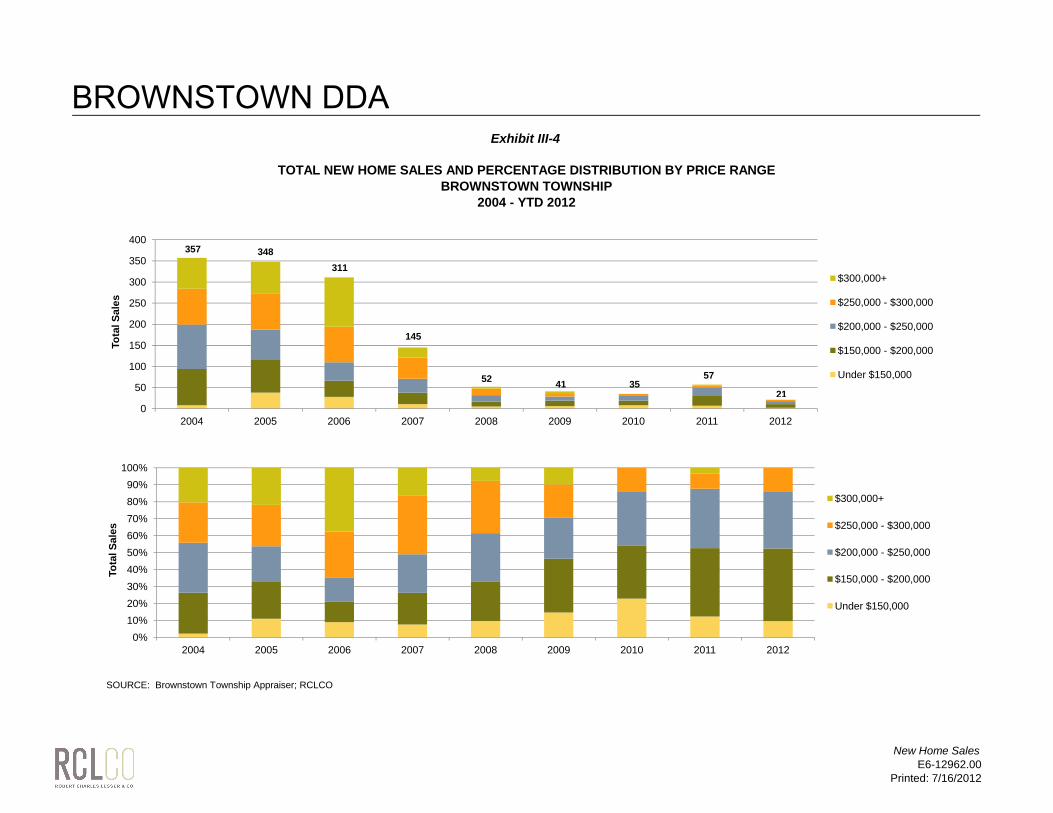
Exhibit III-4
TOTAL NEW HOME SALES AND PERCENTAGE DISTRIBUTION BY PRICE RANGEBROWNSTOWN TOWNSHIP
2004 - YTD 2012
0
50
100
150
200
250
300
350
400
2004 2005 2006 2007 2008 2009 2010 2011 2012
Tota
l Sal
es
$300,000+
$250,000 - $300,000
$200,000 - $250,000
$150,000 - $200,000
Under $150,000
90%100%
$300 000
357 348311
145
52 41 3557
21
SOURCE: Brownstown Township Appraiser; RCLCO
0%10%20%30%40%50%60%70%80%
2004 2005 2006 2007 2008 2009 2010 2011 2012
Tota
l Sal
es
$300,000+
$250,000 - $300,000
$200,000 - $250,000
$150,000 - $200,000
Under $150,000
New Home SalesE6-12962.00
Printed: 7/16/2012
BROWNSTOWN DDA
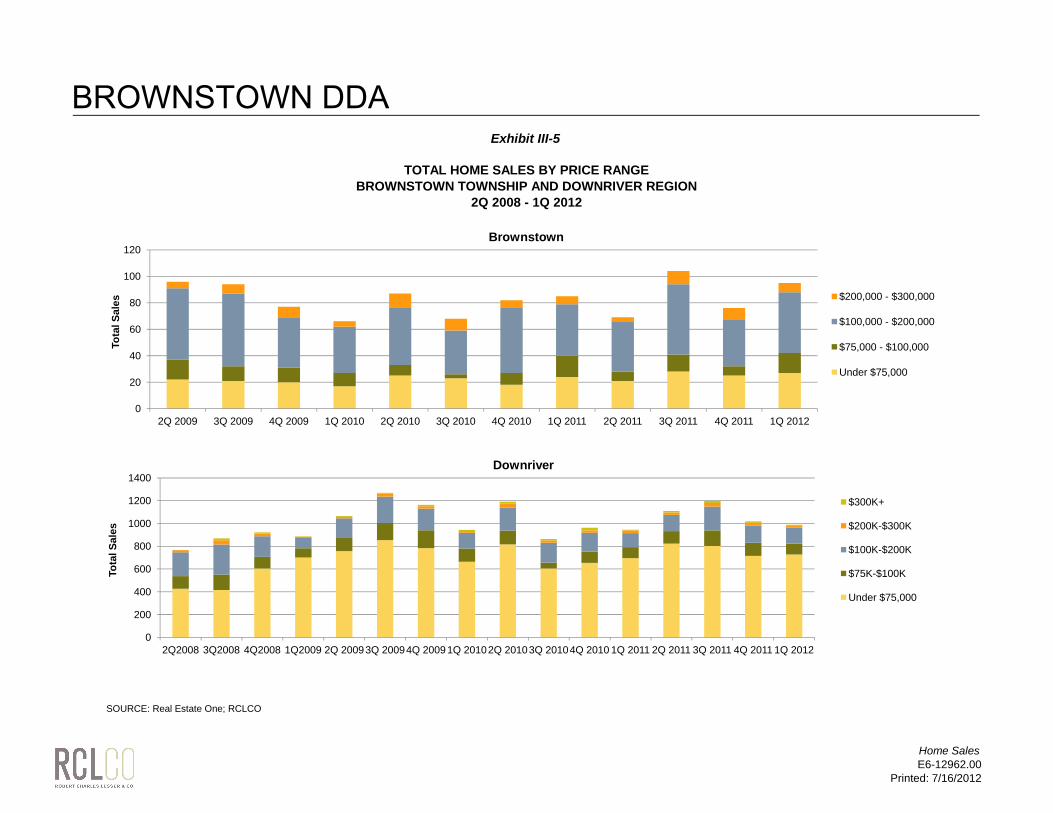
Exhibit III-5
TOTAL HOME SALES BY PRICE RANGEBROWNSTOWN TOWNSHIP AND DOWNRIVER REGION
2Q 2008 - 1Q 2012
0
20
40
60
80
100
120
2Q 2009 3Q 2009 4Q 2009 1Q 2010 2Q 2010 3Q 2010 4Q 2010 1Q 2011 2Q 2011 3Q 2011 4Q 2011 1Q 2012
Tota
l Sal
es
Brownstown
$200,000 - $300,000
$100,000 - $200,000
$75,000 - $100,000
Under $75,000
1400Downriver
SOURCE: Real Estate One; RCLCO
0
200
400
600
800
1000
1200
2Q2008 3Q2008 4Q2008 1Q2009 2Q 20093Q 20094Q 20091Q 20102Q 20103Q 20104Q 2010 1Q 2011 2Q 2011 3Q 2011 4Q 2011 1Q 2012
Tota
l Sal
es
$300K+
$200K-$300K
$100K-$200K
$75K-$100K
Under $75,000
Home SalesE6-12962.00
Printed: 7/16/2012
BROWNSTOWN DDA

Exhibit III-6
INVENTORY ANALYSIS OF VACANT DEVELOPED LOTSBROWNSTOWN TOWNSHIP
MAY 25, 2012
Single-Family Subdivision
Vacant Platted
Lots YearBrownstown
New Home Sales
Year End Remaining Inventory
Year End Remaining Inventory
W/O DelWebb2004 357
Bonks Bay 11 2005 348Bridgewater -- Del Webb 174 2006 311Bryce Commons 44 2007 145Cambridge Meadows 13 2008 52Cattail Creek 3 2009 41Crystal Crossing 30 2010 35Flowers Creek 0 2011 57Forest Heights 0 2012 63 647 473Fox Creek 95 2013 67 580 406Huron Pointe 21 2014 95 485 311Kensington Estates 0 2015 128 357 183Meadow Brook Village 0 2016 175 182 8Oakwood Estates 2 2017 250 -68 -242Pheasant Run 5Prairie Creek 93Oak Leaf 10Riverfront Estates 0River Valley 0ySilver Creek 12Smith Creek 0Spring Gate 0Stefano Meadows 0Timber Creek 117Wellington Estates 74Whispering Heights 4Woodcreek Meadows 8Woodland Heights 0Woodside Village 0Wheatland Estates 15Total 731
SOURCE: Brownstown Township; RCLCO
InventoryE6-12962.00
Printed: 7/17/2012
BROWNSTOWN DDA

Exhibit III-7
BROWNSTOWN TOTAL HOME SALES BY PRICE RANGE AS A PERCENT OF THE DOWNRIVER REGIONBROWNSTOWN TOWNSHIP AND DOWNRIVER REGION
2Q 2009 - 1Q 2012
40%
50%
60%
70%
80%
90%
Perc
ent o
f Sal
es
Under $75,000
$75K-$100K
$100K-$200K
$200K-$300K
SOURCE: Real Estate One; RCLCO
0%
10%
20%
30%
2Q 2009 3Q 2009 4Q 2009 1Q 2010 2Q 2010 3Q 2010 4Q 2010 1Q 2011 2Q 2011 3Q 2011 4Q 2011 1Q 2012
BT as % of DRE6-12962.00
Printed: 7/16/2012
BROWNSTOWN DDA

Exhibit III-8
PERCENTAGE BREAKDOWN OF HOME SALES BY PRICE RANGEBROWNSTOWN TOWNSHIP AND DOWNRIVER REGION
2Q 2009 - 1Q 2012
0%10%20%30%40%50%60%70%80%90%
100%
2Q 2009 3Q 2009 4Q 2009 1Q 2010 2Q 2010 3Q 2010 4Q 2010 1Q 2011 2Q 2011 3Q 2011 4Q 2011 1Q 2012
Perc
ent o
f Sal
es
BROWNSTOWN
$200,000 - $300,000
$100,000 - $200,000
$75,000 - $100,000
Under $75,000
90%100%
DOWNRIVER
SOURCE: Real Estate One; RCLCO
0%10%20%30%40%50%60%70%80%90%
2Q2008 3Q2008 4Q2008 1Q2009 2Q 20093Q 20094Q 20091Q 20102Q 20103Q 20104Q 2010 1Q 2011 2Q 2011 3Q 2011 4Q 2011 1Q 2012
Perc
ent o
f Sal
es
$300K+
$200K-$300K
$100K-$200K
$75K-$100K
Under $75,000
Home sales %E6-12962.00
Printed: 7/16/2012
BROWNSTOWN DDA

MAP KEY PROJECT NAME
AVG.PRICE
AVG.$/SF
SINGLE-FAMILY DETACHED
1 CELTIC FARMS $182,400 $822 WHEATLAND ESTATES $264,950 $1233 KENSINGTON ESTATES $280,400 $1134 FOX CREEK $212,400 $1065 BRIDGEWATER $222,740 $1086 FALKIRK $205,400 $937 BRYCE COMMONS $224,450 $948 TIMBERCREEK $202,500 $909 BRADBURY PARK - PRESERVES $187,400 $9210 PRAIRIE CREEK 1 $168,400 $8711 ROLLING RIDGE N/A N/A12 OAKWOOD FARMS N/A N/A13 CYRSTAL CROSSING N/A N/A14 HURON POINTE $229,999 $89
Exhibit III-9
FOR SALE COMMUNITIES MAPDETROIT DOWNRIVER REGION
2012
35 8
7
10
4
3
5
4
For-Sale Comp MapE6-12962.00
Printed: 7/16/2012
ATTACHED/CONDOMINIUMS
1 BRADBURY PARK - THE COVES $150,000 $942 PINE ARBOR CONDOMINIUMS N/A N/A3 PARKLANE TOWNHOMES N/A N/A4 TRENTON GRANDE N/A N/A5 DOVES POINTE N/A N/A
SOURCE: Google Maps; RCLCO
12
35 8
6
9
11
13
14
1
2
12
For-Sale Comp MapE6-12962.00
Printed: 7/16/2012
BROWNSTOWN DDA

1/1/2012
Project Year Open
Total Active Units Units Sold
Units Sold YTD 2012
2011 Hist. Annual
Absorption
2012 Annual
AbsorptionLot Front
Size
Average Home Price
AverageHome Price
Price Change
ACTIVELY-SELLING
1 CELTIC FARMS N/A 46 N/A N/A N/A N/A N/A $169,900 - $194,900 $182,400 N/A - N/A N/A N/A 1,900 - 2,635 $89 - $74Huron River and InksterMI Home Builders
2 WHEATLAND ESTATES N/A 46 N/A 1 N/A 2 N/A $189,900 - $340,000 $264,950 $234,900 - $429,900 $332,400 -20% 1,720 - 2,493 $110 - $136Van Horn and InksterMJC Companies
3 KENSINGTON ESTATES N/A 69 N/A N/A 1 N/A N/A $209,900 - $350,900 $280,400 N/A - N/A N/A N/A 1,624 - 3,614 $129 - $97West and InksterMJC Companies
4 FOX CREEK N/A 108 N/A 1 1 2 65' $149,900 - $274,900 $212,400 $193,990 - $223,900 $208,945 2% 1,473 - 2,480 $102 - $111Pennsylvania and Inkster 1,473 - 1,473MJC Companies 1,606 - 1,606
1,873 - 1,8732,212 - 2,2122,220 - 2,220
$193,990 - $199,900 1,530 - 1,540$199,900 - $204,900 1,820 - 1,820$208,900 - $223,900 2,060 - 2,480
5 BRIDGEWATER Nov-05 614 311 15 22 36 60' $142,990 - $302,490 $222,740 $197,990 - $269,990 $233,990 1% 1,539 - 2,450 $93 - $12324303 Bridwater Ct, Brownstown $142,990 - $163,990 1,100 - 1,100Del Webb $152,990 - $173,990 1,300 - 1,300
$162,990 - $184,990 1,400 - 1,400$198,990 - $225,490 $197,990 - 1,539 - 1,539$210,990 - $237,490 1,652 - 1,652$225,990 - $252,490 1,788 - 1,788$225,990 - $252,490 1,819 - 1,819$245,990 - $277,490 2,015 - 2,015$256,990 - $288,490 $255,990 - 2,238 - 2,238$270,990 - $302,490 $269,990 - $269,990 2,450 - 2,450
6 FALKIRK N/A 180 N/A N/A N/A N/A N/A $179,900 - $230,900 $205,400 N/A - N/A N/A N/A 1,611 - 3,146 $112 - $73Will Carleton & I-275Lombardo Homes
7 BRYCE COMMONS N/A 44 12 3 3 7 80' $209,000 - $239,900 $224,450 N/A - N/A N/A N/A 2,050 - 2,800 $102 - $86E. Porath CourtSeville Companies
8 TIMBERCREEK 2002 45 N/A N/A 2 N/A 80' $195,000 - $210,000 $202,500 N/A - N/A N/A N/A 2,034 - 2,468 $96 - $85West and ArsenalGerish Companies
9 BRADBURY PARK - PRESERVES 2003 167 47 9 N/A 22 80' $169,900 - $204,900 $187,400 $196,000 - $279,900 $237,950 -21% 1,842 - 2,500 $92 - $82Gibraltar & Cahill Road $196,000 - $229,000 1,760 - 2,140Seville Homes $265,900 - $279,900 2,631 - 2,846
2012 Unit Price Range
2010 Unit Price Range Unit Size Range
2012$/SF
Exhibit III-10
SURVEY OF SELECTED COMPETITIVE SINGLE-FAMILY DETACHED PROPERTIESCOMPETITIVE MARKET AREA
MAY 2012
Page 1 of 4
SFR CompsE6-12962.00
Printed: 7/16/2012
BROWNSTOWN DDA

1/1/2012
Project Year Open
Total Active Units Units Sold
Units Sold YTD 2012
2011 Hist. Annual
Absorption
2012 Annual
AbsorptionLot Front
Size
Average Home Price
AverageHome Price
Price Change
2012 Unit Price Range
2010 Unit Price Range Unit Size Range
2012$/SF
Exhibit III-10
SURVEY OF SELECTED COMPETITIVE SINGLE-FAMILY DETACHED PROPERTIESCOMPETITIVE MARKET AREA
MAY 2012
INACTIVE/ON HOLD PROJECTS
10 PRAIRIE CREEK 1 N/A N/A N/A N/A 4 N/A N/A $112,000 - $224,800 $168,400 N/A - N/A N/A N/A 1,866 - 1,961 $60 - $115King and GudithGerish Companies
11 ROLLING RIDGE N/A 52 N/A N/A N/A N/A N/A N/A - N/A N/A N/A - N/A N/A N/A N/A - N/A N/A - N/AGibraltar and FortGerish Companies
12 OAKWOOD FARMS N/A N/A N/A N/A N/A N/A N/A N/A - N/A N/A N/A - N/A N/A N/A N/A - N/A N/A - N/A
13 CYRSTAL CROSSING 2000 200 172 0 0 0 N/A N/A - N/A N/A N/A - N/A N/A N/A N/A - N/A N/A - N/AHuron River and CrooksPolicicchio Building Corporation
14 HURON POINTE 2 N/A N/A N/A N/A N/A N/A N/A $219,999 - $239,999 $229,999 N/A - N/A N/A N/A 2,469 - 2,711 $88 - $89Huron River and Adam Brown $219,999 - $219,999 2,469 - 2,469 $89 - $89
$239,900 - $239,999 2,711 - 2,711 $88 - $89
1 Prices based on 2011 sales2 2012 prices based on resales currently listed on the MLS.3 Based on current MLS listings.
SOURCE: Brownstown Township; RealEstateOne; RCLCO
Page 2 of 4
SFR CompsE6-12962.00
Printed: 7/16/2012
BROWNSTOWN DDA
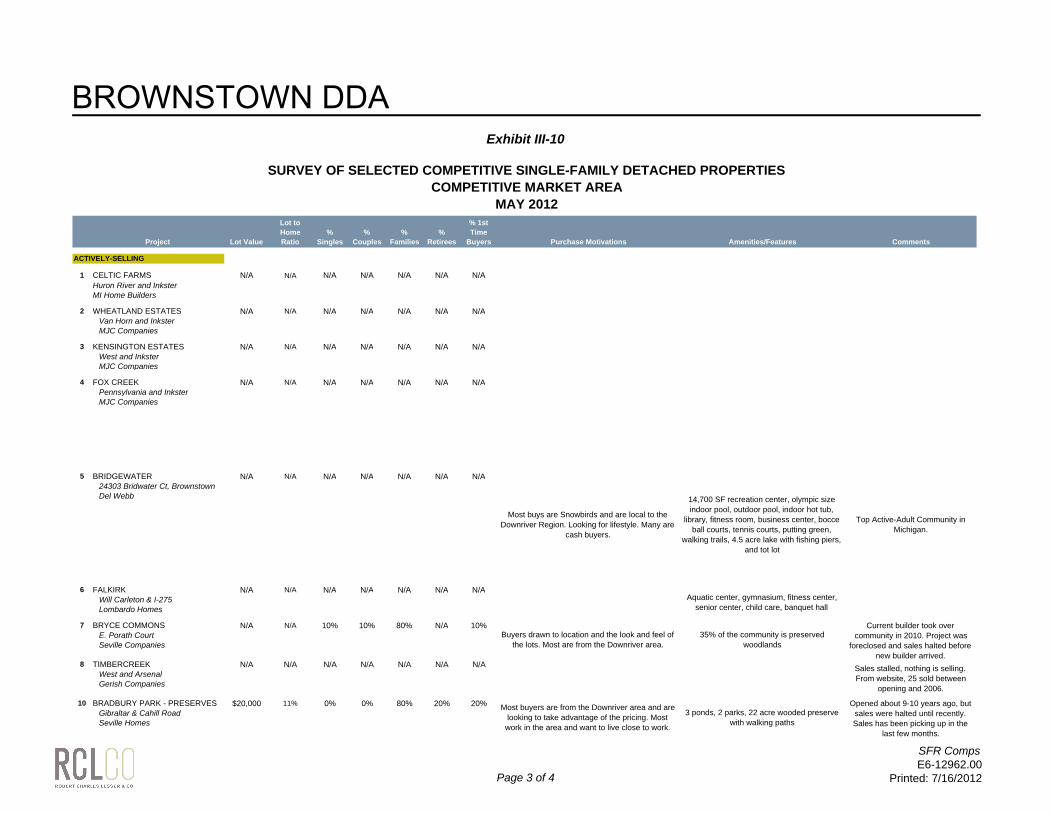
Project Lot Value
Lot to Home Ratio
% Singles
% Couples
% Families
% Retirees
% 1st Time
Buyers Purchase Motivations Amenities/Features Comments
ACTIVELY-SELLING
1 CELTIC FARMS N/A N/A N/A N/A N/A N/A N/AHuron River and InksterMI Home Builders
2 WHEATLAND ESTATES N/A N/A N/A N/A N/A N/A N/AVan Horn and InksterMJC Companies
3 KENSINGTON ESTATES N/A N/A N/A N/A N/A N/A N/AWest and InksterMJC Companies
4 FOX CREEK N/A N/A N/A N/A N/A N/A N/APennsylvania and InksterMJC Companies
5 BRIDGEWATER N/A N/A N/A N/A N/A N/A N/A24303 Bridwater Ct, BrownstownDel Webb
6 FALKIRK N/A N/A N/A N/A N/A N/A N/AWill Carleton & I-275Lombardo Homes
7 BRYCE COMMONS N/A N/A 10% 10% 80% N/A 10%E. Porath CourtSeville Companies
8 TIMBERCREEK N/A N/A N/A N/A N/A N/A N/AWest and ArsenalGerish Companies
10 BRADBURY PARK - PRESERVES $20,000 11% 0% 0% 80% 20% 20%Gibraltar & Cahill RoadSeville Homes
Most buys are Snowbirds and are local to the Downriver Region. Looking for lifestyle. Many are
cash buyers.
14,700 SF recreation center, olympic size indoor pool, outdoor pool, indoor hot tub,
library, fitness room, business center, bocce ball courts, tennis courts, putting green,
walking trails, 4.5 acre lake with fishing piers, and tot lot
Top Active-Adult Community in Michigan.
Aquatic center, gymnasium, fitness center, senior center, child care, banquet hall
Buyers drawn to location and the look and feel of the lots. Most are from the Downriver area.
35% of the community is preserved woodlands
Current builder took over community in 2010. Project was
foreclosed and sales halted before new builder arrived.
Sales stalled, nothing is selling.From website, 25 sold between
opening and 2006.
Most buyers are from the Downriver area and are looking to take advantage of the pricing. Most
work in the area and want to live close to work.
3 ponds, 2 parks, 22 acre wooded preserve with walking paths
Opened about 9-10 years ago, but sales were halted until recently. Sales has been picking up in the
last few months.
Exhibit III-10
SURVEY OF SELECTED COMPETITIVE SINGLE-FAMILY DETACHED PROPERTIESCOMPETITIVE MARKET AREA
MAY 2012
Page 3 of 4
SFR CompsE6-12962.00
Printed: 7/16/2012
BROWNSTOWN DDA

Project Lot Value
Lot to Home Ratio
% Singles
% Couples
% Families
% Retirees
% 1st Time
Buyers Purchase Motivations Amenities/Features Comments
Exhibit III-10
SURVEY OF SELECTED COMPETITIVE SINGLE-FAMILY DETACHED PROPERTIESCOMPETITIVE MARKET AREA
MAY 2012
INACTIVE/ON HOLD PROJECTS
6 PRAIRIE CREEK 1 N/A N/A N/A N/A N/A N/A N/AKing and GudithGerish Companies
7 ROLLING RIDGE N/A N/A N/A N/A N/A N/A N/AGibraltar and FortGerish Companies
8 OAKWOOD FARMS N/A N/A N/A N/A N/A N/A N/A
13 CYRSTAL CROSSING N/A N/A N/A N/A N/A N/A N/AHuron River and CrooksPolicicchio Building Corporation
14 HURON POINTE 1 $25,000 3 11% N/A N/A N/A N/A N/AHuron River and Adam Brown About half sold, no activity.
Dead subdivision, no activity.
Development opened in 2000; 172 units built and sold between 2000 and 2005. Project has been dead
with no sales since 2005.
Page 4 of 4
SFR CompsE6-12962.00
Printed: 7/16/2012
BROWNSTOWN DDA

Exhibit III-11
HOME PRICE TO UNIT SIZE RELATIONSHIPCOMPARABLE SINGLE-FAMILY PROJECTS
MAY 2012
$100,000
$150,000
$200,000
$250,000
$300,000
$350,000
$400,000
Hom
e Pr
ice
1 Prices based on 2011 sales2 2012 prices based on resales currently listed on the MLS.
SOURCE: RCLCO
$50,000 1,250 1,500 1,750 2,000 2,250 2,500 2,750 3,000 3,250 3,500 3,750
Home Size (SF)
CELTIC FARMS WHEATLAND ESTATESKENSINGTON ESTATES FOX CREEKBRIDGEWATER FALKIRKBRYCE COMMONS TIMBERCREEKBRADBURY PARK - PRESERVES PRAIRIE CREEK 1HURON POINTE 2
SFD Price to sizeE6-12962.00
Printed: 7/16/2012
BROWNSTOWN DDA

1/1/2012
Project Year Open
Total Active Units Units Sold
Units Sold YTD 2012
2012 Hist. Annual
Absorption
AverageHome Price
AverageHome Price
Price Change
ACTIVELY-SELLING
1 BRADBURY PARK - THE COVES 2003 118 50 1 0.25 $150,000 - $150,000 $150,000 $164,900 - $209,900 $187,400 -20% 1,600 - 1,600 $94 - $94Gibraltar & Cahill Road $164,900 - $189,900 1,350 - 1,600Seville Homes $204,900 - $204,900 1,861 - 1,861
$209,900 - $209,900 2,146 - 2,146
INACTIVE/ON HOLD PROJECTS 1
2 PINE ARBOR CONDOMINIUMS 2004 161 40 0 0 $110,000 - $131,000 $120,500 $100,000 - $160,000 $130,000 -7% 1,134 - 1,454 $97 - $90Van Horn & Peters RoadPoliccicchio Building Corp
3 PARKLANE TOWNHOMES N/A N/A N/A N/A N/A $50,000 - $100,000 $75,000 $119,000 - $119,000 $119,000 -37% 1,250 - 1,430 $40 - $70West and Hall
4 TRENTON GRANDE N/A N/A N/A N/A N/A $23,000 - $50,000 $36,500 N/A - N/A N/A N/A 1,000 - 1,046 $23 - $48Fort Street Gerish Companies
5 DOVES POINTE N/A N/A N/A N/A N/A $65,000 - $110,000 $87,500 $160,000 - $185,900 $172,950 -49% 1,246 - 1,870 $52 - $59King and Inkster
BRIDGEWATER (SOLD OUT)
BRIDGEWATER N/A 45 45 last 3 sold N/A $151,820 - $160,005 $155,913 N/A - N/A N/A N/A 1,590 - 1,603 $95 - $10024303 Bridwater Ct, Brownstown in 2011 (prices from 2011 sales)Del Webb
1 Pricing and size information for these projects from Zillow.com
Exhibit III-12
SURVEY OF SELECTED COMPETITIVE ATTACHED PROPERTIESCOMPETITIVE MARKET AREA
MAY 2012
2012 Unit Price Range
2010 Unit Price Range Unit Size Range
2012$/SF
Page 1 of 2
Condo CompsE6-12962.00
Printed: 7/16/2012
BROWNSTOWN DDA

Project%
Singles%
Couples%
Families%
Retirees
% 1st Time
Buyers Purchase Motivations Amenities/Features Comments
ACTIVELY-SELLING
1 BRADBURY PARK - THE COVES 0% 0% 80% 20% 20%Gibraltar & Cahill RoadSeville Homes
INACTIVE/ON HOLD PROJECTS 1
2 PINE ARBOR CONDOMINIUMS N/A N/A N/A N/A N/AVan Horn & Peters RoadPoliccicchio Building Corp
3 PARKLANE TOWNHOMES N/A N/A N/A N/A N/A
4 TRENTON GRANDE N/A N/A N/A N/A N/AFort Street Gerish Companies
5 DOVES POINTE N/A N/A N/A N/A N/AKing and Inkster No activity.
No activity.
No longer listed on builder's website.
Development opened in 2004; 40 units built and sold between 2004 and 2005. Project has been dead with no sales since 2005.
3 ponds, 2 parks, 22 acre wooded preserve with walking paths
Exhibit III-12
SURVEY OF SELECTED COMPETITIVE ATTACHED PROPERTIESCOMPETITIVE MARKET AREA
MAY 2012
Opened about 9-10 years ago, but sales were halted until recently. Sales has been
picking up in the last few months. Not actively selling attached condos; waiting to
revamp product.
Most buyers are from the Downriver area and are looking to take advantage of the pricing. Most work in
the area and want to live close to work.
Page 2 of 2
Condo CompsE6-12962.00
Printed: 7/16/2012
BROWNSTOWN DDA

Exhibit III-13
REIS SUBMARKET MAPDOWNRIVER/SOUTH WAYNE SUBMARKET
SOURCE: RCLCO; REIS, Inc
Apt Submarket MapE6-12962.00
Printed: 7/16/2012
BROWNSTOWN DDA

Exhibit III-14
EFFECTIVE RENTSDOWNRIVER/SOUTH WAYNE SUBMARKET
2000 - 2011
$602 $613
$614
$615
$617
$619 $6
33 $668
$670
$666
$674
$682
3%
4%
5%
6%
7%
8%
9%
10%
SOURCE: REIS
0%
1%
2%
3%
2000 2001 2002 2003 2004 2005 2006 2007 2008 2009 2010 2011
Downriver/South Wayne Effective Rent Downriver/South Wayne Avg. Concessions
Eff. Rent TrendsE6-12962.00
Printed: 7/16/2012
BROWNSTOWN DDA

Exhibit III-15
ANNUAL COMPLETIONSDOWNRIVER/SOUTH WAYNE SUBMARKET
2000 - 2011
398
484
14475%
80%
85%
90%
95%
100%
SOURCE: REIS
0 0 0 10 0 0 0 0 0
60%
65%
70%
2000 2001 2002 2003 2004 2005 2006 2007 2008 2009 2010 2011
Downriver/South Wayne Completions Downriver/South Wayne Occupancy
CompletionsE6-12962.00
Printed: 7/16/2012
BROWNSTOWN DDA

Exhibit III-16
ANNUAL ABSORPTION AND OCCUPANCY RATE TRENDSDOWNRIVER/SOUTH WAYNE SUBMARKET
2000 - 2011
86
248
329
235
295
120161
201
97% 96%95%
93% 93%91% 91%
93% 94%92%
93%95%
SOURCE: REIS
-166
-269 -252 -268
2000 2001 2002 2003 2004 2005 2006 2007 2008 2009 2010 2011
Annual Absorption Occupancy Rate
Abs & Occ.E6-12962.00
Printed: 7/16/2012
BROWNSTOWN DDA

Exhibit III-17
EFFECTIVE RENT AND OCCUPIED INVENTORY TRENDSDOWNRIVER/SOUTH WAYNE SUBMARKET
2000 - 2011$6
02 $613
$614
$615
$617
$619 $6
33 $668
$670
$666
$674
$682
$596
$587
$575
$562
$546
$541 $5
55
$536
$535
$532
$522
97% 96% 95%93% 93%
91% 91%93% 94%
92% 93% 95%
$300
$400
$500
$600
$700
$800
NOTE: Real effective rent represents effective rents adjusted for inflation to 2000 dollars.
SOURCE: REIS; U.S. Bureau of Labor Statistics
$0
$100
$200
2000 2001 2002 2003 2004 2005 2006 2007 2008 2009 2010 2011
Nominal Effective Rent Real Effective Rent Occupancy Rate
Real Rent GrowthE6-12962.00
Printed: 7/16/2012
BROWNSTOWN DDA

Exhibit III-18
MAP OF COMPETITIVE APARTMENT PROJECTSDETROIT DOWNRIVER REGION, MI
MAY 2012
MAP PROJECT/ AVG. AVG. AVG.KEY ADDRESS SIZE (SF) RENT $/SF
1 STRATFORD PLACE APARTMENTS 1,051 $1,070 $1.02
2 SOUTH POINTE APARTMENTS 846 $737 $0.87
3 CHELSEA PARK 1,114 $930 $0.83
4 VILLAGE GREEN MAPLE VILLAGE 987 $924 $0.94
5 VILLAGE GREEN OF SOUTHGATE 994 $891 $0.90
1
3
4
2
5
SUBJECT SITE
SOURCE: Google; RCLCO
1
Apt Comp MapE6-12962.00
Printed: 7/16/2012
BROWNSTOWN DDA

Exhibit III-19
SUMMARY OF APARTMENT MARKET COMPARABLESDETROIT DOWNRIVER REGION, MI
MAY 2012TYPE/ UNIT AVG
MAP PROJECT/ YEAR TOTAL OCC. UNIT # OF UNIT SIZE ASKING RENT GROSS EFFECTIVE RENTKEY LOCATION/ BUILT UNITS RATE TYPE UNITS1 MIX (SF) LOW - HIGH AVG. RENT/SF BASE $/SF AVG. $/SF NOTES
1 STRATFORD PLACE APARTMENTS 3 stories 180 96% 1B/1b 36 20% 775 $865 - $875 $870 $1.12 $865 $1.12 $870 $1.12 Increased rents $20 in May 2012 and May 201121901 Stratford Blvd 2004 2B/2b 36 20% 1,047 $1,015 - $1,045 $1,030 $0.98 $1,015 $0.97 $1,030 $0.98 3rd floor is a premiumBrownstown, MI 48183 2B/2b 36 20% 1,089 $1,055 - $1,095 $1,075 $0.99 $1,055 $0.97 $1,075 $0.99 $5-$10 pool view premium
2B/2b 36 20% 1,115 $1,045 - $1,075 $1,060 $0.95 $1,045 $0.94 $1,060 $0.95 Carports included in rent2B/2b 36 20% 1,231 $1,295 - $1,335 $1,315 $1.07 $1,295 $1.05 $1,315 $1.07 Waitlist for 3-bedrooms
Concessions: None TOTAL/AVG 180 1,051 $1,070 $1.02 $1,055 $1.00 $1,070 $1.02
2 SOUTH POINTE APARTMENTS 3 stories 144 99% 1B/1b N/A N/A 713 $650 - $650 $650 $0.91 $638 $0.89 $638 $0.89 No assigned parking16505 Grace Ct 2004 2B/2b N/A N/A 865 $750 - $750 $750 $0.87 $738 $0.85 $738 $0.85 Water & Trash includedSouthgate, MI 48195 2B/2b N/A N/A 961 $810 - $810 $810 $0.84 $798 $0.83 $798 $0.83
TOTAL/AVG 144 846 $737 $0.87 $724 $0.86 $724 $0.86Concessions: $150 off 1st mo. Rent
3 CHELSEA PARK 3 stories 160 99% 1B/1b 10 6% 755 $720 - $720 $720 $0.95 $720 $0.95 $720 $0.95 Water included 25900 Chelsea Park Dr 2004 1B/1b 10 6% 825 $810 - $810 $810 $0.98 $810 $0.98 $810 $0.98Taylor, MI 48180 2B/2b 40 25% 1,150 $885 - $885 $885 $0.77 $885 $0.77 $885 $0.77
2B/2b 40 25% 1,154 $999 - $999 $999 $0.87 $999 $0.87 $999 $0.872B/2b 40 25% 1,150 $889 - $889 $889 $0.77 $889 $0.77 $889 $0.773B/2b 20 13% 1,210 $1,125 - $1,125 $1,125 $0.93 $1,125 $0.93 $1,125 $0.93
Concessions: None TOTAL/AVG 160 1,114 $930 $0.83 $930 $0.83 $930 $0.83
4 VILLAGE GREEN MAPLE VILLAGE 3 stories 240 96% 1B/1b 48 20% 720 $750 - $805 $778 $1.08 $750 $1.04 $778 $1.08 Village Green mangement15685 Goddard Rd 2000 2B/2b 64 27% 1,000 $865 - $975 $920 $0.92 $865 $0.87 $920 $0.92Southgate, MI 48195 2B/2b 64 27% 1,030 $930 - $955 $943 $0.92 $930 $0.90 $943 $0.92
2B/2b 64 27% 1,130 $995 - $1,045 $1,020 $0.90 $995 $0.88 $1,020 $0.90 Premiums for pond, pool, and preserveConcessions: None TOTAL/AVG 240 987 $924 $0.94 $894 $0.91 $924 $0.94
5 VILLAGE GREEN OF SOUTHGATE 3 stories 460 98% 1B/1b N/A N/A 775 $665 - $680 $673 $0.87 $665 $0.86 $673 $0.87 Short-term leases available13750 Village Green Blvd 1987 1B/1b + den N/A N/A 875 $755 - $845 $800 $0.91 $755 $0.86 $800 $0.91Southgate, MI 48195 2B/1b N/A N/A 963 $780 - $855 $818 $0.85 $780 $0.81 $818 $0.85
2B/2b N/A N/A 975 $790 - $940 $865 $0.89 $790 $0.81 $865 $0.892B/2b + den N/A N/A 1,100 $885 - $1,065 $975 $0.89 $885 $0.80 $975 $0.892B/2b - split N/A N/A 1,025 $990 - $1,080 $1,035 $1.01 $990 $0.97 $1,035 $1.013B/2b TH N/A N/A 1,245 $964 - $1,180 $1,072 $0.86 $964 $0.77 $1,072 $0.86
Concessions: None TOTAL/AVG 460 994 $891 $0.90 $833 $0.84 $891 $0.90
1 Unit mix estimated.
SOURCE: Rent.com; RCLCO
Preferred employers: hospital, US Steel, Marathon, major car companies
$5-$10 most premiums, $10-$15 for ceiling fans, $40 for vinyl
Application fee waived for preferred employers and Star & Stripes program (military, police, fire)
Apt Comp SummaryE6-12962.00
Printed: 7/16/2012
BROWNSTOWN DDA

Exhibit III-20
EFFECTIVE BASE RENT TO UNIT SIZE RELATIONSHIPCOMPETITIVE APARTMENTS
MAY 2012
$700
$800
$900
$1,000
$1,100
$1,200
$1,300
$1,400
Effe
ctiv
e B
ase
Ren
t
SOURCE: RCLCO
$500
$600
600 700 800 900 1,000 1,100 1,200 1,300Unit Size
STRATFORD PLACE APARTMENTS SOUTH POINTE APARTMENTSCHELSEA PARK VILLAGE GREEN MAPLE VILLAGEVILLAGE GREEN OF SOUTHGATE
PxS AllE6-12962.00
Printed: 7/16/2012
BROWNSTOWN DDA

Exhibit III-21
EFFECTIVE BASE RENT TO UNIT SIZE RELATIONSHIP BY UNIT TYPECOMPETITIVE APARTMENTS
MAY 2012
$600
$650
$700
$750
$800
$850
$900
700 750 800 850 900
Effe
ctiv
e B
ase
Ren
t
Unit Size
One Bedroom Units
STRATFORD PLACE APARTMENTS SOUTH POINTE APARTMENTSCHELSEA PARK VILLAGE GREEN MAPLE VILLAGEVILLAGE GREEN OF SOUTHGATE
$600
$700
$800
$900
$1,000
$1,100
$1,200
$1,300
$1,400
800 900 1,000 1,100 1,200 1,300
Effe
ctiv
e B
ase
Ren
t
Unit Size
Two Bedroom Units
STRATFORD PLACE APARTMENTS SOUTH POINTE APARTMENTSCHELSEA PARK VILLAGE GREEN MAPLE VILLAGEVILLAGE GREEN OF SOUTHGATE
$1 130$1,150
Three Bedroom Units
SOURCE: RCLCO
$950 $970 $990
$1,010 $1,030 $1,050 $1,070 $1,090 $1,110 $1,130
1,200 1,210 1,220 1,230 1,240 1,250
Effe
ctiv
e B
ase
Ren
t
Unit SizeCHELSEA PARK VILLAGE GREEN OF SOUTHGATE
PxS by unit typeE6-12962.00
Printed: 7/16/2012
BROWNSTOWN DDA

Exhibit III-22
SUMMARY OF OLDER APARTMENT DEVELOPMENTSDETROIT DOWNRIVER REGION, MI
MAY 2012
AVG 2012 2010 1
MAP PROJECT/ YEAR TOTAL OCC. UNIT # OF UNIT UNIT SIZE AVG RENT AVG AVG RENT AVG $/SFKEY LOCATION/ FLOORS BUILT UNITS RATE TYPE UNITS MIX (SF) PER MO. RENT/SF PER MO. RENT/SF CHANGE
1 MARIANNE MANOR 3 stories 1974 227 95% 1-bedroom 86 38% 823 $565 $0.69 $528 $0.6423100 Lorraine Blvd 2-bedroom 141 62% 945 $667 $0.71 $625 $0.66Brownstown, MI 48183 TOTAL/AVG 227 899 $628 $0.70 $588 $0.65 7%
2 WILLIAMSBURG SQUARE 2 stories 1973 194 96% 1-bedroom 85 44% 750 $530 $0.71 $480 $0.6423222 Williamsburg 2-bedroom 109 56% 875 $643 $0.73 $540 $0.62Woodhaven, MI 48183 TOTAL/AVG 194 820 $593 $0.72 $514 $0.63 16%
3 SOUTHPOINTE SQUARE 2 stories 1972 224 89% 1-bedroom 86 38% 620 $605 $0.98 $575 $0.9322520 West Rd 2-bedroom 138 62% 919 $789 $0.86 $748 $0.81Woodhaven, MI 48183 TOTAL/AVG 224 804 $718 $0.89 $682 $0.85 5%
4 BRUNSWICK APARTMENTS 1 stories 1985 227 95% 1-bedroom 203 89% 600 $501 $0.84 $532 $0.8921904 Brunswick Dr 2-bedroom 24 11% 900 $670 $0.74 $665 $0.74Woodhaven, MI 48183 TOTAL/AVG 227 632 $519 $0.82 $546 $0.86 -5%
5 BRIDGEWOOD APARTMENTS 2 stories 1974 240 97% 1-bedroom 112 47% 750 $563 $0.75 $399 $0.5325891 Bridgewood Ln 2-bedroom 128 53% 1,050 $686 $0.65 $529 $0.50Flat Rock, MI 48134 TOTAL/AVG 240 910 $629 $0.69 $468 $0.51 34%
6 WELLINGTON MANOR 2 stories 1977 64 97% Studio 1 2% 600 $450 $0.75 N/A N/A18662 Van Horn Rd 1-bedroom 25 39% 700 $550 $0.79 $550 $0.79Woodhaven, MI 48183 2-bedroom 35 55% 800 $650 $0.81 $625 $0.78
3-bedroom 3 5% 900 $750 $0.83 N/A N/ATOTAL/AVG 64 763 $613 $0.80 $557 $0.73 10%
7 NOTTINGHAM KNOLLS APTS 2 stories 1975 82 94% 1-bedroom 39 48% 700 $527 $0.75 $533 $0.763649 Van Horn Rd 2-bedroom 43 52% 900 $665 $0.74 $633 $0.70Trenton, MI 48183 TOTAL/AVG 82 805 $599 $0.74 $585 $0.73 2%
8 PENNBROOK PLACE 3 stories 1974 300 87% 1-bedroom 133 44% 725 $650 $0.90 $699 $0.9615027 Brookview Dr 2-bedroom 167 56% 938 $790 $0.84 $812 $0.87Riverview, MI 48192 TOTAL/AVG 300 844 $728 $0.86 $762 $0.90 -4%
9 VILLAGE ON THE PARK 3 stories 1979 357 94% Studio 62 21% 550 $505 $0.92 $545 $0.9913210 Village Park Dr 1-bedroom 202 67% 850 $530 $0.62 $582 $0.68Southgate, MI 48195 2-bedroom 93 31% 1,100 $635 $0.58 $670 $0.61
TOTAL/AVG 357 1,027 $658 $0.64 $712 $0.69 -8%
Page 1 of 2
Older Apt Comp SummaryE6-12962.00
Printed: 7/16/2012
BROWNSTOWN DDA

Exhibit III-22
SUMMARY OF OLDER APARTMENT DEVELOPMENTSDETROIT DOWNRIVER REGION, MI
MAY 2012
AVG 2012 2010 1
MAP PROJECT/ YEAR TOTAL OCC. UNIT # OF UNIT UNIT SIZE AVG RENT AVG AVG RENT AVG $/SFKEY LOCATION/ FLOORS BUILT UNITS RATE TYPE UNITS MIX (SF) PER MO. RENT/SF PER MO. RENT/SF CHANGE
10 HAMPTONS OF BROWNSTOWN 2 stories 1972 396 N/A 2-bedroom 158 40% 850 $638 $0.75 $710 $0.8418537 Pine West 3-bedroom 238 60% 1,050 $813 $0.77 $850 $0.81Brownstown, MI 48192 TOTAL/AVG 396 970 $743 $0.77 $794 $0.82 -6%
11 SOUTH GLEN APARTMENTS 2 stories 1974 161 N/A 1-bedroom 56 35% 540 $605 $1.12 $535 $0.9919400 South Glen Blvd 2-bedroom 92 57% 889 $750 $0.84 $700 $0.79Brownstown, MI 48192 3-bedroom 13 8% 1,010 $970 $0.96 $960 $0.95
TOTAL/AVG 161 777 $717 $0.92 $664 $0.85 8%
12 MAPLE CREEK GARDENS N/A 1991 40 N/A 2-bedroom 40 100% 1,000 N/A N/A $700 $0.7018662 Van Horn Road TOTAL/AVG 40 1,000 N/A N/A $700 $0.70 N/AWoodhaven, MI 48183
13 ORLEANS PLACE 2 stories N/A 72 N/A 1-bedroom N/A N/A 805 $589 $0.73 $499 $0.6223210 Heritage Drive 2-bedroom N/A N/A 1,105 $699 $0.63 $599 $0.54Woodhaven, MI 48183 TOTAL/AVG 72 955 $644 $0.67 $549 $0.57 17%
14 CREEKSIDE VILLAGE APARTMENTS 2 stories 1975 126 N/A 1-bedroom 14 11% 650 $643 $0.99 $650 $1.0024795 Mayfair Drive 2-bedroom 89 71% 980 $699 $0.71 $689 $0.70Flat Rock, MI 48134 3-bedroom 23 18% 1,100 $854 $0.78 $855 $0.78
TOTAL/AVG 126 965 $721 $0.75 $715 $0.74 1%
15 WOODHAVEN SQUARE 2 stories 1970 158 N/A 1-bedroom N/A N/A 700 $500 $0.71 $435 $0.6226681 Reeck Road 2-bedroom N/A N/A 900 $585 $0.65 $535 $0.59Woodhaven, MI 48183 TOTAL/AVG 158 800 $543 $0.68 $485 $0.61 12%
16 SILVER CREEK APARTMENTS 2 stories 1999 114 N/A 1-bedroom 17 15% 650 $643 $0.99 $650 $1.0025617 Valley Creek Dr 2-bedroom 64 56% 980 $699 $0.71 $689 $0.70Flat Rock, MI 48134 3-bedroom 33 29% 1,100 $854 $0.78 $855 $0.78
TOTAL/AVG 114 966 $736 $0.76 $731 $0.76 1%
AVERAGE 6%
1 Per Partners for Economic Solutions report, August 2010
SOURCE: REIS, Inc.; PES; RCLCO
Page 2 of 2
Older Apt Comp SummaryE6-12962.00
Printed: 7/16/2012
BROWNSTOWN DDA

Exhibit III-23
DISTRIBUTION OF GROSS RENTBROWNSTOWN TOWNSHIP
2010
223
206
570226
200
233
5879 42
10%
9%
26%10%
9%
11%
3%4% 2%
Less than $500
$500-$599
$600-$699
$700-$799
$800-$899
$900-$999
$1,000-$1,249
$1,250-$1,499
$1 500 $1 999
Rent - BrownstownE6-12962.00
Printed: 7/16/2012
SOURCE: U.S. Census
570
343
22626%
16%
10%$1,250-$1,499
$1,500-$1,999
$2,000 or more
19% of renters in Brownstown Township pay less than $600 for rent per month. Over half (52%) pay between $600 to $900 per month.
Rent - BrownstownE6-12962.00
Printed: 7/16/2012
BROWNSTOWN DDA
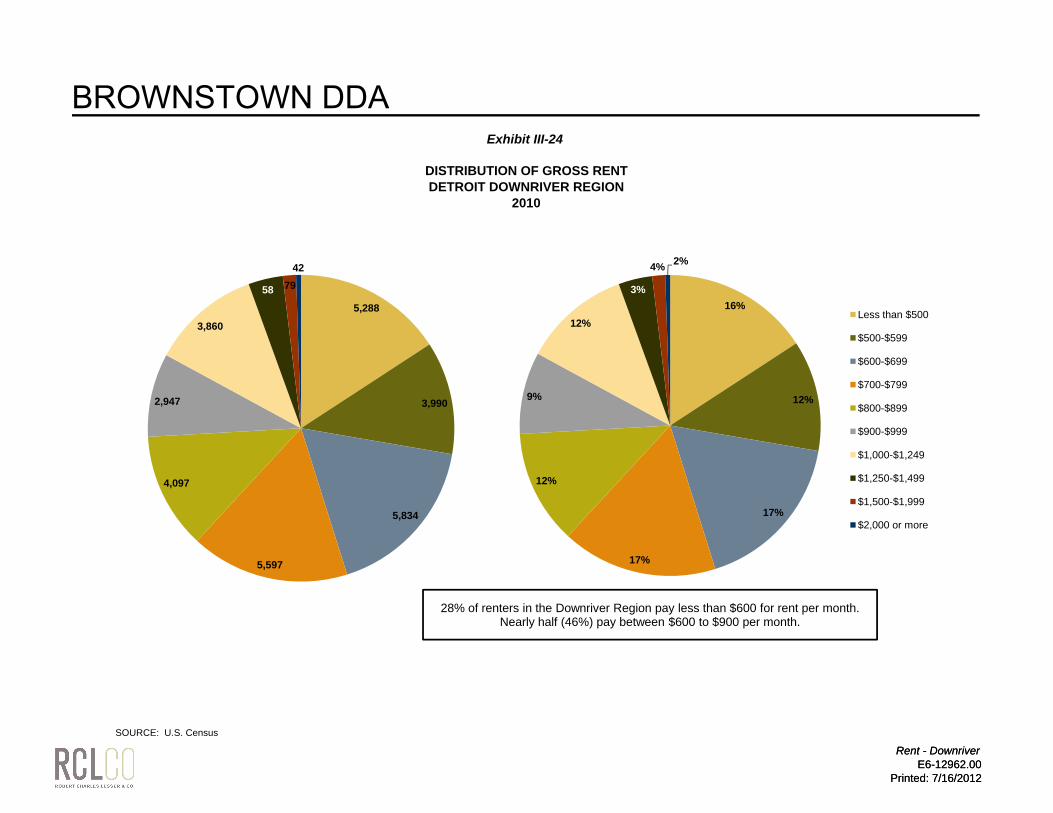
Exhibit III-24
DISTRIBUTION OF GROSS RENTDETROIT DOWNRIVER REGION
2010
5,288
3,990
4,097
2,947
3,860
58 7942
16%
12%
12%
9%
12%
3%
4% 2%
Less than $500
$500-$599
$600-$699
$700-$799
$800-$899
$900-$999
$1,000-$1,249
$1,250-$1,499
$1 500 $1 999
Rent - DownriverE6-12962.00
Printed: 7/16/2012
SOURCE: U.S. Census
5,834
5,597
4,097
17%
17%
12% $1,250-$1,499
$1,500-$1,999
$2,000 or more
28% of renters in the Downriver Region pay less than $600 for rent per month. Nearly half (46%) pay between $600 to $900 per month.
Rent - DownriverE6-12962.00
Printed: 7/16/2012
BROWNSTOWN DDA

Exhibit III-25
ANNUAL RENTAL DEMAND POTENTIALDETROIT DOWNRIVER REGION
PMA YOUNG PROFESSIONALS MATURE PROFESSIONALS EMPTY NESTERS TARGETTARGET MARKET GROUPS TOTAL AGE 25-34 AGE 35-54 AGE 55-64 TOTAL
2011 Total Households 1 140,805 61,871 19,153 105,384
$25K $35K $50K $75K $100K $25K $35K $50K $75K $100K $25K $35K $50K $75K $100KQUALIFYING INCOME RANGE $35K $50K $75K $100K AND UP $35K $50K $75K $100K AND UP $35K $50K $75K $100K AND UP
$400 $600 $800 $1,300 $1,700 $400 $600 $800 $1,300 $1,700 $400 $600 $800 $1,300 $1,700 MONTHLY AFFORDABLE RENT 2 $599 $799 $1,299 $1,699 AND UP $599 $799 $1,299 $1,699 AND UP $599 $799 $1,299 $1,699 AND UP
DEMAND FROM HOUSEHOLD TURNOVER 140,805 24,360 61,871 19,153 105,384
Income Qualified Households 1
% of Total 10% 15% 34% 17% 9% 7% 13% 30% 15% 19% 9% 14% 28% 16% 20% 85%Income Qualified Households 2,368 3,660 8,223 4,081 2,170 4,453 8,116 18,847 9,048 12,008 1,678 2,745 5,290 3,045 3,741 89,474
Renter Households 3 % of Income Qualified Households 61% 43% 43% 21% 5% 46% 37% 18% 7% 4% 28% 21% 10% 2% 2% 21%
Income Qualified Renter Households 1,443 1,570 3,532 848 99 2,046 2,984 3,341 627 492 462 578 532 70 68 18,692
Household Size Qualified 3
% 1-2 Person Households 67% 51% 50% 45% 0% 52% 57% 63% 67% 18% 94% 88% 75% 43% 0% 57%% 3-4 Person Households 15% 13% 39% 9% 100% 29% 38% 33% 15% 82% 6% 4% 25% 57% 53% 30%
Income and HH Size Qualified Renter Households 1,191 1,004 3,126 461 99 1,657 2,822 3,202 518 492 462 535 532 70 36 16,207
Total Annualized Potential, Primary Market 3
% Annual Turnover 59% 52% 40% 32% 47% 49% 51% 33% 43% 51% 36% 10% 26% 0% 0% 42%Annual Income and HH Size Qualified Renter Households 703 525 1,249 147 46 814 1,437 1,046 221 249 167 54 140 0 0 6,800
Propensity to Choose Apartment Projects 4 46% 50% 20% 30% 0% 21% 26% 24% 13% 29% 28% 32% 59% 43% 53% 28%Local Area Apartment Demand 323 260 245 45 0 169 367 251 29 73 47 17 83 0 0 1,910
% of Primary Demand from Local Qualified HH 5 90% 90% 90% 90% 90% 90% 90% 90% 90% 90% 90% 90% 90% 90% 90% 90%Total Apartment Demand, Primary & Secondary 359 289 273 50 0 188 408 279 32 81 52 19 92 0 0 2,123
SUBJECT SITE CAPTURETotal Apartment Demand 359 289 273 50 0 188 408 279 32 81 52 19 92 0 0 2,123Subject Site Capture 6 5% 10% 15% 33% 0% 5% 10% 15% 33% 0% 5% 10% 15% 33% 0% 11%Subject Site Annual Demand Potential 18 29 41 16 0 9 41 42 11 0 3 2 14 0 0 225
1 Per US Census and ESRI Business Analyst. 2 Assumes 30% of total annual income is spent on rent. 3 Per 2008-2010 Census PUMS for PUMA 5 area equivalent to Primary Market Area, applied to 2011 ESRI household figures4 Based on 2008-2010 US Census numbers for renters choosing apartments with 50+ units.5 Based on interviews with leasing agents and local management companies. Assumes 10% of demand falls outside of age/income/tenure groups, or currently reside outside of primary market area.6 RCLCO estimates based on relevant competitive supply and annual turnover in the PMA.
24,360
Rental DemandE6-12962.00
Printed: 7/16/2012
BROWNSTOWN DDA

Exhibit III-26
ANNUAL NEW HOME DEMAND POTENTIALDETROIT DOWNRIVER REGION AND BROWNSTOWN TOWN CENTER
2011 - 2016
ANNUAL INCOME RANGE
HOME PRICE RANGE1
PERCENT PMA HHs2
PMA HHs BY INCOME
RANGE2
PERCENT HHs AGE
25-742HHs
AGE 25-74PERCENT OWNERS3
OWNER HHs4
ANNUAL TURNOVER5
DEMAND FROM
TURNOVER
Less than - $35,000 Less than - $135,000 27% 38,662 70% 27,195 53% 13,048 5% 652$35,000 - $50,000 $135,000 - $192,000 15% 21,317 83% 17,778 71% 11,407 5% 570$50,000 - $75,000 $192,000 - $288,000 27% 37,926 91% 34,626 80% 25,061 5% 1,253$75,000 - $100,000 $288,000 - $384,000 16% 21,922 93% 20,332 92% 16,924 5% 846
$100,000 - $150,000 $384,000 - $576,000 11% 15,016 94% 14,187 97% 12,325 5% 616$150,000 and up $576,000 and up 4% 5,961 88% 5,244 96% 4,548 5% 227
TOTAL/WTD AVERAGE: 100% 140,805 119,363 78% 83,314 5% 4,166
TOTAL PMA % OFANNUAL PMA TOTAL
INCOME RANGE DEMAND DEMAND6 PCT. TOTAL PCT. TOTAL
Less than - $35,000 Less than - $135,000 652 90% 4% 31 10% 3$35,000 - $50,000 $135,000 - $192,000 570 90% 26% 162 5% 8$50,000 - $75,000 $192,000 - $288,000 1,253 90% 33% 455 5% 23$75,000 - $100,000 $288,000 - $384,000 846 90% 3% 28 2% 1
$100,000 - $150,000 $384,000 - $576,000 616 90% 2% 14 0% 0$150,000 and up $576,000 and up 227 90% 1% 3 0% 0
TOTAL/WTD AVERAGE: 4,166 90% 4% 692 34
1 Assumes 30-year fixed mortgage with a 5.0% interest rate and 25% of income available for home payment2 ESRI Business Analyst3 American Community Survey4 Total owner households including a downward adjustment of 10% to account for current homeowners with negative equity and/or lack of credit worthiness. 5 Based on American Community Survey and annual single-family resales as a percentage of owner-occupied housing.6 Based on interviews with sales agents at actively selling communities in the PMA. 7 Based on historical single-family resales in Brownstown as a percentage of single-family resales in the Downriver Region.
BROWNSTOWN CAPTURE7 SITE CAPTURE(Primary & Secondary)
725634
685253
4,629
940
HOME PRICE TOTAL DEMAND
1,392
RANGE1
For-Sale DemandE6-12962.00
Printed: 7/16/2012
BROWNSTOWN DDA

IV. OFFICE
BROWNSTOWN DDA
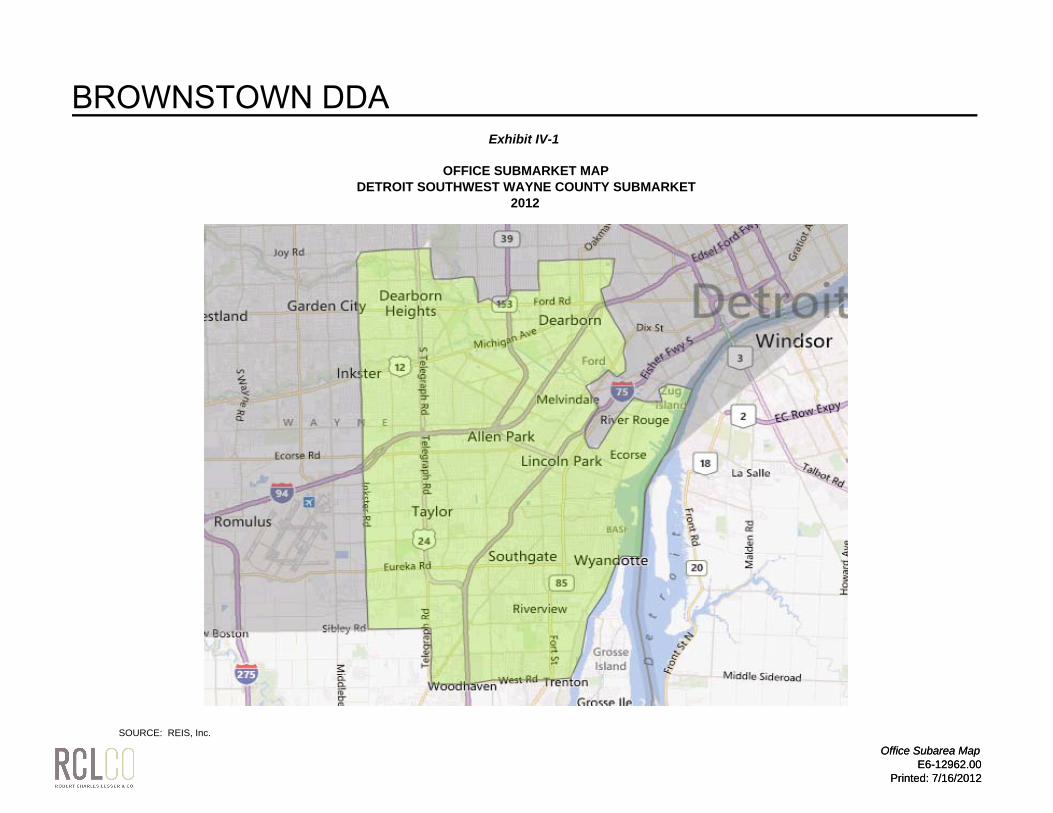
Exhibit IV-1
OFFICE SUBMARKET MAPDETROIT SOUTHWEST WAYNE COUNTY SUBMARKET
2012
Office Subarea MapE6-12962.00
Printed: 7/16/2012
SOURCE: REIS, Inc.
Office Subarea MapE6-12962.00
Printed: 7/16/2012
BROWNSTOWN DDA
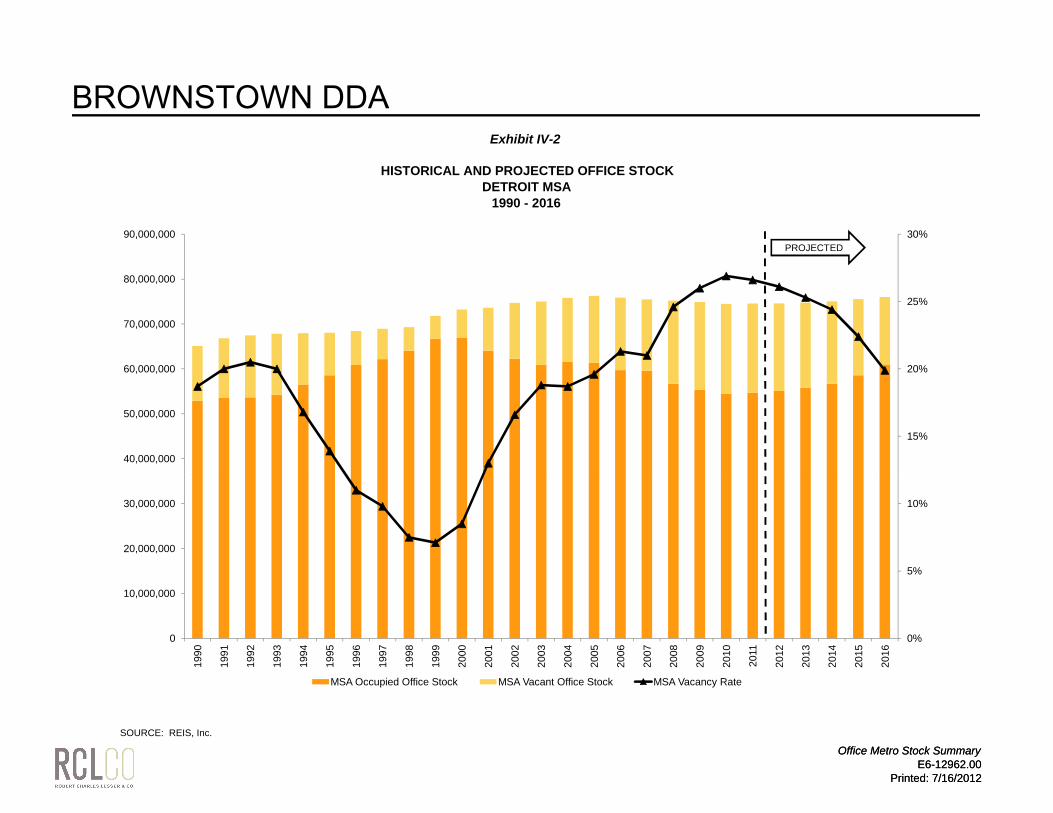
Exhibit IV-2
HISTORICAL AND PROJECTED OFFICE STOCKDETROIT MSA
1990 - 2016
%
15%
20%
25%
30%
40,000,000
50,000,000
60,000,000
70,000,000
80,000,000
90,000,000PROJECTED
Office Metro Stock SummaryE6-12962.00
Printed: 7/16/2012
SOURCE: REIS, Inc.
0%
5%
10%
0
10,000,000
20,000,000
30,000,000
1990
1991
1992
1993
1994
1995
1996
1997
1998
1999
2000
2001
2002
2003
2004
2005
2006
2007
2008
2009
2010
2011
2012
2013
2014
2015
2016
MSA Occupied Office Stock MSA Vacant Office Stock MSA Vacancy Rate
Office Metro Stock SummaryE6-12962.00
Printed: 7/16/2012
BROWNSTOWN DDA

Exhibit IV-3
HISTORICAL AND PROJECTED OFFICE STOCKDETROIT SOUTHWEST WAYNE COUNTY SUBMARKET
1995 - 2016
%
20%
25%
30%
35%
40%
45%
2,000,000
2,500,000
3,000,000
3,500,000
4,000,000
4,500,000
5,000,000PROJECTED
Office Subarea Stock SummaryE6-12962.00
Printed: 7/16/2012
SOURCE: REIS, Inc.
0%
5%
10%
15%
0
500,000
1,000,000
1,500,000
2,000,000
1995
1996
1997
1998
1999
2000
2001
2002
2003
2004
2005
2006
2007
2008
2009
2010
2011
2012
2013
2014
2015
2016
SW Wayne Occupied Office Stock SW Wayne Vacant Office Stock SW Wayne Vacancy Rate
Office Subarea Stock SummaryE6-12962.00
Printed: 7/16/2012
BROWNSTOWN DDA
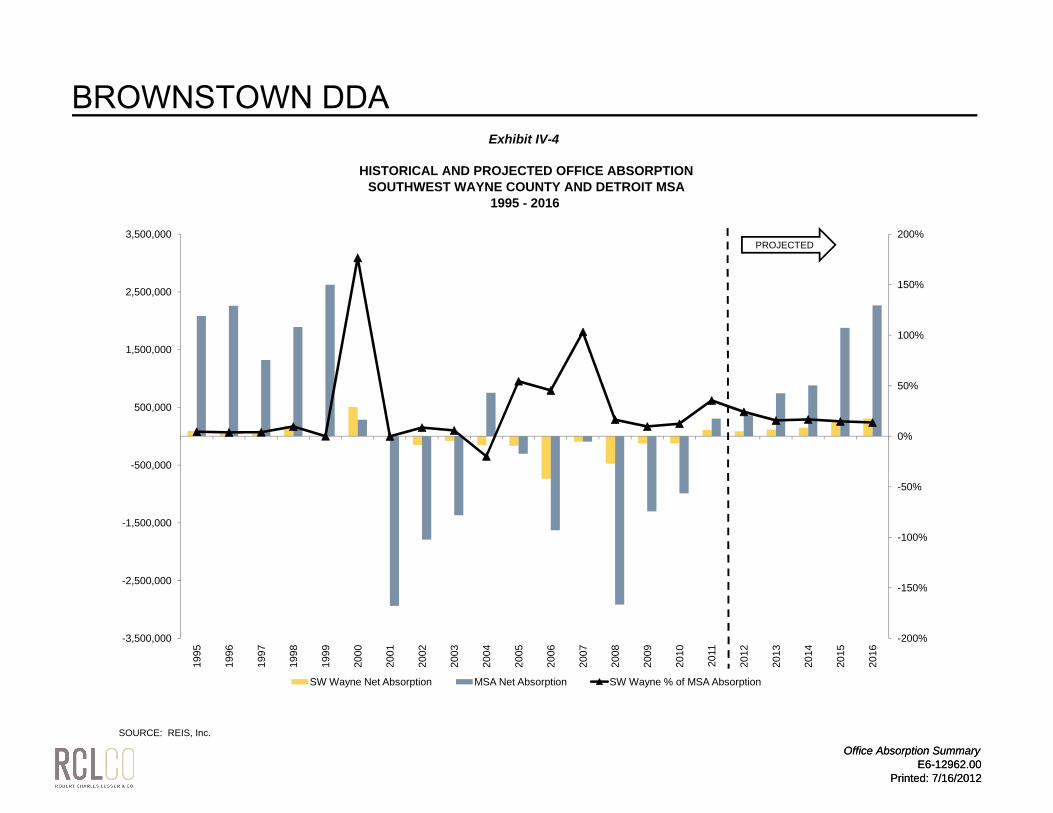
Exhibit IV-4
HISTORICAL AND PROJECTED OFFICE ABSORPTIONSOUTHWEST WAYNE COUNTY AND DETROIT MSA
1995 - 2016
-50%
0%
50%
100%
150%
200%
-500,000
500,000
1,500,000
2,500,000
3,500,000PROJECTED
Office Absorption SummaryE6-12962.00
Printed: 7/16/2012
SOURCE: REIS, Inc.
-200%
-150%
-100%
-50%
-3,500,000
-2,500,000
-1,500,000
1995
1996
1997
1998
1999
2000
2001
2002
2003
2004
2005
2006
2007
2008
2009
2010
2011
2012
2013
2014
2015
2016
SW Wayne Net Absorption MSA Net Absorption SW Wayne % of MSA Absorption
Office Absorption SummaryE6-12962.00
Printed: 7/16/2012
BROWNSTOWN DDA

Exhibit IV-5
EFFECTIVE RATE AND VACANCY RATESOUTHWEST WAYNE COUNTY AND DETROIT MSA
1995 - 2016
%
20%
25%
30%
35%
40%
45%
$
$16.00
$18.00
$20.00
$22.00 PROJECTED
Office Rents and VacancyE6-12962.00
Printed: 7/16/2012
SOURCE: REIS, Inc.
0%
5%
10%
15%
$10.00
$12.00
$14.00
1995
1996
1997
1998
1999
2000
2001
2002
2003
2004
2005
2006
2007
2008
2009
2010
2011
2012
2013
2014
2015
2016
SW Wayne Effective Rent MSA Effective Rent SW Wayne Vacancy Rate MSA Vacancy Rate
Office Rents and VacancyE6-12962.00
Printed: 7/16/2012
BROWNSTOWN DDA

Exhibit IV-6
RATIO OF ASKING RENT TO EFFECTIVE RENTSOUTHWEST WAYNE COUNTY AND DETROIT MSA
1995 - 2016
80%
85%
90%
95%PROJECTED
Office Asking v Effective RentE6-12962.00
Printed: 7/16/2012
SOURCE: REIS, Inc.
70%
75%
80%
1995
1996
1997
1998
1999
2000
2001
2002
2003
2004
2005
2006
2007
2008
2009
2010
2011
2012
2013
2014
2015
2016
SW Wayne Effective/Asking Rent MSA Effective/Asking Rent
Office Asking v Effective RentE6-12962.00
Printed: 7/16/2012
BROWNSTOWN DDA

Exhibit IV-7
NUMBER OF EMPLOYEESBROWNSTOWN TOWNSHIP, MI
2010
SOURCE: Esri Business Analyst
Business CentersE6-12962.00
Printed: 7/16/2012
BROWNSTOWN DDA

MAP KEY PROJECT NAME
VACANCY RATE SIZE (SF) RENT/SF
1 Professional Office 44% 14,030 $17.122 Horizon Business Center West 54% 76,600 $13.463 Horizon East 18% 42,147 $14.964 Anderson Business Center 26% 33,000 $6.735 Superior Place 48% 41,000 $14.506 Heritage Office Bldg 33% 89,000 $14.917 Allen Park Office Plaza 29% 15,000 $19.828 Telegraph Office 15% 50,000 $16.009 Park Place Office Center 13% 50,000 $15.0010 Chirco Enterprise Center 100% 7,600 $14.0011 19249 Allen Road 15% 6,790 $17.5012 Timber Ridge 100% 6,605 $10.0013 Pennsylvania Place 10% 10,420 $13.0014 Southgate Towers 65% 184,396 $13.50
WEIGHTEDAVERAGE SUM AVERAGE
Overall 43% 626,588 $14.32
Exhibit IV-8
COMPARABLE OFFICE DEVELOPMENTS MAPDETROIT DOWNRIVER REGION
2012
1
2 3
5 6
7
8
9
11
12
1314
Office Comp MapE6-12962.00
Printed: 7/17/2012
Overall 43% 626,588 $14.32
SOURCE: REIS, Inc.; RCLCO
1
4
10
12
Office Comp MapE6-12962.00
Printed: 7/17/2012
BROWNSTOWN DDA
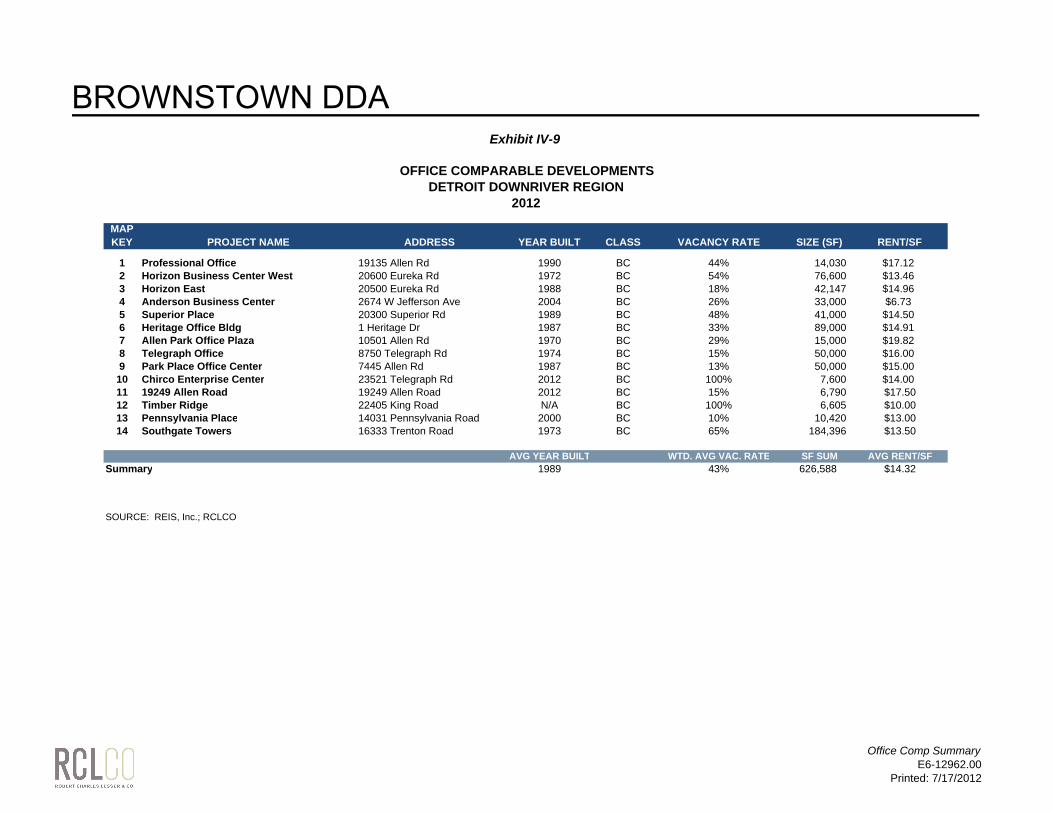
MAP KEY PROJECT NAME ADDRESS YEAR BUILT CLASS VACANCY RATE SIZE (SF) RENT/SF
1 Professional Office 19135 Allen Rd 1990 BC 44% 14,030 $17.122 Horizon Business Center West 20600 Eureka Rd 1972 BC 54% 76,600 $13.463 Horizon East 20500 Eureka Rd 1988 BC 18% 42,147 $14.964 Anderson Business Center 2674 W Jefferson Ave 2004 BC 26% 33,000 $6.735 Superior Place 20300 Superior Rd 1989 BC 48% 41,000 $14.506 Heritage Office Bldg 1 Heritage Dr 1987 BC 33% 89,000 $14.917 Allen Park Office Plaza 10501 Allen Rd 1970 BC 29% 15,000 $19.828 Telegraph Office 8750 Telegraph Rd 1974 BC 15% 50,000 $16.009 Park Place Office Center 7445 Allen Rd 1987 BC 13% 50,000 $15.0010 Chirco Enterprise Center 23521 Telegraph Rd 2012 BC 100% 7,600 $14.0011 19249 Allen Road 19249 Allen Road 2012 BC 15% 6,790 $17.5012 Timber Ridge 22405 King Road N/A BC 100% 6,605 $10.0013 Pennsylvania Place 14031 Pennsylvania Road 2000 BC 10% 10,420 $13.0014 Southgate Towers 16333 Trenton Road 1973 BC 65% 184,396 $13.50
AVG YEAR BUILT WTD. AVG VAC. RATE SF SUM AVG RENT/SFSummary 1989 43% 626,588 $14.32
SOURCE: REIS, Inc.; RCLCO
Exhibit IV-9
OFFICE COMPARABLE DEVELOPMENTS
2012DETROIT DOWNRIVER REGION
Office Comp SummaryE6-12962.00
Printed: 7/17/2012
BROWNSTOWN DDA

Exhibit IV-10
BUSINESS SUMMARY - NUMBER OF BUSINESSESBROWNSTOWN TOWNSHIP
2010
BUSINESS SUMMARY DOWNRIVER REGIONBROWNSTOWN
TOWNSHIPBROWNSTOWN % OF DOWNRIVER REGION
Agriculture, Forestry, Fishing & Hunting 29 13 45%Mining 12 1 8%Utilities 20 5 25%Construction 719 83 12%Manufacturing 444 31 7%Wholesale Trade 395 25 6%Retail Trade 1336 101 8%Motor Vehicle & Parts Dealers 175 20 11%Furniture & Home Furnishings Stores 39 3 8%Electronics & Appliance Stores 51 1 2%Bldg Material & Garden Equipment & Supplies Dealers 132 8 6%Food & Beverage Stores 164 17 10%Health & Personal Care Stores 137 11 8%Gasoline Stations 99 7 7%Clothing & Clothing Accessories Stores 172 6 3%Sport Goods, Hobby, Book, & Music Stores 105 3 3%General Merchandise Stores 59 7 12%Miscellaneous Store Retailers 190 18 9%Nonstore Retailers 14 0 0%Transportation & Warehousing 414 30 7%Information 144 5 3%Finance & Insurance 408 53 13%Central Bank/Credit Intermediation & Related Activities 208 21 10%Securities, Commodity Contracts & Other Financial Investments 74 12 16%Insurance Carriers & Related Activities; Funds, Trusts & Other Financial Vehicles 126 20 16%Real Estate, Rental & Leasing 419 53 13%Professional, Scientific & Tech Services 542 41 8%Legal Services 93 4 4%Management of Companies & Enterprises 5 2 40%Administrative & Support & Waste Management & Remediation Services 363 54 15%Educational Services 280 23 8%Health Care & Social Assistance 672 50 7%Arts, Entertainment & Recreation 180 21 12%Accommodation & Food Services 748 56 7%Accommodation 63 3 5%Food Services & Drinking Places 685 53 8%Other Services (except Public Administration) 1158 105 9%Automotive Repair & Maintenance 271 26 10%Public Administration 282 46 16%Unclassified Establishments 153 22 14%
Average Share 11%
SOURCE: ESRI Business Analyst
Brwnstwn % of Dwnriv BusinessesE6-12962.00
Printed: 7/16/2012
BROWNSTOWN DDA

Exhibit IV-11
BUSINESS SHAREBROWNSTOWN TOWNSHIP, MI
2010
Sport Goods, Hobby, Book, & Music StoresGeneral Merchandise Stores
Miscellaneous Store RetailersNonstore Retailers
Transportation & WarehousingInformation
Finance & InsuranceCentral Bank/Credit Intermediation & Related Activities
Securities, Commodity Contracts & Other Financial InvestmentsInsurance Carriers & Related Activities; Funds, Trusts & Other Financial …
Real Estate, Rental & LeasingProfessional, Scientific & Tech Services
Legal ServicesManagement of Companies & Enterprises
Administrative & Support & Waste Management & Remediation ServicesEducational Services
Health Care & Social AssistanceArts, Entertainment & RecreationAccommodation & Food Services
AccommodationFood Services & Drinking Places
Other Services (except Public Administration)Automotive Repair & Maintenance
Public AdministrationUnclassified Establishments
Brownstown Township makes up 10% of the Downriver Region's housholds, but in many cases, a much higher % of the business share.
SOURCE: Costar
0% 5% 10% 15% 20% 25% 30% 35% 40% 45% 50%
Agriculture, Forestry, Fishing & HuntingMining
UtilitiesConstruction
ManufacturingWholesale Trade
Retail TradeMotor Vehicle & Parts Dealers
Furniture & Home Furnishings StoresElectronics & Appliance Stores
Bldg Material & Garden Equipment & Supplies DealersFood & Beverage Stores
Health & Personal Care StoresGasoline Stations
Clothing & Clothing Accessories Stores
Brownstown Township Share of Downriver Region Businesses
Business ShareE6-12962.00
Printed: 7/17/2012
BROWNSTOWN DDA

<<<HISTORICAL FORECAST >>>2000 2001 2002 2003 2004 2005 2006 2007 2008 2009 2010 2011 2012 2013 2014 2015 2016 2017 2018 2019 2020 2021 2022 2023 2024 2025 Total
Detroit MSA Total Employment (000s) 1 1,932 1,911 1,927 1,978 2,052 2,097 2,137 2,147 2,175 2,228 2,234 2,138 2,167 2,183 2,224 2,281 2,320 2,324 2,318 2,315 2,317 2,321 2,327 2,334 2,339 2,344Annual Growth Rate 1.4% 0.7% 1.9% 2.6% 1.7% 0.2% -0.3% -0.1% 0.1% 0.2% 0.3% 0.3% 0.2% 0.2%Annual Employment Change (000s) 30 16 42 57 39 4 -6 -2 1 4 6 7 5 5 207
Historical Occupied Office Space (000s) 2 66,984 64,046 62,257 60,889 61,643 61,340 59,714 59,622 56,707 55,407 54,419 54,724
SF/Total New Employee 3 35 34 32 31 30 29 28 28 26 25 24 26 26 26 28 29 30 30 30 30 30 30 30 30 30 30
New Office SF Demanded (000s) 769 411 1,164 1,649 1,158 134 -195 -74 40 128 187 198 158 154 5,881
Downriver Capture of New Office Space 4 6.6% 6.6% 6.6% 6.6% 6.6% 6.6% 6.6% 6.6% 6.6% 6.6% 6.6% 6.6% 6.6% 6.6%
Total New Downriver Office Space (000s) 51 27 77 109 76 9 -13 -5 3 8 12 13 10 10 388
Brownstown Capture of New Office Space 5 11.6% 11.6% 11.6% 11.6% 11.6% 11.6% 11.6% 11.6% 11.6% 11.6% 11.6% 11.6% 11.6% 11.6%
Total New Brownstown Office Space (000s) 6 3 9 13 9 1 -1 -1 0 1 1 2 1 1 45
TOTAL BROWNSTOWN OFFICE DEMAND (2012-2025)
1 Historical data based on BLS data. Forecast based on Economy.com.2 Per REIS, Inc for the Detroit Metro Area.3 Based upon comparison of total office square feet in the Detroit Metro Area from REIS compared to total Detroit MSA employment from Moody's economy.com. 4 Based on REIS data for total occupied office space in the Southwest Wayne submarket versus the total occupied office space in the Detroit Metro Area.5 Based on ESRI data for total office employees in Brownstown versus the total office employees in the Downriver Region.
44,865 SF
Exhibit IV-12
OFFICE DEMANDBROWNSTOWN TOWNSHIP
2012 - 2025
Office DemandE6-12962.00
Printed: 7/16/2012
BROWNSTOWN DDA
V. RETAIL
BROWNSTOWN DDA
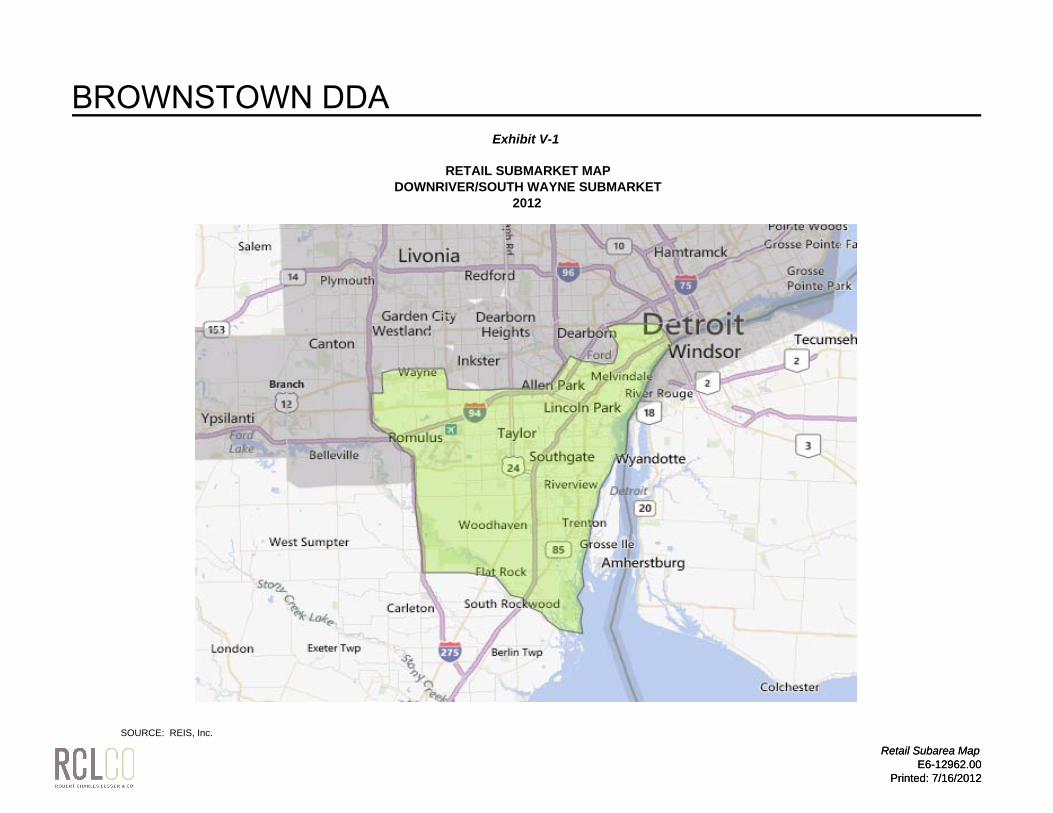
Exhibit V-1
RETAIL SUBMARKET MAPDOWNRIVER/SOUTH WAYNE SUBMARKET
2012
Retail Subarea MapE6-12962.00
Printed: 7/16/2012
SOURCE: REIS, Inc.
Retail Subarea MapE6-12962.00
Printed: 7/16/2012
BROWNSTOWN DDA

Exhibit V-2
HISTORICAL AND PROJECTED NEIGHBORHOOD AND COMMUNITY RETAIL STOCKDETROIT DOWNRIVER SUBMARKET
2000 - 2016
1,500,000
2,000,000
2,500,000
3,000,000PROJECTED
Retail Submkt SummaryE6-12962.00
Printed: 7/16/2012
SOURCE: REIS, Inc.
0
500,000
1,000,000
2000 2001 2002 2003 2004 2005 2006 2007 2008 2009 2010 2011 2012 2013 2014 2015 2016
Downriver Occupied Neighborhood Retail Stock Downriver Occupied Community Retail StockDownriver Vacant Neighborhood Retail Stock Downriver Vacant Community Retail StockDownriver Projected Occupied Retail Stock Downriver Projected Vacant Retail Stock
Retail Submkt SummaryE6-12962.00
Printed: 7/16/2012
BROWNSTOWN DDA
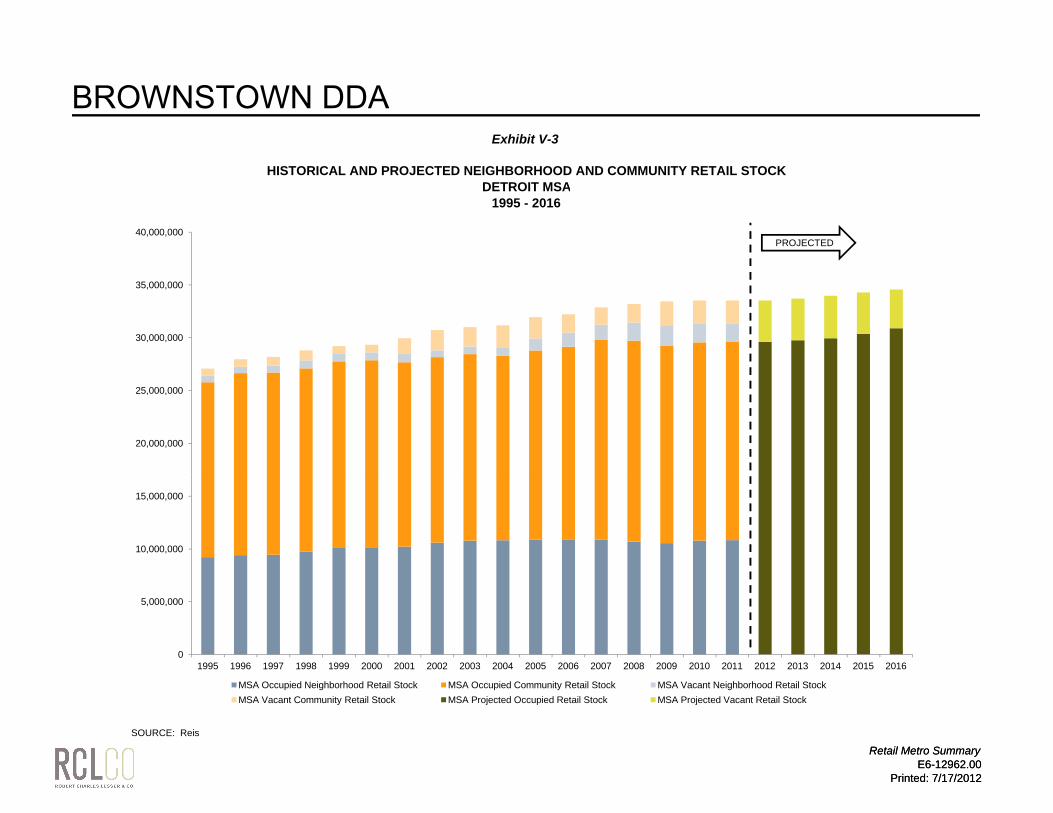
Exhibit V-3
HISTORICAL AND PROJECTED NEIGHBORHOOD AND COMMUNITY RETAIL STOCKDETROIT MSA
1995 - 2016
15,000,000
20,000,000
25,000,000
30,000,000
35,000,000
40,000,000PROJECTED
Retail Metro SummaryE6-12962.00
Printed: 7/17/2012
SOURCE: Reis
0
5,000,000
10,000,000
15,000,000
1995 1996 1997 1998 1999 2000 2001 2002 2003 2004 2005 2006 2007 2008 2009 2010 2011 2012 2013 2014 2015 2016
MSA Occupied Neighborhood Retail Stock MSA Occupied Community Retail Stock MSA Vacant Neighborhood Retail StockMSA Vacant Community Retail Stock MSA Projected Occupied Retail Stock MSA Projected Vacant Retail Stock
Retail Metro SummaryE6-12962.00
Printed: 7/17/2012
BROWNSTOWN DDA

Exhibit V-4
SUBMARKET SHARE OF METRO AREA RETAIL STOCKDOWNRIVER SUBMARKET AND DETROIT MSA
2000 - 2016
15%
20%
25%
30%
35%PROJECTEDThe Downriver Submarket is projected to hold a stable, share of
the metro area's occupied and vacant stock.
Retail Subarea % of MetroE6-12962.00
Printed: 7/16/2012
SOURCE: Reis
0%
5%
10%
15%
2000 2001 2002 2003 2004 2005 2006 2007 2008 2009 2010 2011 2012 2013 2014 2015 2016
Submarket Occupied % of Retail Stock Submarket Vacant% of Retail StockSubmarket Projected Occupied % of Retail Stock Submarket Projected Vacant % of Retail Stock
Retail Subarea % of MetroE6-12962.00
Printed: 7/16/2012
BROWNSTOWN DDA

Exhibit V-5
HISTORICAL EFFECTIVE RENTS AND VACANCY RATESDETROIT DOWNRIVER SUBMARKET
2000 - 2011
15%
20%
25%
30%
35%
40%
$6
$8
$10
$12
$14
$16
Dwnriver Rents and VacancyE6-12962.00
Printed: 7/16/2012
SOURCE: REIS, Inc.
0%
5%
10%
15%
$0
$2
$4
$6
2000 2001 2002 2003 2004 2005 2006 2007 2008 2009 2010 2011
Downriver Community Retail Rental rates Downriver Neighborhood Retail Rental RatesDownriver Community Retail Vacancy Rates Downriver Neighborhood Retail Vacancy Rates
Dwnriver Rents and VacancyE6-12962.00
Printed: 7/16/2012
BROWNSTOWN DDA

Exhibit V-6
AVERAGE DAILY TRAFFIC COUNTSDETROIT DOWNRIVER REGION
2010
The average daily traffic count (ADT) along Telegraph Road to the north and south of the site is over 20,000. The ADT along Dix
Toledo Road approaching Telegraph is 15,100.
2009 AAD Traffic CountsE6-12962.00
Printed: 7/16/2012
SOURCE: Michigan Department of Transportation
Telegraph Road
Pennsylvania Road
Van Born Road
2009 AAD Traffic CountsE6-12962.00
Printed: 7/16/2012
BROWNSTOWN DDA

Exhibit V-7
GROCERY AND GENERAL MERCHANDISE RETAIL MAPBROWNSTOWN TOWNSHIP, MI
2012
Grocery Retail MapE6-12962.00
Printed: 7/16/2012
SOURCE: Google; RCLCO
Grocery Retail MapE6-12962.00
Printed: 7/16/2012
BROWNSTOWN DDA

Exhibit V-8
1-, 3-, AND 5- MILE RINGBROWNSTOWN TOWNSHIP, MI
2012
1,3,5 Mi MapE6-12962.00
Printed: 7/16/2012
SOURCE: Google; RCLCO
1,3,5 Mi MapE6-12962.00
Printed: 7/16/2012
BROWNSTOWN DDA

Exhibit V-9
RETAIL COMPARABLES MAPDETROIT DOWNRIVER REGION
2012
MAP KEY DEVELOPMENT SIZE (SF)
VACANCY RATE
1 West-Tel Plaza 36,200 14%2 Brownstown Shopping Plaza 115,902 10%3 Unnamed Center 12,000 11%4 The Shops at Tanglewood 13,974 21%5 Trafford Square 95,000 1%6 Whispering Woods Plaza 143,798 6%7 Unnamed Center 1949 King Rd 10,000 0%8 Unnamed Center 23620 Eureka Rd 26,500 10%9 Burlington Square 223,123 28%10 26211 Eureka Rd 15,000 8%11 Unnamed Center 19025 Eureka Rd 13,572 0%12 Galleria Plaza 58,476 14%13 Dix Eureka Shopping Plaza 120,000 0%14 Southtowne Crossing Shopping Center 188,416 N/A15 Southgate Shopping Center 356,760 64%16 Fort Grove Shopping Center 35,000 9%17 Tel-Goddard Shopping Center 186,000 11%18 Telegraph and Koths Center 15,000 20%19 Par-Wick Plaza 27,180 14%20 Allen Oaks Shopping Center 28,000 N/A21 Forest City Plaza {aka-Gratiot Plaza} 148,600 0%22 Unnamed Center 7745 Telegraph Rd 16 628 8%3 7
8 910 111213
14
15
1617
18
19 20
2122
23
24 25 26 27
28
Retail Comp MapE6-12962.00
Printed: 7/16/2012
22 Unnamed Center 7745 Telegraph Rd 16,628 8%23 Lincoln Park Plaza Shopping Center 175,000 35%24 Sunrise Shopping Center 206,000 13%25 Taylor Commons 98,600 29%26 Allen Park Plaza 49,710 28%27 Park Place 30,000 12%28 Southland Mall 915,197 12%29 Woodhaven Village Square Shopping n/a n/a30 Woodhaven Commons 285,440 8%
WEIGHTEDSUM AVERAGE
Overall 3,645,076 17%
SOURCE: Reis; RCLCO
12
3
4
5
6
7
3029
Retail Comp MapE6-12962.00
Printed: 7/16/2012
BROWNSTOWN DDA

Exhibit V-10
NEIGHBORHOOD CENTER AND COMMUNITY CENTER RETAIL COMPARABLES BROWNSTOWN TOWNSHIP, MI
2012
MAP KEY PROJECT NAME
YEAR BUILT
NONANCHOR RENT
ANCHOR RENT
VACANCY RATE SIZE (SF)
NONANCHOR SIZE
ANCHOR SIZE ANCHOR AND MAJOR TENANTS
1 West-Tel Plaza 1985 $16.00 N/A 14% 36,200 36,200 N/A23780 West Rd Brownstown Township
2 Brownstown Shopping Plaza 1999 $20.20 $18.45 10% 115,902 48,076 67,82623849 West Rd Flat Rock
3 Unnamed Center 1979 $10.00 N/A 11% 12,000 12,000 N/A Dentist, Re/Max, Sporting Goods20890 Grange Rd Riverview
4 The Shops at Tanglewood 2003 $14.11 N/A 21% 13,974 13,974 N/A Cvs, Metro PCS, Check & Go, H&R Block27270 Telegraph Rd Flat Rock
5 Trafford Square 1974 $11.98 $10.28 1% 95,000 33,000 62,0003020 Van Horn Rd Trenton
6 Whispering Woods Plaza 2001 $17.99 $15.99 6% 143,798 86,798 57,000 Blockbuster, Bo Rics, Gnc, Kroger, SubwayGibraltar Rd Brownstown Township
7 Unnamed Center 1949 King Rd 1985 $10.65 N/A 0% 10,000 10,000 N/A Restaurant, Scrapbook Center1949 King Rd Trenton
8 Unnamed Center 23620 Eureka Rd 1992 $14.00 $10.08 10% 26,500 16,500 10,000 Unknown Anchor23620 Eureka Rd Taylor
9 Burlington Square 1988 $11.00 $11.00 28% 223,123 76,123 147,00022331 Eureka Rd Taylor
10 26211 Eureka Rd 1985 $13.09 N/A 8% 15,000 15,000 N/A Blockbuster, Subway26211 Eureka Rd Taylor
11 Unnamed Center 19025 Eureka Rd 1985 $12.10 N/A 0% 13,572 13,572 N/A Curves, Play It Again Sports, Subway19025 Eureka Rd Southgate
12 Galleria Plaza 1985 $12.56 N/A 14% 58,476 58,476 N/A15461 Dix Toledo Rd Southgate
Kroger, Cleaners, Fashion Bug, Hallmark, Walgreens, Cucina, Blockbuster, Dairy Queen, Weight Watchers,
Sylvan Learning Center, Dollar Store, Wild Bills Tobacco, AT&T
Ace Hardware, Dark Fmr Foodtown, Rite Aid, Subway
Burlington Coat, Unknown Anchor, Vac Fmr Petco, Vac Fmr Staples
Cvs, Enterprise Rent-a-Car, Anytime Fitness, Little Caesers, Spa, UPS, Metro PCS, Coney Island,
Subway, Cash Advance
Anytime Fitness, Jewlery Store, Nail Salon, Snookers Pool & Pub
Page 1 of 3
Retail Comp SheetE6-12962.00
Printed: 7/17/2012
BROWNSTOWN DDA

Exhibit V-10
NEIGHBORHOOD CENTER AND COMMUNITY CENTER RETAIL COMPARABLES BROWNSTOWN TOWNSHIP, MI
2012
MAP KEY PROJECT NAME
YEAR BUILT
NONANCHOR RENT
ANCHOR RENT
VACANCY RATE SIZE (SF)
NONANCHOR SIZE
ANCHOR SIZE ANCHOR AND MAJOR TENANTS
13 Dix Eureka Shopping Plaza 1985 $12.46 $9.18 0% 120,000 60,000 60,000 Chuck E Cheese, Officemax, Tj Maxx15060 Dix Toledo Rd Southgate
14 Southtowne Crossing Shopping Center 1986 N/A N/A N/A 188,416 40,016 148,400 Wal-Mart14800 Dix Toledo Rd Southgate
15 Southgate Shopping Center 1958 $16.92 $10.15 64% 356,760 112,079 244,68113619 Eureka Rd Southgate
16 Fort Grove Shopping Center 1960 $10.00 $10.00 9% 35,000 25,700 9,3003901 Fort St Wyandotte
17 Tel-Goddard Shopping Center 1988 $14.87 $10.46 11% 186,000 107,480 78,52011400 Telegraph Rd Taylor
18 Telegraph and Koths Center 2006 $18.14 N/A 20% 15,000 15,000 N/A Pure Nv Salon10145 Telegraph Rd Taylor
19 Par-Wick Plaza 1985 $14.00 $9.22 14% 27,180 13,130 14,050 American Video, Pizza Kings, Sax's Drugs22525 Wick Rd Taylor
20 Allen Oaks Shopping Center 1987 N/A N/A N/A 28,000 28,000 N/A Cottage Inn Pizza, Jj Market9200 Pelham Rd Taylor
21 Forest City Plaza {aka-Gratiot Plaza} 1965 $23.65 $8.43 0% 148,600 48,000 100,600 Cvs, Radio Shack, Unknown Anchor7834 Telegraph Rd Taylor
22 Unnamed Center 7745 Telegraph Rd 1985 $18.29 N/A 8% 16,628 16,628 N/A7745 Telegraph Rd Taylor
23 Lincoln Park Plaza Shopping Center 1955 $17.01 $6.21 35% 175,000 95,340 79,6603574 Fort St Lincoln Park
24 Sunrise Shopping Center 1960 $12.69 $8.64 13% 206,000 150,240 55,760 A&p, Aco Hardware, Arbor Drugs, Vacant Anchor22615 Ecorse Rd Taylor
25 Taylor Commons 1992 $17.29 $11.06 29% 98,600 13,420 85,18021552 Ecorse Rd Taylor
Jc Penney, Lofts Super Store, Vac Fmr Farmer Jack, Vacant Anchor
Credit Union, Rite Aid, Vacant Anchor, Vacant Anchor Jack
Creat Clips, Game Stop, Payless Shoe Source, Sally Beauty Supply
Cvs, Jenny Craig, Planet Fitness, Theater, Tri State Furniture, Vac Fmr Farmer Jack, Vac Fmr Montgomery
Bingo Hall, Chicago Pizza, Dollar General, Family Restaurant, Save a Lot
Cattleman's, Dunham's Sport Goods, Home Depot, Mad Max, Nails Usa, Prestige, Unknonw Anchor,
Unknown Anchor, Vac Fmr Denin Sporti
Page 2 of 3
Retail Comp SheetE6-12962.00
Printed: 7/17/2012
BROWNSTOWN DDA

Exhibit V-10
NEIGHBORHOOD CENTER AND COMMUNITY CENTER RETAIL COMPARABLES BROWNSTOWN TOWNSHIP, MI
2012
MAP KEY PROJECT NAME
YEAR BUILT
NONANCHOR RENT
ANCHOR RENT
VACANCY RATE SIZE (SF)
NONANCHOR SIZE
ANCHOR SIZE ANCHOR AND MAJOR TENANTS
26 Allen Park Plaza 1985 $16.00 $16.00 28% 49,710 38,710 11,000 Aco Hardware, Subway, Unknown Anchor15801 Southfield Rd Allen Park
27 Park Place 1988 $12.19 $8.14 12% 30,000 18,927 11,0731071 Fort St Lincoln Park
28 Southland Mall23000 Eureka Road Taylor
1970 $25.00 N/A 12% 915,197 362,033 553,164 Aeropostale, American Eagle, Bath & Body Works, Best Buy, Champs Sports, Children's Place, CJ Banks, Claire's, Express, Forever 21, Game Stop, JC Penny,
Justice, Lane Bryant, Macy's, Men's Wearhouse, Motherhood Maternity, PacSun, Radio Shack,
Sunglass Hut, Victoria's Secret
29 Woodhaven Village Square 23200--25800 Allen Road
N/A $16.00 N/A N/A N/A N/A N/A Office Depot, Home Depot, WalMart, Dollar General, PetSmart, Michaels
30 Woodhaven CommonsAllen Road
N/A N/A N/A 8% 285,440 N/A N/A Target, Kroger, Home Goods, Ulta, Famous Footwear, Radio Shack, Panera
SOURCE: REIS, Inc.; RCLCO
Blockbuster, Detroit Fish & Chips, Rent-A-Center, Simply Fashion, Vacant Anchor
Page 3 of 3
Retail Comp SheetE6-12962.00
Printed: 7/17/2012
BROWNSTOWN DDA
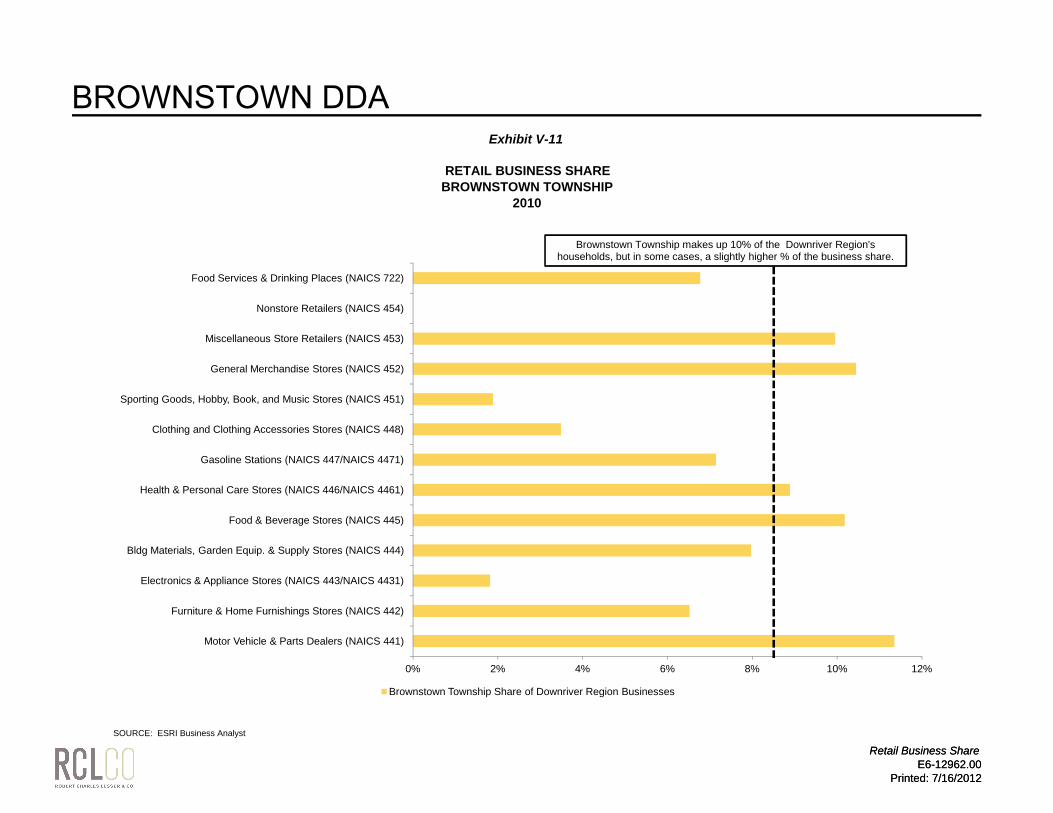
Exhibit V-11
RETAIL BUSINESS SHAREBROWNSTOWN TOWNSHIP
2010
Health & Personal Care Stores (NAICS 446/NAICS 4461)
Gasoline Stations (NAICS 447/NAICS 4471)
Clothing and Clothing Accessories Stores (NAICS 448)
Sporting Goods, Hobby, Book, and Music Stores (NAICS 451)
General Merchandise Stores (NAICS 452)
Miscellaneous Store Retailers (NAICS 453)
Nonstore Retailers (NAICS 454)
Food Services & Drinking Places (NAICS 722)
Brownstown Township makes up 10% of the Downriver Region's households, but in some cases, a slightly higher % of the business share.
Retail Business ShareE6-12962.00
Printed: 7/16/2012
SOURCE: ESRI Business Analyst
0% 2% 4% 6% 8% 10% 12%
Motor Vehicle & Parts Dealers (NAICS 441)
Furniture & Home Furnishings Stores (NAICS 442)
Electronics & Appliance Stores (NAICS 443/NAICS 4431)
Bldg Materials, Garden Equip. & Supply Stores (NAICS 444)
Food & Beverage Stores (NAICS 445)
Health & Personal Care Stores (NAICS 446/NAICS 4461)
Brownstown Township Share of Downriver Region Businesses
Retail Business ShareE6-12962.00
Printed: 7/16/2012
BROWNSTOWN DDA

Exhibit V-12
RETAIL SURPLUS AND LEAKAGEBROWNSTOWN TOWNSHIP AND DOWNRIVER REGION
2010
F d & B St (NAICS 445)
Health & Personal Care Stores (NAICS 446/NAICS 4461)
Gasoline Stations (NAICS 447/NAICS 4471)
Clothing and Clothing Accessories Stores (NAICS 448)
Sporting Goods, Hobby, Book, and Music Stores (NAICS 451)
General Merchandise Stores (NAICS 452)
Miscellaneous Store Retailers (NAICS 453)
Nonstore Retailers (NAICS 454)
Food Services & Drinking Places (NAICS 722)
Retail LeakageE6-12962.00
Printed: 7/16/2012
SOURCE: Esri; RCLCO
-$100,000 -$50,000 $0 $50,000 $100,000 $150,000 $200,000 $250,000 $300,000
Motor Vehicle & Parts Dealers (NAICS 441)
Furniture & Home Furnishings Stores (NAICS 442)
Electronics & Appliance Stores (NAICS 443/NAICS 4431)
Bldg Materials, Garden Equip. & Supply Stores (NAICS 444)
Food & Beverage Stores (NAICS 445)
( )
Retail Gap (Thousands)
Downriver Region Brownstown
Retail LeakageE6-12962.00
Printed: 7/16/2012
BROWNSTOWN DDA

Exhibit V-13
RETAIL REQUIREMENTSGROCERY STORES
EXAMPLES OF GROCERY TENANTS
TARGETED CUSTOMER BASE
TRAFFIC COUNTS (VPD)
HOUSHOLD/MILE RADIUS
POPULATION/ MILE RADIUS
EXISTING LOCATION NEARBY?
The Fresh Market High, mid income,
adult, senior 18,000 N/A 100,000/5 No
Publix AllDependant on
store sizeDependant on
store sizeDependant on
store size No
Trader Joe's Co., Inc. High income, adult, college-educated N/A N/A 90,000/5 No
Whole Foods Market, Inc.
High, mid income, advanced
college degree N/A N/A 130,000/5 No
SUBJECT SITE 1 mi 3 mi 5 mi TRAFFIC COUNT 20102010 Households 3,269 15,015 44,710 Telegraph Road between Sybley and Gibraltar 21,8002010 Population 8,926 41,375 119,098 Telegraph Road at Pennsylvania 20,200
Dix Toledo between Hwy 75 and Telegraph 15,100
SOURCE: Retail Tenant Directory; ESRI Business Analyst; RCLCO
18,000 - 30,000
1,200 - 56,000
8,000 - 15,000
18,500 - 80,000
PREFERRED GLA
GroceryE6-12962.00
Printed: 7/16/2012
BROWNSTOWN DDA

Exhibit V-14
RETAIL REQUIREMENTSFURNITURE AND ELECTRONICS
EXAMPLES OF FURNITURE/ELECTRONICS TENANTS
TARGETED CUSTOMER BASE
TRAFFIC COUNTS (VPD)
HOUSHOLD/MILE RADIUS
POPULATION/ MILE RADIUS
EXISTING LOCATION NEARBY?
Cost PlusHigh, mid income,
adult, senior 18,000 N/A 100,000/5 No
Pier 1 AllDependant on
store sizeDependant on
store sizeDependant on
store size Yes
RadioshackHigh income, adult, college-educated N/A N/A 90,000/5 Yes
Ashley FurnitureHigh, mid income,
adult N/A N/A N/A NoMenard Mid income, adult N/A N/A 100,000/10 No
SUBJECT SITE 1 mi 3 mi 5 mi TRAFFIC COUNT 20102010 Households 3,269 15,015 44,710 Telegraph Road between Sybley and Gibraltar 21,8002010 Population 8,926 41,375 119,098 Telegraph Road at Pennsylvania 20,200
Dix Toledo between Hwy 75 and Telegraph 15,100
SOURCE: Retail Tenant Directory; ESRI Business Analyst; RCLCO
80,000 - 240,000
PREFERRED GLA
18,000 - 30,000
1,200 - 56,000
8,000 - 15,000
55,000
Furn. & Elec.E6-12962.00
Printed: 7/16/2012
BROWNSTOWN DDA

Exhibit V-15
RETAIL REQUIREMENTSHEALTH AND PERSONAL CARE
EXAMPLES OF HEALTH AND PERSONAL CARE TENANTS
TARGETED CUSTOMER BASE
TRAFFIC COUNTS (VPD)
HOUSHOLD/MILE RADIUS
POPULATION/ MILE RADIUS
EXISTING LOCATION NEARBY?
CVS Mid income, adult, senior 75’ frontage N/A 18,000 Yes
GNCHigh, mid income, senior
adult N/A N/A N/A Yes
Ulta High, mid income, teen, adult, female 40,000 100,000/5 N/A Yes
Vitamin World High, mid income, teen, adult, senior N/A N/A N/A No
Bath & Body WorksHigh, mid income, adult,
teen, female N/A N/A N/A Yes
Merle Norman Mid income, adult, female N/A N/A 20,000/3 No
SUBJECT SITE 1 mi 3 mi 5 mi TRAFFIC COUNT 20102010 Households 3,269 15,015 44,710 Telegraph Road between Sybley and Gibraltar 21,8002010 Population 8,926 41,375 119,098 Telegraph Road at Pennsylvania 20,200
Dix Toledo between Hwy 75 and Telegraph 15,100
SOURCE: Retail Tenant Directory; ESRI Business Analyst; RCLCO
1,700 - 8,000
400 - 1,000
PREFERRED GLA
10,880 - 19,000
900 - 1,400
10,000 - 10,000
1,000 - 1,200
Health & PersE6-12962.00
Printed: 7/16/2012
BROWNSTOWN DDA

Exhibit V-16
RETAIL REQUIREMENTSDEPARTMENT STORES
EXAMPLES OF DEPARTMENT STORE TENANTS
TARGETED CUSTOMER BASE
TRAFFIC COUNTS (VPD)
HOUSHOLD/MILE RADIUS
POPULATION/ MILE RADIUS
EXISTING LOCATION NEARBY?
Kohl’s* Prefer to purchase and own Macy’s N/A N/A N/A N/A YesRoss Low, mid income N/A N/A 100,000/5 No
Target Mid income, adult, female N/A N/A N/A Yes
SUBJECT SITE 1 mi 3 mi 5 mi TRAFFIC COUNT 20102010 Households 3,269 15,015 44,710 Telegraph Road between Sybley and Gibraltar 21,8002010 Population 8,926 41,375 119,098 Telegraph Road at Pennsylvania 20,200
Dix Toledo between Hwy 75 and Telegraph 15,100
SOURCE: Retail Tenant Directory; ESRI Business Analyst; RCLCO
N/A 100,000/5 to 8 YesN/A 45,000 - 240,000
25,000 - 30,187
123,000 - 174,000
PREFERRED GLA Families with median
incomes $50k+ 64,322 - 87,410
DepartmentE6-12962.00
Printed: 7/16/2012
BROWNSTOWN DDA

Exhibit V-17
RETAIL REQUIREMENTSCLOTHING STORE
EXAMPLES OF CLOTHING STORE TENANTS
TARGETED CUSTOMER BASE
TRAFFIC COUNTS (VPD)
HOUSHOLD/MILE RADIUS
POPULATION/ MILE RADIUS
EXISTING LOCATION NEARBY?
Chico’s High, mid income, adult, female, college-educated N/A N/A 150,000/5 No
Coldwater Creek Adult, female, N/A N/A N/A No
JusticeTeens, and pre-teens, middle to upper income N/A N/A N/A No
GAPHigh, mid income, adult,
children, and teen N/A N/A N/A No
DotsLow, mid income, adult,
teen, female N/A N/A 90,000/3 Yes
The LimitedHigh, mid income, adult,
teen, female N/A N/A N/A NoShoe Carnival Mid income N/A N/A 100,000/10 Yes
Rack Room Shoes Mid income, adult, female 20,000 30,000/5 100,000/5 No
SUBJECT SITE 1 mi 3 mi 5 mi TRAFFIC COUNT 20102010 Households 3,269 15,015 44,710 Telegraph Road between Sybley and Gibraltar 21,8002010 Population 8,926 41,375 119,098 Telegraph Road at Pennsylvania 20,200
Dix Toledo between Hwy 75 and Telegraph 15,100
SOURCE: Retail Tenant Directory; ESRI Business Analyst; RCLCO
4,000 - 5,000
1,000 - 5,0008,000 - 12,000
5,500 - 8,000
PREFERRED GLA
1,500 - 4,0004,000 - 6,000
1,500 - 4,500
2,750 - 35,000
ClothingE6-12962.00
Printed: 7/16/2012
BROWNSTOWN DDA
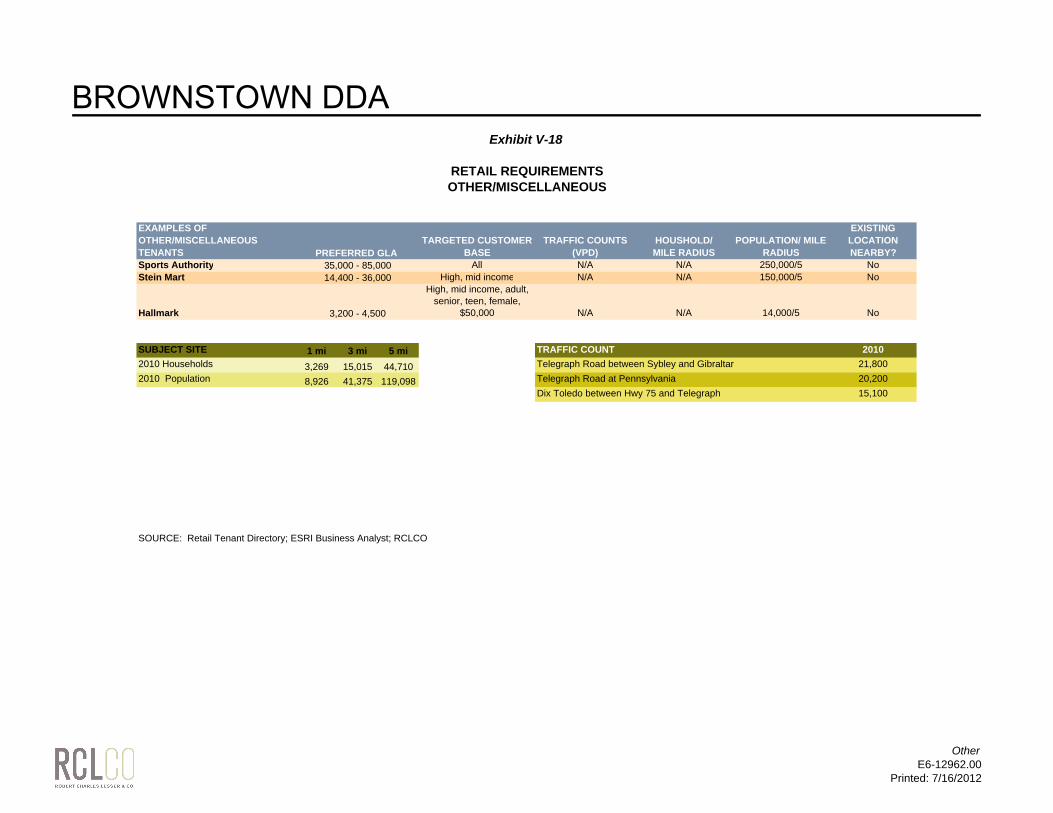
Exhibit V-18
RETAIL REQUIREMENTSOTHER/MISCELLANEOUS
EXAMPLES OF OTHER/MISCELLANEOUS TENANTS
TARGETED CUSTOMER BASE
TRAFFIC COUNTS (VPD)
HOUSHOLD/MILE RADIUS
POPULATION/ MILE RADIUS
EXISTING LOCATION NEARBY?
Sports Authority All N/A N/A 250,000/5 NoStein Mart High, mid income N/A N/A 150,000/5 No
Hallmark
High, mid income, adult, senior, teen, female,
$50,000 N/A N/A 14,000/5 No
SUBJECT SITE 1 mi 3 mi 5 mi TRAFFIC COUNT 20102010 Households 3,269 15,015 44,710 Telegraph Road between Sybley and Gibraltar 21,8002010 Population 8,926 41,375 119,098 Telegraph Road at Pennsylvania 20,200
Dix Toledo between Hwy 75 and Telegraph 15,100
SOURCE: Retail Tenant Directory; ESRI Business Analyst; RCLCO
PREFERRED GLA 35,000 - 85,00014,400 - 36,000
3,200 - 4,500
OtherE6-12962.00
Printed: 7/16/2012
BROWNSTOWN DDA

Exhibit V-19
RETAIL REQUIREMENTSLIMITED SERVICE RESTAURANTS
EXAMPLES OFLIMITED SERVICE RESTAURANT TENANTS
TARGETED CUSTOMER BASE
TRAFFIC COUNTS (VPD)
HOUSHOLD/MILE RADIUS
POPULATION/ MILE RADIUS
EXISTING LOCATION NEARBY
Einstein Noah Restaurant Group High, mid income adult 35,000 18,000/2 50,000/2 No
Five Guys N/A N/A N/A N/A Yes
McAlister's Deli High, mid income,
adult, female 20,000 25,000/3 50,000/3 No
Panera Bread Company High, mid income,
adult 20,000 N/A 50,000/3 Yes
Quiznos High, mid income adult,
child, teen N/A N/A 25,000/2 No
Yes
Tijuana Flats Mid income, adult, teen 35,000 N/A 10,000/1 No
ChipotleHigh, mid income, adult,
teen 25,000 N/A 30,000/2 No
Subject Site 1 mi 3 mi 5 mi TRAFFIC COUNT 20102010 Households 3,269 15,015 44,710 Telegraph Road between Sybley and Gibraltar 21,8002010 Population 8,926 41,375 119,098 Telegraph Road at Pennsylvania 20,200
Dix Toledo between Hwy 75 and Telegraph 15,100
SOURCE: Retail Tenant Directory; ESRI Business Analyst; RCLCO
1,200 - 2,800
PREFERRED GLA
Starbucks N/A N/A 25,000/2
2,000 - 2,500
Adult, senior, teen
1,500 - 2,500
650 - 4,000
1,200 - 1,600
4,200 - 5,000
1,200 - 1,600
100 - 2,000
LS RestaurantsE6-12962.00
Printed: 7/16/2012
BROWNSTOWN DDA

Exhibit V-20
RETAIL REQUIREMENTSFULL SERVICE RESTAURANTS
EXAMPLES OF FULL SERVICE RESTAURANT TENANTS
TARGETED CUSTOMER BASE
TRAFFIC COUNTS (VPD)
HOUSHOLD/MILE RADIUS
POPULATION/ MILE RADIUS
EXISTING LOCATION NEARBY?
Seasons 52The Capital GrilleBonefish Carrabas Flemings Outback
Ruby TuesdayHigh, mid income,
adult, senior 25,000 N/A 25,000 to 50,000 Yes
Stonewood High, mid income adult N/A 20,000/3 50,000/3 NoCharlie’s Fishbones Moonfish N/A N/A N/A N/A No
SUBJECT SITE 1 mi 3 mi 5 mi TRAFFIC COUNT 20102010 Households 3,269 15,015 44,710 Telegraph Road between Sybley and Gibraltar 21,8002010 Population 8,926 41,375 119,098 Telegraph Road at Pennsylvania 20,200
Dix Toledo between Hwy 75 and Telegraph 15,100
SOURCE: Retail Tenant Directory; ESRI Business Analyst; RCLCO
No30,000
PREFERRED GLA
N/A5,962 - 8,600 N/A 75,000 to 150,000/5
No
8,000 - 8,000
5,500 - 7,500High, mid income,
adult, senior 25,000 N/A 70,000/5
4,000 - 5,000
6,000 - 6,000
FS RestaurantsE6-12962.00
Printed: 7/16/2012
BROWNSTOWN DDA

Exhibit V-21
RETAIL DEMAND BASED ON CURRENT UNMET DEMAND BY SUPPLY OF RETAIL IN TRADE AREASBROWNSTOWN TOWNSHIP, MI
2010
3-MILE DOWNRIVER REGION
RETAIL STORE TYPE DEMAND SUPPLY LEAKAGE
SITE POTENTIAL CAPTURE RATE OF LEAKAGE
SITE POTENTIAL
SALES DEMAND SUPPLY LEAKAGE
SITE POTENTIAL CAPTURE RATE OF LEAKAGE
SITE POTENTAIL
CAPTURE OF DEMAND
SITE POTENTIAL
SALES
AGGREGATE SUBJECT SITE
POTENTIAL SALES (3-MI & DOWNRIVER)
REQUIRED SALES/
SF 1
SUBJECT SITE ESTIMATED
RETAIL DEMAND
AVG. STORE SIZE
SUBJECT SITE ESTIMATED
STORES SUPPORTABLE
TOTAL SQUARE
FEET POTENTIAL TENANT TYPES
Furniture Stores $6,091,401 $534,892 $5,556,510 50% $2,778,255 $39,968,427 $38,512,261 $1,456,166 75% 15% $6,868,964 $9,647,218 $210 45,939 50,000 1 50,000 Ashley Furniture, Menard (80-240K SF)Home Furnishings Stores $3,705,241 $345,787 $3,359,454 20% $671,891 $24,995,405 $7,192,365 $17,803,040 20% 5% $3,920,226 $4,592,117 $210 21,867 15,000 1 15,000 Pier One, Cost Plus
Electronics & Appliance Stores $12,970,277 $1,508,801 $11,461,476 10% $1,146,148 $86,766,255 $35,708,789 $51,057,466 15% 0% $7,658,620 $8,804,767 $300 29,349 2,500 1 2,500 Radio Shack (already at West/Allen), Local appliance store
Lawn & Garden Equipment and Supplies $883,601 $511,182 $372,419 10% $37,242 $6,063,169 $6,218,424 -$155,255 5% 0% $0 $37,242 $350 106 4,000 0 0 Home Depot/Lowe's in market
Grocery Stores $40,367,263 $73,228,148 -$32,860,885 33% $0 $284,112,153 $295,776,326 -$11,664,173 1% 0% $0 $0 $480 0 30,000 0 0 No current demand for additional standard grocerySpecialty Food Stores $4,970,655 $8,192,435 -$3,221,779 33% $0 $34,864,538 $21,467,867 $13,396,671 10% 10% $3,486,454 $3,486,454 $200 17,432 15,000 1 15,000 Trader Joes, Fresh Market, LocalBeer, Wine, and Liquor Stores $9,208,196 $5,586,022 $3,622,174 33% $1,195,318 $64,374,476 $24,482,684 $39,891,792 2% $797,836 $1,993,153 $400 4,983 2,000 2 4,000 Local
Health & Personal Care Stores $18,763,753 $16,088,623 $2,675,130 33% $882,793 $135,513,951 $138,189,081 -$2,675,130 5% 0% $0 $882,793 $300 2,943 2,000 1 2,000 GNC, Vitamin World, Bath & Body Works, Merle Norman$0
Clothing Stores $12,083,179 $2,164,237 $9,918,942 20% $1,983,788 $82,576,751 $88,039,531 -$5,462,780 20% 5% $4,401,977 $6,385,765 $230 27,764 2,500 10 25,000 Justice, Chicos, Gap, Dots, The LimitedShoe Stores $2,086,933 $336,175 $1,750,758 20% $350,152 $14,162,605 $6,056,813 $8,105,792 20% 5% $1,923,999 $2,274,151 $200 11,371 8,000 1 8,000 Shoe Carnival, Rack Room ShoesJewelry, Luggage, and Leather Goods Stores $1,799,553 $991,637 $807,916 20% $161,583 $12,062,530 $7,437,275 $4,625,255 20% 0% $925,051 $1,086,634 $300 3,622 1,500 2 3,000 Local
$0Sporting Goods, Hobby & Instrument Stores $2,924,307 $2,676,284 $248,023 20% $49,605 $19,514,233 $18,572,962 $941,271 15% 0% $141,191 $190,795 $200 954 35,000 0 0 Sports AuthorityBook, Periodical, and Music Stores $3,472,210 $106,574 $3,365,636 33% $1,110,660 $23,637,544 $18,218,213 $5,419,331 15% 0% $812,900 $1,923,559 $250 7,694 2,500 0 0 Local
$0Other General Merchandise Stores $41,418,116 $21,735,689 $19,682,427 20% $3,936,485 $289,594,469 $273,888,097 $15,706,372 5% 0% $785,319 $4,721,804 $150 31,479 30,000 1 30,000 Stein Mart
Florists $672,138 $283,141 $388,997 40% $155,599 $4,611,555 $3,390,532 $1,221,023 1% 0% $12,210 $167,809 $260 645 1,000 1 1,000 LocalOffice Supplies, Stationery, and Gift Stores $3,242,736 $1,558,096 $1,684,640 33% $555,931 $22,236,887 $18,021,924 $4,214,963 5% 0% $210,748 $766,679 $200 3,833 3,500 1 3,500 HallmarkOther Miscellaneous Store Retailers $3,259,879 $1,635,348 $1,624,531 20% $324,906 $22,724,639 $11,596,011 $11,128,628 5% 0% $556,431 $881,338 $200 4,407 2,000 2 4,000 UPS Store, Paint stores, Phone stores
Full-Service Restaurants $24,099,312 $22,826,065 $1,273,247 15% $190,987 $166,363,313 $130,309,633 $36,053,680 5% 2% $4,408,877 $4,599,864 $350 13,142 3,500 3 10,500 Carrabas, Bonefish, LocalLimited-Service Eating Places $29,218,719 $30,168,088 -$949,369 10% $0 $200,482,684 $238,205,720 -$37,723,036 2% 1% $2,382,057 $2,382,057 $300 7,940 1,500 4 6,000 Starbucks, Chipotle, Pei Wei, Five GuysDrinking Places (Alcoholic Beverages) $2,394,502 $417,998 $1,976,504 33% $652,246 $17,269,839 $19,674,226 -$2,404,387 5% 0% $0 $652,246 $250 2,609 2,000 1 2,000 Local
TOTAL $223,631,971 $190,895,222 $32,736,750 25% $16,183,588 $1,551,895,423 $1,400,958,734 $150,936,689 13% $39,292,859 $55,476,447 $267 238,081 10,675 33 181,500
1 Based upon ESRI data for total sales and number of stores for the PMA and estimated store sizes from the 2008 Retail Tenant Directory and Dollars & Cents of Shopping Centers/The SCORE 2008.
SOURCE: ESRI Business Analyst; RCLCO
Demand by SupplyE6-12962.00
Printed: 7/16/2012
BROWNSTOWN DDA
VI. CASE STUDIES
BROWNSTOWN DDA

Exhibit VI-1
SUMMARY OF INVESTMENT CRITERIA FROM STEINER & ASSOCIATES 1COMPARED TO BROWNSTOWN TOWN CENTER
MAY 2012
Land Criteria Brownstown Fit +/-
Located in a growing, top 100 metropolitan market Detroit is a top 100 metropolitan market, but it is shown as losing population -More than 250,000 people within the immediate trade area There are almost 350,000 people in the Downriver area +Size of land 60+ acres Site is 77 acres, but it includes a significant outparcel +/-Strong regional highway access The site has good access to I-75 +Strong local government support The site is owned by the local governament +
Absence of dominant regional retail competitionThe only mall in the Downriver area is not dominant and is agingSignificant big box competition in the area +/-
Other Steiner Projects (10 mile ring demographics)
Easton Gateway Downriver Area843,685 people 345,714 people103,373 households with income over $75K 36,270 households with incomes over $75K$74,812 = average household income $58,130 = average household income
Liberty Town Square432,887 people67,250 households with incomes over $75K$90,419 = average household income
Easton Town Center791,287 people107,457 households with income over $75K $59,027 = average household income
1 Based upon information contained on Steiner & Associates website May 21, 2012.
SOURCE: RCLCO; www.steiner.com
STEINERE6-12962.00
Printed: 7/16/2012
BROWNSTOWN DDA

Exhibit VI-2
COMMUNITY CASE STUDIESTOWN CENTER CASE STUDIES
MAY 2012
WEST VILLAGE COMMONS THE TOWN CENTER AT LEVIS COMMONS BAXTER VILLAGE WOODSTOCK DOWNTOWN
Location: Dearborn, MI Perrysburg, OH Fort Mill, SC (S. Charlotte) Woodstock, GA (N. Atlanta)
Owner/Developer: Burton-Katzman Hill Partners, Inc. Clear Springs Development Company Southwest Capital Companies, John Wieland Homes
Project Description: The project was concieved in the early 2000s by the City of Dearborn. The project has had a number of issues including
bankruptcy of developers, court cases, and unfinished buildings. The project came out of the ground right as the
recession started to impact Michigan.
The project is an open air lifestyle center located at the intersection of I-475 and S.R. 25. It is located in the Toledo
area.
The Village of Baxter is a mixed-use development located approximately 20 miles south of Charlotte, North Carolina. The
development includes attached and single-family for-sale housing, office space and a retail center.
This mixed-use community is directly adjacent to the historic Woodstock downtown. The development is a public-private parnership that came as a result of a 2002 LCI study and
Downtown Master plan that followed. The project creates a retail village directly across from the existing main street retail in addition to 340 housing units ranging from condominiums to
single-family detached product.
Project Size / Mix: The original project includded 48 condominiums, a retail center, and two mid-rise buildings for residential, office, or hotel. The
City built two parking garages. However, the entire area includes other retail, office, and conominiums which together
create a downtown feeling.
319,000 square feet of retail, office, entertainment uses, and restaurants. It is within a larger development. There is a for-rent
apartment complex within walking distance of the shopping center.
1,033 acres with 1,400 units, 250,000 square feet of commercial, 400 acres of open space
32 acres including 50,000 square feet of retail/restaurants, 10,000 square feet of office, 125 townhomes, 62 single-family detached units, 74 loft units, and a 3.5-acre park. An additional
project, Woodstock West, is planned for the future.
Locational Characteristics: The project is located in Dearborn along Michigan Avenue. It has good access to area highways.
The project is located off of I-475, and very close to I-75. It serves a wide trade area reaching up into Michigan.
The Village of Baxter is located in an emerging residential core southwest of Charlotte, and is located off of Interstate 77
The project is just east of I-575 at the intersection of Main Street and Arnold Mill Road.
Demographic Characteristics 339,384 population in 5-mile ring49,000 vehicles/day
58,509 population in 5-mile ring21,100 by project, 52,710 on I-475 vehicles/day
76,023 population in 5-mile ring29,200 vehicles/day
156,816 population in 5-mile ring13,140 vehicles/day
Village Center Description: The entire area features multiple retail along Michigan Avenue, as well as mid-rise buildings with office and residential uses.
The majority of the businesses are served by onstreet parking as well as the two new parking decks. Residential for the
project/area is either above the retail or behind the retail in stand alone buildings.
The Town Center is an open air lifestyle center. A central street was created off of S.R. 25 and is anchored by a movie theater. There is also a Hilton Garden Inn and a Hilton Event
Center at the rear of the project.
The Town Center includes various street-side offices, restaurants and retail shops. Retail and office space has been phased as the community has built-out. Buildings are two and three stories high with retail on the ground floor, and offices
above.
Woodstock Dowmtown is located in the heart of historic Woodstock. The development creates an "East Main Street" that runs parallel to the existing Main Street. The new retail
corridor consists of a central "median" of parkspace interspersed with stand alone restaurants. The new
development is separated by active railroad tracks. The anchor of the retail area is a 6-story building which frames the town center and buffers the single-family and townhome segments
from the commercial.
Page 1 of 4
Case StudiesE6-12962.00
Printed: 7/16/2012
BROWNSTOWN DDA

Exhibit VI-2
COMMUNITY CASE STUDIESTOWN CENTER CASE STUDIES
MAY 2012
WEST VILLAGE COMMONS THE TOWN CENTER AT LEVIS COMMONS BAXTER VILLAGE WOODSTOCK DOWNTOWN
Village Center Tenants:
Retail: Men's Wearhouse Arhaus Above Board GamesGame Stop AT&T Baxter Jewelers Alex N Sis (resale)
1800 Flowers Bam! Books a Million Bump Maternity Boutique Bridal Exchange BoutiqueLe Cigar Brighton Chocolate Boutique Queen's Folly
Picture Framing Chico's Grapevine Wine Shop Moor'sChristopher & Banks Monkey & Mermaids Too (gift shop)
CJ Banks Page 6 (clothes)Claire's
Coldwater CreekCrazy 8
Diamond and Gold JewelersFrancescas's Collections
Game StopGNC
GymboreeJ. Jill
Jos. A. BankJustice
Lane BryantLily'sLoft
New York & CompanyPortrait Innovations
Second SoleStride Rite
TalbotsThe Shoe Dept.
Verizon WirelessVivian Kate
Yankee Candle
Hair Care/Spa Merle Norman Pure M.D. Lasers & Cosmetics Baxter Barber Shop Jacqueline's BoutiqueNail shop Venetian Nail Spa Baxter Nails & Spa Main Street Nail Studio
CircaNorth SalonDolce Lusso Salon & Spa
Vibe Beauty Lounge
Entertainment: Yoga Rave Motion Pictures Champion TaekwondoCoco Pilates & Body Works
Fort Mill YMCAMiller Street Dance Academy
OM Yoga
Dining: Jimmy Johns Bar Louie Beef O Bradys Family Pub Freight Kitchen & TapStarbucks Biaggi's Ristorante Italiano Cloud Nine Pure Taqueria
bd mongolian Blue Pacific Grill Cupcrazed Canyon Burger CompanyPanera JB's Sarnie Shoppe Fish Market Fire Stone Wood Fired Pizza
Kabuki Sushi Max & Erma's Fratellis Ristorante J ChristophersBuffalo Wild Wings Poco Piatti Liu Lius Asian Fusion Mexican Cantina
Schakolad Chocolate Factory Sayagos Ice Cream & Café Cookies by DesignStarbucks Coffee Six Pence Pub
Yogurt Vi Starbucks Coffee
Page 2 of 4
Case StudiesE6-12962.00
Printed: 7/16/2012
BROWNSTOWN DDA

Exhibit VI-2
COMMUNITY CASE STUDIESTOWN CENTER CASE STUDIES
MAY 2012
WEST VILLAGE COMMONS THE TOWN CENTER AT LEVIS COMMONS BAXTER VILLAGE WOODSTOCK DOWNTOWN
Medical/Health: Seen Vision Care OnSight Health Care 3D Dreams (pre-natal ultrasound)Advanced Chiropractic
Baxter Village Health CenterBentley Chiropractic
Carolina Smile CenterCoxon Lifestyle Management Clinic
Epps, Thomas W OrthodontistFort Mill Dermatology
Hall Chiropractic CenterHealthy Hearing for Life
In Focus EyecareMetta Counseling Services
Piedmont Imagin Center at BaxterPiedmont Internal Medicince at Baxter
Piedmont Urgent CarePrescott Family Dentistry
Rock Hill SurgicalSmiles by Design
Services/ Office: 3 financial or mortgage service firm 11 financial or mortgage services firms 1 service firm1 real estate firm 5 real estate firms 1 mortgage service firm
4 law firms 9 law firms3 other firms (cable, management) 13 other service firms (dry cleaners, marketing)
Civic/Education: Fort Mill Library (30,000 SF)Field of Dreams Nurture and Education Center
New Point Learning CenterOrchard Park Elementary School
Playroom Academy of Music
Village Center Space (sf) per Housing Unit:
n/a 179
Residential Product: Horizon Lofts are across from the site at Michigan and Howard Streets and Gateway Lofts are on the southwest corner of
Michigan Avenue and Military Street. The Horizon Lofts are located above retail.
The center is located near townhomes and apartments. No residential product in the town center. At peak, were achieving approximately 150 sales per year, and achieving
premiums of 10-20% over the market. 70% of homes are alley-loaded. Average community price is $265,000
The residential component of Woodstcok downtown consists of condominiums, townhomes, and single-family detached product.
The condominium flats are located in one large building which fronts on the retail vilage and offers ground level retail. The
townhome and single-family residences are located behind the condominium structure.
For-Sale: No actively selling product. There are condominiums/townshomes behind the retail. There appear to
be approximatley 100 units.\ One is currently for sale for $210,000 and is 1,650 SF ($127/SF)
None SFD: $190k - $500k Attached: sold out
SFD, TH, and condominiums
For-Rent: The Horizon Lofts range from 1,025 to 1,600 SF and are approximatley $1.20/SF. The Gateway Lofts are 1,100 to
1,500 SF and are approximatley $1,00/SF
Preston Gardens is located within walking distance of the project developed by Edwards Communities. There are 332
townhomes and garden apartments. Rents range from $770 to $1,750 per month. In 2006, it cost $63.75/SF to build.
None None
Buyer/Renter Profile: The target audience is young single and couple professionals N/A 35% Singles / Couples, 53% Families, 11% ENs, 30% Transferees
Young singles and couples from their mid-20s to mid-30s for condominiums. Families and Empty Nesters are primary buyers
of town home and SFD product.
Page 3 of 4
Case StudiesE6-12962.00
Printed: 7/16/2012
BROWNSTOWN DDA

Exhibit VI-2
COMMUNITY CASE STUDIESTOWN CENTER CASE STUDIES
MAY 2012
WEST VILLAGE COMMONS THE TOWN CENTER AT LEVIS COMMONS BAXTER VILLAGE WOODSTOCK DOWNTOWN
Lessons Learned: Be careful of utilizing public dollars to pay for infrastructure and items like parking decks. The timing needs to be correct to
make the deal work.
N/A The community's open space has been a key selling feature, as well as the on-site school and planned community activities. Civic buildings (such as the library), are excellent amenities,
help anchor the community, and help achieve a sense of place. The 'classic' architecture of the homes has been very popular, and marketing efforts have eliminated the words 'traditional' as buyers typically associate this with conventional product. Due to the lower price, the townhomes and smaller-lot product has
sold the fastest.
The residential component of the development is what drove the retail portion. Now that the market has gone down
significantly, both the retail and the residential components are struggling. Attention to detail on planning elements such as
streetscape design, open space layout, and lot orientation were critical to create a sense of place. Eventually, Woodstock Downtown is hoping to create a critical mass of high-end,
neighborhood scale retail which is differentiated from the strip retail along I-92.
Key Considerations The site is well-located, and well-designed. It is likely that the
area will thrive once the current economic downturn has past. The problems with the site do not appear to be in the execution,
but rather the timing.
N/A Provide civic uses, as they are excellent amenities, help anchor the community, and create a sense of place.
Destination-oriented uses, such as restaurants, the community library and YMCA, are very important to the success of the
center.
The LCI program included approximately $1 million for streetscape improvements along Main Street. The Downtown Master Plan was a form based document that outlined specific design guidelines for future development which helped create a
strong sense of place and density. Hedgewood, the original developer, assembled 11 parcels early in the process which
was a key factor in their early success.
Site Plan:
Page 4 of 4
Case StudiesE6-12962.00
Printed: 7/16/2012
BROWNSTOWN DDA
VII. FINANCIAL
BROWNSTOWN DDA

Exhibit VII-1
FINANCIAL ANALYSIS - OPTION 1BROWNSTOWN TOWN CENTER
JULY 2012
ProgramDensity
(FAR/Lot Size)Total
SF/Units 2012 2013 2014 2015 2016 2017 2018 2019 2020 2021 2022 2023Park/Open Space 8Single-Family Detached 3.1 Units/Acre 81 81Apartments 20 Units/Acre 250 150 100Retail 0.25 185,000 100,000 85,000Office 0.25 50,000 25,000 25,000
AcresDensity
(FAR/Lot Size)Total Acres 2012 2013 2014 2015 2016 2017 2018 2019 2020 2021 2022 2023
Park/Open Space 8 8Single-Family Detached 3.1 Units/Acre 26 0 0 0 26 0 0 0 0 0 0 0 0Apartments 20 Units/Acre 13 0 8 0 0 0 5 0 0 0 0 0 0Retail 0.25 17 0 0 9 0 8 0 0 0 0 0 0 0Office 0.25 3 0 0 0 0 2 0 2 0 0 0 0 0Total 66.8 8 8 9 26 9 5 2 0 0 0 0 0
Revenues AssumptionsTotal
Revenues 2012 2013 2014 2015 2016 2017 2018 2019 2020 2021 2022 2023Revenue Escalation 3% 100% 103% 106% 109% 112% 115% 118% 121% 124% 127% 130% 133%Single-Family Detached $38,000 $989,256 $0 $0 $0 $989,256 $0 $0 $0 $0 $0 $0 $0 $0Apartments $100,000 $1,250,000 $0 $750,000 $0 $0 $0 $500,000 $0 $0 $0 $0 $0 $0Retail $146,000 $2,480,257 $0 $0 $1,340,680 $0 $1,139,578 $0 $0 $0 $0 $0 $0 $0Office $100,000 $327,955 $0 $0 $0 $0 $163,977 $0 $163,977 $0 $0 $0 $0 $0Total Revenues $5,047,468 $0 $750,000 $1,340,680 $989,256 $1,303,555 $500,000 $163,977 $0 $0 $0 $0 $0Total Revenues Escalated $5,500,385 $0 $772,500 $1,421,120 $1,078,289 $1,459,982 $575,000 $193,493 $0 $0 $0 $0 $0
Costs Assumptions Total Cost 2012 2013 2014 2015 2016 2017 2018 2019 2020 2021 2022 2023Cost Escalation 3% 100% 103% 106% 109% 112% 115% 118% 121% 124% 127% 130% 133%Mass Grading $0On-site Utilities $0Off-site Utility Improvement $200,000 $200,000Landscaping $0On-site Roads $640 /linear ft $768,000 $768,000Off-site Road Improvements $400,000 $400,000Amenities $0Consulting Fees 0% of direct $0 $0 $0 $0 $0 $0 $0 $0 $0 $0 $0 $0Marketing 2% of revenue $100,949 $15,000 $26,814 $19,785 $26,071 $10,000 $3,280 $0 $0 $0 $0 $0Other Soft Costs 0% of direct $0 $0 $0 $0 $0 $0 $0 $0 $0 $0 $0 $0Overhead 0% of direct $0 $0 $0 $0 $0 $0 $0 $0 $0 $0 $0 $0Contingency 0% of direct $0 $0 $0 $0 $0 $0 $0 $0 $0 $0 $0 $0Total Costs $1,468,949 $0 $1,383,000 $26,814 $19,785 $26,071 $10,000 $3,280 $0 $0 $0 $0 $0Total Costs Escalated $1,519,048 $0 $1,424,490 $28,422 $21,566 $29,200 $11,500 $3,870 $0 $0 $0 $0 $0
Net Cash Flow $3,578,519 $0 -$633,000 $1,313,866 $969,471 $1,277,484 $490,000 $160,698 $0 $0 $0 $0 $0Cumulative Cash Flow $0 -$633,000 $680,866 $1,650,337 $2,927,821 $3,417,821 $3,578,519 $3,578,519 $3,578,519 $3,578,519 $3,578,519 $3,578,519
SOURCE: RCLCO
Option 1E6-12962.00
Printed: 7/16/2012
BROWNSTOWN DDA
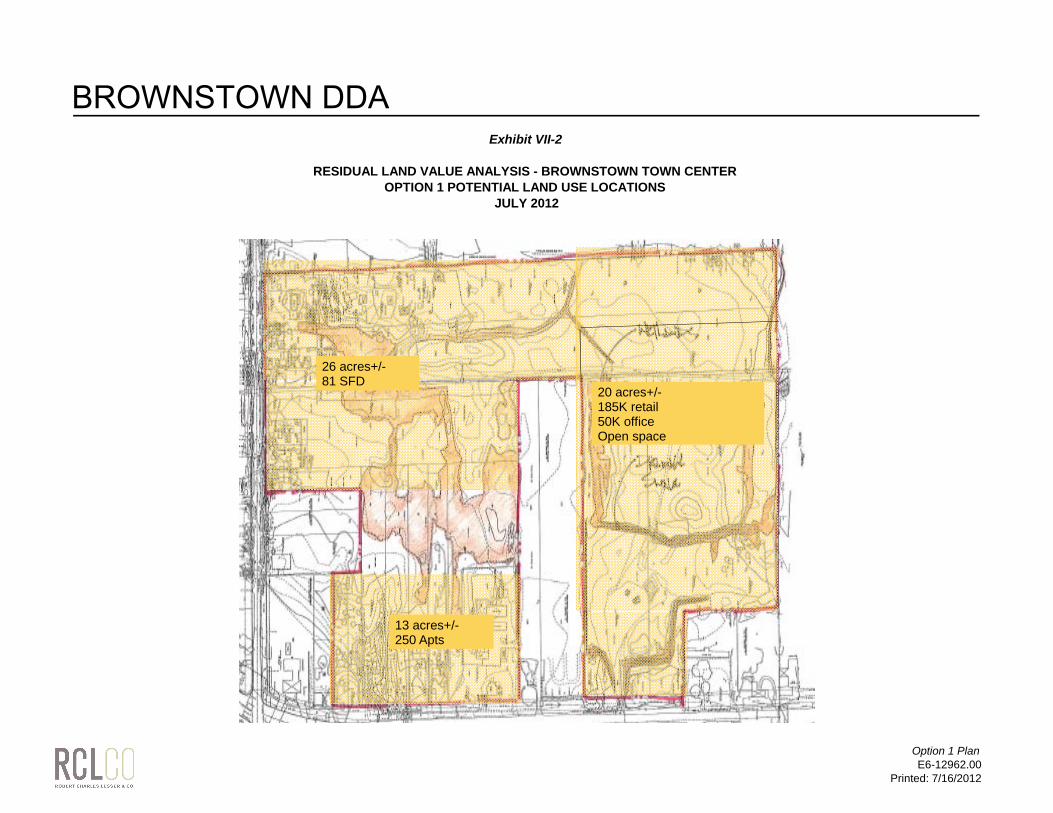
Exhibit VII-2
RESIDUAL LAND VALUE ANALYSIS - BROWNSTOWN TOWN CENTER OPTION 1 POTENTIAL LAND USE LOCATIONS
JULY 2012
20 acres+/-185K retail50K officeOpen space
26 acres+/-81 SFD
13 acres+/-250 Apts
Option 1 PlanE6-12962.00
Printed: 7/16/2012
BROWNSTOWN DDA

Exhibit VII-3
FINANCIAL ANALYIS - OPTION 2 BROWNSTOWN TOWN CENTER
JULY 2012
ProgramDensity
(FAR/Lot Size)Total
SF/Units 2012 2013 2014 2015 2016 2017 2018 2019 2020 2021 2022 2023Park/Open SpaceSingle-Family Detached 3.1 Units/Acre 116 116Apartments 20 Units/Acre 250 150 100Retail 0.25 150,000 150,000Office 0.25 50,000 25,000 25,000
AcresDensity
(FAR/Lot Size)Total Acres 2012 2013 2014 2015 2016 2017 2018 2019 2020 2021 2022 2023
Park/Open Space 0Single-Family Detached 3.1 Units/Acre 37 0 0 0 37 0 0 0 0 0 0 0 0Apartments 20 Units/Acre 13 0 8 0 0 0 5 0 0 0 0 0 0Retail 0.25 14 0 0 14 0 0 0 0 0 0 0 0 0Office 0.25 3 0 0 0 0 2 0 2 0 0 0 0 0Total 66.8 0 8 14 37 2 5 2 0 0 0 0 0
Revenues AssumptionsTotal
Revenues 2012 2013 2014 2015 2016 2017 2018 2019 2020 2021 2022 2023Revenue Escalation 3% 3% 100% 103% 106% 109% 112% 115% 118% 121% 124% 127% 130% 133%Single-Family Detached $38,000 $1,416,713 $0 $0 $0 $1,416,713 $0 $0 $0 $0 $0 $0 $0 $0Apartments $100,000 $1,250,000 $0 $750,000 $0 $0 $0 $500,000 $0 $0 $0 $0 $0 $0Retail $146,000 $2,011,019 $0 $0 $2,011,019 $0 $0 $0 $0 $0 $0 $0 $0 $0Office $100,000 $327,955 $0 $0 $0 $0 $163,977 $0 $163,977 $0 $0 $0 $0 $0Total Revenues $5,005,687 $0 $750,000 $2,011,019 $1,416,713 $163,977 $500,000 $163,977 $0 $0 $0 $0 $0
$5,400,545 $0 $772,500 $2,131,680 $1,544,217 $183,655 $575,000 $193,493 $0 $0 $0 $0 $0
Costs Assumptions Total Cost 2012 2013 2014 2015 2016 2017 2018 2019 2020 2021 2022 2023Cost Escalation 3% 3% 100% 103% 106% 109% 112% 115% 118% 121% 124% 127% 130% 133%Mass Grading $0On-site Utilities $0Off-site Utility Improvement $200,000 $200,000Landscaping $0On-site Roads $640 /linear ft $0Off-site Road Improvements $400,000 $400,000Amenities $0Consulting Fees 0% of direct $0 $0 $0 $0 $0 $0 $0 $0 $0 $0 $0 $0Marketing 2% of revenue $100,114 $15,000 $40,220 $28,334 $3,280 $10,000 $3,280 $0 $0 $0 $0 $0Other Soft Costs 0% of direct $0 $0 $0 $0 $0 $0 $0 $0 $0 $0 $0 $0Overhead 0% of direct $0 $0 $0 $0 $0 $0 $0 $0 $0 $0 $0 $0Contingency 0% of direct $0 $0 $0 $0 $0 $0 $0 $0 $0 $0 $0 $0Total Costs $700,114 $0 $615,000 $40,220 $28,334 $3,280 $10,000 $3,280 $0 $0 $0 $0 $0Total Costs Escalated $726,011 $0 $633,450 $42,634 $30,884 $3,673 $11,500 $3,870 $0 $0 $0 $0 $0
Net Cash Flow $4,305,573 $0 $135,000 $1,970,799 $1,388,378 $160,698 $490,000 $160,698 $0 $0 $0 $0 $0Cumulative Cash Flow $0 $135,000 $2,105,799 $3,494,177 $3,654,875 $4,144,875 $4,305,573 $4,305,573 $4,305,573 $4,305,573 $4,305,573 $4,305,573
SOURCE: RCLCO
Option 2E6-12962.00
Printed: 7/16/2012
BROWNSTOWN DDA

Exhibit VII-4
RESIDUAL LAND VALUE ANALYSIS - BROWNSTOWN TOWN CENTER OPTION 2 POTENTIAL LAND USE LOCATIONS
JULY 2012
37 acres+/-116 SFD
13 acres+/-250 Apts
14 acres+/-150K retail
3 acres+/-50,000 SF office
Option 2 PlanE6-12962.00
Printed: 7/16/2012
BROWNSTOWN DDA
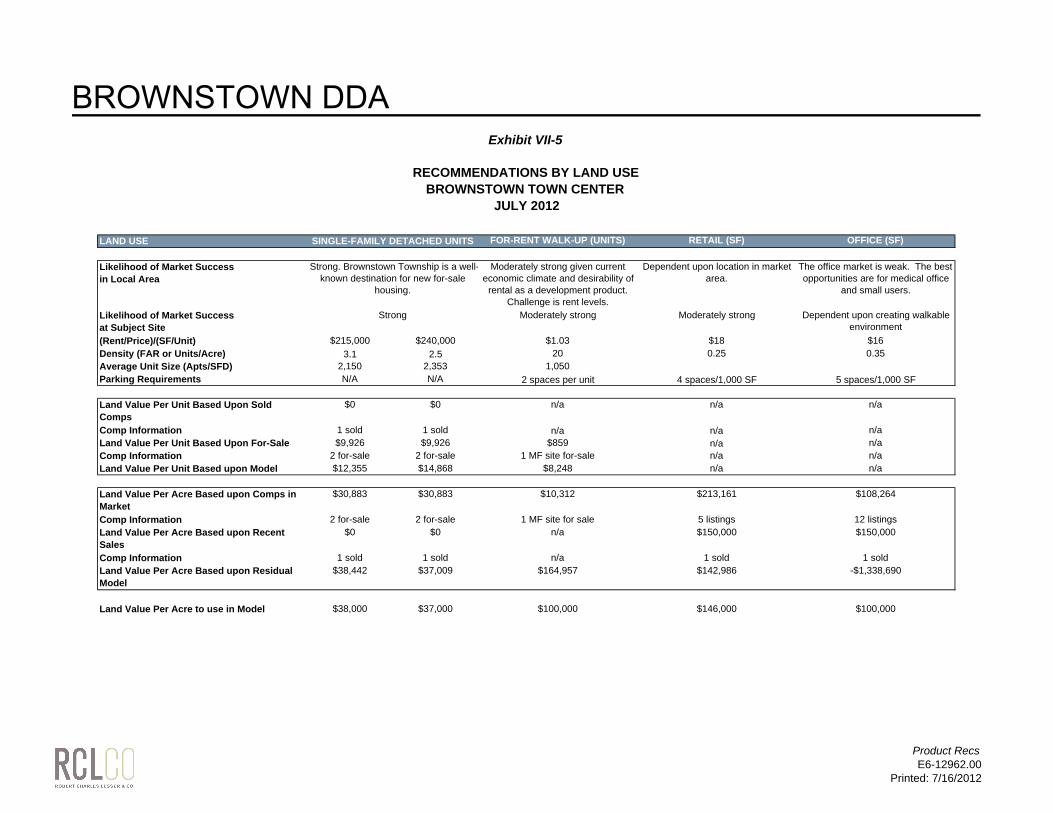
Exhibit VII-5
RECOMMENDATIONS BY LAND USE BROWNSTOWN TOWN CENTER
JULY 2012
LAND USE FOR-RENT WALK-UP (UNITS) RETAIL (SF) OFFICE (SF)
Likelihood of Market Success in Local Area
Moderately strong given current economic climate and desirability of
rental as a development product. Challenge is rent levels.
Dependent upon location in market area.
The office market is weak. The best opportunities are for medical office
and small users.
Likelihood of Market Success at Subject Site
Moderately strong Moderately strong Dependent upon creating walkable environment
(Rent/Price)/(SF/Unit) $215,000 $240,000 $1.03 $18 $16Density (FAR or Units/Acre) 3.1 2.5 20 0.25 0.35Average Unit Size (Apts/SFD) 2,150 2,353 1,050Parking Requirements N/A N/A 2 spaces per unit 4 spaces/1,000 SF 5 spaces/1,000 SF
Land Value Per Unit Based Upon Sold Comps
$0 $0 n/a n/a n/a
Comp Information 1 sold 1 sold n/a n/a n/aLand Value Per Unit Based Upon For-Sale $9,926 $9,926 $859 n/a n/aComp Information 2 for-sale 2 for-sale 1 MF site for-sale n/a n/aLand Value Per Unit Based upon Model $12,355 $14,868 $8,248 n/a n/a
Land Value Per Acre Based upon Comps in Market
$30,883 $30,883 $10,312 $213,161 $108,264
Comp Information 2 for-sale 2 for-sale 1 MF site for sale 5 listings 12 listingsLand Value Per Acre Based upon Recent Sales
$0 $0 n/a $150,000 $150,000
Comp Information 1 sold 1 sold n/a 1 sold 1 soldLand Value Per Acre Based upon Residual Model
$38,442 $37,009 $164,957 $142,986 -$1,338,690
Land Value Per Acre to use in Model $38,000 $37,000 $100,000 $146,000 $100,000
SINGLE-FAMILY DETACHED UNITS
Strong. Brownstown Township is a well-known destination for new for-sale
housing.
Strong
Product RecsE6-12962.00
Printed: 7/16/2012
BROWNSTOWN DDA

Exhibit VII-6
RESIDUAL LAND VALUE ANALYSIS - BROWNSTOWN TOWN CENTER SINGLE-FAMILY DETACHED
JULY 2012
CATEGORY 60' Wide 70' Wide
Average Unit Size 2,150 2,353Average Base Price $215,000 $240,000Average Amount Spent on Upgrades/Premiums 5% $10,750 $12,000Average Home Price $225,750 $252,000
Less: Direct Construction (per SF) $55 per SF $118,250 $129,412Upgrade Costs 80% of upgrade price $8,600 $9,600Soft Costs At 10%of base price $21,500 $24,000
Total Costs: $148,350 $163,012
Less: Closing Costs 6% of value $13,545 $15,120Less: Developer Profit (Yield) 10% of base price $21,500 $24,000
Total Developed Lot Value $42,355 $49,868Developed Lot as a % of Home Value 20% 21%
Cost to Develop Lot $500 per linear foot $30,000 $35,000
Total Raw Lot Value $12,355 $14,868Raw Lot as a % of Developed Lot 41% 42%Value per Acre $38,442 $37,009
SOURCE: RCLCO
SFDE6-12962.00
Printed: 7/16/2012
BROWNSTOWN DDA

Exhibit VII-7
RESIDUAL LAND VALUE ANALYSIS - BROWNSTOWN TOWN CENTER GARDEN-STYLE APARTMENTS
JULY 2012
CATEGORY TOTAL
Density (du/ac) 20.0Number of Units 20Total Buildable Acre(s) 1.0
Wtd. AverageAverage Unit Size 1,050Average Monthly Rent/Unit $1,082Average Rent/Unit/Square Foot $1.03
Scheduled Rent $259,560Scheduled Rent/Unit $12,978Vacancy Allowance 5.0% ($12,978)
Total Rent Collected $246,582Other Income 3.0% $7,787
Effective Gross Income $254,369Effective Gross Income/Unit $12,718
Operating Expenses/Unit 35.0% ($4,451)Total Operating Expenses ($89,029)
Net Operating Income (NOI) $165,340Net Operating Income/Unit (NOI) $8,267
Capitalization Rate 7.00%Capitalizated Market Value $2,361,996
Less: Direct Construction (per SF) $70 per SF $73,500 ($1,470,000)Parking $3500 per space $5,250 ($105,000)Soft Costs At 15%of direct $11,025 ($220,500)
Total Costs: $89,775 ($1,795,500)
Less: Closing Costs 2% of value ($47,240)Less: Developer Profit (Yield) 15% of value ($354,299)
Total Land Value $164,957Land Value Per Unit $8,248Value Per Acre $164,957
SOURCE: RCLCO
Apt - GardenE6-12962.00
Printed: 7/16/2012
BROWNSTOWN DDA

Exhibit VII-8
RESIDUAL LAND VALUE ANALYSIS - BROWNSTOWN TOWN CENTER RETAIL
JULY 2012
CATEGORY INPUTS TOTAL
Number of Buildings 1Total Buildable Acres 1.0
Floor Area Ratio 0.25 FARLeasable Building Area (SF) 10,890Average Rent for Retail $18.00Parking Spaces Required (per 1,000) 4.0
Scheduled Monthly Rent $16,335Scheduled Annual Rent $196,020Less: Vacancy Allowance 5.0% ($9,801)
Total Rent Collected $186,219Other Income, Parking $0Effective Gross Income $186,219Less: Monthly Operating Expenses per SF 30%Less: Annual Operating Expenses ($55,866)
Net Operating Income (NOI) $130,353
Capitalization Rate 7.00%Capitalizated Market Value $1,862,190
Less: Direct Construction (per SF) $74 per SF ($805,860)Parking Costs $3500 per space ($152,460)Soft Costs At 35%of direct ($335,412) TI Allowance $10 per SF ($108,900)
Total Costs: ($1,402,632)
Less: Closing Costs 2% of value ($37,244)Less: Developer Profit (Yield) 15% of value ($279,329)
Total Land Value $142,986Land Value Per Acre $142,986
SOURCE: RCLCO
RetailE6-12962.00
Printed: 7/16/2012
BROWNSTOWN DDA

Exhibit VII-9
RESIDUAL LAND VALUE ANALYSIS - BROWNSTOWN TOWN CENTER OFFICE
JULY 2012
CATEGORY INPUTS TOTAL
Number of Buildings 1Total Buildable Acres 1.0
Floor Area Ratio 0.35 FARLeasable Building Area (SF) 15,246Average Rent for Office $16.00Parking Spaces Required (per 1,000) 5.0
Scheduled Monthly Rent $20,328Scheduled Annual Rent $243,936Less: Vacancy Allowance 5.0% ($12,197)
Total Rent Collected $231,739Other Income, Parking $0Effective Gross Income $231,739Less: Monthly Operating Expenses per SF 35%Less: Annual Operating Expenses ($81,109)
Net Operating Income (NOI) $150,630
Capitalization Rate 10.00%Capitalizated Market Value $1,506,305
Less: Direct Construction (per SF) $90 per SF ($1,372,140)Parking Costs $3500 per space ($266,805)Soft Costs At 30%of direct ($491,684)TI Allowance $35 per SF ($533,610)
Total Costs: ($2,664,239)
Less: Closing Costs 2% of value ($30,126)Less: Developer Profit (Yield) 10% of value ($150,630)
Total Land Value ($1,338,690)Land Value Per Acre ($1,338,690)
SOURCE: RCLCO
Office NewE6-12962.00
Printed: 7/16/2012
BROWNSTOWN DDA

POWERPOINT PRESENTATION: MARKET STUDY
BROWNSTOWN DDA

Brownstown Town Center Market StudyInitial Presentation
Brownstown Downtown Development Authority | June 6, 2012

BACKGROUNDReport Preparation
Melina Duggal, Senior PrincipalJoyce Chao, AssociateOrlando, FL (407) 515-6592
Background The Downtown Development Authority (DDA) hired RCLCO tocomplete a market study and financial analysis as the firstt i i l t ti t t th t ill f ll tli thstep in an implementation strategy that will fully outline the
market potential for the town center that would make itattractive to tenants and potential developers, if there is, infact, a market for a town center at the subject site.
This document is the summary of the market analysis.
The next step is for RCLCO to complete the financial analysisf th t ti l d l tof the potential development.
E6-12962.001

OBJECTIVESObjectives Update the market study completed in 2010 looking at the
future potential of each of the land uses
Determine the timing of the different land uses within theDetermine the timing of the different land uses within the town center
Recommend the appropriate mix of land uses and total units/square feetunits/square feet
Understand the future buyers, renters, tenant types, shoppers, and businesses that would likely locate and visit the town centerthe town center
Create a market study that would be appropriate in the inclusion of an offering package to potential development partnerspartners
E6-12962.002
AGENDA
Conclusions & RecommendationsEconomic & Demographic SummaryCommercial AnalysisResidential AnalysisCase Studies
E6-12962.003

Conclusions and Recommendations
E6-12962.004

SITE (IN RED) IS CLOSE TO THE CENTER OF THE DOWNRIVER AREA
Downriver
Brownstown
Woodhaven
E6-12962.005

THE SITE IS LOCATED AT THE INTERSECTION OF TELEGRAPH, WEST, & DIX-TOLEDO ROADS
E6-12962.006

THE SITE IS LOCATED NEAR CONCENTRATIONS OF NEW RESIDENTIAL
KeyResidential Construction
E6-12962.007
Residential ConstructionRetail Concentration

THE SITE IS WELL-SUITED FOR A FUTURE DEVELOPMENT
StrengthsGood access from West Road to I-
75 as well as strong access on
ChallengesWhile the area had strong historical
growth, and likely strong future growth,75 as well as strong access on TelegraphNew intersection at Telegraph and
Dix-Toledo Roads
growth, and likely strong future growth, secondary sources suggest stable and/or declining populationSite is located west of I-75, away from
current retail and office concentrationsClose to employment, shopping, and other servicesLocated in one of the developing
sections of the Downriver area
current retail and office concentrationsHard to create a “sense of place” with
outparcels adjacent to the propertyWhile the demand fundamentals aresections of the Downriver area
Relatively strong incomes and historical population growthDevelopment activity in the area
While the demand fundamentals are strong for the project, it may be challenging to find a developer for the project – the development community is just starting to begin to recover andp y
appears to be picking back up againNice tree cover on portions of the
property
is just starting to begin to recover and are looking for projects in A+ locations
E6-12962.008
property
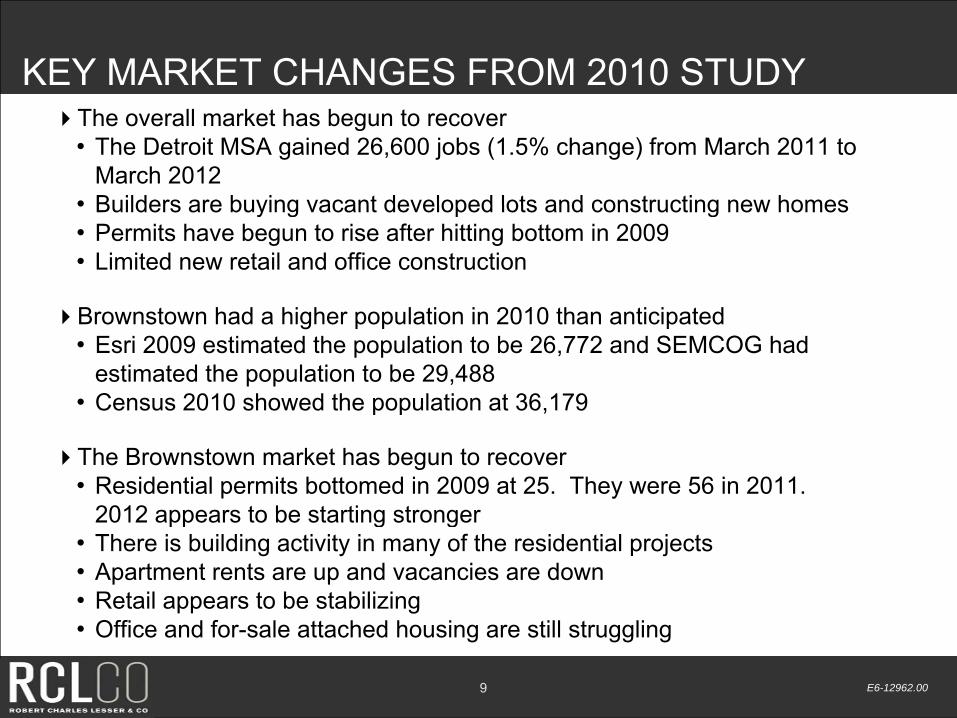
KEY MARKET CHANGES FROM 2010 STUDYThe overall market has begun to recover
• The Detroit MSA gained 26,600 jobs (1.5% change) from March 2011 to March 2012
• Builders are buying vacant developed lots and constructing new homes• Builders are buying vacant developed lots and constructing new homes• Permits have begun to rise after hitting bottom in 2009• Limited new retail and office construction
B t h d hi h l ti i 2010 th ti i t dBrownstown had a higher population in 2010 than anticipated• Esri 2009 estimated the population to be 26,772 and SEMCOG had
estimated the population to be 29,488• Census 2010 showed the population at 36,179Census 2010 showed the population at 36,179
The Brownstown market has begun to recover• Residential permits bottomed in 2009 at 25. They were 56 in 2011.
2012 appears to be starting stronger2012 appears to be starting stronger• There is building activity in many of the residential projects• Apartment rents are up and vacancies are down• Retail appears to be stabilizing
E6-12962.009
• Office and for-sale attached housing are still struggling

SUMMARY OF CONCLUSIONSTOWN CENTER POTENTIAL
The site has the potential for a town center• Traffic counts are not as high as the concentration of retail along
Allen and West Road, but similar to other town center locations• Already retail and residential in the area (Kroger shopping center
d T l h)and center across Telegraph)• Key anchors would be critical to create center
‒ Large anchor retail tenant (furniture store, home furnishing store, specialty food store)C ll ti f t t‒ Collection of restaurants
‒ Civic space (park, library, etc.)‒ Connection to Ice Box‒ YMCA (partner with Henry Ford Health System)
It will be challenging given the economic climate to create a vertically mixed-use town-center• Rents are not high enough to justify this type of development
There is the potential to create a modified town center, with a horizontal mix of uses that links the different parts of the project together via walking paths, theming, and signage
Without the civic components and/or public spaces, it is a retail strip center in a modified format
E6-12962.0010
Demand exists, the challenge is to find developer willing to take risk

KEY CONSIDERATIONSTOWN CENTER
The development should be characterized by civic/other anchors, superior place making, enhanced internal connectivity, pedestrian access to parks and commercial uses and strong transportationcommercial uses, and strong transportation accessibility, and visibility
It is key to create and deliver an experience that the market values and that generates premiums
Integration of civic uses will create the distinction of a public center, rather than a private development, contributing to a true “town center”
Civic or other anchor components should beCivic or other anchor components should be developed in conjunction with or prior to private development to form the “core” or “beach” of the development
Site should be master-planned in anticipation of futureSite should be master-planned in anticipation of future uses to create a well-integrated development at build-out
E6-12962.0011
SOURCE: RCLCO, Urban Land Institute's Ten Principles For Developing Successful Town Centers
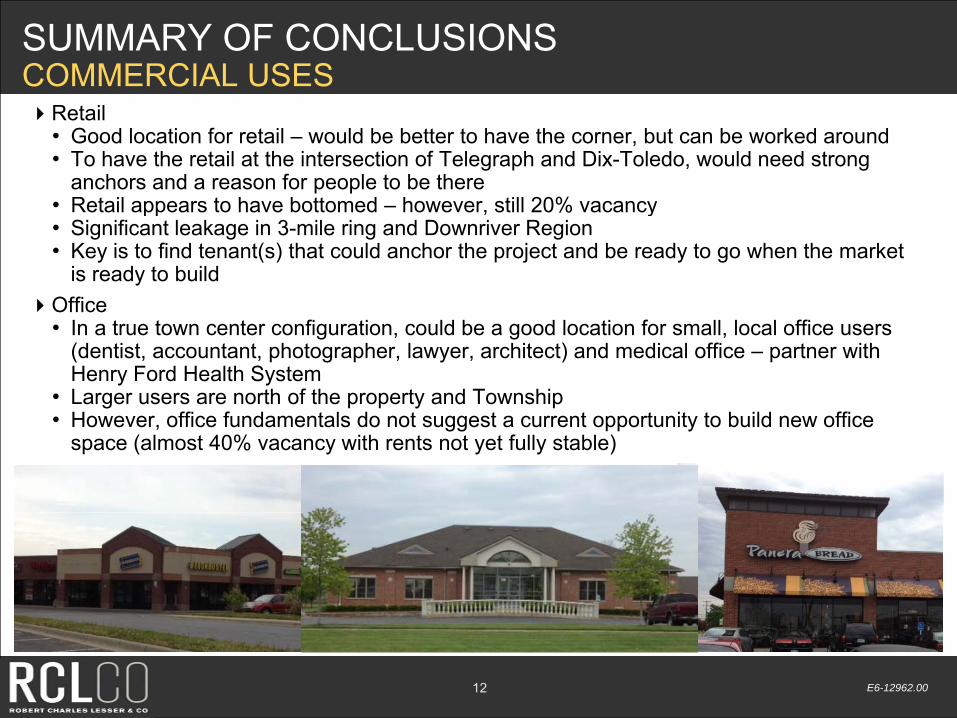
SUMMARY OF CONCLUSIONSCOMMERCIAL USESRetail
• Good location for retail – would be better to have the corner, but can be worked around• To have the retail at the intersection of Telegraph and Dix-Toledo, would need strong
anchors and a reason for people to be there• Retail appears to have bottomed however still 20% vacancy• Retail appears to have bottomed – however, still 20% vacancy• Significant leakage in 3-mile ring and Downriver Region• Key is to find tenant(s) that could anchor the project and be ready to go when the market
is ready to buildOfficeOffice
• In a true town center configuration, could be a good location for small, local office users (dentist, accountant, photographer, lawyer, architect) and medical office – partner with Henry Ford Health System
• Larger users are north of the property and Township• However, office fundamentals do not suggest a current opportunity to build new office
space (almost 40% vacancy with rents not yet fully stable)
E6-12962.0012

SUMMARY OF CONCLUSIONSRESIDENTIAL USESFor-Rent
• Apartment market is strong• Very little building in the last few years• Rents right on the cusp of making financial sense to build new
T t fi ti d lk bilit ld b t d f t• Town center configuration and walkability would be strong draws for renters• New apartments at Stratford Place Apartments – would need to be timed and positioned
appropriatelyFor-Sale
• Throughout SE Michigan builders are purchasing vacant developed lots• Throughout SE Michigan, builders are purchasing vacant developed lots• There is building activity in many of the projects in Brownstown• Vacant developed lot (VDL) inventory needs to somewhat clear before builders will develop
new lots – cost of VDL is below cost to develop lots• Inventory in Brownstown should clear by 2015/2016y y
E6-12962.0013

OPTION ONE FOR SITE PLANLARGER TOWN CENTER
ConsiderationsUtilize largest, open space to
create the commercial coreN d t h t t• Need to have strong entrance off of Dix-Toledo and strong anchors
• Assumes a large commercial center23 Acres
23 Acres60 SFD center
• Format TBD, but likely a modified strip center
SFD to buffer the SFD to the west as well as create
23 Acres185K Retail50K Office
60 SFD
west as well as create premiums with the wetlands
Garden-style apartment complex along Telegraph Road
Walking linkages between land12 Acres250 Apts Walking linkages between land
usesWould allow for future
expansion into RV storage area as a mix of uses
p
E6-12962.0014
as a mix of uses
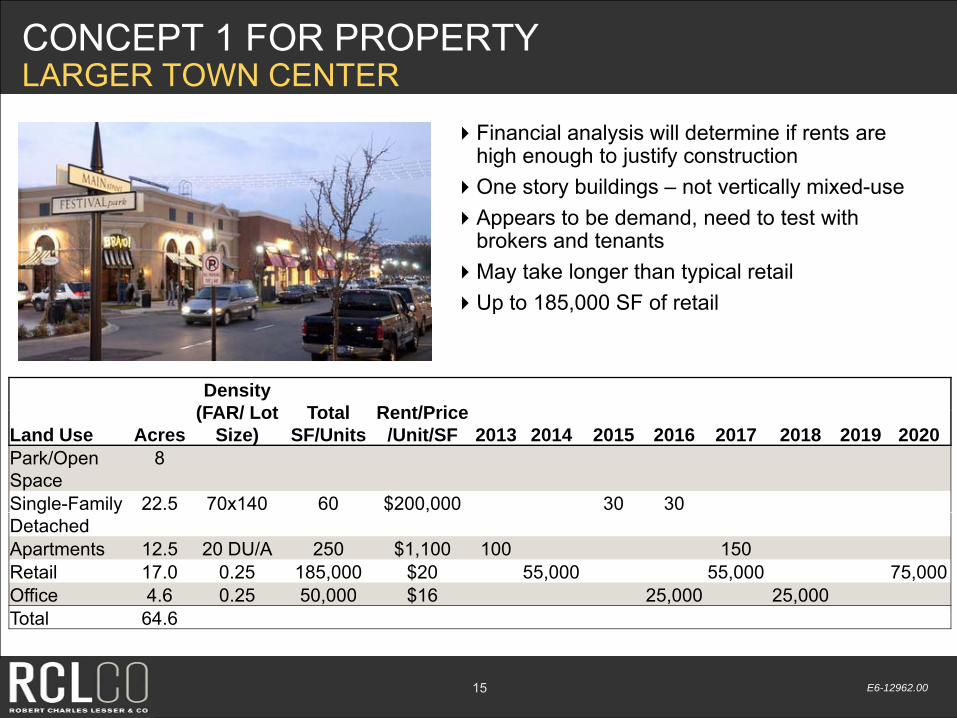
CONCEPT 1 FOR PROPERTYLARGER TOWN CENTER
Financial analysis will determine if rents are high enough to justify construction
One story buildings – not vertically mixed-useAppears to be demand, need to test with
brokers and tenantsMay take longer than typical retailUp to 185,000 SF of retailUp to 185,000 SF of retail
Density (FAR/ Lot Total Rent/Price
Land Use Acres(FAR/ Lot
Size)Total
SF/UnitsRent/Price
/Unit/SF 2013 2014 2015 2016 2017 2018 2019 2020Park/Open Space
8
Single-Family 22.5 70x140 60 $200,000 30 30g yDetachedApartments 12.5 20 DU/A 250 $1,100 100 150Retail 17.0 0.25 185,000 $20 55,000 55,000 75,000Office 4.6 0.25 50,000 $16 25,000 25,000Total 64 6
E6-12962.0015
Total 64.6

CONCEPT 2 FOR PROPERTYMORE RESIDENTIAL, LESS MIX OF USES
ConsiderationsRetail would be along Telegraph
Road Does not create the opportunityDoes not create the opportunity
to develop a larger town center with amenities and public spaces
SFD to occupy the largest12 Acres SFD to occupy the largest portion of the property and create a community of scale –would be good to have it walkable to the retail
33 Acres71 SFD
12 Acres250 Apts
Garden-style apartment complex along West Road taking advantage of the wetlands
14 Acres150K Retail
Walking linkages between land uses
Would allow for future expansion into RV storage area
E6-12962.0016
gas a mix of uses
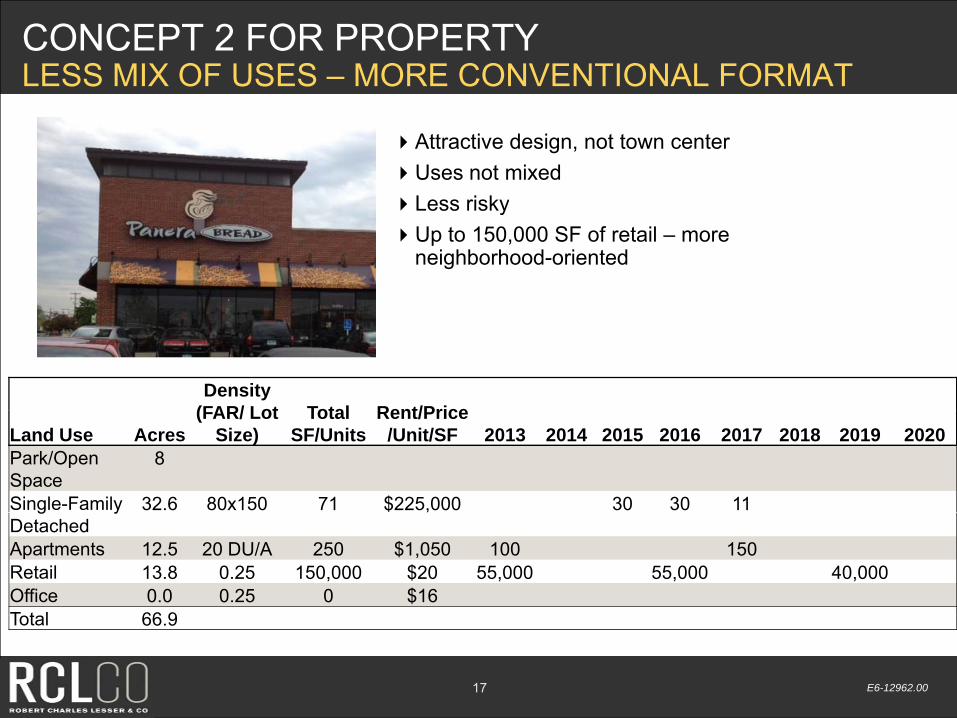
CONCEPT 2 FOR PROPERTYLESS MIX OF USES – MORE CONVENTIONAL FORMAT
Attractive design, not town centerUses not mixedLess riskyLess riskyUp to 150,000 SF of retail – more
neighborhood-oriented
Density (FAR/ Lot Total Rent/Price
Land Use Acres(FAR/ Lot
Size)Total
SF/UnitsRent/Price
/Unit/SF 2013 2014 2015 2016 2017 2018 2019 2020Park/Open Space
8
Single-Family 32.6 80x150 71 $225,000 30 30 11g yDetachedApartments 12.5 20 DU/A 250 $1,050 100 150Retail 13.8 0.25 150,000 $20 55,000 55,000 40,000Office 0.0 0.25 0 $16T t l 66 9
E6-12962.0017
Total 66.9

POTENTIAL RETAILERSNEED TO BE TESTED
American Eagle OutfittersAshley Furniture HomestoreThe Children’s PlaceClaire’sCost PlusCost PlusDavid’s BridalGapGNCHH GreggJewelersJusticeChristian BookstoreMerle NormanMotherhood maternityMotherhood maternityPier 1 ImportsSpecialty GrocerStein MartVitamin WorldChipotleFive GuysOlive GardenPei WeiRed Lobster
E6-12962.0018
Red LobsterStarbucks

Economic and Demographic Summary
E6-12962.0019

ECONOMIC AND DEMOGRAPHIC ANALYSISSTRENGTHS
Potential growth area in the Downriver portion of DetroitAuto industry appears to have stabilized and right sizedBrownstown has higher incomes, on average, th th D ithan the Downriver areaStable household base
CHALLENGESS d d t j tiSecondary data sources are projecting a stable or declining populationDensity of housing not currently as strong west of the siteDownriver region is not perceived as a high income area in Detroit
E6-12962.0020
SOURCE: RCLCO

BROWNSTOWN HAD STRONG POPULATION GROWTH BETWEEN 2000 AND 2010
E6-12962.0021
SOURCE: Esri

BROWNSTOWN INCLUDES AND IS NEAR POCKETS OF HIGHER INCOME
E6-12962.0022
SOURCE: Esri

MORE PEOPLE LEAVING WAYNE COUNTY THAN MOVING IN
E6-12962.0023
SOURCE: IRS; US Census; RCLCO

BROWNSTOWN RESIDENTS/EMPLOYEES GENERALLY LIVE/WORK IN THE DOWNRIVER AREA
Where Brownstown Residents Work Where Brownstown Employees Live
E6-12962.0024
SOURCE: US Census; MapPoint

Commercial Analysis
E6-12962.0025

RETAILSTRENGTHS CHALLENGES
Significant leakage both locally and regionally Population may not be high enough to attract certain retail tenants
Rents have begun increasing and vacancy rates have Overall vacancy in the Downriver submarket still atRents have begun increasing and vacancy rates have declined over the last few years
Overall vacancy in the Downriver submarket still at roughly 15% for neighborhood centers and 24% for community centers
Good accessibility from West and Telegraph Roads, as well as new intersection at Telegraph and Dix Toledo
The best retail location is perceived to be at West and Allen Roads, east of I-75 – land still available at thewell as new intersection at Telegraph and Dix Toledo Allen Roads, east of I 75 land still available at the Lowe’s/Kohls shopping center
No retail in a town center format in the Downriver area Retail development is still challenging, even in A+ locations
E6-12962.0026
25000 U.S. 19 Neighborhood CenterPanera Bread on West and Allen Kroger Center (across from site)

SIGNIFICANT RETAIL LEAKAGE IN BROWNSTOWN AND DOWNRIVER REGION
Miscellaneous Store Retailers
Nonstore Retailers
Food Services & Drinking Places
Clothing and Clothing Accessories Stores
Sporting Goods, Hobby, Book, and Music Stores
General Merchandise Stores
Food & Beverage Stores
Health & Personal Care Stores
Gasoline Stations
C ot g a d C ot g ccesso es Sto es
Furniture & Home Furnishings Stores
Electronics & Appliance Stores
Bldg Materials, Garden Equip. & Supply Stores
Food & Beverage Stores
-$100,000 $0 $100,000 $200,000 $300,000
Motor Vehicle & Parts Dealers
Furniture & Home Furnishings Stores
Downriver Brownstown
E6-12962.0027
SOURCE: Esri; RCLCO
Downriver Brownstown

RENTAL RATES INCREASING, VACANCY RATES DECREASING
35%
40%
$14
$16
25%
30%
$10
$12
15%
20%
$6
$8
5%
10%
$2
$4
0%$0 2000 2001 2002 2003 2004 2005 2006 2007 2008 2009 2010 2011
Community Ctr Rental rate Neighborhood Ctr Rental RateCommunity Ctr Vacancy Neighborhood Ctr Vacancy
E6-12962.0028
SOURCE: Reis, Inc.; RCLCO
Community Ctr Vacancy Neighborhood Ctr Vacancy

MAJOR RETAIL CONCENTRATED ALONG EUREKA ROAD AND WEST/ALLEN
14
MAP KEY DEVELOPMENT SIZE (SF)
VACANCY RATE
1 West-Tel Plaza 36,200 14%2 Brownstown Shopping Plaza 115,902 10%
8 910 111213
1415
3 Unnamed Center 12,000 11%4 The Shops at Tanglewood 13,974 21%5 Trafford Square 95,000 1%6 Whispering Woods Plaza 143,798 6%7 Unnamed Center 1949 King Rd 10,000 0%
28
12
3
5
7
7 Unnamed Center 1949 King Rd 10,000 0%8 Unnamed Center 23620 Eureka 26,500 10%9 Burlington Square 223,123 28%10 26211 Eureka Rd 15,000 8%11 9025 Eureka 13,572 0%3029
4
5
6
12 Galleria Plaza 58,476 14%13 Dix Eureka Shopping Plaza 120,000 0%14 Southtowne Crossing Shopping
Center188,416 N/A
15 Southgate Shopping Center 356,760 64%6 15 Southgate Shopping Center 356,760 64%28 Southland Mall 915,197 12%29 Woodhaven Village Square N/A N/A30 Woodhaven Commons 285,440 8%
SUM WGT. AVG.Overall 3 645 076 17%
E6-12962.0029
Overall 3,645,076 17%

SUBJECT SITE MEETS THE REQUIREMENTS OF MANY RETAILERSEXAMPLES OF FURNITURE/ELECTRONICS TENANTS
PREFERRED GLA
TARGETED CUSTOMER BASE
POPULATION/ MILE RADIUS
EXISTING LOCATION NEARBY?
Cost Plus 18,000 - 30,000 High, mid income, adult senior
100,000/5 Noadult, senior
Pier 1 1,200 - 56,000 All Dependant on store size
Yes
Radioshack 8,000 - 15,000 High income, adult, college-educated
90,000/5 Yescollege educated
Ashley Furniture 55,000 High, mid income, adult
N/A No
Menard 80,000 - 240,000 Mid income, adult 100,000/10 NoHigh, mid income,
GNC 900 - 1,400 senior adult N/A Yes
Vitamin World 1,000 - 1,200High, mid income, teen, adult, senior N/A No
Bath & Body Works 1 700 - 8 000High, mid income, adult teen female N/A YesBath & Body Works 1,700 8,000 adult, teen, female N/A Yes
Merle Norman 400 - 1,000Mid income, adult,
female 20,000/3 NoSubject Site 1 mi 3 mi 5 mi2010 Households 3 269 15 015 44 710
E6-12962.0030
2010 Households 3,269 15,015 44,7102010 Population 8,926 41,375 119,098

SUBJECT SITE MEETS THE REQUIREMENTS OF MANY LIMITED SERVICE RESTAURANTSEXAMPLES OFLIMITED SERVICE RESTAURANT TENANTS
PREFERRED GLA
TARGETED CUSTOMER BASE
POPULATION/ MILE RADIUS
EXISTING LOCATION NEARBY
Einstein Noah 1,500 - 2,500 High, mid income 50,000/2 NoRestaurant Group adult Five Guys 1,200 - 1,600 N/A N/A Yes
McAlister's Deli 650 - 4,000 High, mid income, adult, female
50,000/3 Noadult, female
Panera Bread Company 4,200 - 5,000 High, mid income, adult
50,000/3 Yes
Quiznos 1,200 - 1,600 High, mid income adult, child, teen
25,000/2 No
St b k 100 2 000 Ad lt i t 25 000/2Starbucks 100 - 2,000 Adult, senior, teen 25,000/2 Yes
Tijuana Flats 2,000 - 2,500 Mid income, adult, teen
10,000/1 No
Chipotle 1,200 - 2,800 High, mid income, 30,000/2 NoChipotle 1,200 2,800 High, mid income, adult, teen
30,000/2 No
Subject Site 1 mi 3 mi 5 mi2010 Households 3,269 15,015 44,7102010 Population 8 926 41 375 119 098
E6-12962.0031
2010 Population 8,926 41,375 119,098
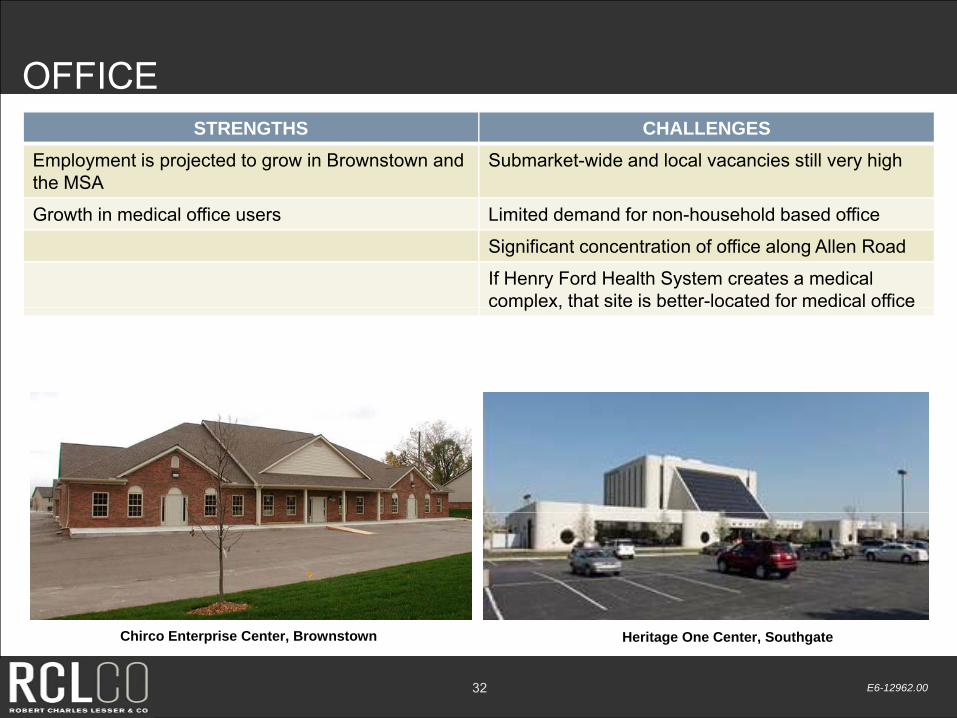
OFFICESTRENGTHS CHALLENGES
Employment is projected to grow in Brownstown and the MSA
Submarket-wide and local vacancies still very high
Growth in medical office users Limited demand for non-household based office
Significant concentration of office along Allen Road
If Henry Ford Health System creates a medicalcomplex, that site is better-located for medical officep ,
E6-12962.0032
Chirco Enterprise Center, Brownstown Heritage One Center, Southgate
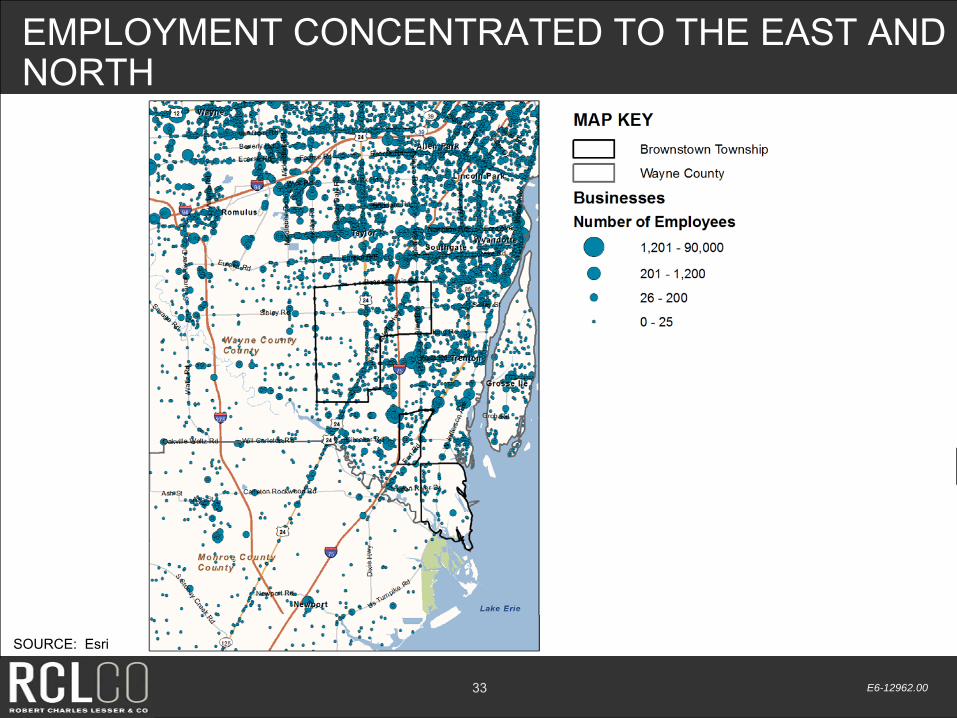
EMPLOYMENT CONCENTRATED TO THE EAST AND NORTH
E6-12962.0033
SOURCE: Esri

OFFICE VACANCY STILL VERY HIGH WITH RENTAL RATES BOTTOMING OUT
PROJECTED
E6-12962.0034
SOURCE: Reis

VACANCY FOR LOCAL OFFICE STILL HIGH AT 43%
8
9
MAP KEY PROJECT NAME
VACANCY RATE SIZE (SF)
RENT/ SF
1 Professional Office 44% 14,030 $17.12
2Horizon Business Center W t 54% 76 600 $13 46
5 6
72 West 54% 76,600 $13.46
3 Horizon East 18% 42,147 $14.96
4Anderson Business Center 26% 33,000 $6.73
2 3
1314
5 Superior Place 48% 41,000 $14.50
6 Heritage Office Bldg 33% 89,000 $14.91
7 Allen Park Office Plaza 29% 15,000 $19.82
8 Telegraph Office 15% 50,000 $16.00
111
12
g p , $
9 Park Place Office Center 13% 50,000 $15.00
10 Chirco Enterprise Center 100% 7,600 $14.00
11 19249 Allen Road 15% 6,790 $17.50
12 Ti b Rid 100% 6 605 $10 004
10
12 Timber Ridge 100% 6,605 $10.00
13 Pennsylvania Place 10% 10,420 $13.00
14 Southgate Towers 65% 184,396 $13.50
WGT. AVG. SUM AVG.
E6-12962.0035
SOURCE: ReisOverall 43% 626,588 $14.32

Residential Analysis
E6-12962.0036

FOR-SALE RESIDENTIALSTRENGTHS CHALLENGES
Some projects that have been stalled are beginning to see increased interest from buyers
Current inventory may take several years to burn off
New home sales in Brownstown increased in 2011 for the first time since 2004
Deeply discounted vacant developed lots makes it unattractive for developers to develop new lots
Builders are actively building new residential product again
Hard to get financing to develop residential projects
Attached for-sale market still very weak
E6-12962.0037
Sunset Pointe TownhomesBradbury Park Trenton Grande

MEDIAN HOME VALUESBETWEEN $100,000 AND $200,000
E6-12962.0038
SOURCE: Esri
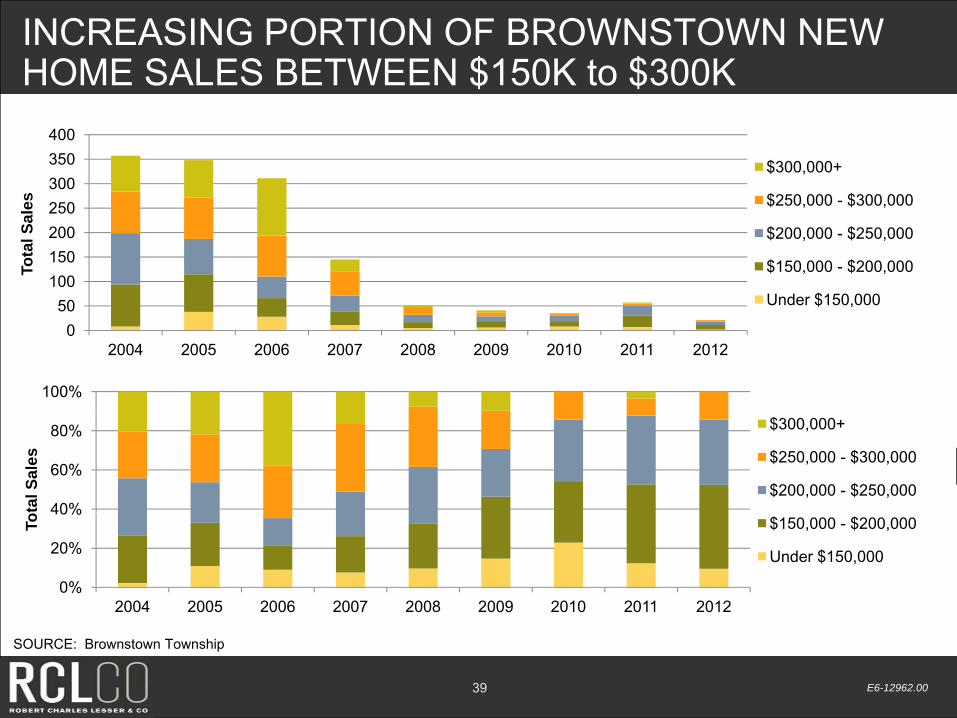
INCREASING PORTION OF BROWNSTOWN NEW HOME SALES BETWEEN $150K to $300K
250300350400
es
$300,000+
$250,000 - $300,000
50100150200250
Tota
l Sal
e $250,000 $300,000
$200,000 - $250,000
$150,000 - $200,000
Under $150,000
100%
050
2004 2005 2006 2007 2008 2009 2010 2011 2012
40%
60%
80%
tal S
ales
$300,000+
$250,000 - $300,000
$200,000 - $250,000
0%
20%
40%
2004 2005 2006 2007 2008 2009 2010 2011 2012
To $150,000 - $200,000
Under $150,000
E6-12962.0039
SOURCE: Brownstown Township

BROWNSTOWN HAS A LARGER SHARE OF SALES OF HIGHER PRICED HOMES
80%
90%Brownstown Home Sales as a % of Downriver Sales
60%
70%
80%
Under $75,000
$75K $100K
30%
40%
50%$75K-$100K
$100K-$200K
10%
20%
30%$200K-$300K
0%2Q
20093Q
20094Q
20091Q
20102Q
20103Q
20104Q
20101Q
20112Q
20113Q
20114Q
20111Q
2012
E6-12962.0040
SOURCE: Real Estate One
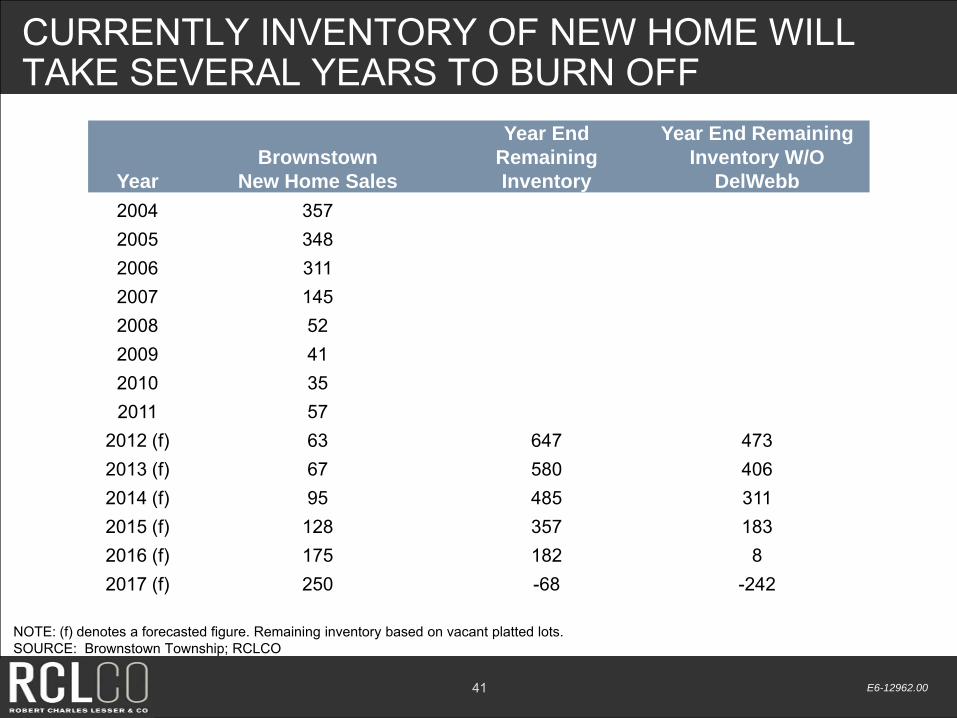
CURRENTLY INVENTORY OF NEW HOME WILL TAKE SEVERAL YEARS TO BURN OFF
YearBrownstown
New Home Sales
Year End Remaining Inventory
Year End Remaining Inventory W/O
DelWebb2004 3572004 3572005 3482006 3112007 1452008 522009 412010 352011 572011 57
2012 (f) 63 647 4732013 (f) 67 580 4062014 (f) 95 485 3112015 (f) 128 357 1832016 (f) 175 182 82017 (f) 250 -68 -242
E6-12962.0041
NOTE: (f) denotes a forecasted figure. Remaining inventory based on vacant platted lots.SOURCE: Brownstown Township; RCLCO

AVERAGE PRICE FOR NEW SINGLE-FAMILY HOMES SLIGHTLY ABOVE $200,000
MAP KEY PROJECT NAME
AVG.PRICE
AVG.$/SF
SINGLE-FAMILY DETACHED
1 CELTIC FARMS $182,400 $822 WHEATLAND ESTATES $264,950 $123
4
$ , $3 KENSINGTON ESTATES $280,400 $1134 FOX CREEK $212,400 $1065 BRIDGEWATER $222,740 $1086 FALKIRK $205,400 $937 BRYCE COMMONS $224,450 $948 TIMBERCREEK $202 500 $90
35 8
710
3
58 TIMBERCREEK $202,500 $90
9BRADBURY PARK –PRESERVES $187,400 $92
10 PRAIRIE CREEK $168,400 $8711 ROLLING RIDGE N/A N/A12 OAKWOOD FARMS N/A N/A13 CYRSTAL CROSSING N/A N/A
4
12
69
11
1
2 13 CYRSTAL CROSSING N/A N/A14 HURON POINTE $229,999 $89
ATTACHED/CONDOMINIUMS
1BRADBURY PARK - THE COVES $150,000 $94
12
1314
,2 PINE ARBOR CONDOMINIUMS $130,000 $943 PARKLANE TOWNHOMES $75,000 $554 TRENTON GRANDE $36,500 $355 DOVES POINTE $87,500 $55
E6-12962.0042
SOURCE: Brownstown Township; Real Estate One; RCLCO

FOR-RENT RESIDENTIALSTRENGTHS CHALLENGES
No new product in the market since 2006 Most of the market is rent at below $1.00/SF
Rents have been trending upwards since 2010 Not clear how deep the market is for higher-end product – if Stratford Place develops new apartments, will fulfill demand for a year or two
The submarket experience positive absorption in 2010 and 2011
Submarket-wide vacancy is at equilibrium,newer, higher quality projects are almost completely occupied
E6-12962.0043
Chelsea Park South Pointe Apartments

HIGHER PERCENTAGE OF RENTERS NEAR THE SUBJECT SITE
E6-12962.0044
SOURCE: Esri
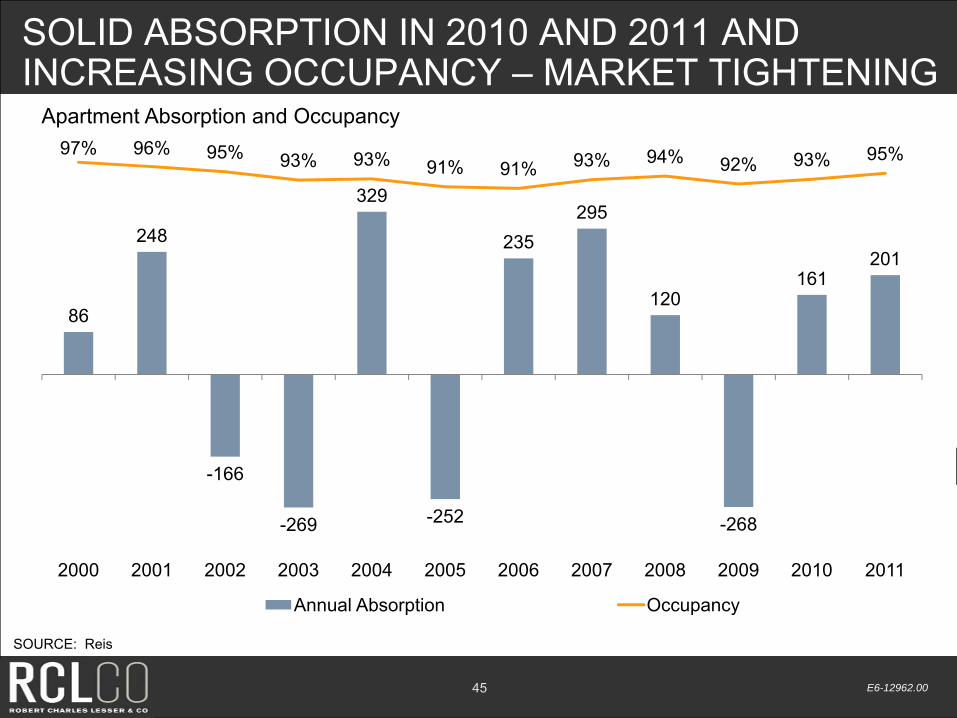
SOLID ABSORPTION IN 2010 AND 2011 AND INCREASING OCCUPANCY – MARKET TIGHTENING
329
97% 96% 95% 93% 93% 91% 91% 93% 94% 92% 93% 95%
Apartment Absorption and Occupancy
248 235295
120161
201
86
-166
252-269 -252 -268
2000 2001 2002 2003 2004 2005 2006 2007 2008 2009 2010 2011
Annual Absorption Occupancy
E6-12962.0045
SOURCE: Reis

BEST PERFORMING APARTMENTS IN THE AREA ARE CLOSE TO THE SUBJECT SITE
3
MAP PROJECT/ AVG. AVG. AVG.KEY ADDRESS SIZE (SF) RENT $/SF
1 STRATFORD 1 051 $1 070 $1 024
5
1 STRATFORD 1,051 $1,070 $1.02 PLACE APARTMENTS
2 SOUTH POINTE 846 $737 $0.87 APARTMENTS
2
3 CHELSEA PARK 1,114 $930 $0.83
4 VILLAGE GREEN 987 $924 $0.94 MAPLE VILLAGE
1
5 VILLAGE GREEN 994 $891 $0.90 OF SOUTHGATE
1
E6-12962.0046
SOURCE: Rent.com; RCLCO

Case Studies
E6-12962.0047
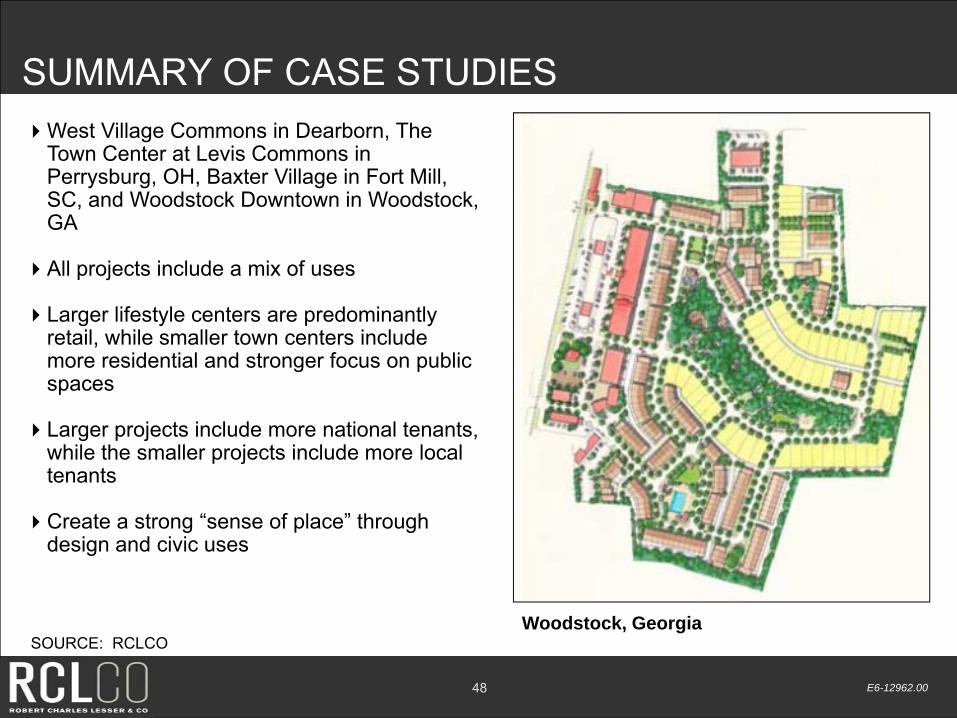
SUMMARY OF CASE STUDIESWest Village Commons in Dearborn, The
Town Center at Levis Commons in Perrysburg, OH, Baxter Village in Fort Mill, SC, and Woodstock Downtown in Woodstock,SC, and Woodstock Downtown in Woodstock, GA
All projects include a mix of uses
L lif t l t d i tlLarger lifestyle centers are predominantly retail, while smaller town centers include more residential and stronger focus on public spaces
Larger projects include more national tenants, while the smaller projects include more local tenants
Create a strong “sense of place” through design and civic uses
E6-12962.0048
SOURCE: RCLCOWoodstock, Georgia

SUWANEE TOWN CENTERSUWANEE, GEORGIAOpened in 2003, Suwanee Town center consists of 63 total
acres including a 10-acre park and 40-acre privately developed traditional neighborhood
Includes 1 000 seat terraced amphitheatre The annualIncludes 1,000 seat terraced amphitheatre. The annual “Suwanee Day” celebrations draws 30,000 people and the rock concert series regularly draws crowds of 15,000
Although a conventional retail (neighborhood center) is less g ( g )than two miles away, Suwanee Town Center has been able to compete effectively and receive twice the tax revenue of the conventional retail center
The civic components have been critical in the success of theThe civic components have been critical in the success of the development. The town center has played an integral role in the community as a central gathering place.
The park and amphitheatre were built by the city before the e pa a d a p ea e e e bu by e c y be o e eother property was developed to enhance the overall property value and create “the beach”
Full time program director responsible for programming of the t t
E6-12962.0049
town centerSOURCE: City Of Suwanee
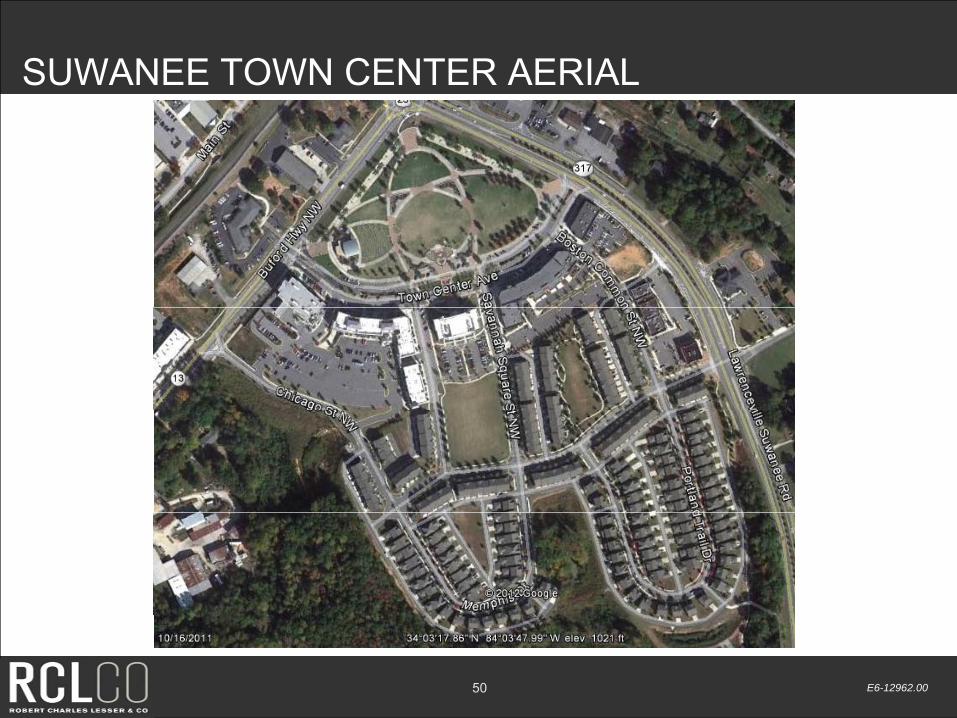
SUWANEE TOWN CENTER AERIAL
E6-12962.0050

CRITICAL ASSUMPTIONSOur conclusions are based on our analysis of the information available from our own sources and from theclient as of the date of this report. We assume that the information is correct, complete, and reliable.
We made certain assumptions about the future performance of the global, national, and local economyand real estate market, and on other factors similarly outside either our control or that of the client. Weanalyzed trends and the information available to us in drawing these conclusions However given the fluidanalyzed trends and the information available to us in drawing these conclusions. However, given the fluidand dynamic nature of the economy and real estate markets, as well as the uncertainty surroundingparticularly the near-term future, it is critical to monitor the economy and markets continuously and torevisit the aforementioned conclusions periodically to ensure that they stand the test of time.
We assume that the economy and real estate markets are close to bottoming out for the current cycle,d th t th ill t t bl d d t t t ti i 2010 l i t i ht liand that they will grow at a stable and moderate rate starting in 2010, more or less in a straight line on
average for the duration of the analysis period (to 2020 and beyond). However, history tells us that stableand moderate growth patterns are not sustainable over extended periods of time, and that the economy iscyclical and that the real estate markets are typically highly sensitive to business cycles. Further, it is verydifficult to predict when the current economic and real estate downturns will end, and what will be theh d f th th dshape and pace of growth once they are recovered.
With the above in mind, we assume that the long term average absorption rates and price changes will beas projected, realizing that most of the time performance will be either above or below said average rates.
Our analysis does not take into account the potential impact of future economic shocks on the nationald/ l l d d t il t f th t ti l b fit f j "b " ifand/or local economy, and does not necessarily account for the potential benefits from major "booms," if
and when they occur. Similarly, the analysis does not necessarily reflect the residual impact on the realestate market and the competitive environment of such a shock or boom. Also, it is important to note thatit is difficult to predict changing consumer and market psychology.
E6-12962.005151

CRITICAL ASSUMPTIONSFor all the reasons outlined, we recommend the close monitoring of the economy and the marketplace,and updating this analysis as appropriate.
Further, the project and investment economics should be “stress tested” to ensure that potentialfluctuations in revenue and cost assumptions resulting from alternative scenarios regarding the economyand real estate market conditions will not cause failureand real estate market conditions will not cause failure.
In addition, we assume that once the current cycle is over, the following will occur in accordance withcurrent expectations:
• Economic, employment, and household growth.
• Other forecasts of trends and demographic and economic patterns, including consumer confidencelevels.
• The cost of development and construction.
• Tax laws (i.e., property and income tax rates, deductibility of mortgage interest, and so forth).
• The availability and cost of capital and mortgage financing for real estate developers, owners andbuyers, at levels present in the market before the most recent run up (i.e., early 2000s levels).
• Competitive projects will be developed as planned (active and future) and that a reasonable stream ofsupply offerings will satisfy real estate demand.
• Major public works projects occur and are completed as planned.
Should any of the above change, this analysis should probably be updated, with the conclusions reviewedaccordingly (and possibly revised).
E6-12962.005252

GENERAL LIMITING CONDITIONSReasonable efforts have been made to ensure that the data contained in this study reflect accurate andtimely information and are believed to be reliable. This study is based on estimates, assumptions, andother information developed by RCLCO from its independent research effort, general knowledge of theindustry, and consultations with the client and its representatives. No responsibility is assumed forinaccuracies in reporting by the client, its agent, and representatives or in any other data source used in
i ti thi t d Thi t i b d i f ti th t t k l d tpreparing or presenting this study. This report is based on information that to our knowledge was currentas of the date of this report, and RCLCO has not undertaken any update of its research effort since suchdate.
Our report may contain prospective financial information, estimates, or opinions that represent our view ofbl t ti t ti l ti b t h i f ti ti t i i t ff dreasonable expectations at a particular time, but such information, estimates, or opinions are not offered
as predictions or assurances that a particular level of income or profit will be achieved, that particularevents will occur, or that a particular price will be offered or accepted. Actual results achieved during theperiod covered by our prospective financial analysis may vary from those described in our report, and thevariations may be material. Therefore, no warranty or representation is made by RCLCO that any of the
j t d l lt t i d i thi t d ill b hi dprojected values or results contained in this study will be achieved.
Possession of this study does not carry with it the right of publication thereof or to use the name of"Robert Charles Lesser & Co." or "RCLCO" in any manner without first obtaining the prior written consentof RCLCO. No abstracting, excerpting, or summarization of this study may be made without first obtainingth i itt t f RCLCO Thi t i t t b d i j ti ith bli i tthe prior written consent of RCLCO. This report is not to be used in conjunction with any public or privateoffering of securities or other similar purpose where it may be relied upon to any degree by any personother than the client without first obtaining the prior written consent of RCLCO. This study may not beused for any purpose other than that for which it is prepared or for which prior written consent has firstbeen obtained from RCLCO.
E6-12962.0053

POWERPOINT PRESENTATION: FINANCIAL STUDY
BROWNSTOWN DDA

Brownstown Town Center Market and Financial StudyFinal PresentationFinal Presentation Brownstown Downtown Development Authority | July 19, 2012

BACKGROUNDReport Preparation
Melina Duggal, Senior PrincipalJoyce Chao, AssociateOrlando, FL (407) 515-6592
Background The Downtown Development Authority (DDA) hired RCLCO tocomplete a market study and financial analysis as the firstt i i l t ti t t th t ill f ll tli thstep in an implementation strategy that will fully outline the
market potential for the town center that would make itattractive to tenants and potential developers.
Th f th k t t ti J 6 2012The summary of the market presentation was June 6, 2012.
This document is the summary of the financial analysis.
Objectives Prepare a financial analysis to clearly demonstrate thepotential of the Town Center.
E6-12962.001

AGENDA
Summary of Market Study and Financial Analysis
Next StepsFinancial Analysis Background
E6-12962.002

Summary of Market Study
E6-12962.003
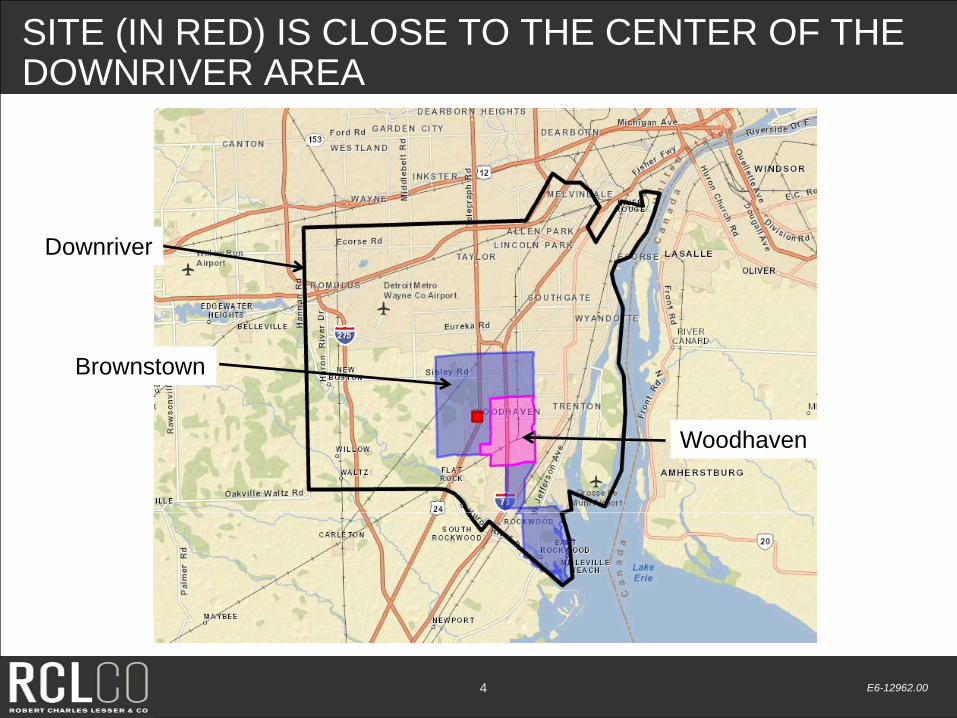
SITE (IN RED) IS CLOSE TO THE CENTER OF THE DOWNRIVER AREA
Downriver
Brownstown
Woodhaven
E6-12962.004
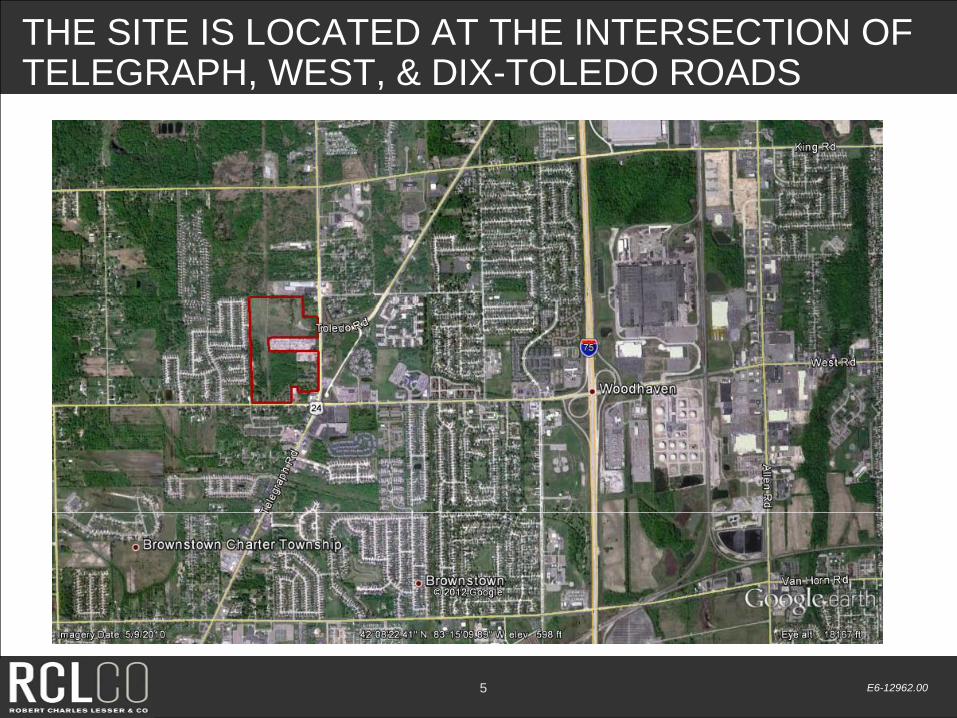
THE SITE IS LOCATED AT THE INTERSECTION OF TELEGRAPH, WEST, & DIX-TOLEDO ROADS
E6-12962.005
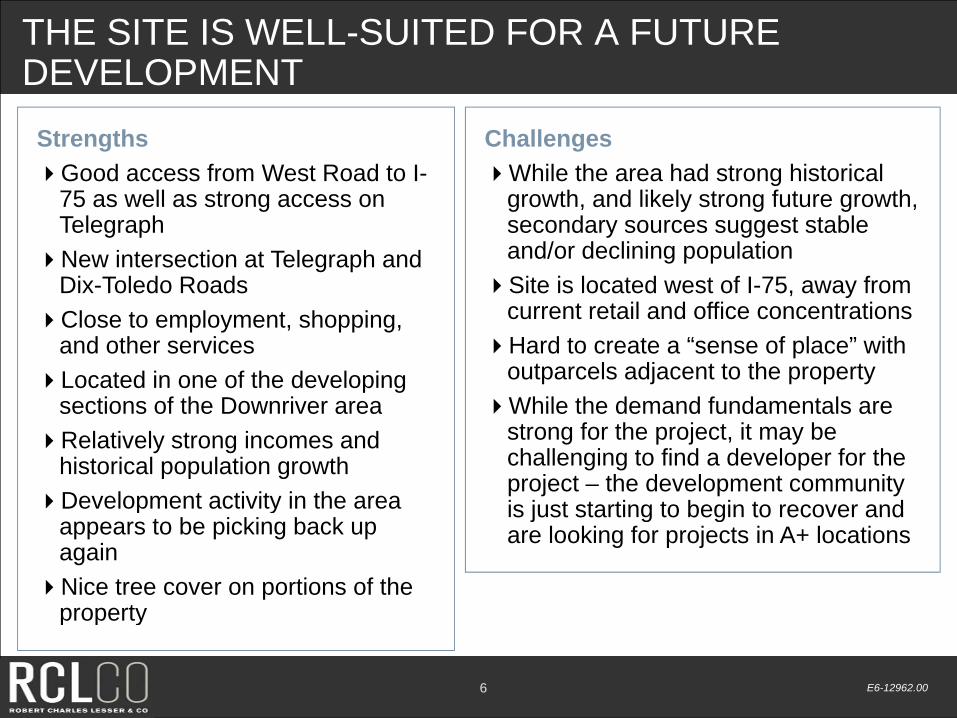
THE SITE IS WELL-SUITED FOR A FUTURE DEVELOPMENT
StrengthsGood access from West Road to I-
75 as well as strong access on
ChallengesWhile the area had strong historical
growth, and likely strong future growth,75 as well as strong access on TelegraphNew intersection at Telegraph and
Dix-Toledo Roads
growth, and likely strong future growth, secondary sources suggest stable and/or declining populationSite is located west of I-75, away from
current retail and office concentrationsClose to employment, shopping, and other servicesLocated in one of the developing
sections of the Downriver area
current retail and office concentrationsHard to create a “sense of place” with
outparcels adjacent to the propertyWhile the demand fundamentals aresections of the Downriver area
Relatively strong incomes and historical population growthDevelopment activity in the area
While the demand fundamentals are strong for the project, it may be challenging to find a developer for the project – the development community is just starting to begin to recover andp y
appears to be picking back up againNice tree cover on portions of the
property
is just starting to begin to recover and are looking for projects in A+ locations
E6-12962.006
property

OPTION ONE FOR SITE PLANLARGER TOWN CENTER
ConsiderationsUtilize largest, open space to
create the commercial core• Need to have strong entrance
8 Acres throughoutPark/Open space
off of Dix-Toledo and strong anchors
• Assumes a large commercial center – need strong anchor
• Format TBD but likely a20 Acres26 Acres81 SFD • Format TBD, but likely a
modified strip center• Not the best location for retail
on the siteSFD to buffer the SFD to the
20 Acres185K Retail50K Office
81 SFD
SFD to buffer the SFD to the west as well as create premiums with the wetlands
Garden-style apartment complex along Telegraph Road
13 Acres250 Apts complex along Telegraph Road
Walking linkages between land uses
Would allow for future expansion into RV storage area
p
E6-12962.007
expansion into RV storage area as a mix of uses

CONCEPT 1 FOR PROPERTYMODIFIED TOWN CENTER
Financial analysis suggests the land is worth approximately $5 to $5.5M
Assumes the DDA sells off pieces of the landA less likely scenario would be one buyerDoes not assume DDA would developIncludes an 8 acre park and/or open space
which would be for public usewhich would be for public use
Total Land Use Acres Density SF/Units Price/Acre 2013 2014 2015 2016 2017 2018Park/Open Space
8
Single-Family Detached
26 3.1 U/A 81 $38,000 26DetachedApartments 13 20 DU/A 250 $100,000 8Retail 17 0.25 185,000 $146,000 9 8Office 3 0.25 50,000 $100,000 1.5 1.5Total 67
E6-12962.008

CONCEPT 2 FOR PROPERTYMORE RESIDENTIAL, LESS MIX OF USES
ConsiderationsRetail would be along Telegraph
Road Does not create the opportunity
t d l l t tto develop a larger town center with amenities and public spaces
SFD to occupy the largest portion of the property and13 Acres portion of the property and create a community of scale –would be good to have it walkable to the retail
Garden-style apartment
37 Acres116 SFD
13 Acres250 Apts
complex along West Road taking advantage of the wetlands
Walking linkages between land uses
14 Acres150K Retail
3 Acres50K Commercial uses
Would allow for future expansion into RV storage area as a mix of uses
Additional frontage on
50K Commercial
E6-12962.009
Telegraph for commercial

CONCEPT 2 FOR PROPERTYLESS MIX OF USES – MORE CONVENTIONAL FORMAT
Financial analysis suggests the land is worth approximately $5 to $5.5M
Assumes the DDA sells off pieces of the landpDoes not assume DDA would developDoes not include any park or open space for the
public
Total Land Use Acres Density SF/Units Price/Acre 2013 2014 2015 2016 2017 2018Single-Family Detached
37 3.1 U/A 116 $38,000 37
Apartments 13 20 DU/A 250 $100,000 8Retail 14 0 25 150 000 $146 000 14Retail 14 0.25 150,000 $146,000 14Office 3 0.25 50,000 $100,000 1.5 1.5Total 67
E6-12962.0010

Next Steps
E6-12962.0011

DEVELOPMENT STRATEGY MATRIX
Option 1 Sell Off in Parcels
Option 2 Sell Off in Parcels
Sell Entire Parcel
Find a JointVenture PartnerSell Off in Parcels Sell Off in Parcels Parcel Venture Partner
Marketability Strong – ability to sell pieces as
dictated by market
Strongest given location and size
of retail
Harder given size of parcel. Impacts
timing
Harder given complications,market timing,
il bilit favailability of master
developersRisk • Placement of the • Lowest given • Timing • Highest
retail• Apartment market
gplacement of land
uses• Apartment market
g• Would likely be
worth more money sold as
separate parcels
g
p pTiming Now-2 years Start now 3-4 years out 3-4 years out
E6-12962.0012

DEVELOPMENT STRATEGY MATRIX CONT.Option 1
Sell Off in ParcelsOption 2
Sell Off in Parcels Sell Entire ParcelFind a Joint
Venture PartnerRole of
DDA• Determine
strategy• Determine
strategy• Determine strategy• DDA staff to work
• Determine strategyDDA strategy
• DDA staff to work with brokers to sell
land
strategy• DDA staff to work with brokers to sell
land
• DDA staff to work with brokers to sell
land
strategy• Likely need to
hire consultant to put together JV
agreement couldagreement, could potentially be done
by staffActions • Create a land plan • Create a land plan • Utilize plans created • Pick plan
• Determine if value changes based
upon plan• Work with brokers
• Determine if value changes based
upon plan• Work with brokers
• Work with brokers for pitfalls,
challenges, to identify buyers
• Identify short list of potential
partners• Discuss project
for pitfalls, challenges, to identify buyers
• List land
for pitfalls, challenges, to identify buyers
• List land
• List land• Need to be clear if 8 acres of open space
are for public use
with them• Work out agreement
E6-12962.0013

Financial Analysis Background
E6-12962.0014

OPTION 1Program
Density (FAR/Lot Size)
Total SF/Units 2012 2013 2014 2015 2016 2017 2018
Park/Open Space 8Single-Family Detached 3.1 Units/Acre 81 81Apartments 20 Units/Acre 250 150 100Retail 0.25 185,000 100,000 85,000Office 0.25 50,000 25,000 25,000
AcresDensity
(FAR/Lot Size)Total Acres 2012 2013 2014 2015 2016 2017 2018
Park/Open Space 8 8Single-Family Detached 3.1 Units/Acre 26 0 0 0 26 0 0 0Apartments 20 Units/Acre 13 0 8 0 0 0 5 0Retail 0.25 17 0 0 9 0 8 0 0Office 0.25 3 0 0 0 0 2 0 2Total 66.8 8 8 9 26 9 5 2
Revenues AssumptionsTotal
Revenues 2012 2013 2014 2015 2016 2017 2018Revenue Escalation 3% 100% 103% 106% 109% 112% 115% 118%Single-Family Detached $38,000 $989,256 $0 $0 $0 $989,256 $0 $0 $0Apartments $100 000 $1 250 000 $0 $750 000 $0 $0 $0 $500 000 $0Apartments $100,000 $1,250,000 $0 $750,000 $0 $0 $0 $500,000 $0Retail $146,000 $2,480,257 $0 $0 $1,340,680 $0 $1,139,578 $0 $0Office $100,000 $327,955 $0 $0 $0 $0 $163,977 $0 $163,977Total Revenues $5,047,468 $0 $750,000 $1,340,680 $989,256 $1,303,555 $500,000 $163,977Total Revenues Escalated $5,500,385 $0 $772,500 $1,421,120 $1,078,289 $1,459,982 $575,000 $193,493
Costs Assumptions Total Cost 2012 2013 2014 2015 2016 2017 2018Cost Escalation 3% 100% 103% 106% 109% 112% 115% 118%Cost Escalation 3% 100% 103% 106% 109% 112% 115% 118%Off-site Utility Improvement $200,000 $200,000On-site Roads $640 /linear ft $768,000 $768,000Off-site Road Improvements $400,000 $400,000Marketing 2% of revenue $100,949 $15,000 $26,814 $19,785 $26,071 $10,000 $3,280Total Costs $1,468,949 $0 $1,383,000 $26,814 $19,785 $26,071 $10,000 $3,280Total Costs Escalated $1,519,048 $0 $1,424,490 $28,422 $21,566 $29,200 $11,500 $3,870
E6-12962.0015
Net Cash Flow $3,578,519 $0 -$633,000 $1,313,866 $969,471 $1,277,484 $490,000 $160,698Cumulative Cash Flow $0 -$633,000 $680,866 $1,650,337 $2,927,821 $3,417,821 $3,578,519

OPTION 2Program
Density (FAR/Lot Size)
Total SF/Units 2012 2013 2014 2015 2016 2017 2018
Park/Open SpaceSingle-Family Detached 3.1 Units/Acre 116 116Apartments 20 Units/Acre 250 150 100Retail 0.25 150,000 150,000Office 0.25 50,000 25,000 25,000
AcresDensity
(FAR/Lot Size)Total Acres 2012 2013 2014 2015 2016 2017 2018
Park/Open Space 0Single-Family Detached 3.1 Units/Acre 37 0 0 0 37 0 0 0Apartments 20 Units/Acre 13 0 8 0 0 0 5 0Retail 0.25 14 0 0 14 0 0 0 0Offi 0 25 3 0 0 0 0 2 0 2Office 0.25 3 0 0 0 0 2 0 2Total 66.8 0 8 14 37 2 5 2
Revenues AssumptionsTotal
Revenues 2012 2013 2014 2015 2016 2017 2018Revenue Escalation 3% 3% 100% 103% 106% 109% 112% 115% 118%Single-Family Detached $38,000 $1,416,713 $0 $0 $0 $1,416,713 $0 $0 $0Apartments $100 000 $1 250 000 $0 $750 000 $0 $0 $0 $500 000 $0Apartments $100,000 $1,250,000 $0 $750,000 $0 $0 $0 $500,000 $0Retail $146,000 $2,011,019 $0 $0 $2,011,019 $0 $0 $0 $0Office $100,000 $327,955 $0 $0 $0 $0 $163,977 $0 $163,977Total Revenues $5,005,687 $0 $750,000 $2,011,019 $1,416,713 $163,977 $500,000 $163,977
$5,400,545 $0 $772,500 $2,131,680 $1,544,217 $183,655 $575,000 $193,493
Costs Assumptions Total Cost 2012 2013 2014 2015 2016 2017 2018Cost Escalation 3% 3% 100% 103% 106% 109% 112% 115% 118%Cost sca at o 3% 3% 00% 03% 06% 09% % 5% 8%Off-site Utility Improvement $200,000 $200,000Off-site Road Improvements $400,000 $400,000Marketing 2% of revenue $100,114 $15,000 $40,220 $28,334 $3,280 $10,000 $3,280Total Costs $700,114 $0 $615,000 $40,220 $28,334 $3,280 $10,000 $3,280Total Costs Escalated $726,011 $0 $633,450 $42,634 $30,884 $3,673 $11,500 $3,870
Net Cash Flow $4,305,573 $0 $135,000 $1,970,799 $1,388,378 $160,698 $490,000 $160,698
E6-12962.0016
Cumulative Cash Flow $0 $135,000 $2,105,799 $3,494,177 $3,654,875 $4,144,875 $4,305,573

PRODUCT DETAILSLand Use
Single-Family Detached (Units)
For-Rent Walk-up (Units) Retail (SF) Office (SF)
Likelihood of Market Success in Local Area
Strong. Brownstown Township is a well-known destination for
new for-sale housing
Moderately strong given current economic climate
and desirability of rental as a development product.
Dependent upon location in market area
The office market is weak. The best opportunities are for medical office and small
usersa development product. Challenge is rent levels
users
Likelihood of Market Success at Subject Site
Strong Moderately strong Moderately strong Dependent upon creating walkable environment
(Rent/Price)/(SF/Unit) $215,000 $240,000 $1.03 $18 $16Density (FAR or Units/Acre) 3 1 2 5 20 0.25 0.35Density (FAR or Units/Acre) 3.1 2.5 20 0.25 0.35Average Unit Size (Apts/SFD) 2,150 2,353 1,050Parking Requirements N/a N/a 2 spaces per unit 4 spaces/1,000 SF 5 spaces/1,000 SF
Land Value Per Unit Based Upon Sold Comps
$0 $0 n/a n/a n/a
Comp Information 1 sold 1 sold n/a n/a n/aL d V l P U it B d U F $9 926 $9 926 $859 /Land Value Per Unit Based Upon For-Sale
$9,926 $9,926 $859n/a
n/a
Comp Information 2 for-sale 2 for-sale 1 MF site for sale n/a n/aLand Value Per Unit Based upon Model $12,355 $14,868 $8,248 n/a n/a
Land Value Per Acre Based upon Comps in Market
$30,883 $30,883 $10,312 $213,161 $108,264
Comp Information 2 for-sale 2 for-sale 1 MF site for sale 5 listings 12 listingsLand Value Per Acre Based upon Recent Sales
$0 $0 n/a $150,000 $150,000
Comp Information 1 sold 1 sold n/a 1 sold 1 soldLand Value Per Acre Based upon Residual Model
$38,442 $37,009 $164,957 $142,986 -$1,338,690
E6-12962.0017
Land Value Per Acre to use in Model $38,000 $37,000 $100,000 $146,000 $100,000

SINGLE0FAMILY DETACHED LAND RESIDUALCATEGORY 60' Wide 70' WideAverage Unit Size 2,150 2,353Average Base Price $215,000 $240,000Average Amount Spent on Upgrades/Premiums 5% $10,750 $12,000Average HomeAverage Home Price $225,750 $252,000
Less: Direct Construction (per SF) $55 per SF $118,250 $129,412
Upgrade Costs80% of upgrade
price $8,600 $9,600 S ftSoft Costs At 10%of base price $21,500 $24,000
Total Costs: $148,350 $163,012
Less: Closing Costs 6% of value $13,545 $15,120 Less: Developer Profit (Yield) 10% of base price $21,500 $24,000 p ( ) p
Total Developed Lot Value $42,355 $49,868 Developed Lot as a % of Home Value 20% 21%
Cost to Develop Lot $500 per linear foot $30,000 $35,000
Total Raw Lot Value $12,355 $14,868 Raw Lot as a % of Developed Lot 41% 42%Value per Acre $38,442 $37,009
E6-12962.0018

APARTMENT LAND RESIDUALCATEGORY TOTALDensity (du/ac) 20.0Number of Units 20Total Buildable Acre(s) 1.0
Wtd. AverageAverage Unit Size 1,050Average Monthly Rent/Unit $1,082Average Monthly Rent/Unit $1,082Average Rent/Unit/Square Foot $1.03
Scheduled Rent $259,560Scheduled Rent/Unit $12,978Vacancy Allowance 5.0% ($12,978)
Total Rent Collected $246,582Other Income 3 0% $7 787Other Income 3.0% $7,787
Effective Gross Income $254,369Effective Gross Income/Unit $12,718
Operating Expenses/Unit 35.0% ($4,451)Total Operating Expenses ($89,029)
Net Operating Income (NOI) $165 340Net Operating Income (NOI) $165,340Net Operating Income/Unit (NOI) $8,267
Capitalization Rate 7.00%Capitalizated Market Value $2,361,996
Less: Direct Construction (per SF) $70 per SF $73,500 ($1,470,000)Parking $3500 per space $5,250 ($105,000)g $ p p $ , ($ , )Soft Costs At 15%of direct $11,025 ($220,500)
Total Costs: $89,775 ($1,795,500)
Less: Closing Costs 2% of value ($47,240)Less: Developer Profit (Yield) 15% of value ($354,299)
Total Land Value $164,957
E6-12962.0019
Land Value Per Unit $8,248 Value Per Acre $164,957

RETAIL LAND RESIDUALCATEGORY INPUTS TOTALNumber of Buildings 1Total Buildable Acres 1.0
Floor Area Ratio 0.25 FARLeasable Building Area (SF) 10,890Average Rent for Retail $18.00g $Parking Spaces Required (per 1,000) 4.0
Scheduled Monthly Rent $16,335Scheduled Annual Rent $196,020Less: Vacancy Allowance 5.0% ($9,801)
Total Rent Collected $186,219Other Income, Parking $0Effective Gross Income $186,219Less: Monthly Operating Expenses per SF 30%Less: Annual Operating Expenses ($55,866)
Net Operating Income (NOI) $130 353Net Operating Income (NOI) $130,353
Capitalization Rate 7.00%Capitalizated Market Value $1,862,190
Less: Direct Construction (per SF) $74 per SF ($805,860)Parking Costs $3500 per space ($152,460)Soft Costs At 35%of direct ($335 412)Soft Costs At 35%of direct ($335,412)TI Allowance $10 per SF ($108,900)
Total Costs: ($1,402,632)
Less: Closing Costs 2% of value ($37,244)Less: Developer Profit (Yield) 15% of value ($279,329)
Total Land Value $142 986
E6-12962.0020
Total Land Value $142,986 Land Value Per Acre $142,986
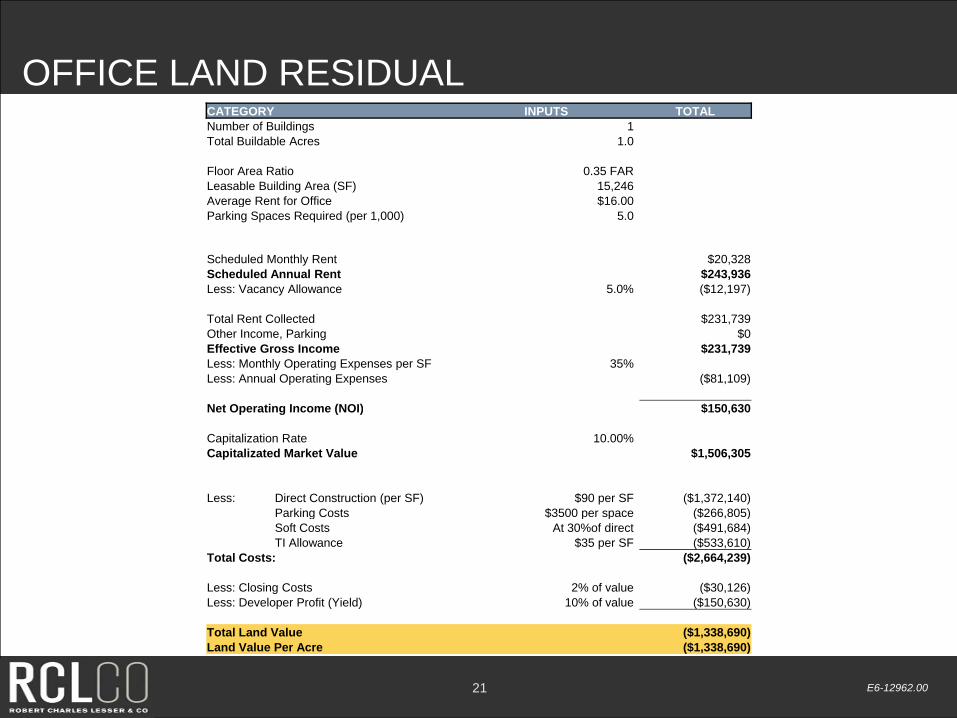
OFFICE LAND RESIDUALCATEGORY INPUTS TOTALNumber of Buildings 1Total Buildable Acres 1.0
Floor Area Ratio 0.35 FARLeasable Building Area (SF) 15,246Average Rent for Office $16.00g $Parking Spaces Required (per 1,000) 5.0
Scheduled Monthly Rent $20,328Scheduled Annual Rent $243,936Less: Vacancy Allowance 5.0% ($12,197)
Total Rent Collected $231,739Other Income, Parking $0Effective Gross Income $231,739Less: Monthly Operating Expenses per SF 35%Less: Annual Operating Expenses ($81,109)
Net Operating Income (NOI) $150 630Net Operating Income (NOI) $150,630
Capitalization Rate 10.00%Capitalizated Market Value $1,506,305
Less: Direct Construction (per SF) $90 per SF ($1,372,140)Parking Costs $3500 per space ($266 805)Parking Costs $3500 per space ($266,805)Soft Costs At 30%of direct ($491,684)TI Allowance $35 per SF ($533,610)
Total Costs: ($2,664,239)
Less: Closing Costs 2% of value ($30,126)Less: Developer Profit (Yield) 10% of value ($150,630)
E6-12962.0021
Total Land Value ($1,338,690)Land Value Per Acre ($1,338,690)

CRITICAL ASSUMPTIONSOur conclusions are based on our analysis of the information available from our own sources and from theclient as of the date of this report. We assume that the information is correct, complete, and reliable.
We made certain assumptions about the future performance of the global, national, and local economyand real estate market, and on other factors similarly outside either our control or that of the client. Weanalyzed trends and the information available to us in drawing these conclusions However given the fluidanalyzed trends and the information available to us in drawing these conclusions. However, given the fluidand dynamic nature of the economy and real estate markets, as well as the uncertainty surroundingparticularly the near-term future, it is critical to monitor the economy and markets continuously and torevisit the aforementioned conclusions periodically to ensure that they stand the test of time.
We assume that the economy and real estate markets are close to bottoming out for the current cycle,d th t th ill t t bl d d t t t ti i 2010 l i t i ht liand that they will grow at a stable and moderate rate starting in 2010, more or less in a straight line on
average for the duration of the analysis period (to 2020 and beyond). However, history tells us that stableand moderate growth patterns are not sustainable over extended periods of time, and that the economy iscyclical and that the real estate markets are typically highly sensitive to business cycles. Further, it is verydifficult to predict when the current economic and real estate downturns will end, and what will be theh d f th th dshape and pace of growth once they are recovered.
With the above in mind, we assume that the long term average absorption rates and price changes will beas projected, realizing that most of the time performance will be either above or below said average rates.
Our analysis does not take into account the potential impact of future economic shocks on the nationald/ l l d d t il t f th t ti l b fit f j "b " ifand/or local economy, and does not necessarily account for the potential benefits from major "booms," if
and when they occur. Similarly, the analysis does not necessarily reflect the residual impact on the realestate market and the competitive environment of such a shock or boom. Also, it is important to note thatit is difficult to predict changing consumer and market psychology.
E6-12962.002222

CRITICAL ASSUMPTIONSFor all the reasons outlined, we recommend the close monitoring of the economy and the marketplace,and updating this analysis as appropriate.
Further, the project and investment economics should be “stress tested” to ensure that potentialfluctuations in revenue and cost assumptions resulting from alternative scenarios regarding the economyand real estate market conditions will not cause failureand real estate market conditions will not cause failure.
In addition, we assume that once the current cycle is over, the following will occur in accordance withcurrent expectations:
• Economic, employment, and household growth.
• Other forecasts of trends and demographic and economic patterns, including consumer confidencelevels.
• The cost of development and construction.
• Tax laws (i.e., property and income tax rates, deductibility of mortgage interest, and so forth).
• The availability and cost of capital and mortgage financing for real estate developers, owners andbuyers, at levels present in the market before the most recent run up (i.e., early 2000s levels).
• Competitive projects will be developed as planned (active and future) and that a reasonable stream ofsupply offerings will satisfy real estate demand.
• Major public works projects occur and are completed as planned.
Should any of the above change, this analysis should probably be updated, with the conclusions reviewedaccordingly (and possibly revised).
E6-12962.002323

GENERAL LIMITING CONDITIONSReasonable efforts have been made to ensure that the data contained in this study reflect accurate andtimely information and are believed to be reliable. This study is based on estimates, assumptions, andother information developed by RCLCO from its independent research effort, general knowledge of theindustry, and consultations with the client and its representatives. No responsibility is assumed forinaccuracies in reporting by the client, its agent, and representatives or in any other data source used in
i ti thi t d Thi t i b d i f ti th t t k l d tpreparing or presenting this study. This report is based on information that to our knowledge was currentas of the date of this report, and RCLCO has not undertaken any update of its research effort since suchdate.
Our report may contain prospective financial information, estimates, or opinions that represent our view ofbl t ti t ti l ti b t h i f ti ti t i i t ff dreasonable expectations at a particular time, but such information, estimates, or opinions are not offered
as predictions or assurances that a particular level of income or profit will be achieved, that particularevents will occur, or that a particular price will be offered or accepted. Actual results achieved during theperiod covered by our prospective financial analysis may vary from those described in our report, and thevariations may be material. Therefore, no warranty or representation is made by RCLCO that any of the
j t d l lt t i d i thi t d ill b hi dprojected values or results contained in this study will be achieved.
Possession of this study does not carry with it the right of publication thereof or to use the name of"Robert Charles Lesser & Co." or "RCLCO" in any manner without first obtaining the prior written consentof RCLCO. No abstracting, excerpting, or summarization of this study may be made without first obtainingth i itt t f RCLCO Thi t i t t b d i j ti ith bli i tthe prior written consent of RCLCO. This report is not to be used in conjunction with any public or privateoffering of securities or other similar purpose where it may be relied upon to any degree by any personother than the client without first obtaining the prior written consent of RCLCO. This study may not beused for any purpose other than that for which it is prepared or for which prior written consent has firstbeen obtained from RCLCO.
E6-12962.0024


