
Brown, J., D. Ethridge. Effects of Bark in Cotton on ...
5
Reprinted from Proceedings of the Beltwide Cotton Conference (1992):382-385. Brown, J., D. Ethridge. "Effects of Bark in Cotton on Textile Processing Costs." Beltwide Cotton Conference, (1992):382-385.
Transcript of Brown, J., D. Ethridge. Effects of Bark in Cotton on ...
Reprinted from Proceedings of the Beltwide Cotton Conference
(1992):382-385.
Brown, J., D. Ethridge. "Effects of Bark in
Cotton on Textile Processing Costs." Beltwide
Cotton Conference, (1992):382-385.

EFFECTS OF BAlUt DI CO'l"l'OM OM TEX'fiLR PROCESSDlG COSTS Jeff Brown and Don Ethridge
Graduate Research Assistant and Professor, respectively,
Depart.ent of Agricultural Economcs Texas Tech university
Lnbbock, TeXas
Abstract
Textile processing results using cotton with different levels of bark from three different textile processing performance studies were analyzed individually to detendne the economic effect. of bark in cotton on t.extile processing. The results indicate that cotton reduced one grade due to bark content added little to processing costs with rotor spinning. However, cotton reduced two qrades because of bark added somewhat more to p~ocessing cost with rotor spinning, but had a very substantial erfect on processing cost with ring spinning. Aggressive cleaning of catton can reduce processing .~ficiency losses (costs), but it adds to waste losses.
Introduction
The exist.ence of bark, i.e., pieces of woody material tram the stalk and/or branches of the catton plant., in cot.ton lint and the costs incurred by its presences atrect all se~ents of the cotton industry. Bark in cotton causes problems for textile mills in various processing stages and/or it may result in impurities or defects in the yarn and fabric, which affects consumers' preferences. Therefore, the bark tends to increase production processing costs and decrease the value of the product. COnsequently, bark in cotton represents a lower price (greater discount) to the cotton producer.
Classing of cotton is a procedure which evaluates quality attributes of the cotton fiber: each bale is classed. The market assigns prices to cotton of various quality combinations, which facilitates the marketing and production of cotton. The official classing of cotton, conducted by the Agricultural Marketing Service of the United States Department of Agriculture currently includes six quality at.tribut.es of the cotton lint: trash content, color, fiber length, IIlicronaire, strength, and length uniformity. Two attributes, those being trash content and color, are encompassed in the grade. one cOlllponent of trash content is bark. Under classing rules, the presences of bark in cotton results in the cotton being lowered one or two grades (e.g., grade 42 to grade 52 or grade 62), depending on the severity of the bark content. To the extent. that bark presents a problelll grade 52 or grade 62), depending on the severity of the bark content. To the extent that bark present.s a problem which is different trom the damage inflicted by other types of foreiqn material, this rule imposes a bark discount on the cotton which may (or may not) be arbitrary. one problelll is that it is not Jcnown to what. extent this loss in value to a producer is related to the decrease in the use value of the cotton.
Bark in cotton is not a new problem for the industry, but concern about it has increased with the industry's growing emphaSis on quality fiber. All regions of the country have a problem with bark to some degree: however, the problem is most severe in the Southwest Region where cotton is predominantly machine stripped. Between 1967 and 1984, approximately 30t of the total bales harvested in the Southwest Region were reduced in grade due to bark. This compares to less than 5t in the other regions where cotton is predominantly machine picked (Ethridge and Neeper, 1986). In upland cotton, bark makes up more than 50t of the qrade reductions associated with trash content in the United States (Anderson, 1991).
Even though the existence of bark in cotton can be related to stripper harvesting, the environment, cultural practices. seed variety, other harvesting practices, and other factors influence the degree to which bark occurs. However, these influences are not well understood, thereby making it difficult to correct for these problems. It. l118y be noted however. that research done by Brashears (1984, 1985) on harvester modifications has been shawn to reduce bark accumulation in the harvested cotton (Supak, 1989).
Bark in cot.ton causes . three general problems ror textile .Ills. Pirst. bark in cotton increases waste
loss in the initial cieaning of cotton in opening ~d carding. When bark is cleaned from the cottof! lint, cotton fibers attached to bark, as well as bark l.tself, are lost. This decrease in total weight of cotton, fro. the loss of lint and bark during cleaning, is a loss in weight of cotton Which was paid for. Second, bark ~at escapes the cleaning process may reduce spinninq efficiency by increasing breaks in the yarn (i.e., en~ down). Breaks in the yarn during spinning must be fixed, thereby increasing manufacturing costs. Third, bark can cause defects in the yarn and ultimately the fabriC. Defects in the fabric are unappealing to consumers, IIJId thus reduces the value of the yarn, fabric, or glU"llent.
GiVen that the losses to textile processors from bnt I in cotton--the loss in use value--should be related w the loss in market value of cotton fiber which contains bark, it is important to understand, and hopefully quantify. the costs from bark in t.extile processing. Therefore, the objectives of this study were to:
1) estimate the costs to textile mills associated with processing cotton with various levels of bark, and
2) relate this cost back to the price of cotton. " Achieving these objectives should provide some insights . on reasonable expected levels of market price discounts for bark.
Methods and Procedures !
The method of estimating the cost of processing cotton . with varying levels of bark was divided into two stage:: I total waste loss during opening and carding and breaks ~ the yarn during spinning. Opening and carding cotton lS the stage where the cot.ton lint is separated, clean~J and aligned. Host of the foreign material is removed from the cotton, but some amount of lint is also removed with the bark. The weight of the foreign material and : cotton lint removed (Le., total waste loss) was included I in the cost of the bale of cotton. Therefore, the : increase in total waste lass from cotton with no bark to i cotton with bark was est.imated, then a value (cost) ws est.imated for the waste loss caused by the bark.
In the spinning stage of processing, breaks in th~ yarll tend to increase with the amount of bark present ~n ~ cotton. There are two general types of spinning lII8chiJ;leS ) currently being used, rotor spinning machines and nnq spinning machines. The rotor spinning machi!le ~es; centrifugal force and air to twist the cotton ll.Dt l~to !
yarn and wind it on spools. The ring spinning lI~ch7ne ) uses more lIIOving parts and causes increased frIction
i :
between the cotton lint and the machine as yarn , 5 pulled, twisted, and wound onto spools. Therefore, us~ either machine, when breaks occur there is a CO involved in repairing it. Thus, the increase in breakS . from cotton with no bark to cotton containing bark ~ estilll8ted, then the increased cost from this losS ' processing {spinning} efficiency was estimated. 1
The waste loss and processing efficiency data for thiS ! analysis were from three textile processing perfo~dy' studies. One study, referred to as the -Price stu, ' (Price, 1991), provided fiber measurements and spi~ " tests on a saJllple of 16 bales of cotton, 12 of..... , designated as having sufficient bark to be reduced: " grade due to excess bark, and four of them not r~ i (not barky). Tbe cotton used in that study bad fjJ)er : properties, which varied only slightly in mlcronaire ~ i grade, thus allowing the effects of the bark to be 110 ~ I isolated. The textile cleaning equipment used in ~ \ study was a lIlOdern single card machine, and the yarn c;tfd produced ay rotor spinning. The spinning was condu of ", at a spindle speed of 90,000 rpm at a twist multiplier f
". a to produce a yarn count of 26.
Another study, referred to as the -Price ~ ~ f study- (Price and Shaw, 1988) , provided f o! 1 measurements and spinning tests on a sample of 18 lots i cotton with each lot consist.ing or three bales of co~ i Six of the lots were designated as having zero i .,

content, where each bale had not been reduced in grade, six of the lots were designated as having medium bark
\ content, where each bale had been reduced one grade due ~ ~k, and six of the lots were designated as having
; heavy bark content, where each bale had been reduced one or two grades due to bark. Three of the lots having
; heaVi: bark content were tested under different textile precessing conditions than the rest of the sample:
; therefore, these three lots were deleted from this ' analysis. The fiber properties of these lots were .nolllinally the same, yet differing sOlllewhat in micronaire, r ~de, and bark content. The cleaning equipment used in , ~at st~dy was an older single card, and both rotor and ' r~g ;;plnning were used to spin the yarn. The rotor ~lMlng was conducted at a spindle speed of 90,000 rpm It II twist multiplier of 4.0 to produce a yarn count of 26. The ring spinning was conducted at a spindle speed
i cf 11,000 rpm at a twist lIIultiplier of 3.81 to produce a fU'lI count of 26.
i The third study, referred to as the -Bragg et al. I Study". (B~agq et a1., 1991), provided fiber measurements [ and SPlnnlng tests on a sample of five different mixes of cotton. Two samples of cotton, one having low bark conUmt graded Middling and the other having high bark ~ter:t qr~ded Strict Low Middling, were blended to make
) e flve lIllxes of cotton. The mixes were 100% low bark cantent for :mix 1, 75\ low bark and 25% high bark for mix
r'~ ~O, low and 50\ high bark for mix 3, 25\ low and 7S~ th~ f~ for mix 4, and 1.00\ high bark for mix 5. All
' vere .properties of the cotton used in that stUdy , i cons1stent other than the grade. The cleaning : ~ent used in that study was an older single card ,
' ~Um.e yarn was spun on a rotor spinning machine. The :at a ln~ was conducted at a spindle speed of 1.00,000 rpm ;"",,_ttwlst multiplier average of 3.75 to produce a yarn - ... , of 30.
t I ' n~ order to determine the economic losses associated " estab~e weiqht losses, cotton prices were needed to PIt 1sh the dollar value of a weight loss . Further, to pr' the processing cost losses in terms of producer or1ces , an adjustment was needed to account for the cost
.Cotto lIOVing the cotton, including the bark and wasted ' ~l~ (the waste loss), from farm to mill. Rather than ~ ate the various costs for transportation,
~si lance, ' handling, etc., and aggregate them, the I ~· er approach of estimating the margin was used. The i Ptoc~'· or .difference between the price paid by , repres Sl~ f1rms and the price received by farmers, ' price en all costs between the two points . The farm ~i of cotton was calculated to be the average of all 1988~ated spot market prices for the years 1983 throuqh licron or grades 31 and 41, staple 34, 3.5 through 4.9
.1i11 aire (U.S. Department of Agriculture, 1989). The ' Point prife of cotton was calculated as group 201 mi ll .I11.S. ~ ces for the same period and the same qualities flartet· P8rtment of Agriculture, 1989). The averaqe : 1.31 c!ntsgcost (margin) was estimated in this way to be ; n /lb. i ~~rt • , the in of a break in the yarn was used to quant1fy ~tain~eased cost of spinning yarn from cotton Schl.afh 9 bark. The break cost data were provided by
,lanuta~~Inc. (Deussen, 1991). Deussen estimated the hour and br Cost per pound, production per machine per
_.rt~ eaks per machine per hour for varying break ltlte ~Od By taking the change in manufacturing cost times ' breaJts uetion POunds per machine per hour divided bY the f br~ per machine per hour he arrived at a cost per : ~ludr Deussen estimated' the manufacturing costs, ~inniD Dg all. labor, capital, and operating costs, in the Illd Prtlii:)m (eXClUding raw materials cost, overhead,
;bt 0.6 ~ntsfor each break in rotor and ring spinning to , and 3.0 cents, respectively. , 'l'beCOst f . tinislUn 0 bark in cotton beyond spinning, e.g., ~n
,,~, g, dyeing, etc., were not quantified in th~s ( ~Ue aslnfOraation to establish any potential loss 1n \ l~ w!sOCiated w~th any defects or additional weight ~inq cl n~ avallable. Also, the waste accu:mulated ~ile :u.nU1•g has some salable or reusable value to
.. ike;ise russ Is. however, these econOlllic returns were UlIIed to be zero in this study.
r'lZl '1'be baa i .' I <:etton ~ approach used to estimate the effects of ~k
U ~ n textile processing costs were the same 10 IzlalJ'Sis ~tudies. However, some specific points of ~~l to be lIIOdified because of the dHferences in Cottot. design among the processing studies.
ECOl1Ornics and Marlcetinl; Conference 383
To estimate the loss in value due to total waste loss in cotton, which is justified by a decrease in its value to the textile processor, the change in total waste loss from each bark designation for a selected producer price provides that estimate. This relationship can be specif ied as:
we = AW{P + Me) (1)
where, we - cost of bark to the textile processor in cents/lb. of cotton due to waste loss,
4 = symbol for "change in,n W = total (opening and carding) waste loss
expressed as a percentage of weight of cotton,
P producer price of cotton in cents/lb., "e marketing cost in cents/lb. - $ 0.0831. In the analysis, the producer prices of cotton selected were in five cents per pound increments from 50 to 75 cents per pound. This same approach for calculating waste cost was used tor all the processing studies.
In the Price study, the analysis found that there was a direct relationship between total waste loss and nonlint content. The relationship (Price, 1991) that most succinctly captures this effect is:
W x 5.007 + 0.769(cn) (2)
where, en = percent of non-lint content of the cotton. To estimate the total waste loss between the cotton containing bark and the non-bark content cotton in that study; the average non-lint content from each bark designation was taken to arrive at a total waste loss. The AW in equation 1. was the difference in the W in equation 2 between cotton with the en level of the barky cotton and the cotton wi th the en level of the non-harky cotton.
Dl the Price and Shaw Study, there was no significant difference in waste loss between the zero bark and medium bark cottons so the Aw between zero and medium bark was zero. (The;'e was also no significant difference in average non-lint content values). The average change in total waste loss (AW) between llIedium hark and heavy bark was calculated directly from the averaqe waste in medium and heavy bark.
In the Bragg et al. Study, the analysis found that there was also a direct relationship between total waste loss and non-lint content. The linear relationship that captures this effect is:
W - 3.086 + 0.59(en) (3)
The AN for equation 1 was calculated in the sam-; manner as in the Price study, except that four AW IS were computed using equation 3 rather than just one .
The other processing problem attributable to bark, with the exception of the Price study, was the increased nWllber of breaks. In the Price Study, there was no si ificant difference in spinning breaks between barky an~non-barky cotton. Consequently, with that cleaning process, there was no processing efficiency cost.
Dl the Price and Shaw Study, there was a significant lationship between total waste loss and the yarn break
~tes on both rotor and ring spinning machines. The relationships were:
Pr '" [e .. · ... + . . .. ·'1/1000 (4) Fg .. [e's."" + 0." 1Ol]/1000 (5)
F tor spinning break rate per spindle hour, where, r - ro 7183 symbol for exponential - 2. ,
e - i spinning break rate per spindle hour. FC] - r ng ineUe hour, the average
To estimate the b~eaJc ra~e or~:p bark levels was used to total waste loss or eac ·va bark levels. Once get the Fg and Fr for the respecti ti ted this value the break rate per spindle hour was e~ : ciean cotton was converted to breaks per ~ ' following formula processed per spin:;; h: of clean cotton processed provides the est1llUl po per spindle hour. '
PP _ (R * H) / (504 * y'" * T) (6)
1992 Beltwide Cotton Canferenc:a

where, PP c pounds of clean cotton processed per spindle hour,
R - spindle speed in revolutions per minute (rpm) ,
H - spindle hours, Y - yarn count - number of hanks of 840 yards
which weigh one pound, T - twist multiplier ~ turns per inch per square
root of yarn count.
To estimate the cost of breaks in spinning to raw cotton, i.e., the form producers sell the cotton in, the amount of clean cotton processed per spin hour had to be divided by the total waste loss percentage to get the cotton back to a raw pounds estimate. That calculation is encompassed in the formula to estimate the break cost per pound. To determine the cost of bark in cotton attributable to breaks in the different bark designated c:ctton, the following relationship can be specified.
Be Q (0 * AP) / [PP / (1 - W») (7)
where, Be break cost, in cents per pound of cotton, o - c,?st of one break for designated type of
sp~nning, in cents per break, F spinning break rate per spindle hour (i.e.,
Fr or Fg). . The break rates per spindle hour (P) from the Bragg et al. Study were taken directly from the data rather than troll a relationship such as equation 4: the number of observations were too small to estimate a relationship. The break costs per pound of cotton were calculated using equations 6 and 7 in the same manner as in the Price and Shaw Study, except that four Res were computed rather than two.
To determine the full loss in value attributable to the different levels of bark in the cotton in each of the three studies, the two costs, i.e. , the waste cost (WC) and break cost (BC), were summed to obtain the textile ~rocessing costs attributable to varying levels of bark ~n cotton:
TC = WC + Be (8)
where, TC - total cost of bark attributable to each bark content designation.
Results
The :esults of this analysis provide an estimate of the loss ~n use value (costs) to textile processors for processing cotton with various bark designations on different types of processing equipment. In the Price Study, where the cotton was cleaned on modern cleaning ~iPj'ent, it produced greater average total waste losses
an n the other two studies (Table 1). Cons entl the modern cleaning equipment seemed to be more egorou y h tn ~~ving the bark content and thus the averaqe chan~e 1 ifi 1 waste loss was greater. Since there was such a s gn cant amount of waste loss, the loss in use value i~also a substantially large cost when compared to the ~ :r i studies. The loss in use value associated with of r cot~~O~i~l~~~ from 1.27 to 1.77 cents per pound
1 In the Price and Shaw Study, the average total waste Osses were less than in the Price Study which be
attributed to the use of older cleaning ~pment Jlay The average change in total waste loss was not Signifi~tly d..ifferent froll zero between zero and medium bark d~ignations: howeVer, the change is evalUated in this s dy because the cotton was reduced one grade due to the presence of bark in the cotton. Since there was such a ~i~~:i~ ~e average total waste loss, the cost
e waste loss was also small ran in from 0.09 to 0.13 cents per pound of cotton Th' g 9 change in total waste loss for hea;Y ~;erage ~~~ificant, but still only about halt that of the Pr~~ lossYin ~~ ~~ ~os~ in use value due to total waste 1.02 cents es gnated ~tton ranged from 0.72 to Price Study.per POund, approx~tely half that of the
lo!~~:er Bragq et alo study, the ave~ge total waste lower and ~ ~le to the Price and Shaw study at the also clean~~ Ol:t:ds°l In. that~tudy, the cotton was the avera r c ean~ng equ~pment: consequently,
percent o~e ~:aS:;:i~~e iiC: l~isro~~t;lJa:u;o o~ Cotton Economks and Marketi~ Conferenae
the mixes progressively increases from a range of 0.11 to 0.15 cents per pound of cotton in mix 2 to a range of 0.43 to 0.61 cents per pound of cotton for mix 5.
\ OVerall the added textile processing costs, i.e., l~
in use values, attributable to total waste loss appear to . range from 1.27 to 1.77 cents per pound of cotton, where the cotton is cleaned on more modern cleaning equipment. cotton cleaned on older cleaning equipment, the added processing costs attributable to total waste loss rllll9' : from 0.43 to 1.02 cents per pound of cotton. Both ranges of added processing costs relate to cotton that had been " reduced one to two grades.
)
The resulting losses in use value due to losses in spinning efficiency complement the waste cost resulb. In the price Study, there was no Significant loss In spinning efficiency: therefore, there was no break cort for spinning the cotton containing bark. However, it may , be noted that the modern cleaning equipment provided greater waste loss, leaving no bark in the cotton to 1 produce significant spinning efficiency losses. ,
In the Price and Shaw st~dy, the cottons producing the r total waste losses were divided and spun on both rotor and ring spindles. The results between zero and medi\JJI , bark cotton are again statistically insignificant. ~~ ~ results of the cotton spun on a rotor spinning machine seem to show significant, but small, changes in average , break rates (Tabl e 3). The large difference in the, economic losses in processing performance can be related back to the average change in break rates for the two • bark designations.
i COtton spun on a ring spinning machine shOW a much
greater impact of bark on spinning efficiency. The break \ rate almost doubled for heavy bark versus mediUlll bark f co~ton. The loss in use value for medium bark cotto~ , us~ng ring spinning machines was estimated to be 0.5 I cents per pound of cotton. The increased cost for heavy I
bark cotton due to breaks during spinning ~as estima~ i to be 6.39 cents per pound of cotton. Thls shOWS tha . cotton with a significant amount of bark, c.leaned .~~ older equipment and spun on ring spinning ma~lnes, Wl Cause a substantial loss in processing effic~enCY.
'384 ,
In the Bragg et al. study, ·"here only ro~or spinnt:, was used, the results were similar to those ~n the Pr tes I c;md Shaw Study. The average change in br:ak ra TIle ~ncreases incrementally through the different IIUX~s.. C1 ! loss in use value associated with spinning efflC:lell5 ' ranged from 0.11 to 0.33 for mix 2 thrOugh JllX ~ . respectively. The small added processinq cost dU~~ breaks in the study as compared to the Price and 101 Study can be associated with the fact that ~ix 1 ~ bark content, not no bark content, and a greater of waste was removed.
lec:ted • The total added textile processing co~t, for se istent !
producer cotton prices proved to be relat~velY COilS Wl acrC;'ss P!ocessing studies (Table 4): ~e UP~~Il9" ( des~gnat~ons in each study exclud~nq r~ng spl t is indicates that the total ' added processing COS When approximately 1 to 2 cents per pound of cotton ' inq is heavy bark contamination exists and ring spi!ID telY 7 i used, the total added processing cost is approxiJIA ; to 7.5 cents per pound of cotton .
Conclusions , f added ,
The results of this study show a wide range 0 contellt , textile processing costs for various bark leaniJl4 ' cottons, due largely to differences in type of t~ories . , equipment, spinning technology, and bark ca leanit'1 ; Cotton reduced one grade and cleaned on modern C Wl equipment seems to eliminate the problems caused bY total i in the spinning process. However, the greater ts tile . waste loss from more effective cleaning offse~ll negligible spinning efficiency loss in terms of I costs to the textile processor. \
in riJ14 The evidence on losses incurred from bark stud1 if ,
spinning versus rotor spinning examined in thi~ in r~ <' limited, but it suggests that losses from bar than jJI
spinning processes are substantially greater ~ if( rotor spinning. at least when older cleaning ~l J,arJ,' used and bark contamination is heavy. OV wfl~ ~ losses ' in textile processing are small except contaJlination is heavy.
' . , , fereI"" 1992 8eJtwide Cotton COlI I
Acknowledge.ents
TIle authors thank John Price, Charles Bragg, Carolyn SUpson, Helmut Deussen, ROY Baker, Terry Ervin, carter
; Snodgrass, and Carlos Engels for their suggestions. Texas Tech University College of Agricultural Sciences Publication No. T-1-348.
References
1. Anderson, Carl G. "Texas Upland Cotton Grade iR~uctions by Causes and Summary of Discounts, 1980-1989
Crops." Department of Agricultural Economics, Texas J o\qricultural Extension Service, Texas A & M University,
College Station, Texas, 1991, (unpublished manuscript).
2. Bragg, C. K., C. L. Simpson, A. D. Brashears, and R. ,V. Balter, "The Effect of Bark Concentrations on
ProceSSing Efficiency in Rotor Spinning." Beltwide Cptton Production Conferences. 1991 Proceedings, Q:Jt:tm
: Enqlneering and Cotton Ginning Conferences, National ! Cotton Council, pp. 986-989.
13• Brashears, Alan. "F.Y. 1984 Annual Report of roreign Matter Reduction in stripper Harvested cotton." OSDA-ARs, LUbbock, TX, (unpublished manuscript).
j
;. . Brashears, Alan. "F. Y. 1985 Annual Report of I OU:1gn Matter Reduction in stripper Harvested cotton."
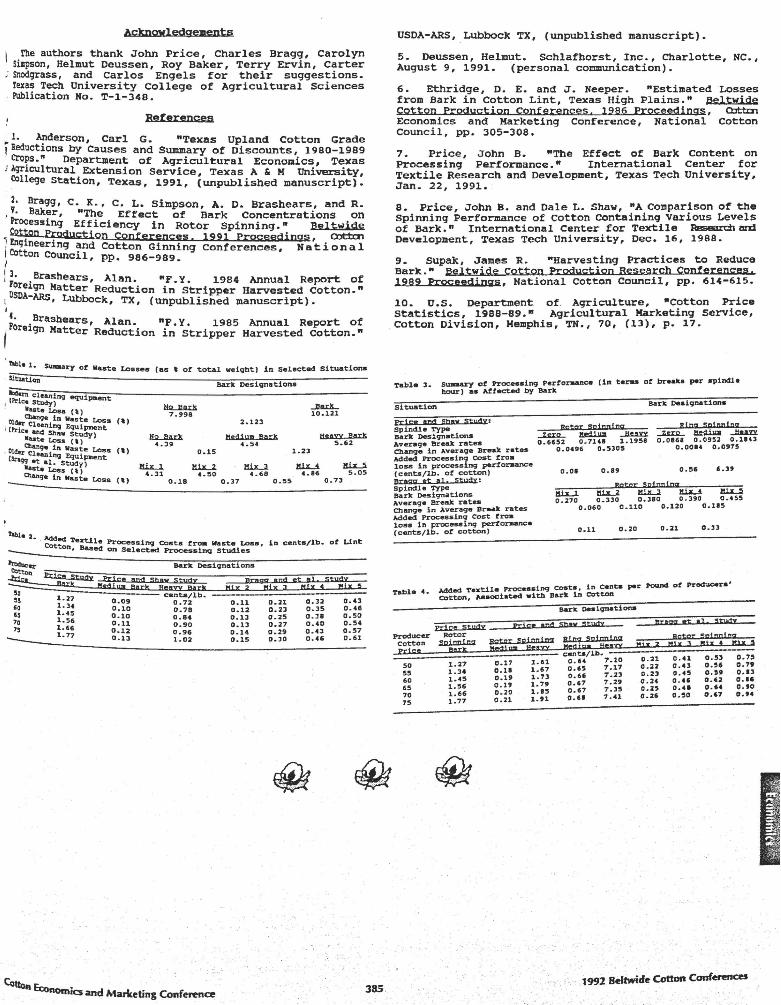
!able 1. su.aa.ry of Maste Losses (as t or total weigbt) in Sel.ected Situations
iitOoUon
~ cloanlnq ~1_nt , (Prio. Study) , Vuto Lo ... (t)
(t)
~ 7.998
Bark Designations
2.123
~ 10.121
01 Cbanqe in Was te Loss i C.:r Chanlnq l:qulP111ent
CO and Shaw Study) -ute Loss (tl
Olc!.r Cbanqe in Waste Loss
H2....IIlI.rk 4.39
MediUM Bark 4.54
HeAVY Bork 5.62
(t) 0.15 1.23 ' cen Clean1nq EqulP10ent 99 et al. StUdy) • .. te Loss 1')
HiLl. 4.31
IUx...2. !U.x.....J. IUltJ. ~ Cllanqe in Was t. Loss
4.50 4.68 4 .. 86 5.05 0.37 0.55 ' 0.73 (t) 0.18
!abl. 2. = Textile Processlrt9 Costa t'ra. Waste Loam, in cent_/lb .. ot Unt D, Baaed on Selected. Proces.1ng Studies
-------------------------~~~~~~~----------------~a: Bark Desiqnations
~-=:;"~I!J::~iC~:~_, :;~tu~~~_~Pr~i",,~ .. ~a~n~lI~:;~h~'n~':;t~U~d§Y~:~gB~r~asm~~"n~s:I~~~t~.l~S~tu~rty~~ _ .:::- ~k llfMiwa BArls !:!~nJ.ork 'UX i jux ijlfii 1 iiI. , " 1.27 0.09 ce~~~lb. 0.11 o.n 0.32 0.43 '0 1.34 O.lD 0.78 0.12 0.23 D.35 0 . 46 " 1.'5 D.l0 0.84 0.13 0.25 0 . 38 0 . 50 '0 1 .. 56 0.11 0 .. 90 0 .. 13 Q .. 27 0.40 0 .. 54 7, 1... 0.12 0.9, 0.14 o.n O.U 0.57 __
1.17 0 .. 13 1.,02 0 .. 15 0.30 0.46 0 .. 61
-------------------------------------------
". '
Couot.~- . -....vnt1CS and Marketilt1; Confeftnce 385 ,
USDA-ARS, Lubbock TX, (unpublished manuscript).
5. Deussen, Helmut. Schlafhorst, Inc., Charlotte, NC., August 9, 1991. (personal communication).
6. Ethridge, D. E. and J. Neeper. "Estimated Losses from Bark in Cotton Lint, Texas High Plains." Beltwide Cotton Production Conferences, 1986 Proceedings, ~ Economics and Marketing Conference, National Cotton Council, pp. 305-308.
7. Price, John B. "The Effect: of Bar" content on Processing Performance." International Center for Textile Research and Development, Texas Tech University, Jan. 22, 1991.
8. Price, John B. and Dale L. Shaw, "A. Comparison o~ the spinning Performance of cotton contain~ng various Levels of Bar"." International Center for Textile RI!searc:h an::l Development, Texas Tech University, Dec. 16, 1988.
9. Supak, James R. "Harvesting Practices to Reduce Bark." Beltwide cotton Production Research conferences. 1989 Prpceedings, National Cotton Council, pp. 614-615.
10. U.S. Department of. Agriculture, "Cotton Price statistics, 1988-89." Agricultural Marketing Service, cotton Division, Memphis, TN., 70, (13), p. 17.
'l'Ilble 3. swaary ot ~ .. ing Pert=-nce (1n tor.JI at breaka per ~1ncSle hour) •• Affected by Bark
Situation Bark oealqnat1ons
pr1 Gft Ind ShIV study: spineSl. 'l'Yl>" Bark Designations Averag_ 8reak rat ••
Bgtor spinnins Ring :;plnnfng ~ ~ .Ji4,Uy ~ ~ ..lIUrt 0.'U2 0.7148 1.1958 0.0861 0.0~52 0.1143
o.on. 0.5305 D. 0014 D.0975 Change in Average Break rates Added Processing cost ~ro. loss in processing pedoraance (cento/lb. ot catton) Drltgg ct ,1 StudY: spindle '1"YPe Bark o.sign.tion. Averaq. Break rates Chanqe in Average Sraall: rat .. Added Processing east troll loss 1n processinq pertonaance (cento/lb. ot catton)
EI.:ica Sl;,R,Iib: pr:jee en" Producer Rotor
=~"P;:~ cotton ~ £riSn Bork
1.27 0.17 1.61 50 55 1.34 0.11 1.'7
1.'5 O.lf 1.73 .0 1.5' D.19 1.79 65
0.20 1.,5 70 1.66
0.21 1.91 75 1.77
0.08 0.89 0.55 6 . 39
Botor 59 f cn I as I!.1x..l. lI1L.l IIJ.J<.J. IUltJ. ~ 0.270 0.330 0.380 0.390 0 ... 55
0.060 0 .. 110 0.120 O.lIS
O.ll o.u O.ll
Sh«y :study =Igg: .t 11 :stlAdx
II' rtO .-;n1nnfnq Rotc: 5p'nnfng
;;UY;- !lIlI:O: ZUI; ~ ~il; J S~Z S I!~~ ~ c.nU/lb ..
0 . 64 7.1D 0.21 0 . 41 D.!ll 0.'5 0.22 0.43 0.56 0.79 O.U 7.17
7.23 0.2l 0 . '5 0.5e 0.1l 0.66 0.Z4 O.U O •• Z 0.15 ' .29 0.67 o.n 0 . " D.U 0.'0 0.67 7.35 cr.n 0.'. 7 •• 1 0.26 0.50 0.61


![Egyptian Journal of Chemistry - ejchem.journals.ekb.eg...solution of chicken feather and dyeing of modified cotton with alkaline extraction of acacia bark [13]. ... irradiated-chitosan](https://static.fdocuments.in/doc/165x107/606542af5ff3041d6c578f7f/egyptian-journal-of-chemistry-solution-of-chicken-feather-and-dyeing-of-modified.jpg)