Brown Advisory Growth Equity Fund Schedule of Investments ...
61
Brown Advisory Growth Equity Fund Schedule of Investments September 30, 2020 (Unaudited) Shares Security Description Value $ Common Stocks - 93.9% Communication Services - 9.3% 72,872 Alphabet, Inc. - Class C* 107,092,691 967,413 Electronic Arts, Inc.* 126,160,330 435,142 Match Group, Inc.* 48,148,462 281,401,483 Consumer Discretionary - 10.8% 200,026 Alibaba Group Holding, Ltd. ADR* 58,803,644 44,169 Amazon.com, Inc.* 139,076,255 226,944 Lululemon Athletica, Inc.* 74,748,545 51,851 Shopify, Inc.* 53,042,018 325,670,462 Consumer Staples - 7.7% 1,057,239 Brown-Forman Corp. 79,631,241 204,636 Costco Wholesale Corp. 72,645,780 361,088 Estee Lauder Companies, Inc. 78,807,456 231,084,477 Health Care - 21.5% 455,376 Danaher Corp. 98,056,114 230,960 DexCom, Inc.* 95,208,641 1,063,634 Edwards Lifesciences Corp.* 84,899,266 177,421 Intuitive Surgical, Inc.* 125,887,296 289,108 Thermo Fisher Scientific, Inc. 127,646,964 701,504 Zoetis, Inc. 116,007,717 647,705,998 Industrials - 11.4% 289,108 Cintas Corp. 96,223,815 1,123,865 Fortive Corp. 85,649,752 403,027 L3Harris Technologies, Inc. 68,450,106 232,298 Roper Technologies, Inc. 91,783,263 342,106,936 Information Technology - 29.8% 142,770 Adobe, Inc.* 70,018,691 413,437 Autodesk, Inc.* 95,508,081 2,113,734 Genpact, Ltd. 82,329,939 314,539 Intuit, Inc. 102,605,767 342,052 MasterCard, Inc. 115,671,725 637,853 Microsoft Corp. 134,159,622 522,299 NXP Semiconductors NV 65,188,138 678,007 PayPal Holdings, Inc.* 133,587,719 388,155 salesforce.com, Inc.* 97,551,115 896,620,797 Materials - 3.4% 149,016 Sherwin-Williams Co. 103,825,408 Total Common Stocks (Cost $1,293,429,337) 2,828,415,561 Real Estate Investment Trusts - 3.7% 348,298 SBA Communications Corp. 110,925,947 Total Real Estate Investment Trusts (Cost $32,185,080) 110,925,947 Short-Term Investments - 2.4% Money Market Funds - 2.4%
Transcript of Brown Advisory Growth Equity Fund Schedule of Investments ...

Brown Advisory Growth Equity Fund Schedule of Investments September 30, 2020 (Unaudited)
Shares Security Description Value $ Common Stocks - 93.9% Communication Services - 9.3% 72,872 Alphabet, Inc. - Class C* 107,092,691 967,413 Electronic Arts, Inc.* 126,160,330 435,142 Match Group, Inc.* 48,148,462 281,401,483 Consumer Discretionary - 10.8% 200,026 Alibaba Group Holding, Ltd. ADR* 58,803,644 44,169 Amazon.com, Inc.* 139,076,255 226,944 Lululemon Athletica, Inc.* 74,748,545 51,851 Shopify, Inc.* 53,042,018 325,670,462 Consumer Staples - 7.7% 1,057,239 Brown-Forman Corp. 79,631,241 204,636 Costco Wholesale Corp. 72,645,780 361,088 Estee Lauder Companies, Inc. 78,807,456 231,084,477 Health Care - 21.5% 455,376 Danaher Corp. 98,056,114 230,960 DexCom, Inc.* 95,208,641 1,063,634 Edwards Lifesciences Corp.* 84,899,266 177,421 Intuitive Surgical, Inc.* 125,887,296 289,108 Thermo Fisher Scientific, Inc. 127,646,964 701,504 Zoetis, Inc. 116,007,717 647,705,998 Industrials - 11.4% 289,108 Cintas Corp. 96,223,815 1,123,865 Fortive Corp. 85,649,752 403,027 L3Harris Technologies, Inc. 68,450,106 232,298 Roper Technologies, Inc. 91,783,263 342,106,936 Information Technology - 29.8% 142,770 Adobe, Inc.* 70,018,691 413,437 Autodesk, Inc.* 95,508,081 2,113,734 Genpact, Ltd. 82,329,939 314,539 Intuit, Inc. 102,605,767 342,052 MasterCard, Inc. 115,671,725 637,853 Microsoft Corp. 134,159,622 522,299 NXP Semiconductors NV 65,188,138 678,007 PayPal Holdings, Inc.* 133,587,719 388,155 salesforce.com, Inc.* 97,551,115 896,620,797 Materials - 3.4% 149,016 Sherwin-Williams Co. 103,825,408 Total Common Stocks (Cost $1,293,429,337) 2,828,415,561 Real Estate Investment Trusts - 3.7% 348,298 SBA Communications Corp. 110,925,947 Total Real Estate Investment Trusts (Cost $32,185,080) 110,925,947 Short-Term Investments - 2.4% Money Market Funds - 2.4%
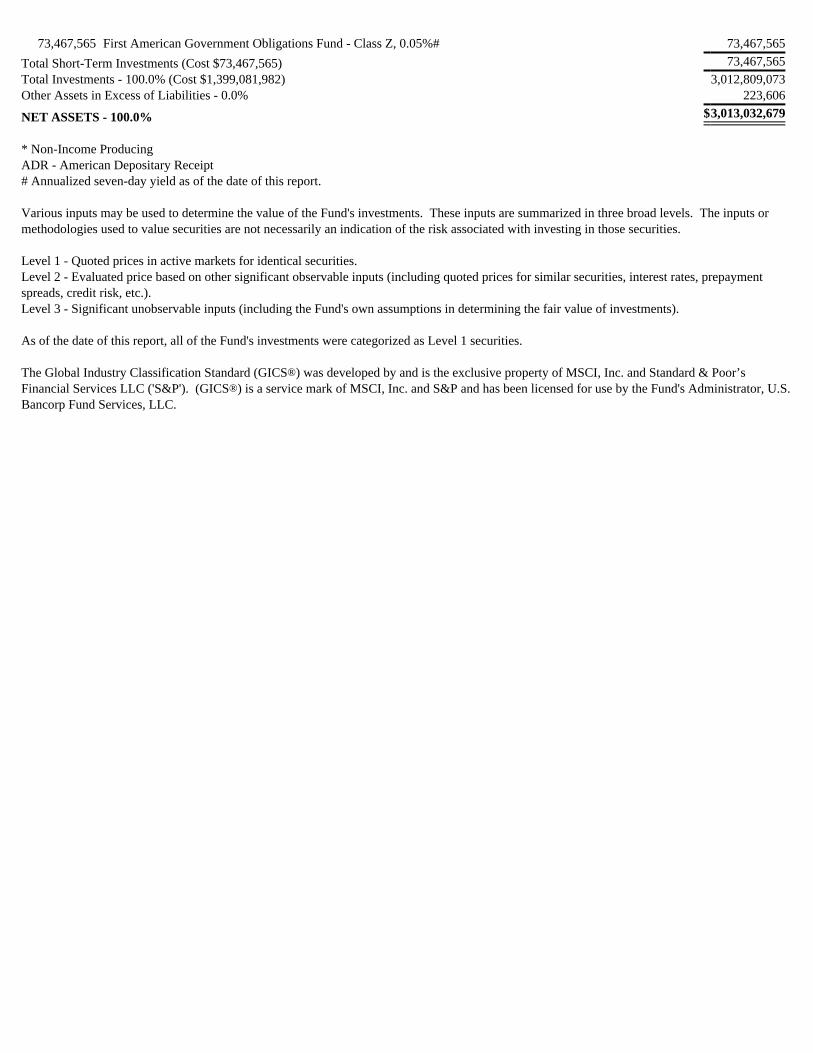
73,467,565 First American Government Obligations Fund - Class Z, 0.05%# 73,467,565 Total Short-Term Investments (Cost $73,467,565) 73,467,565 Total Investments - 100.0% (Cost $1,399,081,982) 3,012,809,073 Other Assets in Excess of Liabilities - 0.0% 223,606
NET ASSETS - 100.0% $3,013,032,679
* Non-Income Producing ADR - American Depositary Receipt # Annualized seven-day yield as of the date of this report. Various inputs may be used to determine the value of the Fund's investments. These inputs are summarized in three broad levels. The inputs ormethodologies used to value securities are not necessarily an indication of the risk associated with investing in those securities. Level 1 - Quoted prices in active markets for identical securities.Level 2 - Evaluated price based on other significant observable inputs (including quoted prices for similar securities, interest rates, prepaymentspreads, credit risk, etc.).Level 3 - Significant unobservable inputs (including the Fund's own assumptions in determining the fair value of investments). As of the date of this report, all of the Fund's investments were categorized as Level 1 securities. The Global Industry Classification Standard (GICS®) was developed by and is the exclusive property of MSCI, Inc. and Standard & Poor’s Financial Services LLC ('S&P'). (GICS®) is a service mark of MSCI, Inc. and S&P and has been licensed for use by the Fund's Administrator, U.S.Bancorp Fund Services, LLC.

Brown Advisory Flexible Equity Fund Schedule of Investments September 30, 2020 (Unaudited)
Shares Security Description Value $ Common Stocks - 94.5% Communication Services - 10.9% 5,631 Alphabet, Inc. - Class A* 8,252,794 11,717 Alphabet, Inc. - Class C* 17,219,303 96,970 Facebook, Inc.* 25,396,443 61,691 Walt Disney Co. 7,654,619 58,523,159 Consumer Discretionary - 18.2% 62,630 Alibaba Group Holding, Ltd. ADR* 18,411,968 3,669 Amazon.com, Inc.* 11,552,690 7,944 Booking Holdings, Inc.* 13,589,642 40,508 Bright Horizons Family Solutions, Inc.* 6,158,836 174,470 CarMax, Inc.* 16,035,538 54,924 Dollar Tree, Inc.* 5,016,758 138,605 Lowe's Companies, Inc. 22,989,025 72,134 TJX Companies, Inc. 4,014,257 97,768,714 Consumer Staples - 4.9% 217,911 Conagra Brands, Inc. 7,781,602 237,786 Hain Celestial Group, Inc.* 8,156,060 412,732 Nomad Foods, Ltd.* 10,516,411 26,454,073 Energy - 1.9% 552,274 Kinder Morgan, Inc. 6,809,538 278,951 Suncor Energy, Inc. 3,411,571 10,221,109 Financials - 12.6% 85,639 Ameriprise Financial, Inc. 13,197,826 479,421 Bank of America Corp. 11,549,252 87,719 Berkshire Hathaway, Inc.* 18,678,884 88,874 Blackstone Group, Inc. 4,639,223 116,195 JPMorgan Chase & Co. 11,186,092 249,805 KKR & Co., Inc. 8,578,304 67,829,581 Health Care - 9.8% 57,394 Agilent Technologies, Inc. 5,793,350 32,015 Anthem, Inc. 8,598,909 203,640 Edwards Lifesciences Corp.* 16,254,545 65,302 Merck & Co., Inc. 5,416,801 53,479 UnitedHealth Group, Inc. 16,673,148 52,736,753 Industrials - 6.9% 60,954 Canadian National Railway Co. 6,489,163 225,068 Carrier Global Corp. 6,873,577 28,852 General Dynamics Corp. 3,993,982 58,306 Otis Worldwide Corp. 3,639,461 130,018 Stericycle, Inc.* 8,198,935 44,264 United Rentals, Inc.* 7,724,068 36,919,186 Information Technology - 29.3% 43,780 Accenture PLC 9,893,842 61,344 Analog Devices, Inc. 7,161,299
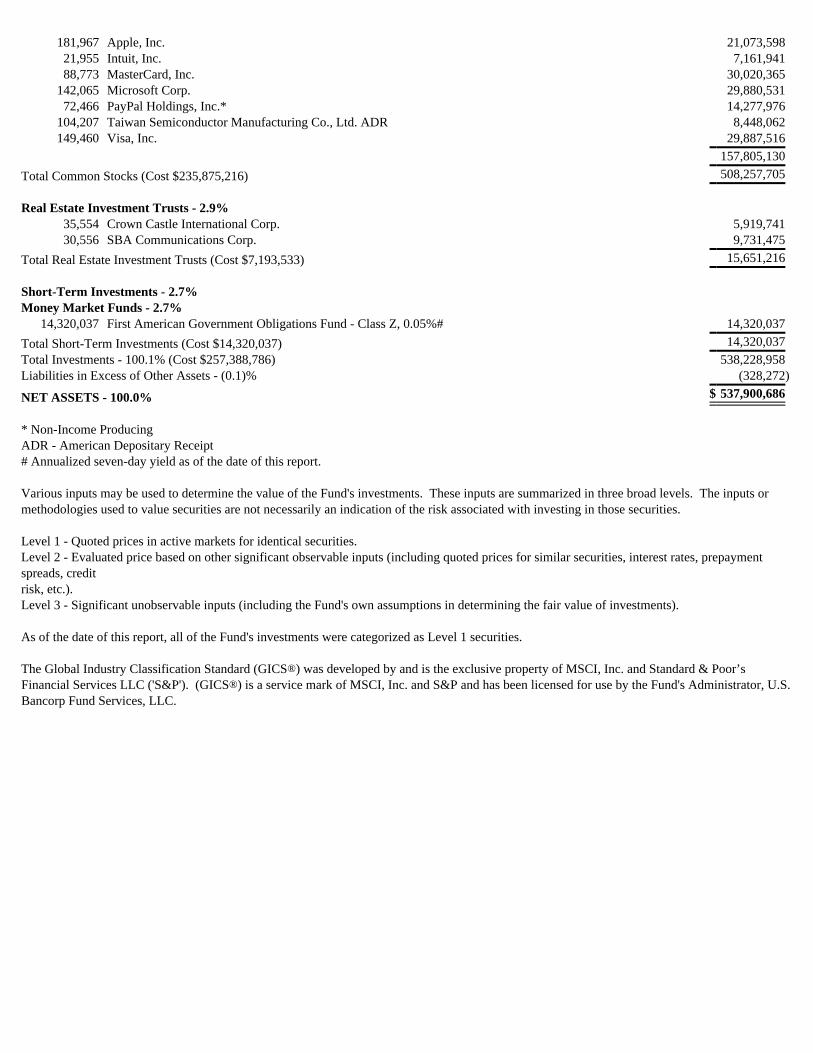
181,967 Apple, Inc. 21,073,598 21,955 Intuit, Inc. 7,161,941 88,773 MasterCard, Inc. 30,020,365 142,065 Microsoft Corp. 29,880,531 72,466 PayPal Holdings, Inc.* 14,277,976 104,207 Taiwan Semiconductor Manufacturing Co., Ltd. ADR 8,448,062 149,460 Visa, Inc. 29,887,516 157,805,130 Total Common Stocks (Cost $235,875,216) 508,257,705 Real Estate Investment Trusts - 2.9% 35,554 Crown Castle International Corp. 5,919,741 30,556 SBA Communications Corp. 9,731,475 Total Real Estate Investment Trusts (Cost $7,193,533) 15,651,216 Short-Term Investments - 2.7% Money Market Funds - 2.7% 14,320,037 First American Government Obligations Fund - Class Z, 0.05%# 14,320,037 Total Short-Term Investments (Cost $14,320,037) 14,320,037 Total Investments - 100.1% (Cost $257,388,786) 538,228,958 Liabilities in Excess of Other Assets - (0.1)% (328,272)
NET ASSETS - 100.0% $ 537,900,686
* Non-Income Producing ADR - American Depositary Receipt # Annualized seven-day yield as of the date of this report. Various inputs may be used to determine the value of the Fund's investments. These inputs are summarized in three broad levels. The inputs ormethodologies used to value securities are not necessarily an indication of the risk associated with investing in those securities. Level 1 - Quoted prices in active markets for identical securities. Level 2 - Evaluated price based on other significant observable inputs (including quoted prices for similar securities, interest rates, prepaymentspreads, creditrisk, etc.). Level 3 - Significant unobservable inputs (including the Fund's own assumptions in determining the fair value of investments). As of the date of this report, all of the Fund's investments were categorized as Level 1 securities. The Global Industry Classification Standard (GICS®) was developed by and is the exclusive property of MSCI, Inc. and Standard & Poor’s Financial Services LLC ('S&P'). (GICS®) is a service mark of MSCI, Inc. and S&P and has been licensed for use by the Fund's Administrator, U.S.Bancorp Fund Services, LLC.

Brown Advisory Equity Income Fund Schedule of Investments September 30, 2020 (Unaudited)
Shares Security Description Value $ Common Stocks - 90.1% Communication Services - 2.5% 42,345 Comcast Corp. 1,958,880 Consumer Discretionary - 14.4% 15,871 Best Buy Co., Inc. 1,766,284 14,173 Hasbro, Inc. 1,172,390 7,381 Home Depot, Inc. 2,049,777 10,967 Lowe's Companies, Inc. 1,818,987 10,829 McDonald's Corp. 2,376,857 12,943 Target Corp. 2,037,487 11,221,782 Consumer Staples - 8.6% 19,111 Altria Group, Inc. 738,449 37,424 Coca-Cola Co. 1,847,623 19,821 Philip Morris International, Inc. 1,486,377 37,216 Reynolds Consumer Products, Inc. 1,139,554 25,071 Unilever NV ADR 1,514,288 6,726,291 Energy - 2.7% 111,597 Kinder Morgan, Inc. 1,375,991 59,151 Suncor Energy, Inc. 723,417 2,099,408 Financials - 14.7% 12,908 Ameriprise Financial, Inc. 1,989,252 61,525 Bank of America Corp. 1,482,137 28,410 Blackstone Group, Inc. 1,483,002 19,353 Cincinnati Financial Corp. 1,508,953 8,178 Erie Indemnity Co. 1,719,670 20,237 JPMorgan Chase & Co. 1,948,216 10,413 T. Rowe Price Group, Inc. 1,335,155 11,466,385 Health Care - 16.9% 14,173 AbbVie, Inc. 1,241,413 12,544 Gilead Sciences, Inc. 792,655 15,749 Johnson & Johnson 2,344,711 17,880 Medtronic PLC 1,858,090 40,508 Merck & Co., Inc. 3,360,139 24,187 Novartis AG ADR 2,103,301 4,851 UnitedHealth Group, Inc. 1,512,396 13,212,705 Industrials - 4.5% 8,039 Canadian National Railway Co. 855,832 7,866 General Dynamics Corp. 1,088,890 7,987 Otis Worldwide Corp. 498,549 18,348 Raytheon Technologies Corp. 1,055,744 3,499,015 Information Technology - 21.7% 6,619 Accenture PLC 1,495,828 7,000 Analog Devices, Inc. 817,180 39,451 Apple, Inc. 4,568,820 15,836 Automatic Data Processing, Inc. 2,208,964 64,574 Cisco Systems, Inc. 2,543,570

25,400 Microsoft Corp. 5,342,382 16,976,744 Materials - 4.1% 22,524 Dow, Inc. 1,059,754 8,888 Linde PLC 2,116,500 3,176,254 Total Common Stocks (Cost $39,962,613) 70,337,464 Preferred Stocks - 1.6% Financials - 0.6% 8,913 KKR & Co., Inc. - Series C, 6.00%* 463,476 Health Care - 1.0% 15,213 Becton, Dickinson & Co.^ 800,964 Total Preferred Stocks (Cost $1,237,963) 1,264,440 Real Estate Investment Trusts - 4.6% 8,940 American Tower Corp. 2,161,066 21,883 W.P. Carey, Inc. 1,425,896 Total Real Estate Investment Trusts (Cost $2,167,487) 3,586,962 Short-Term Investments - 3.8% Money Market Funds - 3.8% 3,007,324 First American Government Obligations Fund - Class Z, 0.05%# 3,007,324 Total Short-Term Investments (Cost $3,007,324) 3,007,324 Total Investments - 100.1% (Cost $46,375,387) 78,196,190 Liabilities in Excess of Other Assets - (0.1)% (80,405)
NET ASSETS - 100.0% $ 78,115,785
ADR - American Depositary Receipt * Non-Income Producing ^ Each depositary share represents 1/20th interest in a share of Becton, Dickinson and Co. 6.00% Mandatory Convertible Preferred Stock, Series B.Each outstanding depositary share will automatically convert on June 1, 2023 into a number of shares of common stock. Refer to the company'sfilings at sec.gov for additional information.# Annualized seven-day yield as of the date of this report. Various inputs may be used to determine the value of the Fund's investments. These inputs are summarized in three broad levels. The inputs ormethodologies used to value securities are not necessarily an indication of the risk associated with investing in those securities. Level 1 - Quoted prices in active markets for identical securities. Level 2 - Evaluated price based on other significant observable inputs (including quoted prices for similar securities, interest rates, prepaymentspreads, credit risk, etc.).Level 3 - Significant unobservable inputs (including the Fund's own assumptions in determining the fair value of investments). As of the date of this report, all of the Fund's investments were categorized as Level 1 securities. The Global Industry Classification Standard (GICS®) was developed by and is the exclusive property of MSCI, Inc. and Standard & Poor’s Financial Services LLC ('S&P'). (GICS®) is a service mark of MSCI, Inc. and S&P and has been licensed for use by the Fund's Administrator, U.S.Bancorp Fund Services, LLC.
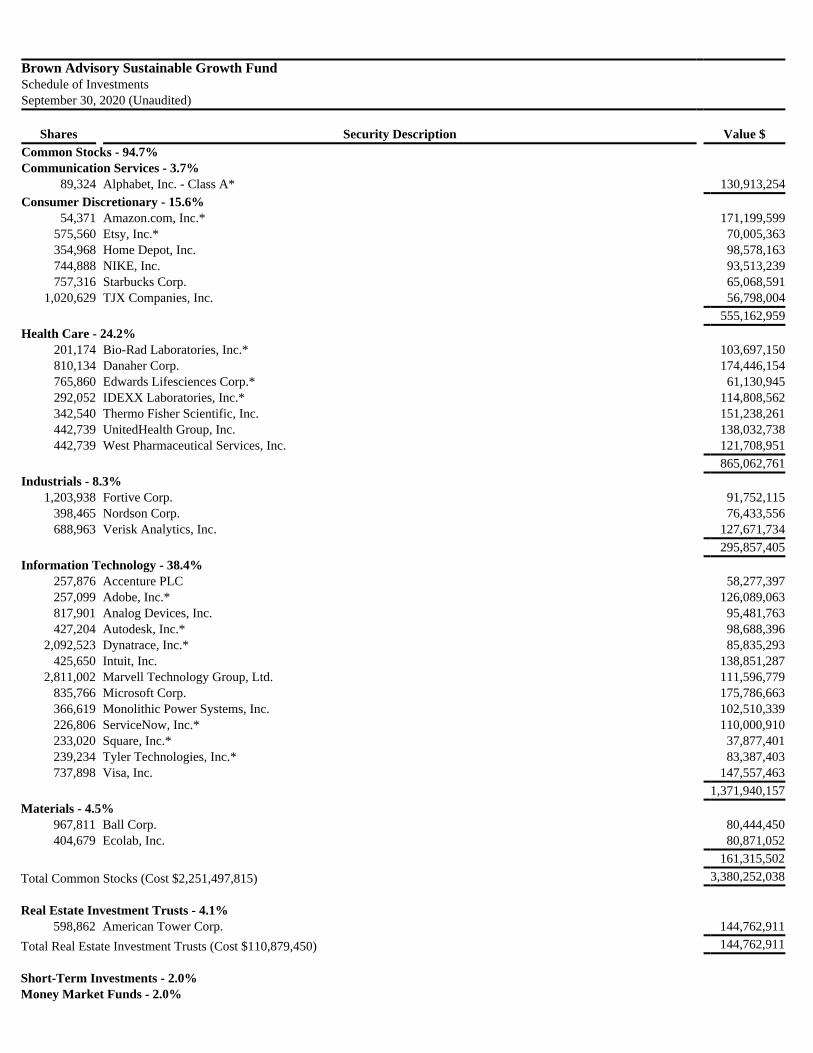
Brown Advisory Sustainable Growth Fund Schedule of Investments September 30, 2020 (Unaudited)
Shares Security Description Value $ Common Stocks - 94.7% Communication Services - 3.7% 89,324 Alphabet, Inc. - Class A* 130,913,254 Consumer Discretionary - 15.6% 54,371 Amazon.com, Inc.* 171,199,599 575,560 Etsy, Inc.* 70,005,363 354,968 Home Depot, Inc. 98,578,163 744,888 NIKE, Inc. 93,513,239 757,316 Starbucks Corp. 65,068,591 1,020,629 TJX Companies, Inc. 56,798,004 555,162,959 Health Care - 24.2% 201,174 Bio-Rad Laboratories, Inc.* 103,697,150 810,134 Danaher Corp. 174,446,154 765,860 Edwards Lifesciences Corp.* 61,130,945 292,052 IDEXX Laboratories, Inc.* 114,808,562 342,540 Thermo Fisher Scientific, Inc. 151,238,261 442,739 UnitedHealth Group, Inc. 138,032,738 442,739 West Pharmaceutical Services, Inc. 121,708,951 865,062,761 Industrials - 8.3% 1,203,938 Fortive Corp. 91,752,115 398,465 Nordson Corp. 76,433,556 688,963 Verisk Analytics, Inc. 127,671,734 295,857,405 Information Technology - 38.4% 257,876 Accenture PLC 58,277,397 257,099 Adobe, Inc.* 126,089,063 817,901 Analog Devices, Inc. 95,481,763 427,204 Autodesk, Inc.* 98,688,396 2,092,523 Dynatrace, Inc.* 85,835,293 425,650 Intuit, Inc. 138,851,287 2,811,002 Marvell Technology Group, Ltd. 111,596,779 835,766 Microsoft Corp. 175,786,663 366,619 Monolithic Power Systems, Inc. 102,510,339 226,806 ServiceNow, Inc.* 110,000,910 233,020 Square, Inc.* 37,877,401 239,234 Tyler Technologies, Inc.* 83,387,403 737,898 Visa, Inc. 147,557,463 1,371,940,157 Materials - 4.5% 967,811 Ball Corp. 80,444,450 404,679 Ecolab, Inc. 80,871,052 161,315,502 Total Common Stocks (Cost $2,251,497,815) 3,380,252,038 Real Estate Investment Trusts - 4.1% 598,862 American Tower Corp. 144,762,911 Total Real Estate Investment Trusts (Cost $110,879,450) 144,762,911 Short-Term Investments - 2.0% Money Market Funds - 2.0%
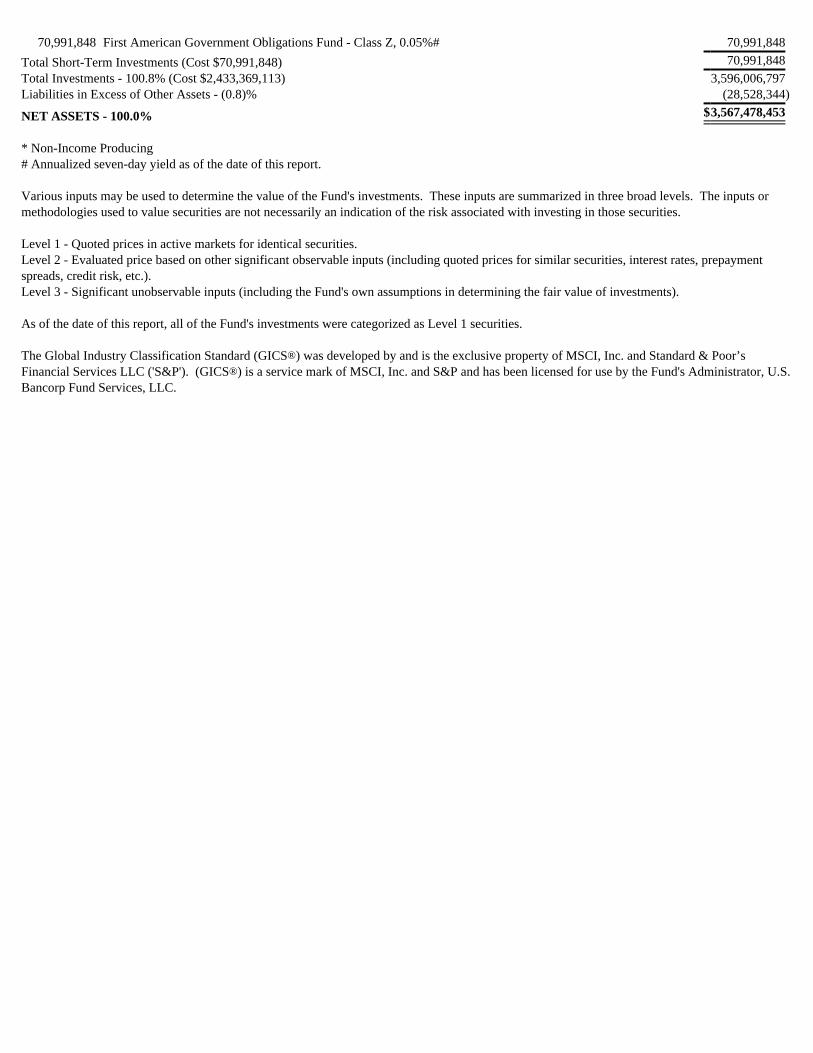
70,991,848 First American Government Obligations Fund - Class Z, 0.05%# 70,991,848 Total Short-Term Investments (Cost $70,991,848) 70,991,848 Total Investments - 100.8% (Cost $2,433,369,113) 3,596,006,797 Liabilities in Excess of Other Assets - (0.8)% (28,528,344)
NET ASSETS - 100.0% $3,567,478,453
* Non-Income Producing # Annualized seven-day yield as of the date of this report. Various inputs may be used to determine the value of the Fund's investments. These inputs are summarized in three broad levels. The inputs ormethodologies used to value securities are not necessarily an indication of the risk associated with investing in those securities. Level 1 - Quoted prices in active markets for identical securities.Level 2 - Evaluated price based on other significant observable inputs (including quoted prices for similar securities, interest rates, prepaymentspreads, credit risk, etc.).Level 3 - Significant unobservable inputs (including the Fund's own assumptions in determining the fair value of investments). As of the date of this report, all of the Fund's investments were categorized as Level 1 securities. The Global Industry Classification Standard (GICS®) was developed by and is the exclusive property of MSCI, Inc. and Standard & Poor’s Financial Services LLC ('S&P'). (GICS®) is a service mark of MSCI, Inc. and S&P and has been licensed for use by the Fund's Administrator, U.S.Bancorp Fund Services, LLC.

Brown Advisory Mid-Cap Growth Fund Schedule of Investments September 30, 2020 (Unaudited)
Shares Security Description Value $ Common Stocks - 95.3% Communication Services - 11.6% 23,579 American Well Corp.* 698,882 24,465 Electronic Arts, Inc.* 3,190,481 11,749 GoodRx Holdings, Inc.* 653,244 14,662 Liberty Broadband Corp.* 2,079,218 23,658 Live Nation Entertainment, Inc.* 1,274,693 27,335 Match Group, Inc.* 3,024,618 85,292 Pinterest, Inc.* 3,540,471 217,420 Zynga, Inc.* 1,982,870 16,444,477 Consumer Discretionary - 9.8% 14,076 Bright Horizons Family Solutions, Inc.* 2,140,115 25,638 Etsy, Inc.* 3,118,350 5,027 Lululemon Athletica, Inc.* 1,655,743 71,803 National Vision Holdings, Inc.* 2,745,747 14,835 Ross Stores, Inc. 1,384,402 33,677 Shift4 Payments, Inc.* 1,628,620 5,839 Ulta Beauty, Inc.* 1,307,819 13,980,796 Consumer Staples - 2.2% 14,830 Brown-Forman Corp. 1,116,996 11,562 Casey's General Stores, Inc. 2,053,989 3,170,985 Financials - 1.3% 51,862 KKR & Co., Inc. 1,780,941 Health Care - 19.2% 8,423 Ascendis Pharma A/S ADR* 1,299,838 14,830 Biohaven Pharmaceutical Holding Co. Ltd.* 964,098 5,614 Bio-Rad Laboratories, Inc.* 2,893,792 9,803 Blueprint Medicines Corp.* 908,738 31,419 Bruker Corp. 1,248,905 33,179 Catalent, Inc.* 2,842,113 11,981 Charles River Laboratories International, Inc.* 2,713,097 5,168 Cooper Companies, Inc. 1,742,236 4,273 DexCom, Inc.* 1,761,459 40,552 Edwards Lifesciences Corp.* 3,236,861 6,368 Global Blood Therapeutics, Inc.* 351,132 22,370 HealthEquity, Inc.* 1,149,147 7,289 Inari Medical, Inc.* 503,087 7,289 Neurocrine Biosciences, Inc.* 700,910 19,729 Oak Street Health, Inc.* 1,054,318 11,420 Teleflex, Inc. 3,887,595 27,257,326 Industrials - 17.8% 19,465 BWX Technologies, Inc. 1,096,074 5,614 Cintas Corp. 1,868,508 49,014 Dun & Bradstreet Holdings, Inc.* 1,257,699 85,460 IAA, Inc.* 4,449,902 8,714 IDEX Corp. 1,589,521 30,330 IHS Markit Ltd. 2,381,209 17,008 SiteOne Landscape Supply, Inc.* 2,074,126
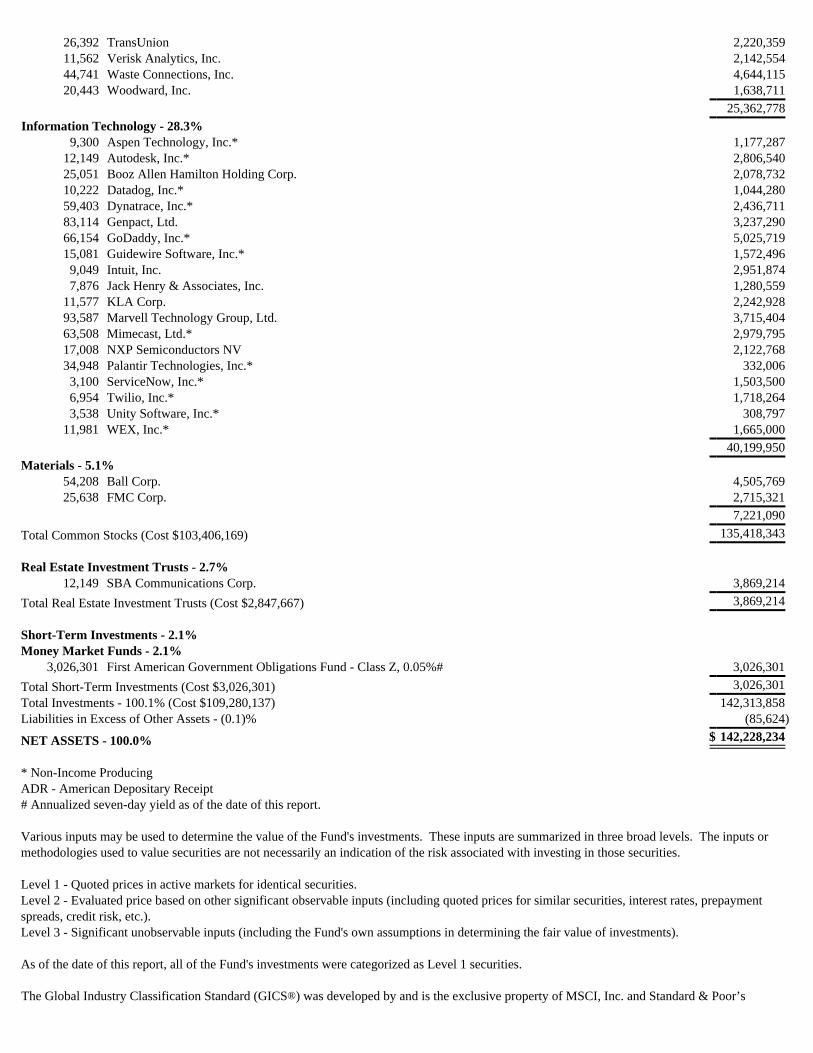
26,392 TransUnion 2,220,359 11,562 Verisk Analytics, Inc. 2,142,554 44,741 Waste Connections, Inc. 4,644,115 20,443 Woodward, Inc. 1,638,711 25,362,778 Information Technology - 28.3% 9,300 Aspen Technology, Inc.* 1,177,287 12,149 Autodesk, Inc.* 2,806,540 25,051 Booz Allen Hamilton Holding Corp. 2,078,732 10,222 Datadog, Inc.* 1,044,280 59,403 Dynatrace, Inc.* 2,436,711 83,114 Genpact, Ltd. 3,237,290 66,154 GoDaddy, Inc.* 5,025,719 15,081 Guidewire Software, Inc.* 1,572,496 9,049 Intuit, Inc. 2,951,874 7,876 Jack Henry & Associates, Inc. 1,280,559 11,577 KLA Corp. 2,242,928 93,587 Marvell Technology Group, Ltd. 3,715,404 63,508 Mimecast, Ltd.* 2,979,795 17,008 NXP Semiconductors NV 2,122,768 34,948 Palantir Technologies, Inc.* 332,006 3,100 ServiceNow, Inc.* 1,503,500 6,954 Twilio, Inc.* 1,718,264 3,538 Unity Software, Inc.* 308,797 11,981 WEX, Inc.* 1,665,000 40,199,950 Materials - 5.1% 54,208 Ball Corp. 4,505,769 25,638 FMC Corp. 2,715,321 7,221,090 Total Common Stocks (Cost $103,406,169) 135,418,343 Real Estate Investment Trusts - 2.7% 12,149 SBA Communications Corp. 3,869,214 Total Real Estate Investment Trusts (Cost $2,847,667) 3,869,214 Short-Term Investments - 2.1% Money Market Funds - 2.1% 3,026,301 First American Government Obligations Fund - Class Z, 0.05%# 3,026,301 Total Short-Term Investments (Cost $3,026,301) 3,026,301 Total Investments - 100.1% (Cost $109,280,137) 142,313,858 Liabilities in Excess of Other Assets - (0.1)% (85,624)
NET ASSETS - 100.0% $ 142,228,234
* Non-Income ProducingADR - American Depositary Receipt# Annualized seven-day yield as of the date of this report. Various inputs may be used to determine the value of the Fund's investments. These inputs are summarized in three broad levels. The inputs ormethodologies used to value securities are not necessarily an indication of the risk associated with investing in those securities. Level 1 - Quoted prices in active markets for identical securities.Level 2 - Evaluated price based on other significant observable inputs (including quoted prices for similar securities, interest rates, prepaymentspreads, credit risk, etc.).Level 3 - Significant unobservable inputs (including the Fund's own assumptions in determining the fair value of investments). As of the date of this report, all of the Fund's investments were categorized as Level 1 securities. The Global Industry Classification Standard (GICS®) was developed by and is the exclusive property of MSCI, Inc. and Standard & Poor’s

Financial Services LLC ('S&P'). (GICS®) is a service mark of MSCI, Inc. and S&P and has been licensed for use by the Fund's Administrator, U.S.Bancorp Fund Services, LLC.

Brown Advisory Small-Cap Growth Fund Schedule of Investments September 30, 2020 (Unaudited)
Shares Security Description Value $ Common Stocks - 91.7% Communication Services - 7.4% 240,813 Cogent Communications Holdings, Inc. 14,460,820 747,053 GCI Liberty, Inc.* 61,228,464 6,447,440 Zynga, Inc.* 58,800,653 134,489,937 Consumer Discretionary - 12.6% 315,061 Bright Horizons Family Solutions, Inc.* 47,901,875 305,344 Chegg, Inc.* 21,813,775 142,831 Choice Hotels International, Inc. 12,277,753 1,139,434 Clarus Corp. 16,088,808 132,594 Etsy, Inc.* 16,127,408 1,074,445 MakeMyTrip, Ltd.* 16,503,475 818,292 National Vision Holdings, Inc.* 31,291,486 707,836 OneSpaWorld Holdings Ltd. 4,600,934 467,658 Progyny, Inc.* 13,763,175 344,281 Stitch Fix, Inc.* 9,340,344 229,771 TopBuild Corp.* 39,219,612 228,928,645 Consumer Staples - 5.1% 164,758 Casey's General Stores, Inc. 29,269,259 1,564,328 Hain Celestial Group, Inc.* 53,656,450 451,898 Simply Good Foods Co.* 9,964,351 92,890,060 Energy - 0.3% 307,655 Cactus, Inc. 5,903,899 Financials - 2.9% 495,738 Ares Management Corp. 20,037,730 116,828 Hamilton Lane, Inc. 7,545,920 1,096,573 Nesco Holdings, Inc.* 4,550,778 376,979 Prosperity Bancshares, Inc. 19,538,822 51,673,250 Health Care - 21.3% 142,097 Acceleron Pharma, Inc.* 15,990,175 273,673 Biohaven Pharmaceutical Holding Co. Ltd.* 17,791,482 253,605 Blueprint Medicines Corp.* 23,509,183 428,469 Bruker Corp. 17,031,643 477,035 Catalent, Inc.* 40,862,818 274,570 Charles River Laboratories International, Inc.* 62,176,377 292,762 Coherus BioSciences, Inc.* 5,369,255 302,353 Encompass Health Corp. 19,646,898 526,645 Establishment Labs Holdings, Inc.* 9,758,732 172,707 FibroGen, Inc.* 7,101,712 185,303 Global Blood Therapeutics, Inc.* 10,217,607 362,963 HealthEquity, Inc.* 18,645,409 141,961 Inari Medical, Inc.* 9,798,148 150,745 Integra LifeSciences Holdings Corp.* 7,118,179 250,891 Iovance Biotherapeutics, Inc.* 8,259,332 1,240,439 NeoGenomics, Inc.* 45,759,795 219,824 Neurocrine Biosciences, Inc.* 21,138,276 85,296 Nevro Corp.* 11,881,733 190,950 Oak Street Health, Inc.* 10,204,368

406,560 OrthoPediatrics Corp.* 18,669,235 152,178 Tabula Rasa HealthCare, Inc.* 6,204,297 387,134,654 Industrials - 14.4% 495,414 BWX Technologies, Inc. 27,896,762 91,607 ESCO Technologies, Inc. 7,379,860 109,015 Hexcel Corp. 3,657,453 1,070,751 IAA, Inc.* 55,754,005 54,676 IDEX Corp. 9,973,449 195,976 John Bean Technologies Corp. 18,008,235 237,243 Knight-Swift Transportation Holdings, Inc. 9,655,790 119,148 Mercury Systems, Inc.* 9,229,204 168,408 MSA Safety, Inc. 22,595,301 346,817 SiteOne Landscape Supply, Inc.* 42,294,333 436,804 Waste Connections, Inc. 45,340,255 117,928 Woodward, Inc. 9,453,109 261,237,756 Information Technology - 26.3% 234,073 Accolade, Inc.* 9,098,418 87,580 Aspen Technology, Inc.* 11,086,752 312,027 BlackLine, Inc.* 27,966,980 139,393 Cabot Microelectronics Corp. 19,906,714 521,123 Dynatrace, Inc.* 21,376,466 310,027 Entegris, Inc. 23,047,407 224,139 Envestnet, Inc.* 17,294,565 1,571,793 EVO Payments, Inc.* 39,059,056 1,603,623 Genpact, Ltd. 62,461,116 82,100 Guidewire Software, Inc.* 8,560,567 915,360 Lattice Semiconductor Corp.* 26,508,826 70,024 Littelfuse, Inc. 12,418,056 196,675 ManTech International Corp. 13,546,974 80,549 MAXIMUS, Inc. 5,510,357 935,983 Mimecast, Ltd.* 43,916,322 893,266 Nuance Communications, Inc.* 29,647,499 567,116 Phreesia, Inc.* 18,221,437 485,606 PROS Holdings, Inc.* 15,510,256 164,049 Sumo Logic, Inc.* 3,576,268 48,603 WEX, Inc.* 6,754,359 765,554 Workiva, Inc.* 42,687,291 1,761,260 Zuora, Inc.* 18,211,428 476,367,114 Materials - 1.4% 140,088 Quaker Chemical Corp. 25,175,215 Total Common Stocks (Cost $1,188,256,546) 1,663,800,530 Private Placements - 0.1% 19,200 Greenspring Global Partners IV-B, L.P.*^† 1,691,450 91,769 Greenspring Global Partners V-B, L.P.*~† 116,221 Total Private Placements (Cost $–) 1,807,671 Real Estate Investment Trusts - 1.7% 230,953 EastGroup Properties, Inc. 29,869,151 Total Real Estate Investment Trusts (Cost $25,034,797) 29,869,151 Short-Term Investments - 6.2% Money Market Funds - 6.2% 113,192,759 First American Government Obligations Fund - Class Z, 0.05%# 113,192,759 Total Short-Term Investments (Cost $113,192,759) 113,192,759 Total Investments - 99.7% (Cost $1,326,484,102) 1,808,670,111

Other Assets in Excess of Liabilities - 0.3% 6,233,063
NET ASSETS - 100.0% $1,814,903,174
* Non-Income Producing^ Security is exempt from registration under Regulation D of the Securities Act of 1933. Security was acquired from February 2008 to April 2018 aspart of a $2,000,000 capital commitment. As of the date of this report, $1,920,000 of the capital commitment has been fulfilled by the Fund.~ Security is exempt from registration under Regulation D of the Securities Act of 1933. Security was acquired from October 2012 to August 2018as part of a $100,000 capital commitment. As of the date of this report, $91,000 of the capital commitment has been fulfilled by the Fund.† These securities are being fair valued, using significant unobservable inputs (Level 3), under the supervision of the Board of Trustees. Further,they may not be sold by the Fund. Total unfunded capital commitments related to these holdings are immaterial and total $89,000, or 0.0% of theFund’s net assets as of the date of this report.# Annualized seven-day yield as of the date of this report. Various inputs may be used to determine the value of the Fund's investments. These inputs are summarized in three broad levels. The inputs ormethodologies used to value securities are not necessarily an indication of the risk associated with investing in those securities. Level 1 - Quoted prices in active markets for identical securities.Level 2 - Evaluated price based on other significant observable inputs (including quoted prices for similar securities, interest rates, prepaymentspreads, credit risk, etc.).Level 3 - Significant unobservable inputs (including the Fund's own assumptions in determining the fair value of investments). As of the date of this report, all of the Fund's investments, except for the Private Placements, were categorized as Level 1 securities. The PrivatePlacements are being fair valued using significant unobservable inputs and were categorized as Level 3 securities. Refer to the Fund's annual reportfor additional information regarding the valuation of the Private Placements. The Global Industry Classification Standard (GICS®) was developed by and is the exclusive property of MSCI, Inc. and Standard & Poor’s Financial Services LLC ('S&P'). (GICS®) is a service mark of MSCI, Inc. and S&P and has been licensed for use by the Fund's Administrator, U.S.Bancorp Fund Services, LLC.

Brown Advisory Small-Cap Fundamental Value Fund Schedule of Investments September 30, 2020 (Unaudited)
Shares Security Description Value $ Common Stocks - 89.8% Communication Services - 6.9% 345,330 GCI Liberty, Inc.* 28,303,247 288,729 Nexstar Media Group, Inc. 25,965,399 54,268,646 Consumer Discretionary - 11.2% 425,717 Century Casinos, Inc.* 2,332,929 724,381 Core-Mark Holding Co., Inc. 20,956,342 236,944 Culp, Inc. 2,942,845 500,684 Denny's Corp.* 5,006,840 1,216,936 Extended Stay America, Inc. 14,542,385 90,021 Helen of Troy, Ltd.* 17,420,864 250,335 La-Z-Boy, Inc. 7,918,096 130,967 Murphy USA, Inc.* 16,799,137 87,919,438 Consumer Staples - 1.9% 687,650 Sprouts Farmers Market, Inc.* 14,392,514 Energy - 1.6% 244,471 Natural Gas Services Group, Inc.* 2,065,780 136,386 REX American Resources Corp.* 8,948,285 248,987 Solaris Oilfield Infrastructure, Inc. 1,578,578 12,592,643 Financials - 26.0% 109,892 Alerus Financial Corp. 2,153,883 180,644 Ameris Bancorp 4,115,070 170,407 Assurant, Inc. 20,672,073 183,052 Kemper Corp. 12,233,365 877,215 National General Holdings Corp. 29,606,006 234,536 OceanFirst Financial Corp. 3,210,798 564,210 Pacific Premier Bancorp, Inc. 11,363,190 252,299 Peapack Gladstone Financial Corp. 3,822,330 160,171 Primerica, Inc. 18,121,747 259,525 Renasant Corp. 5,896,408 626,833 South Mountain Merger Corp. Units^* 6,895,163 853,842 TriState Capital Holdings, Inc.* 11,304,868 279,395 Triumph Bancorp, Inc.* 8,700,360 362,491 UMB Financial Corp. 17,765,684 660,854 Veritex Holdings, Inc. 11,254,344 145,552 Virtus Investment Partners, Inc. 20,180,785 586,188 Waddell & Reed Financial, Inc. 8,704,892 392,900 Washington Federal, Inc. 8,195,894 204,196,860 Health Care - 6.2% 340,814 Magellan Health, Inc.* 25,826,885 248,385 Providence Service Corp.* 23,077,450 48,904,335 Industrials - 18.9% 187,869 Albany International Corp. 9,301,394 363,094 Comfort Systems USA, Inc. 18,702,972 194,794 CRA International, Inc. 7,298,931 198,708 Curtiss-Wright Corp. 18,531,508 527,780 Federal Signal Corp. 15,437,565

127,053 Kadant, Inc. 13,927,550 299,266 McGrath RentCorp 17,833,261 1,078,442 Mueller Water Products, Inc. 11,205,012 183,654 Simpson Manufacturing Co., Inc. 17,843,823 401,330 SPX Corp.* 18,613,686 148,695,702 Information Technology - 11.7% 145,719 Cabot Microelectronics Corp. 20,810,131 818,315 Cardtronics PLC* 16,202,637 195,095 CTS Corp. 4,297,943 511,221 EchoStar Corp.* 12,724,291 219,181 MAXIMUS, Inc. 14,994,172 290,535 Onto Innovation, Inc.* 8,652,132 184,256 PC Connection, Inc. 7,565,551 181,848 Vectrus, Inc.* 6,910,224 92,157,081 Materials - 2.2% 196,902 Eagle Materials, Inc. 16,996,581 Real Estate - 0.2% 36,731 CTO Realty Growth, Inc. 1,619,837 Utilities - 3.0% 433,545 Portland General Electric Co. 15,390,847 840,896 Star Group L.P. 8,198,736 23,589,583 Total Common Stocks (Cost $563,725,520) 705,333,220 Real Estate Investment Trusts - 5.8% 115,311 EastGroup Properties, Inc. 14,913,172 962,830 Essential Properties Realty Trust, Inc. 17,639,046 369,416 Getty Realty Corp. 9,608,510 372,728 Xenia Hotels & Resorts, Inc. 3,272,552 Total Real Estate Investment Trusts (Cost $36,883,017) 45,433,280 Short-Term Investments - 4.3% Money Market Funds - 4.3% 34,026,730 First American Government Obligations Fund - Class Z, 0.05%# 34,026,730 Total Short-Term Investments (Cost $34,026,730) 34,026,730 Total Investments - 99.9% (Cost $634,635,267) 784,793,230 Other Assets in Excess of Liabilities - 0.1% 1,062,624
NET ASSETS - 100.0% $ 785,855,854
* Non-Income Producing ^ Each unit consists of one share of Class A common stock and one-half of one warrant. Each whole warrant is exercisable to purchase one share ofClass A common stock at a price of $11.50 per share. The warrants expire on June 20, 2024. Refer to the company's filings at sec.gov for additionalinformation.# Annualized seven-day yield as of the date of this report. Various inputs may be used to determine the value of the Fund's investments. These inputs are summarized in three broad levels. The inputs ormethodologies used to value securities are not necessarily an indication of the risk associated with investing in those securities. Level 1 - Quoted prices in active markets for identical securities.Level 2 - Evaluated price based on other significant observable inputs (including quoted prices for similar securities, interest rates, prepaymentspreads, credit risk, etc.).Level 3 - Significant unobservable inputs (including the Fund's own assumptions in determining the fair value of investments). As of the date of this report, all of the Fund's investments were categorized as Level 1 securities. The Global Industry Classification Standard (GICS®) was developed by and is the exclusive property of MSCI, Inc. and Standard & Poor’s
®

Financial Services LLC ('S&P'). (GICS ) is a service mark of MSCI, Inc. and S&P and has been licensed for use by the Fund's Administrator, U.S.Bancorp Fund Services, LLC.

Brown Advisory Global Leaders Fund Schedule of Investments September 30, 2020 (Unaudited)
Shares Security Description Value $ Common Stocks - 98.8% China - 6.5% 2,187,901 AIA Group, Ltd. 21,747,949 421,258 Tencent Holdings, Ltd. 28,453,193 50,201,142 France - 2.3% 183,600 Safran SA* 18,063,980 Germany - 5.8% 397,946 CTS Eventim AG & Co. KGaA* 19,234,108 146,393 Deutsche Boerse AG 25,665,817 44,899,925 India - 2.8% 1,507,484 HDFC Bank, Ltd.* 22,129,584 Indonesia - 2.8% 107,687,022 Bank Rakyat Indonesia Persero 22,092,460 Netherlands - 3.2% 295,048 Wolters Kluwer NV 25,168,467 Sweden - 2.9% 540,157 Atlas Copco AB 22,542,878 Switzerland - 6.4% 87,688 Roche Holding AG 30,036,696 73,318 Schindler Holding AG 19,898,346 49,935,042 Taiwan - 5.2% 494,486 Taiwan Semiconductor Manufacturing Co., Ltd. ADR 40,087,980 United Kingdom - 3.2% 397,292 Unilever PLC 24,494,450 United States - 57.7% Communication Services - 8.3% 24,938 Alphabet, Inc. - Class C* 36,648,886 214,684 Electronic Arts, Inc.* 27,996,940 64,645,826 Consumer Discretionary - 4.5% 11,677 Booking Holdings, Inc.* 19,975,610 273,312 TJX Companies, Inc. 15,209,813 35,185,423 Consumer Staples - 6.2% 278,641 Brown-Forman Corp. 20,987,240 125,139 Estee Lauder Companies, Inc. 27,311,587 48,298,827 Financials - 2.0% 433,860 Charles Schwab Corp. 15,718,748 Health Care - 2.6% 251,623 Edwards Lifesciences Corp.* 20,084,548 Information Technology - 28.9% 148,734 Aspen Technology, Inc.* 18,828,237 82,430 Autodesk, Inc.* 19,042,154 53,893 Intuit, Inc. 17,580,436 642,065 Marvell Technology Group, Ltd. 25,489,981 106,265 MasterCard, Inc. 35,935,635

319,494 Microsoft Corp. 67,199,173 205,075 Visa, Inc. 41,008,848 225,084,464 Materials - 5.2% 81,972 Ecolab, Inc. 16,381,284 34,104 Sherwin-Williams Co. 23,761,621 40,142,905 Total United States 449,160,741 Total Common Stocks (Cost $596,975,810) 768,776,649 Short-Term Investments - 1.3% Money Market Funds - 1.3% 10,269,626 First American Government Obligations Fund - Class Z, 0.05%# 10,269,626 Total Short-Term Investments (Cost $10,269,626) 10,269,626 Total Investments - 100.1% (Cost $607,245,436) 779,046,275 Liabilities in Excess of Other Assets - (0.1)% (660,466)
NET ASSETS - 100.0% $ 778,385,809
* Non-Income Producing ADR - American Depositary Receipt # Annualized seven-day yield as of the date of this report. Various inputs may be used to determine the value of the Fund's investments. These inputs are summarized in three broad levels. The inputs ormethodologies used to value securities are not necessarily an indication of the risk associated with investing in those securities. Level 1 - Quoted prices in active markets for identical securities.Level 2 - Evaluated price based on other significant observable inputs (including quoted prices for similar securities, interest rates, prepaymentspreads, credit risk, etc.).Level 3 - Significant unobservable inputs (including the Fund's own assumptions in determining the fair value of investments). As of the date of this report, the Fund's investments were categorized as follows:
Level 1 Level 2 Level 3 Common Stocks $ 489,248,721 $ 279,527,928 $ -
Short-Term Investments 10,269,626 - - Total Investments $ 499,518,347 $ 279,527,928 $ -
The Global Industry Classification Standard (GICS®) was developed by and is the exclusive property of MSCI, Inc. and Standard & Poor’sFinancial Services LLC ('S&P'). (GICS®) is a service mark of MSCI, Inc. and S&P and has been licensed for use by the Fund's Administrator,U.S. Bancorp Fund Services, LLC.

Brown Advisory Intermediate Income Fund Schedule of Investments September 30, 2020 (Unaudited)
Par Value Security Description Rate Maturity Value $ Corporate Bonds & Notes - 31.8% 1,600,000 Air Products and Chemicals, Inc. 1.50% 10/15/2025 1,661,763 1,470,000 American Tower Corp. 3.60% 01/15/2028 1,652,008 1,570,000 Amphenol Corp. 2.05% 03/01/2025 1,649,797 660,000 AT&T, Inc. 4.10% 02/15/2028 765,038 1,555,000 AvalonBay Communities, Inc. 2.30% 03/01/2030 1,656,592 730,000 Booking Holdings, Inc. 4.50% 04/13/2027 858,332 1,575,000 BorgWarner, Inc. 2.65% 07/01/2027 1,665,647 700,000 BP Capital Markets America, Inc. 3.80% 09/21/2025 789,897 750,000 Chevron Corp. 2.00% 05/11/2027 794,493 1,615,000 Clorox Co. 1.80% 05/15/2030 1,667,654 720,000 Colonial Enterprises, Inc.^ 3.25% 05/15/2030 806,429 703,000 Comcast Corp. 3.40% 04/01/2030 813,127 745,000 Consolidated Edison Co. of New York, Inc. 3.35% 04/01/2030 859,841 1,495,000 Crown Castle International Corp. 3.30% 07/01/2030 1,637,577 710,000 Dollar General Corp. 3.88% 04/15/2027 815,423 1,375,000 Dollar Tree, Inc. 4.20% 05/15/2028 1,619,134 810,000 Ecolab, Inc. 1.30% 01/30/2031 795,015 670,000 Exelon Corp. 4.05% 04/15/2030 787,798 1,505,000 FMC Corp. 3.20% 10/01/2026 1,665,106 591,000 Fortis, Inc. 3.06% 10/04/2026 646,771 700,000 General Dynamics Corp. 3.50% 05/15/2025 786,290 1,181,000 Hasbro, Inc. 3.50% 09/15/2027 1,230,716 725,000 Healthcare Trust of America Holdings L.P. 3.75% 07/01/2027 807,666 725,000 Hexcel Corp. 3.95% 02/15/2027 783,723 685,000 JB Hunt Transport Services, Inc. 3.88% 03/01/2026 792,292 675,000 Keysight Technologies, Inc. 4.60% 04/06/2027 789,437 730,000 Kimberly-Clark Corp. 3.10% 03/26/2030 839,136 1,380,000 Land O'Lakes, Inc.^ 6.00% 11/15/2022 1,463,413 760,000 Martin Marietta Materials, Inc. 2.50% 03/15/2030 793,333 670,000 Mastercard, Inc. 3.35% 03/26/2030 787,520 735,000 Morgan Stanley 3.75% 02/25/2023 789,161 716,000 NIKE, Inc. 2.75% 03/27/2027 797,508 640,000 Northrop Grumman Corp. 4.40% 05/01/2030 791,761 1,475,000 NXP BV^ 3.88% 06/18/2026 1,654,936 1,445,000 Oracle Corp. 2.80% 04/01/2027 1,592,086 675,000 Procter & Gamble Co. 3.00% 03/25/2030 784,605 1,310,000 SYSCO Corp. 5.95% 04/01/2030 1,664,640 1,690,000 Takeda Pharmaceutical Co., Ltd. 2.05% 03/31/2030 1,710,941 700,000 Thermo Fisher Scientific, Inc. 3.20% 08/15/2027 788,956 1,370,000 TJX Companies, Inc. 3.75% 04/15/2027 1,572,860 1,605,000 Truist Financial Corp. 2.75% 04/01/2022 1,658,043 1,585,000 USAA Capital Corp.^ 1.50% 05/01/2023 1,626,446 1,565,000 VF Corp. 2.40% 04/23/2025 1,661,855 1,525,000 Wells Fargo & Co. 3.75% 01/24/2024 1,658,465 918,000 Xylem, Inc. 1.95% 01/30/2028 959,078 Total Corporate Bonds & Notes (Cost $49,177,683) 52,392,309 Mortgage Backed Securities - 16.3%
825,000 BAMLL Commercial Mortgage Securities Trust, Series 2018-DSNY C (1 MonthLIBOR USD + 1.35%)^ 1.50% 09/15/2034 779,712
750,000 BAMLL Commercial Mortgage Securities Trust, Series 2019-RLJ C (1 MonthLIBOR USD + 1.60%)^ 1.75% 04/15/2036 711,125

499,543 BX Commercial Mortgage Trust, Series 2020-BXLP (1 Month LIBOR USD +1.25%)^ 1.40% 12/15/2036 495,959
500,000 BX Trust, Series 2019-CALM C (1 Month LIBOR USD + 1.30%)^ 1.45% 11/15/2032 494,245
913,543 CGDBB Commercial Mortgage Trust, Series 2017-BIOC D (1 Month LIBORUSD + 1.60%)^ 1.75% 07/15/2032 913,626
750,000 CSMC, Series 2019-ICE4 C (1 Month LIBOR USD + 1.43%)^ 1.58% 05/15/2036 746,276 1,000,000 CSMC, Series 2019-ICE4 D (1 Month LIBOR USD + 1.60%)^ 1.75% 05/15/2036 992,676 500,000 DBGS Mortgage Trust, Series 2018-C1 7EA^ 4.64% 10/17/2051 483,453 744 FHLMC PC, Pool# C0-0210 8.00% 01/01/2023 782 101,265 FHLMC PC, Pool# 1B-0889 (12 Month LIBOR USD + 1.59%) 2.90% 05/01/2033 101,685 124,044 FHLMC REMIC, Series 4778 GA 4.50% 10/15/2042 124,752 618,502 FHLMC REMIC, Series 4711 NA 3.50% 11/15/2042 624,566 794,478 FHLMC REMIC, Series 4665 KA 4.00% 12/15/2042 809,350 1,096,798 FHLMC REMIC, Series 4740 KB 3.50% 02/15/2043 1,111,806 701,109 FHLMC REMIC, Series 4747 DA 3.50% 04/15/2043 709,893 237,946 FHLMC REMIC, Series 4784 EG 3.50% 06/15/2044 241,625 407,506 FHLMC REMIC, Series 4840 BK 4.50% 09/15/2046 421,580 500,000 FHLMC STACR, Series 2014-HQ2 M3 (1 Month LIBOR USD + 3.75%) 3.90% 09/25/2024 513,321 1,696,622 FHMS, Series Q-006 APT1# 2.67% 04/25/2028 1,737,606 388,621 FHMS, Series Q-006 APT2# 2.55% 10/25/2028 395,473 479,652 FHMS, Series Q-010 APT1# 2.94% 04/25/2046 482,150 473,553 FHMS, Series Q-007 APT1# 2.98% 10/25/2047 488,997 524,528 FHMS, Series Q-007 APT2# 3.30% 10/25/2047 565,315 1,000,000 FHMS, Series Q-013 APT1# 1.16% 05/25/2050 1,147,071 10,165 FNMA, Pool# 628837 6.50% 03/01/2032 11,694 643,003 FNMA, Pool# MA2998 3.50% 04/01/2032 687,363 49,173 FNMA, Pool# 663238 5.50% 09/01/2032 54,710 26,200 FNMA, Pool# 744805 (6 Month LIBOR USD + 1.52%) 2.89% 11/01/2033 26,360 10,954 FNMA, Pool# 741373 (1 Year CMT Rate + 2.28%) 4.03% 12/01/2033 10,961 25,668 FNMA, Pool# 764342 (6 Month LIBOR USD + 1.52%) 2.40% 02/01/2034 25,852 1,918,357 FNMA, Pool# MA2804 3.00% 11/01/2036 2,009,300 155,137 FNMA, Pool# BN0202 5.50% 09/01/2048 177,085 145,213 FNMA REMIC Trust, Series 2016-M5 (1 Month LIBOR USD + 0.72%) 0.90% 04/25/2023 145,518 691,294 FNMA REMIC Trust, Series 2013-115 AI~ 3.00% 04/25/2031 36,678 189,818 FNMA REMIC Trust, Series 2018-24 CA 3.50% 11/25/2040 190,950 422,259 FNMA REMIC Trust, Series 2013-M6 1AC# 3.55% 02/25/2043 479,105 1,125,406 FNMA REMIC Trust, Series 2020-6 GL 3.00% 04/25/2043 1,163,261 500,000 FREMF Mortgage Trust, Series 2020-K737 B#^ 3.41% 11/25/2026 545,559 1,150,000 FREMF Mortgage Trust, Series 2016-K723 B#^ 3.70% 10/25/2039 1,216,501 750,000 FREMF Mortgage Trust, Series 2019-K735 B#^ 4.16% 05/25/2052 839,015 15,315 GNMA, Pool# 781186X 9.00% 06/15/2030 15,561
700,000 GS Mortgage Securities Corp Trust, Series 2017-500K C (1 Month LIBOR USD+ 1.00%)^ 1.15% 07/15/2032 696,459
700,000 JPMCC, Series 2019-BKWD C (1 Month LIBOR USD + 1.60%)^ 1.75% 09/17/2029 670,745 500,000 JPMCC, Series 2019-MFP C (1 Month LIBOR USD + 1.36%)^ 1.51% 07/15/2036 482,816 500,000 KNDL Mortgage Trust, Series 2019-KNSQ C (1 Month LIBOR USD + 1.05%)^ 1.20% 05/15/2036 496,557 500,000 MRCD Mortgage Trust, Series 2019-PARK C^ 2.72% 12/15/2036 504,914 900,000 MSC, Series 2017-CLS A (1 Month LIBOR USD + 0.70%)^ 0.85% 11/15/2034 898,277 400,000 MSC, Series 2019-NUGS B (1 Month LIBOR USD + 1.30%)^ 2.80% 12/15/2036 392,791 Total Mortgage Backed Securities (Cost $26,682,295) 26,871,076 Asset Backed Securities - 13.0% 510,000 American Homes 4 Rent Trust, Series 2015-SFR2 C^ 4.69% 10/18/2052 564,411 750,000 DT Auto Owner Trust, Series 2019-3A D^ 2.96% 04/15/2025 768,845 445,029 FHF Trust, Series 2020-1A A^ 2.59% 12/15/2023 448,488 1,000,000 FREED ABS Trust, Series 2019-1 B^ 3.87% 06/18/2026 1,002,619 501,857 FREED ABS Trust, Series 2020-2CP A^ 4.52% 06/18/2027 508,057 500,000 GTP Acquisition Partners I LLC, Series 2015-1-2^ 3.48% 06/15/2050 541,193 700,000 HPEFS Equipment Trust, Series 2019-1A D^ 2.72% 09/20/2029 715,830 500,000 HPEFS Equipment Trust, Series 2020-1A D^ 2.26% 02/20/2030 503,569

500,000 Invitation Homes Trust, Series 2017-SFR2 C (1 Month LIBOR USD + 1.45%)^ 1.60% 12/19/2036 502,645 998,535 Invitation Homes Trust, Series 2017-SFR2 D (1 Month LIBOR USD + 1.80%)^ 1.95% 12/19/2036 1,004,680 734,000 Invitation Homes Trust, Series 2018-SFR1 C (1 Month LIBOR USD + 1.25%)^ 1.40% 03/19/2037 736,564 500,000 Invitation Homes Trust, Series 2018-SFRI D (1 Month LIBOR USD + 1.45%)^ 1.60% 03/19/2037 500,908
700,000 Madison Park Funding XVI, Ltd., Series 2015-16A A2R (3 Month LIBOR USD+ 1.90%)^ 2.17% 04/20/2026 700,099
500,000 Mariner CLO LLC, Series 2016-3A AR2 (3 Month LIBOR USD + 0.99%)^ 1.25% 07/23/2029 496,123 837,883 MVW Owner Trust, Series 2017-1A A^ 2.42% 12/20/2034 855,697 750,000 Nationstar HECM Loan Trust, Series 2020-1 A#^ 1.27% 09/25/2030 750,788 367,201 NYCTL Trust, Series 2018-A A^ 3.22% 11/10/2031 370,389 725,602 NYCTL Trust, Series 2019-A A^ 2.19% 11/10/2032 735,722 500,000 OCP CLO Ltd., Series 2015-8R (3 Month LIBOR USD + 1.85%)^ 2.12% 04/17/2027 497,761 1,000,000 Oportun Funding VIII LLC, Series 2018-A A^ 3.61% 03/08/2024 1,002,663 400,000 Oportun Funding X LLC, Series 2018-C A^ 4.10% 10/08/2024 407,162
350,000 Palmer Square Loan Funding 2019-3 Ltd., Series A-2 (3 Month LIBOR USD +1.60%)^ 1.85% 08/20/2027 348,186
1,150,000 PFS Financing Corp., Series 2020-F A^ 0.93% 08/15/2024 1,152,154 700,000 Progress Residential Trust, Series 2017-SFR2 C^ 3.40% 12/19/2034 701,986 500,000 Progress Residential Trust, Series 2018-SFR1 C^ 3.68% 03/17/2035 506,090 699,149 Progress Residential Trust, Series 2018-SFR1 A^ 3.26% 03/19/2035 706,603 600,000 Santander Drive Auto Receivables Trust, Series 2019-3 D 2.68% 10/15/2025 617,944 274,000 SBA Tower Trust, Series 2020-1-2^ 2.33% 01/15/2028 279,411 300,000 SBA Tower Trust, Series 2020-1-2^ 1.88% 07/15/2050 306,313 850,000 Stack Infrastructure Issuer LLC, Series 2020-1A A2^ 1.89% 08/25/2045 858,445 750,000 Tesla Auto Lease Trust 2020-A, Series 2020-A^ 0.68% 12/20/2023 754,007 1,125,000 Vantage Data Centers LLC, Series 2020-1A A2^ 1.65% 09/15/2045 1,126,670 500,000 Verizon Owner Trust, Series 2019-A C 3.22% 09/20/2023 519,854 Total Asset Backed Securities (Cost $21,314,088) 21,491,876 U.S. Treasury Notes - 24.0% 5,800,000 United States Treasury Note 1.75% 11/15/2020 5,811,696 11,045,000 United States Treasury Note 0.38% 03/31/2022 11,086,635 9,000,000 United States Treasury Note 1.63% 08/15/2022 9,253,828 6,000,000 United States Treasury Note 2.25% 03/31/2026 6,630,234 5,695,000 United States Treasury Note 2.88% 05/15/2028 6,704,305 Total U.S. Treasury Notes (Cost $38,323,492) 39,486,698
Shares Affiliated Mutual Funds - 12.1% 1,900,087 Brown Advisory Mortgage Securities Fund - Institutional Shares 19,969,918 Total Affiliated Mutual Funds (Cost $19,527,460) 19,969,918 Short-Term Investments - 3.3% Money Market Funds - 3.3% 5,522,289 First American Government Obligations Fund - Class Z, 0.05%* 5,522,289 Total Short-Term Investments (Cost $5,522,289) 5,522,289 Total Investments - 100.5% (Cost $160,547,307) 165,734,166 Liabilities in Excess of Other Assets - (0.5)% (871,836)
NET ASSETS - 100.0% $ 164,862,330
^ Security exempt from registration under Rule 144A of the Securities Act of 1933. These securities may be resold in transactions exempt fromregistration, normally to qualified institutional buyers.# Variable rate security. Rate disclosed is as of the date of this report. ~ Interest Only Security * Annualized seven-day yield as of the date of this report. Various inputs may be used to determine the value of the Fund's investments. These inputs are summarized in three broad levels. The inputs ormethodologies used to value securities are not necessarily an indication of the risk associated with investing in those securities.

Level 1 - Quoted prices in active markets for identical securities.Level 2 - Evaluated price based on other significant observable inputs (including quoted prices for similar securities, interest rates, prepaymentspreads, credit risk, etc.).Level 3 - Significant unobservable inputs (including the Fund's own assumptions in determining the fair value of investments). As of the date of this report, the Fund's investments in affiliated mutual funds and short-term investments, with a total market value of $25,492,207,were categorized as Level 1, while the Fund's investments in corporate bonds & notes, asset backed securities, mortgage backed securities and U.S.Treasury Notes, with a total market value of $140,241,959, were categorized as Level 2.
Investments in Affiliates See the table below for details of the Brown Advisory Intermediate Income Fund's investment in the Brown Advisory Mortgage Securities FundInstitutional Shares for the period ended as of the date of this report:
BeginningMarketValue
6/30/2020 Purchases Sales
NetRealized
Gains(Losses)
Change InUnrealized
Appreciation(Depreciation)
EndingMarketValue
9/30/2020 DividendIncome
Capital GainDistributions
SharesOwned at9/30/2020
$ 17,632,866 $ 2,250,000 $ - $ - $ 87,052 $ 19,969,918 $ 48,322 $ - 1,900,087

Brown Advisory Total Return Fund Schedule of Investments September 30, 2020 (Unaudited)
Par Value Security Description Rate Maturity Value $ Corporate Bonds & Notes - 47.1% 4,015,000 Agilent Technologies, Inc. 2.10% 06/04/2030 4,137,544 4,105,000 Alexandria Real Estate Equities, Inc. 1.88% 02/01/2033 4,035,617 1,865,000 Allison Transmission, Inc.^ 5.88% 06/01/2029 2,019,543 3,725,000 Amphenol Corp. 2.80% 02/15/2030 4,083,849 1,076,000 Aptiv PLC 4.35% 03/15/2029 1,215,060 3,880,000 AvalonBay Communities, Inc. 2.30% 03/01/2030 4,133,491 2,080,000 Beacon Roofing Supply, Inc.^ 4.88% 11/01/2025 2,042,175 1,670,000 Booking Holdings, Inc. 4.63% 04/13/2030 2,010,988 3,855,000 BorgWarner, Inc. 2.65% 07/01/2027 4,076,870 3,605,000 BP Capital Markets America, Inc. 3.63% 04/06/2030 4,145,420 3,700,000 Broadcom, Inc. 4.15% 11/15/2030 4,164,902 1,970,000 BWX Technologies, Inc.^ 4.13% 06/30/2028 2,020,481 3,870,000 Carrier Global Corp.^ 2.72% 02/15/2030 4,057,982 1,952,000 Chevron Corp. 2.24% 05/11/2030 2,075,763 3,720,000 Colonial Enterprises, Inc.^ 3.25% 05/15/2030 4,166,549 1,630,000 CommonSpirit Health 4.19% 10/01/2049 1,741,617 5,313,000 Conservation Fund 3.47% 12/15/2029 5,750,659 1,715,000 Consolidated Edison Co. of New York, Inc. 3.35% 04/01/2030 1,979,366 391,000 Core & Main L.P.^ 6.13% 08/15/2025 396,787 3,705,000 Crown Castle International Corp. 3.30% 07/01/2030 4,058,343 3,515,000 CVS Health Corp. 4.30% 03/25/2028 4,119,411 3,955,000 Darden Restaurants, Inc. 3.85% 05/01/2027 4,191,414 3,560,000 Dollar General Corp. 3.88% 04/15/2027 4,088,601
3,430,000 Enterprise Products Operating LLC (Fixed until 08/16/2022, then 3 MonthLIBOR USD + 2.99%) 4.88% 08/16/2077 2,996,482
3,480,000 Exelon Corp. 4.05% 04/15/2030 4,091,844 3,050,000 Ferguson Finance PLC^ 4.50% 10/24/2028 3,542,082 3,705,000 FMC Corp. 3.20% 10/01/2026 4,099,147 2,995,000 Fortis, Inc. 3.06% 10/04/2026 3,277,632 1,860,000 frontdoor, Inc.^ 6.75% 08/15/2026 1,987,522 1,460,000 Graphic Packaging International LLC^ 4.75% 07/15/2027 1,585,648 2,970,000 Hasbro, Inc. 3.50% 09/15/2027 3,095,026 2,775,000 Healthcare Trust of America Holdings L.P. 3.75% 07/01/2027 3,091,412 3,798,000 Hexcel Corp. 3.95% 02/15/2027 4,105,628 3,700,000 IDEX Corp. 3.00% 05/01/2030 4,078,282 1,390,000 KeHE Distributors LLC^ 8.63% 10/15/2026 1,507,935 3,565,000 Kinross Gold Corp. 4.50% 07/15/2027 4,054,991 3,885,000 Lear Corp. 4.25% 05/15/2029 4,211,806 1,795,000 Marriott International, Inc. 5.75% 05/01/2025 2,006,061 1,865,000 Marriott International, Inc. 4.65% 12/01/2028 1,991,559 3,928,000 Martin Marietta Materials, Inc. 2.50% 03/15/2030 4,100,276 3,404,000 Marvell Technology Group Ltd. 4.88% 06/22/2028 4,113,252 2,165,000 Mercer International, Inc. 5.50% 01/15/2026 2,082,459 2,640,000 MPLX L.P. 4.80% 02/15/2029 3,024,434
1,860,000 NextEra Energy Capital Holdings, Inc. (Fixed until 12/01/2027, then 3 MonthLIBOR USD + 2.41%) 4.80% 12/01/2077 2,004,512
1,754,000 NIKE, Inc. 2.85% 03/27/2030 1,973,996 1,670,000 Northrop Grumman Corp. 4.40% 05/01/2030 2,066,002 3,637,000 NXP BV^ 3.88% 06/18/2026 4,080,679 1,980,000 SBA Communications Corp.^ 3.88% 02/15/2027 2,012,175 1,830,000 ServiceMaster Co. LLC 7.45% 08/15/2027 2,003,502
1,346,000 Southern California Edison Co. (Fixed until 02/01/2022, then 3 Month LIBORUSD + 4.20%) 6.25% 08/01/2049 1,325,362

4,290,000 Southwest Airlines Co. 2.63% 02/10/2030 4,087,174 3,200,000 SYSCO Corp. 5.95% 04/01/2030 4,066,297 4,240,000 Takeda Pharmaceutical Co., Ltd. 2.05% 03/31/2030 4,292,539 3,660,000 Thermo Fisher Scientific, Inc. 3.20% 08/15/2027 4,125,112 3,072,000 TJX Companies, Inc. 3.88% 04/15/2030 3,649,535 1,940,000 TransDigm, Inc.^ 6.25% 03/15/2026 2,028,367 3,400,000 Trimble, Inc. 4.90% 06/15/2028 4,017,291 3,625,000 Verisk Analytics, Inc. 4.00% 06/15/2025 4,140,314 3,770,000 VF Corp. 2.95% 04/23/2030 4,109,521 1,460,000 Viking Cruises, Ltd.^ 5.88% 09/15/2027 1,137,887 200,000 VOC Escrow, Ltd.^ 5.00% 02/15/2028 177,537 3,660,000 Vulcan Materials Co. 3.50% 06/01/2030 4,107,226 3,825,000 Xylem, Inc. 2.25% 01/30/2031 4,066,487 Total Corporate Bonds & Notes (Cost $184,484,988) 197,227,425 Mortgage Backed Securities - 23.7%
1,800,000 BAMLL Commercial Mortgage Securities Trust, Series 2018-DSNY C (1 MonthLIBOR USD + 1.35%)^ 1.50% 09/15/2034 1,701,191
1,250,000 BAMLL Commercial Mortgage Securities Trust, Series 2019-RLJ C (1 MonthLIBOR USD + 1.60%)^ 1.75% 04/15/2036 1,185,209
1,498,628 BX Commercial Mortgage Trust, Series 2020-BXLP (1 Month LIBOR USD +1.25%)^ 1.40% 12/15/2036 1,487,877
940,000 BX Trust, Series 2019-CALM C (1 Month LIBOR USD + 1.30%)^ 1.45% 11/15/2032 929,180
500,000 CAMB Commercial Mortgage Trust, Series 2019-LIFE B (1 Month LIBOR USD+ 1.25%)^ 1.40% 12/15/2037 498,375
500,000 CAMB Commercial Mortgage Trust, Series 2019-LIFE C (1 Month LIBOR USD+ 1.45%)^ 1.60% 12/15/2037 499,382
1,461,669 CGDBB Commercial Mortgage Trust, Series 2017-BIOC B (1 Month LIBORUSD + 0.97%)^ 1.12% 07/15/2032 1,460,583
1,423,301 CGDBB Commercial Mortgage Trust, Series 2017-BIOC D (1 Month LIBORUSD + 1.60%)^ 1.75% 07/15/2032 1,423,429
1,370,315 CGDBB Commercial Mortgage Trust, Series 2017-BIOC E (1 Month LIBORUSD + 2.15%)^ 2.30% 07/15/2032 1,359,206
750,000 CORE Mortgage Trust, Series 2019-CORE C (1 Month LIBOR USD + 1.30%)^ 1.45% 12/15/2031 735,386 1,250,000 CSMC, Series 2019-ICE4 C (1 Month LIBOR USD + 1.43%)^ 1.58% 05/15/2036 1,243,793 2,950,000 CSMC, Series 2019-ICE4 D (1 Month LIBOR USD + 1.60%)^ 1.75% 05/15/2036 2,928,394 4,000,000 DBGS Mortgage Trust, Series 2018-C1 7EA^ 4.64% 10/17/2051 3,867,628 1,624,347 FHLMC PC, Pool# G3-1063 3.50% 11/01/2037 1,724,795 1,279,803 FHLMC REMIC, Series 4094 NI~ 2.50% 03/15/2027 49,276 1,608,247 FHLMC REMIC, Series 4107 LI~ 3.00% 08/15/2027 223,807 2,181,270 FHLMC REMIC, Series 4143 IA~ 3.50% 09/15/2042 230,717 240,763 FHLMC SCRTT, Series 2016-1 M1# 3.00% 09/25/2055 240,697 300,000 FHLMC SCRTT, Series 2017-1 M1# 4.00% 01/25/2056 301,723 3,992,570 FHMS, Series K-021 X1#~ 1.54% 06/25/2022 73,336 10,277,642 FHMS, Series K-C02 X1#~ 0.50% 03/25/2024 120,935 4,440,784 FHMS, Series K-038 X1#~ 1.28% 03/25/2024 145,621 64,750,276 FHMS, Series K-047 X1#~ 0.26% 05/25/2025 409,416 13,000,000 FHMS, Series Q-013 XPT1~ 1.66% 05/25/2025 421,824 19,150,000 FHMS, Series K-C06 X1#~ 1.03% 06/25/2025 683,975 10,386,014 FHMS, Series K-734 X1#~ 0.79% 02/25/2026 313,735 6,636,162 FHMS, Series K-735 X1#~ 1.10% 05/25/2026 319,144 8,497,325 FHMS, Series K-736 X1#~ 1.44% 07/25/2026 539,075 668,495 FHMS, Series K-058 X1#~ 1.05% 08/25/2026 32,166 2,999,730 FHMS, Series K-C04 X1#~ 1.41% 12/25/2026 166,233 5,993,180 FHMS, Series K-738 X1#~ 1.63% 01/25/2027 497,692 6,000,000 FHMS, Series K-738 XAM#~ 1.48% 03/25/2027 487,484 8,150,000 FHMS, Series Q-013 XPT2~ 1.81% 05/25/2027 370,507 1,371,584 FHMS, Series K-W03 X1#~ 0.98% 06/25/2027 57,684 7,488,843 FHMS, Series K-C05 X1#~ 1.34% 07/25/2027 442,084 9,920,237 FHMS, Series K-070 X1#~ 0.46% 11/25/2027 221,372

658,882 FHMS, Series Q-006 APT1# 2.67% 04/25/2028 674,798 4,983,428 FHMS, Series K-087 X1#~ 0.51% 12/25/2028 141,301 3,994,571 FHMS, Series K-092 X1#~ 0.85% 04/25/2029 217,721 5,498,636 FHMS, Series K-G01 X1#~ 1.11% 04/25/2029 341,638 3,542,486 FHMS, Series K-094 X1#~ 1.02% 06/25/2029 238,789 4,497,667 FHMS, Series K-103 X1#~ 0.76% 11/25/2029 234,583 6,999,853 FHMS, Series K-108 XAM#~ 1.78% 03/25/2030 989,311 4,800,000 FHMS, Series K-110 XAM#~ 1.87% 04/25/2030 767,360 5,030,000 FHMS, Series K-109 XAM#~ 1.92% 04/25/2030 770,894 3,410,000 FHMS, Series K-112 XAM#~ 1.77% 05/25/2030 500,661 4,750,000 FHMS, Series K-111 XAM#~ 1.91% 05/25/2030 734,948 6,238,500 FHMS, Series K-114 XAM#~ 1.44% 06/25/2030 734,192 11,000,000 FHMS, Series K-G03 X1#~ 1.48% 06/25/2030 1,209,812 12,000,000 FHMS, Series K-113 XAM#~ 1.69% 06/25/2030 1,669,208 9,300,000 FHMS, Series K-115 XAM#~ 1.55% 07/25/2030 1,255,082 7,250,000 FHMS, Series K-116 XAM#~ 1.60% 08/25/2030 1,034,866 479,652 FHMS, Series Q-010 APT1# 2.94% 04/25/2046 482,150 4,103,447 FHMS, Series Q-007 APT2# 3.30% 10/25/2047 4,422,537 1,500,000 FHMS, Series Q-013 APT1# 1.16% 05/25/2050 1,720,607 262,875 FNMA, Pool# 467095 5.90% 01/01/2041 304,902 173,867 FNMA, Pool# 469130 4.87% 10/01/2041 202,838 291,693 FNMA, Pool# BH7686 4.50% 12/01/2047 318,990 173,664 FNMA, Pool# BK5105 5.50% 05/01/2048 198,211 174,378 FNMA, Pool# BK8032 5.50% 06/01/2048 199,047 155,137 FNMA, Pool# BN0202 5.50% 09/01/2048 177,086 147,385 FNMA, Pool# BN4936 5.50% 12/01/2048 164,564 202,770 FNMA, Pool# BN4921 5.50% 01/01/2049 227,583 7,500,000 FNMA, 2.0%, TBA November 2.00% 11/15/2035 7,795,002 7,500,000 FNMA, 2.0%, TBA November 2.00% 11/15/2050 7,741,865 7,500,000 FNMA, 2.5%, TBA November 2.50% 11/15/2050 7,857,002 20,995,750 FNMA REMIC Trust, Series 2019-M23 X3#~ 0.38% 10/27/2031 598,083 439,131 FNMA REMIC Trust, Series 2012-65 HJ 5.00% 07/25/2040 498,879 1,750,000 FREMF Mortgage Trust, Series 2016-K723 B#^ 3.70% 10/25/2039 1,851,197 1,785,000 FREMF Mortgage Trust, Series 2017-K64 B#^ 4.12% 05/25/2050 2,011,354 1,500,000 FREMF Mortgage Trust, Series 2019-K89 B#^ 4.43% 01/25/2051 1,759,145 1,500,000 FREMF Mortgage Trust, Series 2019-K734 B#^ 4.19% 02/25/2051 1,639,116 2,000,000 FREMF Mortgage Trust, Series 2019-K735 B#^ 4.16% 05/25/2052 2,237,372 750,000 FREMF Mortgage Trust, Series 2019-K736 B#^ 3.88% 09/25/2052 829,989 450,050 GNMA, Pool# 723334X 5.00% 09/15/2039 512,588 7,500,000 GNMA, 2.0%, TBA November 2.00% 11/15/2050 7,777,148 3,846,217 GNMA REMIC Trust, Series 2017-167 SE (1 Month LIBOR USD + 6.20%)~ 6.04% 11/20/2047 791,501 905,225 GNMA REMIC Trust, Series 2014-45 B1#~ 0.71% 07/16/2054 29,013 646,944 GNMA REMIC Trust, Series 2014-135 I0#~ 0.71% 01/16/2056 21,756 622,255 GNMA REMIC Trust, Series 2015-172 I0#~ 0.78% 03/16/2057 26,522 987,535 GNMA REMIC Trust, Series 2016-40 I0#~ 0.69% 07/16/2057 41,496 788,076 GNMA REMIC Trust, Series 2016-56 I0#~ 0.87% 11/16/2057 42,593 1,086,216 GNMA REMIC Trust, Series 2016-98 I0#~ 0.90% 05/16/2058 63,486 1,000,000 JPMCC, Series 2019-BKWD C (1 Month LIBOR USD + 1.60%)^ 1.75% 09/17/2029 958,207 1,500,000 JPMCC, Series 2019-MFP C (1 Month LIBOR USD + 1.36%)^ 1.51% 07/15/2036 1,448,447
1,323,406 KKR Industrial Portfolio Trust, Series 2020-AIP D (1 Month LIBOR USD +2.03%)^ 2.18% 03/16/2037 1,323,385
1,500,000 MRCD Mortgage Trust, Series 2019-PARK C^ 2.72% 12/15/2036 1,514,742 600,000 MSC, Series 2019-NUGS B (1 Month LIBOR USD + 1.30%)^ 2.80% 12/15/2036 589,186 1,000,000 Natixis Commercial Mortgage Securities Trust, Series 2020-2PAC C^ 3.40% 12/16/2038 1,007,650 1,000,000 Velocity Commercial Capital Loan Trust, Series 2017-1 M1#^ 3.55% 05/25/2047 1,004,064 Total Mortgage Backed Securities (Cost $96,819,167) 99,297,398 Asset Backed Securities - 17.7% 540,000 American Homes 4 Rent, Series 2014-SFR2 D^ 5.15% 10/17/2036 598,363 2,000,000 American Homes 4 Rent, Series 2014-SFR3 B^ 4.20% 12/18/2036 2,164,894
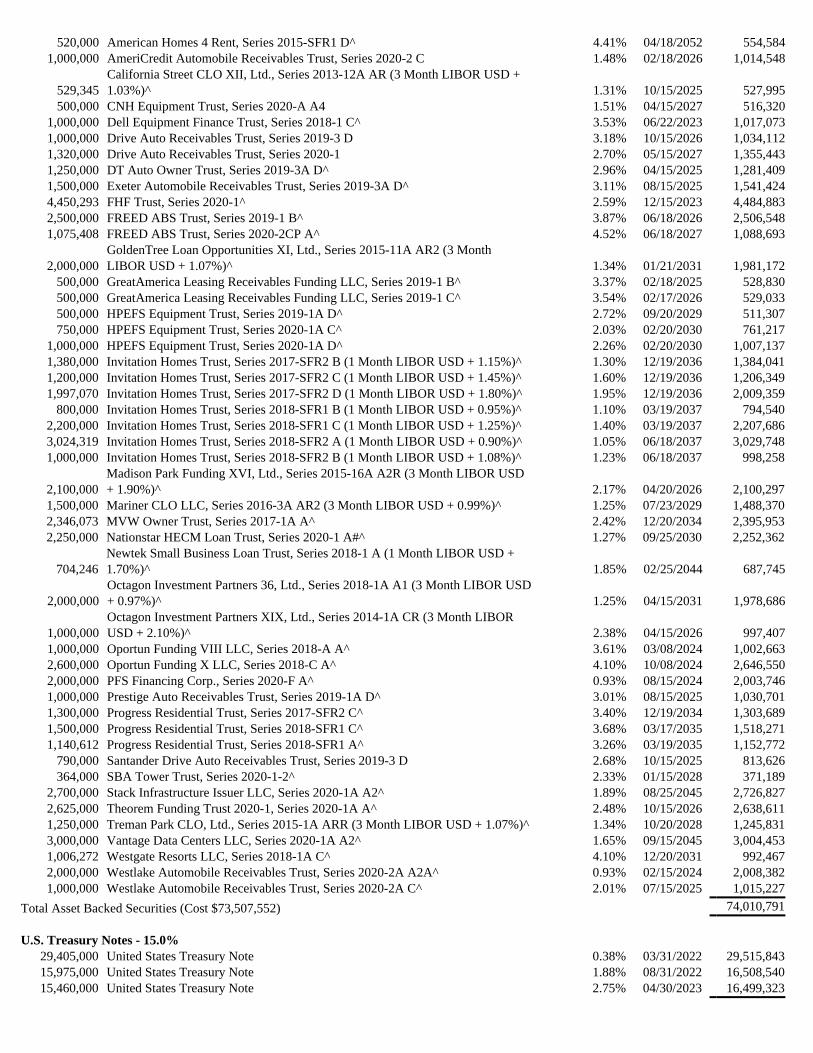
520,000 American Homes 4 Rent, Series 2015-SFR1 D^ 4.41% 04/18/2052 554,584 1,000,000 AmeriCredit Automobile Receivables Trust, Series 2020-2 C 1.48% 02/18/2026 1,014,548
529,345 California Street CLO XII, Ltd., Series 2013-12A AR (3 Month LIBOR USD +1.03%)^ 1.31% 10/15/2025 527,995
500,000 CNH Equipment Trust, Series 2020-A A4 1.51% 04/15/2027 516,320 1,000,000 Dell Equipment Finance Trust, Series 2018-1 C^ 3.53% 06/22/2023 1,017,073 1,000,000 Drive Auto Receivables Trust, Series 2019-3 D 3.18% 10/15/2026 1,034,112 1,320,000 Drive Auto Receivables Trust, Series 2020-1 2.70% 05/15/2027 1,355,443 1,250,000 DT Auto Owner Trust, Series 2019-3A D^ 2.96% 04/15/2025 1,281,409 1,500,000 Exeter Automobile Receivables Trust, Series 2019-3A D^ 3.11% 08/15/2025 1,541,424 4,450,293 FHF Trust, Series 2020-1^ 2.59% 12/15/2023 4,484,883 2,500,000 FREED ABS Trust, Series 2019-1 B^ 3.87% 06/18/2026 2,506,548 1,075,408 FREED ABS Trust, Series 2020-2CP A^ 4.52% 06/18/2027 1,088,693
2,000,000 GoldenTree Loan Opportunities XI, Ltd., Series 2015-11A AR2 (3 MonthLIBOR USD + 1.07%)^ 1.34% 01/21/2031 1,981,172
500,000 GreatAmerica Leasing Receivables Funding LLC, Series 2019-1 B^ 3.37% 02/18/2025 528,830 500,000 GreatAmerica Leasing Receivables Funding LLC, Series 2019-1 C^ 3.54% 02/17/2026 529,033 500,000 HPEFS Equipment Trust, Series 2019-1A D^ 2.72% 09/20/2029 511,307 750,000 HPEFS Equipment Trust, Series 2020-1A C^ 2.03% 02/20/2030 761,217 1,000,000 HPEFS Equipment Trust, Series 2020-1A D^ 2.26% 02/20/2030 1,007,137 1,380,000 Invitation Homes Trust, Series 2017-SFR2 B (1 Month LIBOR USD + 1.15%)^ 1.30% 12/19/2036 1,384,041 1,200,000 Invitation Homes Trust, Series 2017-SFR2 C (1 Month LIBOR USD + 1.45%)^ 1.60% 12/19/2036 1,206,349 1,997,070 Invitation Homes Trust, Series 2017-SFR2 D (1 Month LIBOR USD + 1.80%)^ 1.95% 12/19/2036 2,009,359 800,000 Invitation Homes Trust, Series 2018-SFR1 B (1 Month LIBOR USD + 0.95%)^ 1.10% 03/19/2037 794,540 2,200,000 Invitation Homes Trust, Series 2018-SFR1 C (1 Month LIBOR USD + 1.25%)^ 1.40% 03/19/2037 2,207,686 3,024,319 Invitation Homes Trust, Series 2018-SFR2 A (1 Month LIBOR USD + 0.90%)^ 1.05% 06/18/2037 3,029,748 1,000,000 Invitation Homes Trust, Series 2018-SFR2 B (1 Month LIBOR USD + 1.08%)^ 1.23% 06/18/2037 998,258
2,100,000 Madison Park Funding XVI, Ltd., Series 2015-16A A2R (3 Month LIBOR USD+ 1.90%)^ 2.17% 04/20/2026 2,100,297
1,500,000 Mariner CLO LLC, Series 2016-3A AR2 (3 Month LIBOR USD + 0.99%)^ 1.25% 07/23/2029 1,488,370 2,346,073 MVW Owner Trust, Series 2017-1A A^ 2.42% 12/20/2034 2,395,953 2,250,000 Nationstar HECM Loan Trust, Series 2020-1 A#^ 1.27% 09/25/2030 2,252,362
704,246 Newtek Small Business Loan Trust, Series 2018-1 A (1 Month LIBOR USD +1.70%)^ 1.85% 02/25/2044 687,745
2,000,000 Octagon Investment Partners 36, Ltd., Series 2018-1A A1 (3 Month LIBOR USD+ 0.97%)^ 1.25% 04/15/2031 1,978,686
1,000,000 Octagon Investment Partners XIX, Ltd., Series 2014-1A CR (3 Month LIBORUSD + 2.10%)^ 2.38% 04/15/2026 997,407
1,000,000 Oportun Funding VIII LLC, Series 2018-A A^ 3.61% 03/08/2024 1,002,663 2,600,000 Oportun Funding X LLC, Series 2018-C A^ 4.10% 10/08/2024 2,646,550 2,000,000 PFS Financing Corp., Series 2020-F A^ 0.93% 08/15/2024 2,003,746 1,000,000 Prestige Auto Receivables Trust, Series 2019-1A D^ 3.01% 08/15/2025 1,030,701 1,300,000 Progress Residential Trust, Series 2017-SFR2 C^ 3.40% 12/19/2034 1,303,689 1,500,000 Progress Residential Trust, Series 2018-SFR1 C^ 3.68% 03/17/2035 1,518,271 1,140,612 Progress Residential Trust, Series 2018-SFR1 A^ 3.26% 03/19/2035 1,152,772 790,000 Santander Drive Auto Receivables Trust, Series 2019-3 D 2.68% 10/15/2025 813,626 364,000 SBA Tower Trust, Series 2020-1-2^ 2.33% 01/15/2028 371,189 2,700,000 Stack Infrastructure Issuer LLC, Series 2020-1A A2^ 1.89% 08/25/2045 2,726,827 2,625,000 Theorem Funding Trust 2020-1, Series 2020-1A A^ 2.48% 10/15/2026 2,638,611 1,250,000 Treman Park CLO, Ltd., Series 2015-1A ARR (3 Month LIBOR USD + 1.07%)^ 1.34% 10/20/2028 1,245,831 3,000,000 Vantage Data Centers LLC, Series 2020-1A A2^ 1.65% 09/15/2045 3,004,453 1,006,272 Westgate Resorts LLC, Series 2018-1A C^ 4.10% 12/20/2031 992,467 2,000,000 Westlake Automobile Receivables Trust, Series 2020-2A A2A^ 0.93% 02/15/2024 2,008,382 1,000,000 Westlake Automobile Receivables Trust, Series 2020-2A C^ 2.01% 07/15/2025 1,015,227 Total Asset Backed Securities (Cost $73,507,552) 74,010,791 U.S. Treasury Notes - 15.0% 29,405,000 United States Treasury Note 0.38% 03/31/2022 29,515,843 15,975,000 United States Treasury Note 1.88% 08/31/2022 16,508,540 15,460,000 United States Treasury Note 2.75% 04/30/2023 16,499,323

Total U.S. Treasury Notes (Cost $62,439,276) 62,523,706
Municipal Bonds - 1.0%230,000 American Municipal Power, Inc. 6.05% 02/15/2043 340,554
1,200,000 Health Care Authority for Baptist Health 5.50% 11/15/2043 1,618,368 2,000,000 Oregon Health & Science University 3.00% 07/01/2032 2,167,940
Total Municipal Bonds (Cost $3,528,215) 4,126,862
Shares/ParValue
Preferred Stocks - 0.3%
49,152 AGNC Investment Corp., Series C, 7.00% (Fixed until 10/15/2022, then 3 MonthLIBOR + 5.11%) 1,171,292
10,000 Annaly Capital Management, Inc., Series G, 6.50% (Fixed until 03/31/2023, then3 Month LIBOR + 4.17%) 209,200
Total Preferred Stocks (Cost $1,465,173) 1,380,492
Short-Term Investments - 4.6%Money Market Funds - 4.2%
17,604,047 First American Government Obligations Fund - Class Z, 0.05%* 17,604,047 U.S. Treasury Bills - 0.4%
1,800,000 United States Treasury Bill, 0.12%† 1,799,953 Total Short-Term Investments (Cost $19,403,962) 19,404,000 Total Investments - 109.4% (Cost $441,648,333) 457,970,674 Liabilities in Excess of Other Assets - (9.4)% (39,324,621)
NET ASSETS - 100.0% $ 418,646,053
# Variable rate security. Rate disclosed is as of the date of this report.^ Security exempt from registration under Rule 144A of the Securities Act of 1933. These securities may be resold in transactions exempt fromregistration, normally to qualified institutional buyers.~ Interest Only Security* Annualized seven-day yield as of the date of this report.† This security is pledged as collateral in connection with open futures contracts. Rate disclosed is yield to maturity as of the date of this report.
Various inputs may be used to determine the value of the Fund's investments. These inputs are summarized in three broad levels. The inputs ormethodologies used to value securities are not necessarily an indication of the risk associated with investing in those securities.
Level 1 - Quoted prices in active markets for identical securities.Level 2 - Evaluated price based on other significant observable inputs (including quoted prices for similar securities, interest rates, prepaymentspreads, creditLevel 3 - Significant unobservable inputs (including the Fund's own assumptions in determining the fair value of investments).
As of the date of this report, the Fund's investments in preferred stocks and money market funds, with a total market value of $18,984,539 werecategorized as Level 1, while the Fund's investments in corporate bonds & notes, asset backed securities, mortgage backed securities, municipalbonds, and U.S. Treasury Notes and Bills, with a total market value of $438,986,135, were categorized as Level 2. The Fund's investments infutures contracts, with total unrealized depreciation of $159,235, were valued using Level 1 inputs.

Futures Contracts - LongThe Brown Advisory Total Return Fund had the following open long futures contracts as of the date of this report:
Issue ContractsExpiration
DateNotionalAmount
NotionalValue
UnrealizedAppreciation
(Depreciation) U.S. Treasury 2-Year Note Futures 95 12/31/2020 $ 20,980,481 $ 20,991,289 $ 10,808 U.S. Treasury 5-Year Note Futures 44 12/31/2020 5,540,080 5,545,375 5,295 U.S. Treasury Long Bond Futures 39 12/21/2020 6,891,610 6,874,969 (16,641)U.S. Treasury Ultra Bond Futures 155 12/21/2020 34,416,809 34,380,937 (35,872)
$ 67,828,980 $ 67,792,570 $ (36,410)
Futures Contracts - ShortThe Brown Advisory Total Return Fund had the following open short futures contracts as of the date of this report:
Issue ContractsExpiration
DateNotionalAmount
NotionalValue
UnrealizedAppreciation
(Depreciation) U.S. Treasury 10-Year Note Futures (103) 12/21/2020 $ (14,320,188) $ (14,371,719) $ (51,531)U.S. Treasury 10-Year Ultra Note Futures (169) 12/21/2020 (26,955,503) (27,026,797) (71,294)
$ (41,275,691) $ (41,398,516) $ (122,825)
There is no variation margin due to or from the Fund as of the date of this report.
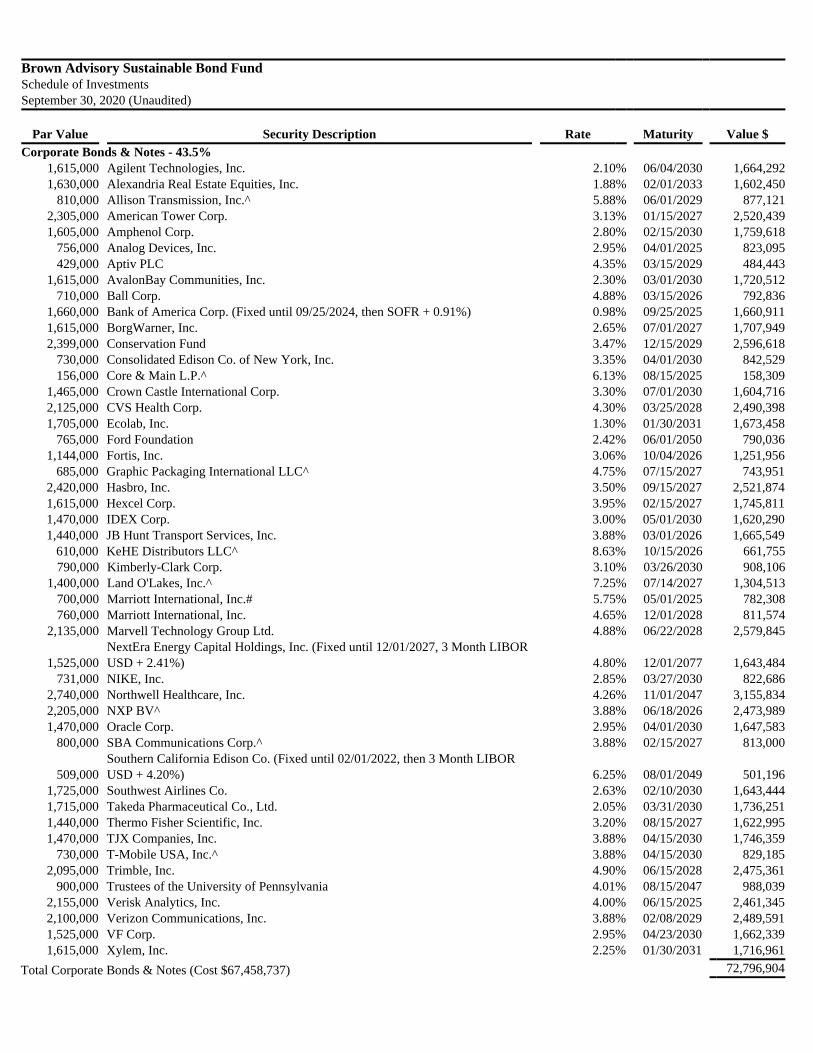
Brown Advisory Sustainable Bond FundSchedule of InvestmentsSeptember 30, 2020 (Unaudited)
Par Value Security Description Rate Maturity Value $Corporate Bonds & Notes - 43.5%
1,615,000 Agilent Technologies, Inc. 2.10% 06/04/2030 1,664,292 1,630,000 Alexandria Real Estate Equities, Inc. 1.88% 02/01/2033 1,602,450
810,000 Allison Transmission, Inc.^ 5.88% 06/01/2029 877,121 2,305,000 American Tower Corp. 3.13% 01/15/2027 2,520,439 1,605,000 Amphenol Corp. 2.80% 02/15/2030 1,759,618
756,000 Analog Devices, Inc. 2.95% 04/01/2025 823,095 429,000 Aptiv PLC 4.35% 03/15/2029 484,443
1,615,000 AvalonBay Communities, Inc. 2.30% 03/01/2030 1,720,512 710,000 Ball Corp. 4.88% 03/15/2026 792,836
1,660,000 Bank of America Corp. (Fixed until 09/25/2024, then SOFR + 0.91%) 0.98% 09/25/2025 1,660,911 1,615,000 BorgWarner, Inc. 2.65% 07/01/2027 1,707,949 2,399,000 Conservation Fund 3.47% 12/15/2029 2,596,618
730,000 Consolidated Edison Co. of New York, Inc. 3.35% 04/01/2030 842,529 156,000 Core & Main L.P.^ 6.13% 08/15/2025 158,309
1,465,000 Crown Castle International Corp. 3.30% 07/01/2030 1,604,716 2,125,000 CVS Health Corp. 4.30% 03/25/2028 2,490,398 1,705,000 Ecolab, Inc. 1.30% 01/30/2031 1,673,458
765,000 Ford Foundation 2.42% 06/01/2050 790,036 1,144,000 Fortis, Inc. 3.06% 10/04/2026 1,251,956
685,000 Graphic Packaging International LLC^ 4.75% 07/15/2027 743,951 2,420,000 Hasbro, Inc. 3.50% 09/15/2027 2,521,874 1,615,000 Hexcel Corp. 3.95% 02/15/2027 1,745,811 1,470,000 IDEX Corp. 3.00% 05/01/2030 1,620,290 1,440,000 JB Hunt Transport Services, Inc. 3.88% 03/01/2026 1,665,549
610,000 KeHE Distributors LLC^ 8.63% 10/15/2026 661,755 790,000 Kimberly-Clark Corp. 3.10% 03/26/2030 908,106
1,400,000 Land O'Lakes, Inc.^ 7.25% 07/14/2027 1,304,513 700,000 Marriott International, Inc.# 5.75% 05/01/2025 782,308 760,000 Marriott International, Inc. 4.65% 12/01/2028 811,574
2,135,000 Marvell Technology Group Ltd. 4.88% 06/22/2028 2,579,845
1,525,000 NextEra Energy Capital Holdings, Inc. (Fixed until 12/01/2027, 3 Month LIBORUSD + 2.41%) 4.80% 12/01/2077 1,643,484
731,000 NIKE, Inc. 2.85% 03/27/2030 822,686 2,740,000 Northwell Healthcare, Inc. 4.26% 11/01/2047 3,155,834 2,205,000 NXP BV^ 3.88% 06/18/2026 2,473,989 1,470,000 Oracle Corp. 2.95% 04/01/2030 1,647,583
800,000 SBA Communications Corp.^ 3.88% 02/15/2027 813,000
509,000 Southern California Edison Co. (Fixed until 02/01/2022, then 3 Month LIBORUSD + 4.20%) 6.25% 08/01/2049 501,196
1,725,000 Southwest Airlines Co. 2.63% 02/10/2030 1,643,444 1,715,000 Takeda Pharmaceutical Co., Ltd. 2.05% 03/31/2030 1,736,251 1,440,000 Thermo Fisher Scientific, Inc. 3.20% 08/15/2027 1,622,995 1,470,000 TJX Companies, Inc. 3.88% 04/15/2030 1,746,359
730,000 T-Mobile USA, Inc.^ 3.88% 04/15/2030 829,185 2,095,000 Trimble, Inc. 4.90% 06/15/2028 2,475,361
900,000 Trustees of the University of Pennsylvania 4.01% 08/15/2047 988,039 2,155,000 Verisk Analytics, Inc. 4.00% 06/15/2025 2,461,345 2,100,000 Verizon Communications, Inc. 3.88% 02/08/2029 2,489,591 1,525,000 VF Corp. 2.95% 04/23/2030 1,662,339 1,615,000 Xylem, Inc. 2.25% 01/30/2031 1,716,961
Total Corporate Bonds & Notes (Cost $67,458,737) 72,796,904

Mortgage Backed Securities - 18.1%
500,000 CAMB Commercial Mortgage Trust, Series 2019-LIFE B (1 Month LIBOR USD+ 1.25%)^ 1.40% 12/15/2037 498,375
500,000 CAMB Commercial Mortgage Trust, Series 2019-LIFE C (1 Month LIBOR USD+ 1.45%)^ 1.60% 12/15/2037 499,382
913,543 CGDBB Commercial Mortgage Trust, Series 2017-BIOC B (1 Month LIBORUSD + 0.97%) ^ 1.12% 07/15/2032 912,864
1,370,315 CGDBB Commercial Mortgage Trust, Series 2017-BIOC D (1 Month LIBORUSD + 1.60%)^ 1.75% 07/15/2032 1,370,439
456,772 CGDBB Commercial Mortgage Trust, Series 2017-BIOC E (1 Month LIBORUSD + 2.15%)^ 2.30% 07/15/2032 453,069
750,000 CORE Mortgage Trust, Series 2019-CORE C (1 Month LIBOR USD + 1.30%)^ 1.45% 12/15/2031 735,386 500,000 CSMC, Series 2019-ICE4 C (1 Month LIBOR USD + 1.43%)^ 1.58% 05/15/2036 497,517 1,350,000 CSMC, Series 2019-ICE4 D (1 Month LIBOR USD + 1.60%)^ 1.75% 05/15/2036 1,340,113 36,409 FHLMC STACR, Series 2014-HQ2 M2 (1 Month LIBOR USD + 2.20%) 2.35% 09/25/2024 36,435 500,000 FHLMC STACR, Series 2014-HQ2 M3 (1 Month LIBOR USD + 3.75%) 3.90% 09/25/2024 513,321 500,000 FHLMC STACR, Series 2015-HQ2 M3 (1 Month LIBOR USD + 3.25%) 3.40% 05/27/2025 502,197 174,208 FHMS, Series K-W01 A1 3.33% 05/25/2025 184,262 600,000 FHMS, Series K-G01 A7 2.88% 04/25/2026 661,679 587,822 FHMS, Series K-W03 X1#~ 0.98% 06/25/2027 24,722 300,000 FHMS, Series K-W03 A2 3.02% 06/25/2027 338,337 1,400,125 FHMS, Series Q-006 APT1# 2.67% 04/25/2028 1,433,946 636,383 FHMS, Series K-W04 A (1 Month LIBOR USD + 0.24%) 0.40% 09/25/2028 629,613 5,498,636 FHMS, Series K-G01 X1#~ 1.11% 04/25/2029 341,638 6,250,000 FHMS, Series K-G02 X1#~ 1.14% 08/25/2029 469,808 800,000 FHMS, Series K-G03 A2# 1.30% 06/25/2030 814,888 5,900,000 FHMS, Series K-G03 X1#~ 1.48% 06/25/2030 648,899 479,652 FHMS, Series Q-010 APT1# 2.94% 04/25/2046 482,150 874,253 FHMS, Series Q-007 APT1# 2.98% 10/25/2047 902,764 1,000,000 FHMS, Series Q-013 APT1# 1.16% 05/25/2050 1,147,071 173,664 FNMA, Pool# BK5105 5.50% 05/01/2048 198,211 174,378 FNMA, Pool# BK8032 5.50% 06/01/2048 199,047 155,137 FNMA, Pool# BN0202 5.50% 09/01/2048 177,086 147,385 FNMA, Pool# BN4936 5.50% 12/01/2048 164,564 202,770 FNMA, Pool# BN4921 5.50% 01/01/2049 227,583 300,000 FNMA REMIC Trust, Series 2017-M10 AV2# 2.64% 07/25/2024 315,732 80,000 FNMA REMIC Trust, Series 2017-M2 A2# 2.89% 02/25/2027 89,097 831,000 FNMA REMIC Trust, Series 2017-M13 A2# 3.04% 09/25/2027 943,164 930,000 FNMA REMIC Trust, Series 2019-M1 A2# 3.67% 09/25/2028 1,107,793 1,000,000 FREMF Mortgage Trust, Series 2020-K737#^ 3.41% 11/25/2026 1,091,119 1,000,000 FREMF Mortgage Trust, Series 2019-K89 B#^ 4.43% 01/25/2051 1,172,764 1,000,000 FREMF Mortgage Trust, Series 2019-K734 B#^ 4.19% 02/25/2051 1,092,744 1,250,000 FREMF Mortgage Trust, Series 2019-K735 B#^ 4.16% 05/25/2052 1,398,358 399,457 IMT Trust, Series 2017-APTS BFL (1 Month LIBOR USD + 0.95%)^ 1.10% 06/15/2034 393,863 1,008,583 IMT Trust, Series 2017-APTS CFL (1 Month LIBOR USD + 1.10%)^ 1.25% 06/15/2034 991,234 1,000,000 JPMCC, Series 2019-MFP C (1 Month LIBOR USD + 1.36%)^ 1.51% 07/15/2036 965,631 1,345,000 KNDL Mortgage Trust, Series 2019-KNSQ C (1 Month LIBOR USD + 1.05%)^ 1.20% 05/15/2036 1,335,738 700,000 MRCD Mortgage Trust, Series 2019-PARK C^ 2.72% 12/15/2036 706,880 200,000 MSC, Series 2017-CLS A (1 Month LIBOR USD + 0.70%)^ 0.85% 11/15/2034 199,617 1,110,000 MSC, Series 2017-CLS D (1 Month LIBOR USD + 1.40%)^ 1.55% 11/15/2034 1,104,909 1,000,000 Natixis Commercial Mortgage Securities Trust, Series 2020-2PAC C^ 3.40% 12/16/2038 1,007,650 Total Mortgage Backed Securities (Cost $29,238,112) 30,321,659 Municipal Bonds - 14.3% 300,000 Atlanta Georgia Development Authority 3.57% 12/01/2036 324,681 2,650,000 California Health Facilities Financing Authority 3.03% 06/01/2034 2,805,767 1,625,000 California Municipal Finance Authority 2.88% 11/01/2035 1,699,799 100,000 Honolulu, City & County Hawaii 3.00% 09/01/2027 113,235 850,000 Honolulu, City & County Hawaii 4.00% 09/01/2036 971,508 30,000 Los Angeles California Community College District 6.60% 08/01/2042 50,971
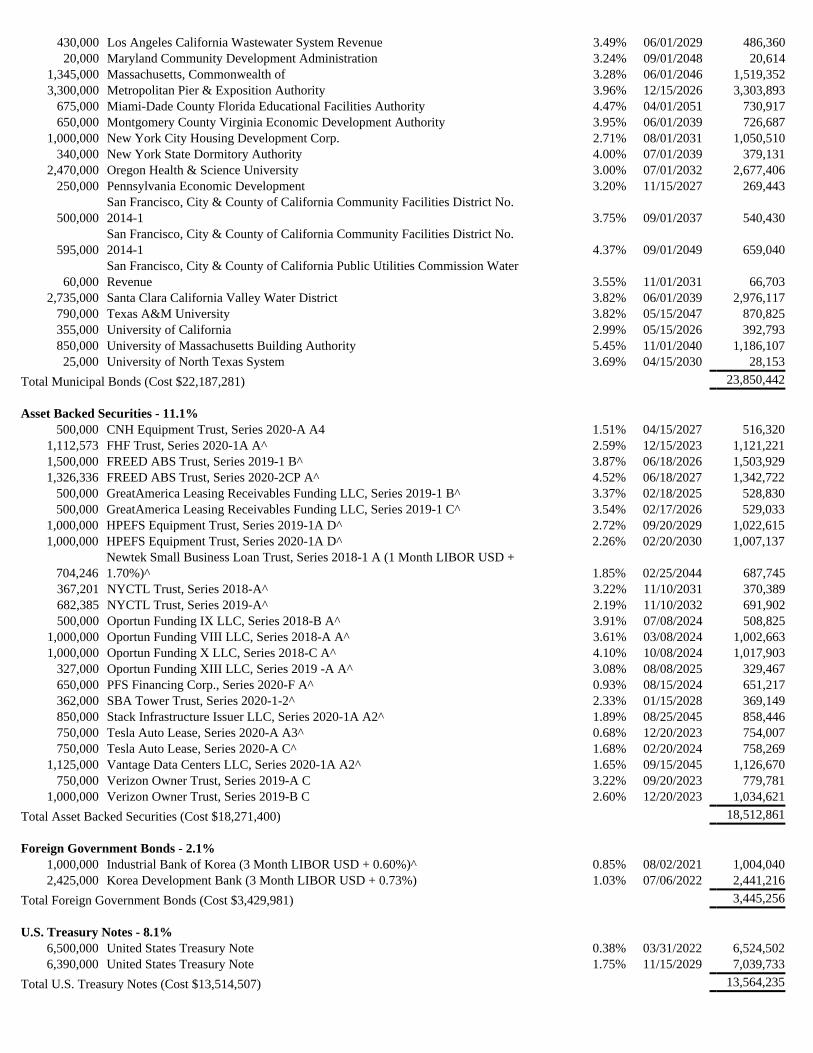
430,000 Los Angeles California Wastewater System Revenue 3.49% 06/01/2029 486,360 20,000 Maryland Community Development Administration 3.24% 09/01/2048 20,614 1,345,000 Massachusetts, Commonwealth of 3.28% 06/01/2046 1,519,352 3,300,000 Metropolitan Pier & Exposition Authority 3.96% 12/15/2026 3,303,893 675,000 Miami-Dade County Florida Educational Facilities Authority 4.47% 04/01/2051 730,917 650,000 Montgomery County Virginia Economic Development Authority 3.95% 06/01/2039 726,687 1,000,000 New York City Housing Development Corp. 2.71% 08/01/2031 1,050,510 340,000 New York State Dormitory Authority 4.00% 07/01/2039 379,131 2,470,000 Oregon Health & Science University 3.00% 07/01/2032 2,677,406 250,000 Pennsylvania Economic Development 3.20% 11/15/2027 269,443
500,000 San Francisco, City & County of California Community Facilities District No.2014-1 3.75% 09/01/2037 540,430
595,000 San Francisco, City & County of California Community Facilities District No.2014-1 4.37% 09/01/2049 659,040
60,000 San Francisco, City & County of California Public Utilities Commission WaterRevenue 3.55% 11/01/2031 66,703
2,735,000 Santa Clara California Valley Water District 3.82% 06/01/2039 2,976,117 790,000 Texas A&M University 3.82% 05/15/2047 870,825 355,000 University of California 2.99% 05/15/2026 392,793 850,000 University of Massachusetts Building Authority 5.45% 11/01/2040 1,186,107 25,000 University of North Texas System 3.69% 04/15/2030 28,153 Total Municipal Bonds (Cost $22,187,281) 23,850,442 Asset Backed Securities - 11.1% 500,000 CNH Equipment Trust, Series 2020-A A4 1.51% 04/15/2027 516,320 1,112,573 FHF Trust, Series 2020-1A A^ 2.59% 12/15/2023 1,121,221 1,500,000 FREED ABS Trust, Series 2019-1 B^ 3.87% 06/18/2026 1,503,929 1,326,336 FREED ABS Trust, Series 2020-2CP A^ 4.52% 06/18/2027 1,342,722 500,000 GreatAmerica Leasing Receivables Funding LLC, Series 2019-1 B^ 3.37% 02/18/2025 528,830 500,000 GreatAmerica Leasing Receivables Funding LLC, Series 2019-1 C^ 3.54% 02/17/2026 529,033 1,000,000 HPEFS Equipment Trust, Series 2019-1A D^ 2.72% 09/20/2029 1,022,615 1,000,000 HPEFS Equipment Trust, Series 2020-1A D^ 2.26% 02/20/2030 1,007,137
704,246 Newtek Small Business Loan Trust, Series 2018-1 A (1 Month LIBOR USD +1.70%)^ 1.85% 02/25/2044 687,745
367,201 NYCTL Trust, Series 2018-A^ 3.22% 11/10/2031 370,389 682,385 NYCTL Trust, Series 2019-A^ 2.19% 11/10/2032 691,902 500,000 Oportun Funding IX LLC, Series 2018-B A^ 3.91% 07/08/2024 508,825 1,000,000 Oportun Funding VIII LLC, Series 2018-A A^ 3.61% 03/08/2024 1,002,663 1,000,000 Oportun Funding X LLC, Series 2018-C A^ 4.10% 10/08/2024 1,017,903 327,000 Oportun Funding XIII LLC, Series 2019 -A A^ 3.08% 08/08/2025 329,467 650,000 PFS Financing Corp., Series 2020-F A^ 0.93% 08/15/2024 651,217 362,000 SBA Tower Trust, Series 2020-1-2^ 2.33% 01/15/2028 369,149 850,000 Stack Infrastructure Issuer LLC, Series 2020-1A A2^ 1.89% 08/25/2045 858,446 750,000 Tesla Auto Lease, Series 2020-A A3^ 0.68% 12/20/2023 754,007 750,000 Tesla Auto Lease, Series 2020-A C^ 1.68% 02/20/2024 758,269 1,125,000 Vantage Data Centers LLC, Series 2020-1A A2^ 1.65% 09/15/2045 1,126,670 750,000 Verizon Owner Trust, Series 2019-A C 3.22% 09/20/2023 779,781 1,000,000 Verizon Owner Trust, Series 2019-B C 2.60% 12/20/2023 1,034,621 Total Asset Backed Securities (Cost $18,271,400) 18,512,861 Foreign Government Bonds - 2.1% 1,000,000 Industrial Bank of Korea (3 Month LIBOR USD + 0.60%)^ 0.85% 08/02/2021 1,004,040 2,425,000 Korea Development Bank (3 Month LIBOR USD + 0.73%) 1.03% 07/06/2022 2,441,216 Total Foreign Government Bonds (Cost $3,429,981) 3,445,256 U.S. Treasury Notes - 8.1% 6,500,000 United States Treasury Note 0.38% 03/31/2022 6,524,502 6,390,000 United States Treasury Note 1.75% 11/15/2029 7,039,733 Total U.S. Treasury Notes (Cost $13,514,507) 13,564,235

Shares/ParValue
Short-Term Investments - 2.9%Money Market Funds - 2.8%
4,661,227 First American Government Obligations Fund - Class Z, 0.05%* 4,661,227 U.S. Treasury Bills - 0.1%
250,000 United States Treasury Bill, 0.12%† 249,993 Total Short-Term Investments (Cost $4,911,215) 4,911,220 Total Investments - 100.1% (Cost $159,011,233) 167,402,577 Liabilities in Excess of Other Assets - (0.1)% (145,204)
NET ASSETS - 100.0% $ 167,257,373
# Variable rate security. Rate disclosed is as of the date of this report.^Security exempt from registration under Rule 144A of the Securities Act of 1933. These securities may be resold in transactionsexempt from registration, normally to qualified institutional buyers.~ Interest Only Security*Annualized seven-day yield as of the date of this report.† This security is pledged as collateral in connection with open futures contracts. Rate disclosed is yield to maturity as of the date ofthis report.
Various inputs may be used to determine the value of the Fund's investments. These inputs are summarized inthree broad levels. The inputs ormethodologies used to value securities are not necessarily an indication of the risk associated withinvesting in those securities.
Level 1 - Quoted prices in active markets for identical securities.Level 2 - Evaluated price based on other significant observable inputs (including quoted prices for similarsecurities, interest rates, prepayment spreads, creditrisk, etc.).Level 3 - Significant unobservable inputs (including the Fund's own assumptions in determiningthe fair value of investments).
As of the date of this report, the Fund's money market fund, with a total market value of $4,661,227, were categorized as Level 1,while the Fund's investments in corporate bonds & notes,mortgage backed securities, municipal bonds, asset backed securities, foreign government bonds and U.S. Treasury Notes and Bills,with a total market value of $162,741,350, were categorized as Level 2.The Fund's investments in long and short futures contracts, with unrealized depreciation of$84,736, were valued using Level 1 inputs.

Futures Contracts - LongThe Brown Advisory Sustainable Bond Fund had the following open long futures contracts as of the date of this report:
Issue ContractsExpiration
DateNotionalAmount
NotionalValue
UnrealizedAppreciation
(Depreciation) U.S. Treasury 2-Year Note Futures 103 12/31/2020 $ 22,748,187 $ 22,758,977 $ 10,790 U.S. Treasury 5-Year Note Futures 70 12/31/2020 8,813,760 8,822,187 8,427 U.S. Treasury Long Bond Futures 29 12/21/2020 5,124,530 5,112,156 (12,374)U.S. Treasury Ultra Bond Futures 32 12/21/2020 7,105,406 7,098,000 (7,406)
$ 43,791,883 $ 43,791,320 $ (563)Futures Contracts - ShortThe Brown Advisory Sustainable Bond Fund had the following open short futures contracts as of the date of this report:
Issue ContractsExpiration
DateNotionalAmount
NotionalValue
UnrealizedAppreciation
(Depreciation) U.S. Treasury 10-Year Note Futures (87) 12/21/2020 $ (12,110,936) $ (12,139,219) $ (28,283)U.S. Treasury 10-Year Ultra Note Futures (131) 12/21/2020 (20,893,875) (20,949,765) (55,890)
$ (33,004,811) $ (33,088,984) $ (84,173)
There is no variation margin due to or from the Fund as of the date of this report.

Brown Advisory Maryland Bond Fund Schedule of Investments September 30, 2020 (Unaudited)
Par Value Security Description Rate Maturity Value $ Municipal Bonds - 98.1% General Obligation Bonds - 19.2% 1,650,000 Baltimore County Maryland 5.00% 08/01/2028 1,925,055 6,000,000 Baltimore County Maryland 5.00% 03/01/2032 7,933,680 5,000,000 Baltimore County Maryland 4.00% 03/01/2036 6,032,150 1,080,000 Baltimore, Maryland 5.00% 10/15/2032 1,363,133 2,400,000 Maryland State 5.00% 08/01/2024 2,838,840 1,400,000 Maryland State 5.00% 08/01/2031 1,825,124 5,000,000 Montgomery County Maryland 5.00% 11/01/2023 5,746,500 5,000,000 Prince George's County Maryland 4.00% 07/15/2037 5,931,050 33,595,532 Revenue Bonds - 78.9% 1,000,000 Austin, Texas 7.88% 09/01/2026 1,019,090 1,000,000 Baltimore, Maryland 5.00% 07/01/2028 1,247,050 1,320,000 Baltimore, Maryland 5.00% 07/01/2028 1,650,660 520,000 Baltimore, Maryland 5.00% 06/15/2030 582,020 1,000,000 Baltimore, Maryland 5.00% 07/01/2032 1,128,200 670,000 Baltimore, Maryland 5.00% 06/15/2033 742,326 1,000,000 Baltimore, Maryland 4.00% 07/01/2034 1,195,180 1,600,000 Baltimore, Maryland 5.00% 07/01/2035 1,932,432 1,260,000 Baltimore, Maryland^ 3.50% 06/01/2039 1,182,409 1,750,000 California Municipal Finance Authority^ 5.00% 11/01/2039 1,885,292 1,550,000 Franklin County Ohio 5.00% 11/15/2034 1,643,294 1,000,000 Frederick County Maryland^ 5.00% 09/01/2027 1,077,480 5,050,000 Frederick County Maryland^ 5.00% 09/01/2032 5,431,174 1,110,000 Frederick County Maryland^ 5.00% 09/01/2037 1,174,369 1,410,000 Frederick County Maryland 3.75% 07/01/2039 1,321,184 2,169,000 Frederick County Maryland 5.50% 07/01/2040 2,172,796 1,000,000 Gaithersburg, City of Maryland 5.00% 01/01/2028 1,102,340 2,000,000 Gaithersburg, City of Maryland 5.00% 01/01/2033 2,177,020 2,000,000 Lancaster County Pennsylvania Hospital Authority 5.00% 07/01/2035 2,110,360 1,245,000 Maryland Community Development Administration 5.00% 09/01/2030 1,591,347 1,030,000 Maryland Community Development Administration 5.00% 09/01/2031 1,304,567 1,000,000 Maryland Community Development Administration 3.25% 03/01/2036 1,066,920
1,140,000 Maryland Community Development Administration Local GovernmentInfrastructure 4.00% 06/01/2035 1,375,228
5,000,000 Maryland Economic Development Corp. 5.00% 06/01/2026 5,159,150 700,000 Maryland Economic Development Corp. 5.00% 06/01/2027 745,647 400,000 Maryland Economic Development Corp. 5.00% 07/01/2027 411,088 850,000 Maryland Economic Development Corp. 5.00% 07/01/2031 906,559 1,000,000 Maryland Economic Development Corp.# 0.14% 02/15/2043 1,000,000 4,500,000 Maryland Economic Development Corp. 4.50% 07/01/2044 4,396,950 830,000 Maryland Stadium Authority# 0.11% 03/01/2026 830,000 3,000,000 Maryland Stadium Authority 5.00% 05/01/2030 3,605,700 1,055,000 Maryland State Department of Transportation 4.00% 05/15/2022 1,120,674 1,715,000 Maryland State Department of Transportation 5.00% 10/01/2027 2,164,244 485,000 Maryland State Health & Higher Educational Facilities 5.00% 07/01/2023 500,695 500,000 Maryland State Health & Higher Educational Facilities 5.00% 08/15/2023 561,685 500,000 Maryland State Health & Higher Educational Facilities 5.00% 07/01/2024 534,995 1,000,000 Maryland State Health & Higher Educational Facilities 6.00% 07/01/2025 1,036,200 1,060,000 Maryland State Health & Higher Educational Facilities 5.00% 07/01/2025 1,148,499 1,450,000 Maryland State Health & Higher Educational Facilities 5.00% 07/01/2025 1,668,587 1,500,000 Maryland State Health & Higher Educational Facilities 5.00% 07/01/2025 1,768,365

2,500,000 Maryland State Health & Higher Educational Facilities 5.25% 07/01/2026 2,955,625 420,000 Maryland State Health & Higher Educational Facilities 5.00% 07/01/2026 504,462 1,605,000 Maryland State Health & Higher Educational Facilities 5.00% 07/01/2028 1,810,713 3,500,000 Maryland State Health & Higher Educational Facilities 5.00% 07/01/2029 4,379,795 100,000 Maryland State Health & Higher Educational Facilities 4.00% 10/01/2030 108,531 1,130,000 Maryland State Health & Higher Educational Facilities 6.25% 07/01/2031 1,165,335 300,000 Maryland State Health & Higher Educational Facilities 4.00% 10/01/2031 324,654 1,070,000 Maryland State Health & Higher Educational Facilities 5.00% 07/01/2032 1,196,442 250,000 Maryland State Health & Higher Educational Facilities 5.00% 06/01/2033 280,990 1,250,000 Maryland State Health & Higher Educational Facilities 5.00% 08/15/2033 1,440,988 1,955,000 Maryland State Health & Higher Educational Facilities 5.00% 07/01/2034 2,277,145 1,000,000 Maryland State Health & Higher Educational Facilities# 0.11% 04/01/2035 1,000,000 1,300,000 Maryland State Health & Higher Educational Facilities# 0.10% 04/01/2035 1,300,000 200,000 Maryland State Health & Higher Educational Facilities 4.50% 07/01/2035 200,082 430,000 Maryland State Health & Higher Educational Facilities 5.00% 06/01/2036 479,790 1,200,000 Maryland State Health & Higher Educational Facilities 5.00% 07/01/2037 1,364,472 1,500,000 Maryland State Health & Higher Educational Facilities 5.00% 07/01/2038 1,647,555 1,310,000 Maryland State Health & Higher Educational Facilities 5.00% 07/01/2043 1,432,773 4,000,000 Maryland State Health & Higher Educational Facilities# 5.00% 07/01/2045 4,967,720 4,255,000 Maryland State Transportation Authority 5.00% 03/01/2022 4,504,471 1,000,000 Maryland State Transportation Authority 5.00% 06/01/2022 1,065,310 2,500,000 Maryland State Transportation Authority 5.00% 07/01/2023 2,830,825 850,000 Maryland State Transportation Authority 5.00% 07/01/2024 1,001,530 1,510,000 Maryland State Transportation Authority 5.00% 07/01/2025 1,842,729 4,420,000 Maryland State Transportation Authority 5.00% 07/01/2028 5,629,887 4,330,000 Maryland State Transportation Authority 4.00% 06/01/2035 4,830,158 1,500,000 Metropolitan Washington DC Airports Authority 5.00% 10/01/2039 1,836,525 1,185,000 New Hope Texas Cultural Education Facilities Finance Corp. 5.75% 07/01/2051 1,011,883 2,000,000 Newport News Virginia Economic Development Authority 5.00% 12/01/2031 2,152,260 2,000,000 North Carolina Medical Care Commission 5.00% 10/01/2031 2,106,800 1,005,000 Prince William County Virginia Industrial Development Authority 5.00% 01/01/2023 1,047,873 1,000,000 St Mary's College of Maryland 4.00% 09/01/2024 1,106,730 4,335,000 University System of Maryland 5.00% 04/01/2022 4,650,675 3,280,000 Washington State Housing Finance Commission^ 4.00% 01/01/2026 3,406,050 2,900,000 Washington Suburban Sanitary Commission# 0.12% 06/01/2023 2,900,000 2,700,000 Washington Suburban Sanitary Commission 4.00% 06/01/2032 3,342,573 137,775,127 Total Municipal Bonds (Cost $165,395,789) 171,370,659
Shares Short-Term Investments - 1.1% Money Market Funds - 1.1% 1,829,393 First American Government Obligations Fund - Class Z, 0.05%* 1,829,393 Total Short-Term Investments (Cost $1,829,393) 1,829,393 Total Investments - 99.2% (Cost $167,225,182) 173,200,052 Other Assets in Excess of Liabilities - 0.8% 1,459,723
NET ASSETS - 100.0% $ 174,659,775 ^ Security exempt from registration under Rule 144A of the Securities Act of 1933. These securities may be resold in transactionsexempt from registration, normally to qualified institutional buyers. # Variable rate security. Rate disclosed is as of the date of this report. * Annualized seven-day yield as of the date of this report. Various inputs may be used to determine the value of the Fund's investments. These inputs are summarized in three broad levels. The inputs ormethodologies used to value securities are not necessarily an indication of the risk associated with investing in those securities. Level 1 - Quoted prices in active markets for identical securities. Level 2 - Evaluated price based on other significant observable inputs (including quoted prices for similar securities, interest rates,prepayment spreads, credit risk, etc.).

Level 3 - Significant unobservable inputs (including the Fund's own assumptions in determining the fair value of investments). As of the date of this report, the Fund's short-term investments were categorized as Level 1, while the Fund's investments inmunicipal bonds were categorized as Level 2.

Brown Advisory Tax-Exempt Bond Fund Schedule of Investments September 30, 2020 (Unaudited)
Par Value Security Description Rate Maturity Value $ Municipal Bonds - 97.2% General Obligation Bonds - 13.5% 4,480,000 Alameda California Unified School District+ 2.46% 08/01/2032 3,655,411 3,600,000 California, State of 4.00% 11/01/2033 4,267,296 2,000,000 California, State of 4.00% 11/01/2034 2,365,060 2,800,000 Chicago Illinois Park District 5.75% 01/01/2038 3,074,568 9,000,000 Florida, State of 4.00% 07/01/2028 9,242,730 8,045,000 Grossmont California Healthcare District+ 2.45% 07/15/2033 6,399,154 5,000,000 Hartnell California Community College District 3.00% 08/01/2048 5,287,800 25,140,000 Illinois, State of 5.00% 11/01/2024 26,797,983 14,295,000 Illinois, State of 5.00% 11/01/2025 15,374,272 5,000,000 Kane, McHenry, Cook & DeKalb Counties Illinois Unit School District No. 300 5.25% 01/01/2033 5,506,600 1,435,000 Lane County Oregon School District No. 19 Springfield+ 3.49% 06/15/2032 1,169,625 5,240,000 Louisiana, State of 4.00% 05/01/2035 5,804,767 1,280,000 Madera California Unified School District+ 3.16% 08/01/2029 1,133,760 2,895,000 Massachusetts, Commonwealth of (3 Month LIBOR USD + 0.57%) 0.74% 05/01/2037 2,818,022 830,000 Massachusetts, Commonwealth of (3 Month LIBOR USD + 0.57%) 0.74% 05/01/2037 807,930
6,160,000 McHenry & Kane Counties of Illinois Community Consolidated School DistrictNo. 158 Huntley 5.00% 01/15/2033 6,506,377
5,255,000 Memphis, City of Tennessee 4.00% 05/01/2033 6,274,575 17,005,000 New York, City of New York 4.00% 08/01/2037 19,592,141 4,015,000 New York, City of New York 5.00% 03/01/2043 4,929,456 10,690,000 Palomar Health+ 4.19% 08/01/2039 6,863,515 4,600,000 Texas, State of 5.00% 08/01/2036 4,767,808 4,640,000 Twin Rivers California Unified School District+ 2.37% 08/01/2032 3,719,934 5,315,000 Victor Valley California Union High School District+ 3.76% 08/01/2035 3,877,452 8,300,000 West Contra Costa Unified School District+ 2.44% 08/01/2033 6,519,235 156,755,471 Revenue Bonds - 83.7% 8,990,000 Anaheim California Public Financing Authority+ 2.74% 09/01/2031 7,328,738 1,285,000 Arizona Sports & Tourism Authority 5.00% 07/01/2028 1,357,705 1,500,000 Arlington, Texas 5.00% 02/15/2037 1,791,885 10,000,000 Austin Texas Water & Wastewater System Revenue 5.00% 11/15/2043 11,424,900 4,275,000 Austin, Texas 7.88% 09/01/2026 4,356,610 17,000,000 Black Belt Energy Gas District# 4.00% 12/01/2048 18,599,020 10,475,000 Buckeye Ohio Tobacco Settlement Financing Authority 4.00% 06/01/2038 12,259,207 14,000,000 California Public Finance Authority# 1.38% 08/01/2052 14,000,000 18,625,000 Cedar Rapids, Iowa# 0.23% 08/15/2029 17,926,562 8,375,000 Cedar Rapids, Iowa# 0.25% 08/15/2032 7,998,125 16,840,000 Central Plains Energy Project 5.25% 09/01/2037 18,166,487 4,000,000 Chicago Illinois Waterworks Revenue 5.00% 11/01/2039 4,463,440 6,330,000 Chicago O'Hare International Airport 5.00% 01/01/2033 7,310,770 1,300,000 Colorado Health Facilities Authority 5.00% 12/01/2027 1,391,026 7,715,000 Colorado Health Facilities Authority 5.00% 12/01/2035 8,620,124 5,530,000 Dauphin County Pennsylvania General Authority 5.00% 06/01/2042 5,832,380 2,500,000 Delaware State Health Facilities Authority 5.00% 06/01/2034 2,969,700
15,000,000 Delaware Valley Pennsylvania Regional Finance Authority (3 Month LIBORUSD + 0.75%) 0.92% 06/01/2037 13,590,900
6,750,000 Denver Colorado Airport System Revenue 5.00% 12/01/2034 9,109,057 9,150,000 Denver Colorado Airport System Revenue 5.00% 12/01/2036 12,494,782 9,000,000 Detroit Michigan Sewage Disposal System (3 Month LIBOR USD + 0.60%) 0.80% 07/01/2032 8,588,790 4,855,000 District of Columbia 5.00% 03/01/2038 6,347,427 15,000,000 Golden State Tobacco Securitization Corp. 5.00% 06/01/2031 18,493,950

14,260,000 Golden State Tobacco Securitization Corp. 5.00% 06/01/2032 17,489,747 6,800,000 Grand Forks County North Dakota 6.38% 12/15/2043 5,760,756 11,150,000 Harris County Texas (3 Month LIBOR USD + 0.67%) 0.86% 08/15/2035 10,273,498 3,865,000 Harris County Texas Sports Authority+ 4.41% 11/15/2034 2,252,367 1,200,000 Henrico County Virginia Economic Development Authority# 0.26% 08/23/2027 1,200,000 6,070,000 Imperial California Irrigation District Electric System Revenue 4.00% 11/01/2037 7,017,770 3,720,000 Kansas City Missouri Municipal Assistance Corp.+ 3.03% 04/15/2026 3,498,995 3,000,000 Lancaster County Pennsylvania Hospital Authority 5.00% 07/01/2035 3,165,540 2,280,000 Las Vegas Nevada Redevelopment Agency 5.00% 06/15/2028 2,670,222 5,235,000 Lees Summit Missouri Industrial Development Authority 5.25% 08/15/2039 5,378,334 3,000,000 Louisiana Public Facilities Authority 3.50% 06/01/2030 3,056,310 1,000,000 Louisiana Public Facilities Authority 5.00% 06/01/2036 1,157,760 10,595,000 Louisiana State Gasoline & Fuels Tax Revenue 5.00% 05/01/2036 12,412,678 7,000,000 Louisiana State Gasoline & Fuels Tax Revenue 5.00% 05/01/2041 8,165,150 16,005,000 Love Field Texas Airport Modernization Corp. 5.00% 11/01/2028 16,606,308 10,370,000 Love Field Texas Airport Modernization Corp. 5.25% 11/01/2040 10,392,399 25,000,000 Main Street Natural Gas, Inc. (1 Month LIBOR USD + 0.75%) 0.85% 04/01/2048 24,979,250 39,000,000 Main Street Natural Gas, Inc. (1 Month LIBOR USD + 0.83%) 0.93% 08/01/2048 39,037,050 10,000,000 Main Street Natural Gas, Inc.# 4.00% 03/01/2050 11,620,400 5,030,000 Maryland Health & Higher Educational Facilities Authority 5.50% 01/01/2036 5,756,080 1,215,000 Massachusetts Health & Educational Facilities Authority# 0.37% 07/01/2023 1,215,000 3,900,000 Massachusetts Health & Educational Facilities Authority# 0.40% 07/01/2023 3,900,000 1,000,000 Massachusetts Health & Educational Facilities Authority# 0.37% 07/01/2023 1,000,000 4,105,000 Massachusetts Housing Finance Agency 4.00% 12/01/2033 4,270,062 10,000,000 Metropolitan Pier & Exposition Authority+ 4.25% 06/15/2035 6,038,500 10,165,000 Metropolitan Pier & Exposition Authority+ 4.15% 06/15/2037 5,640,762 10,470,000 Metropolitan Pier & Exposition Authority+ 3.73% 06/15/2038 5,576,113 10,000,000 Metropolitan Pier & Exposition Authority 4.00% 06/15/2050 10,156,800 5,225,000 Metropolitan Pier & Exposition Authority 5.00% 06/15/2057 5,685,479 1,705,000 Metropolitan Transportation Authority+ 3.20% 11/15/2029 1,248,742 6,000,000 Metropolitan Transportation Authority+ 3.61% 11/15/2033 3,634,740 17,370,000 Metropolitan Transportation Authority 5.00% 11/15/2038 17,761,694 10,000,000 Metropolitan Transportation Authority 5.00% 11/15/2038 10,266,000 10,000,000 Metropolitan Transportation Authority 5.25% 11/15/2044 10,358,900 2,895,000 Miami Beach Florida Health Facilities 5.00% 11/15/2029 3,067,803 6,760,000 Miami-Dade County Florida Water & Sewer System Revenue 4.00% 10/01/2035 7,899,398 3,495,000 Michigan State Housing Development Authority 4.00% 10/01/2042 3,595,761 725,000 Minneapolis & St. Paul, Minnesota Housing & Redevelopment Authority# 0.12% 08/01/2027 707,781 4,345,000 Minneapolis & St. Paul, Minnesota Metropolitan Airports Commission 5.00% 01/01/2022 4,584,974 1,080,000 New Hope Texas Cultural Education Facilities Finance Corp. 5.00% 07/01/2031 969,905 1,750,000 New Hope Texas Cultural Education Facilities Finance Corp. 5.25% 07/01/2036 1,534,610 1,250,000 New Hope Texas Cultural Education Facilities Finance Corp. 5.50% 07/01/2046 1,053,600 4,000,000 New Hope Texas Cultural Education Facilities Finance Corp. 5.00% 07/01/2046 3,381,640 1,000,000 New Hope Texas Cultural Education Facilities Finance Corp. 5.75% 07/01/2051 853,910 10,175,000 New Jersey Transportation Trust Fund Authority+ 3.03% 12/15/2038 5,758,847 15,000,000 New Mexico Municipal Energy Acquisition Authority# 5.00% 11/01/2039 17,855,550 16,000,000 New York & New Jersey Port Authority 4.00% 03/15/2030 18,381,120 6,225,000 New York & New Jersey Port Authority 5.00% 10/15/2032 6,477,673 12,250,000 New York & New Jersey Port Authority 4.00% 11/01/2034 13,954,465 2,375,000 New York City Industrial Development Agency 5.00% 01/01/2039 2,375,309 3,000,000 New York City Industrial Development Agency 5.00% 01/01/2046 2,954,880 7,575,000 New York City Transitional Finance Authority Future Tax Secured Revenue 4.00% 05/01/2043 8,572,476 2,340,000 New York City Transitional Finance Authority Future Tax Secured Revenue 4.00% 05/01/2045 2,682,529 5,000,000 New York Convention Center Development Corp.+ 3.77% 11/15/2041 2,351,650 5,000,000 New York Convention Center Development Corp.+ 2.67% 11/15/2043 2,154,500 2,000,000 New York State Dormitory Authority 5.00% 03/15/2036 2,359,680 20,035,000 New York State Thruway Authority 5.00% 01/01/2037 25,519,581 10,000,000 New York State Urban Development Corp. 3.00% 03/15/2040 10,719,600 6,850,000 New York State Urban Development Corp. 4.00% 03/15/2045 7,863,115 13,260,000 New York Transportation Development Corp. 4.00% 10/01/2030 13,578,770

5,000,000 New York Transportation Development Corp. 4.00% 07/01/2041 5,108,500 3,375,000 Newport News Virginia Economic Development Authority 5.00% 12/01/2031 3,631,939 1,760,000 Niagara County New York Tobacco Asset Securitization Corp. 5.00% 05/15/2024 1,901,170 2,000,000 North Carolina Medical Care Commission 5.00% 10/01/2031 2,106,800 3,765,000 North Carolina Turnpike Authority+ 3.93% 01/01/2034 2,642,013 4,165,000 North Texas Tollway Authority 5.00% 01/01/2032 4,859,222 1,925,000 Ohio, State of# 0.19% 09/01/2041 1,912,526 1,000,000 Onondaga County New York Trust for Cultural Resources 4.00% 12/01/2049 1,146,720 5,790,000 Oregon State Facilities Authority 5.00% 10/01/2031 6,839,785 1,000,000 Park Creek Colorado Metropolitan District 5.00% 12/01/2034 1,172,200 10,000,000 Pennsylvania Turnpike Commission 5.00% 06/01/2029 11,975,400 6,360,000 Pennsylvania Turnpike Commission 4.00% 12/01/2036 7,212,812 10,500,000 Philadelphia Pennsylvania Airport Revenue 5.00% 06/15/2027 10,799,250 11,000,000 Philadelphia Pennsylvania Hospitals & Higher Education Facilities Authority# 0.03% 07/01/2041 11,000,000 10,000,000 Phoenix Arizona Civic Improvement Corp. 5.00% 07/01/2049 11,888,900 1,110,000 Prince William County Virginia Industrial Development Authority 5.00% 01/01/2025 1,189,154 3,120,000 Prince William County Virginia Industrial Development Authority 5.00% 01/01/2031 3,285,485 6,050,000 Public Finance Authority 2.63% 11/01/2025 6,393,882 17,483,000 Puerto Rico Sales Tax Financing Corp Sales Tax Revenue+ 4.65% 07/01/2033 11,723,051 4,230,000 Sales Tax Securitization Corp. 5.50% 01/01/2032 5,302,390 6,745,000 San Diego California Tobacco Settlement Revenue Funding Corp. 4.00% 06/01/2032 7,104,239 5,300,000 San Francisco City & County Airport Comm-San Francisco International Airport 4.00% 05/01/2039 5,999,176 1,400,000 Tampa, City of Florida+ 3.48% 09/01/2040 704,830 1,850,000 Tampa, City of Florida+ 3.73% 09/01/2045 739,871 3,795,000 Tampa, City of Florida+ 3.82% 09/01/2049 1,275,537 3,850,000 Tampa, City of Florida+ 3.92% 09/01/2053 1,081,119 22,140,000 Tennessee Energy Acquisition Corp.# 4.00% 05/01/2048 23,849,208 7,150,000 Tennessee Energy Acquisition Corp.# 4.00% 11/01/2049 8,155,862 3,045,000 Terrebonne Parish Louisiana+ 3.11% 04/01/2036 2,137,560
19,490,000 Texas Municipal Gas Acquisition & Supply Corp. II (3 Month LIBOR USD +0.87%) 1.04% 09/15/2027 19,475,967
6,995,000 Texas Municipal Gas Acquisition & Supply Corp. III 5.00% 12/15/2023 7,628,957 2,055,000 Tobacco Settlement Authority 5.25% 06/01/2032 2,106,622 11,105,000 Tobacco Settlement Financing Corp. 5.00% 06/01/2031 13,736,219 20,000,000 Tobacco Settlement Financing Corp. 5.00% 06/01/2035 22,374,600 5,000,000 Tobacco Settlement Financing Corp. 5.00% 06/01/2046 5,821,250 1,045,000 Triborough Bridge & Tunnel Authority+ 3.38% 11/15/2031 818,486 9,030,000 TSASC, Inc. 5.00% 06/01/2031 10,818,121 10,000,000 Vermont Educational & Health Buildings Financing Agency 5.00% 11/01/2040 10,039,200 5,312,925 Vermont Student Assistance Corp. (3 Month LIBOR USD + 3.00%) 3.25% 12/03/2035 5,304,105 5,755,000 Virginia Public Building Authority 4.00% 08/01/2036 6,881,944 3,300,000 Virginia Small Business Financing Authority 5.00% 07/01/2034 3,417,513 4,000,000 Virginia Small Business Financing Authority 5.00% 07/01/2034 4,142,440 14,290,000 Virginia Small Business Financing Authority 5.00% 07/01/2049 14,706,411 2,000,000 Washington DC Metropolitan Area Transit Authority 4.00% 07/15/2045 2,329,760 1,000,000 Washington State Housing Finance Commission^ 4.00% 01/01/2026 1,038,430 2,655,000 Washington State Housing Finance Commission^ 5.00% 01/01/2031 2,846,957 3,655,000 Wayne County Michigan Airport Authority 5.00% 12/01/2038 4,209,756 1,610,000 Wisconsin Health & Educational Facilities Authority 5.00% 05/01/2027 1,817,110 1,730,000 Wisconsin Health & Educational Facilities Authority 5.00% 08/15/2028 1,878,157 650,000 Wisconsin Health & Educational Facilities Authority 5.00% 09/15/2037 664,534 969,469,258 Total Municipal Bonds (Cost $1,094,866,163) 1,126,224,729
Shares Short-Term Investments - 1.6% Money Market Funds - 1.6% 19,068,685 First American Government Obligations Fund — Class Z, 0.05%* 19,068,685 Total Short-Term Investments (Cost $19,068,685) 19,068,685 Total Investments - 98.8% (Cost $1,113,934,848) 1,145,293,414

Other Assets in Excess of Liabilities - 1.2% 13,535,851
NET ASSETS - 100.0% $1,158,829,265
+ Zero coupon bond. Rate disclosed is calculated yield to maturity as of the date of this report. # Variable rate security. Rate disclosed is as of the date of this report. ^ Security exempt from registration under Rule 144A of the Securities Act of 1933. These securities may be resold in transactions exempt fromregistration, normally to qualified institutional buyers.* Annualized seven-day yield as of the date of this report. Various inputs may be used to determine the value of the Fund's investments. These inputs are summarized in three broad levels. The inputs ormethodologies used to value securities are not necessarily an indication of the risk associated with investing in those securities. Level 1 - Quoted prices in active markets for identical securities. Level 2 - Evaluated price based on other significant observable inputs (including quoted prices for similar securities, interestrates, prepayment spreads, credit risk, etc.). Level 3 - Significant unobservable inputs (including the Fund's own assumptions indetermining the fair value of investments). As of the date of this report, the Fund's short-term investments were categorized as Level 1, while the Fund's investments inmunicipal bonds were categorized as Level 2.

Brown Advisory Tax-Exempt Sustainable Bond Fund Schedule of Investments September 30, 2020 (Unaudited)
Par Value Security Description Rate Maturity Value $ Municipal Bonds - 98.0% General Obligation Bonds - 21.3% 850,000 California, State of (SIFMA Municipal Swap Index + 0.38%) 0.50% 12/01/2027 850,017 1,350,000 California, State of 5.00% 10/01/2028 1,593,945 1,000,000 California, State of 4.00% 11/01/2033 1,185,360 2,710,000 Chicago Illinois Metropolitan Water Reclamation 5.00% 12/01/2030 2,843,793 2,425,000 Chicago Park District 4.00% 01/01/2034 2,672,399 1,080,000 Coachella Valley California Unified School District+ 2.63% 08/01/2034 816,469 3,450,000 Compton California Unified School District+ 2.99% 06/01/2037 2,193,855 1,000,000 Cypress-Fairbanks Texas Independent School District 5.00% 02/15/2024 1,159,340 1,000,000 Cypress-Fairbanks Texas Independent School District 5.00% 02/15/2025 1,202,790 1,125,000 Detroit City School District 5.00% 05/01/2039 1,425,004 1,500,000 Hartnell California Community College District 3.00% 08/01/2048 1,586,340 1,000,000 Illinois, State of 5.38% 05/01/2023 1,063,340 2,500,000 Illinois, State of 5.00% 11/01/2026 2,700,875 3,000,000 Kane McHenry Cook & De Kalb Counties, Illinois Unit School District No. 300 5.25% 01/01/2032 3,303,960 1,500,000 Kendall Kane & Will Counties, Illinois Community Unit School District No. 308 5.00% 02/01/2029 1,519,725 1,000,000 Lewisville Texas Independent School District 5.00% 08/15/2023 1,137,800 3,000,000 Oak Grove California School District+ 2.40% 08/01/2035 2,224,200 1,000,000 Palomar Pomerado Health, California+ 1.36% 08/01/2030 854,560 1,100,000 Placentia-Yorba Linda California Unified School District+ 2.66% 08/01/2036 794,530 3,000,000 Texas, State of 4.50% 08/01/2029 3,844,889 2,000,000 Weld County Colorado School District 5.00% 12/01/2032 2,654,700 1,500,000 Weld County Colorado School District 5.00% 12/01/2036 1,973,040 39,600,931 Revenue Bonds - 76.7% 2,225,000 Allegheny County Pennsylvania Hospital Development Authority 5.00% 07/15/2023 2,500,945 1,000,000 American Municipal Power, Inc. 4.00% 02/15/2044 1,145,640 950,000 Arlington County Virginia Industrial Development Authority 5.00% 07/01/2026 1,170,856 425,000 Arlington Texas Higher Education Finance Corp. 5.00% 08/15/2026 531,203 3,000,000 Aurora Colorado Water Revenue 5.00% 08/01/2041 3,634,799 2,300,000 Austin, Texas 7.88% 09/01/2026 2,343,907 1,000,000 Baltimore County Maryland 4.00% 01/01/2039 1,105,130 1,525,000 Baltimore County Maryland 4.00% 01/01/2040 1,681,572 1,500,000 Baltimore County Maryland 4.00% 01/01/2045 1,611,510 1,950,000 Bay Area Water Supply & Conservation Agency 5.00% 10/01/2034 2,163,701 630,000 California Infrastructure & Economic Development Bank 4.00% 08/01/2023 693,359 500,000 California Infrastructure & Economic Development Bank 4.00% 08/01/2024 566,410 1,005,000 California Infrastructure & Economic Development Bank 5.00% 08/01/2038 1,283,807 1,000,000 California Infrastructure & Economic Development Bank 5.00% 08/01/2039 1,273,560
3,045,000 California Infrastructure & Economic Development Bank (1 Month LIBOR USD+ 0.20%) 0.31% 10/01/2047 3,045,274
1,170,000 California Municipal Finance Authority^ 5.00% 11/01/2029 1,316,075 1,575,000 California Municipal Finance Authority^ 5.00% 11/01/2049 1,660,696 1,180,000 California School Finance Authority^ 5.00% 07/01/2037 1,374,086 2,000,000 California Statewide Communities Development Authority# 2.63% 11/01/2033 2,100,580 950,000 Cedar Rapids, Iowa# 0.25% 08/15/2032 907,250 1,020,000 Central Puget Sound Regional Transit Authority 5.00% 11/01/2032 1,232,945 2,250,000 Central Puget Sound Regional Transit Authority 5.00% 11/01/2045 2,691,203 900,000 Connecticut Housing Finance Authority# 0.12% 11/15/2046 900,000 1,000,000 Connecticut State Clean Water Fund 4.00% 02/01/2035 1,210,010 1,500,000 Connecticut State Clean Water Fund 5.00% 05/01/2036 1,855,215 3,000,000 Dallas-Fort Worth International Airport 5.25% 11/01/2030 3,360,419
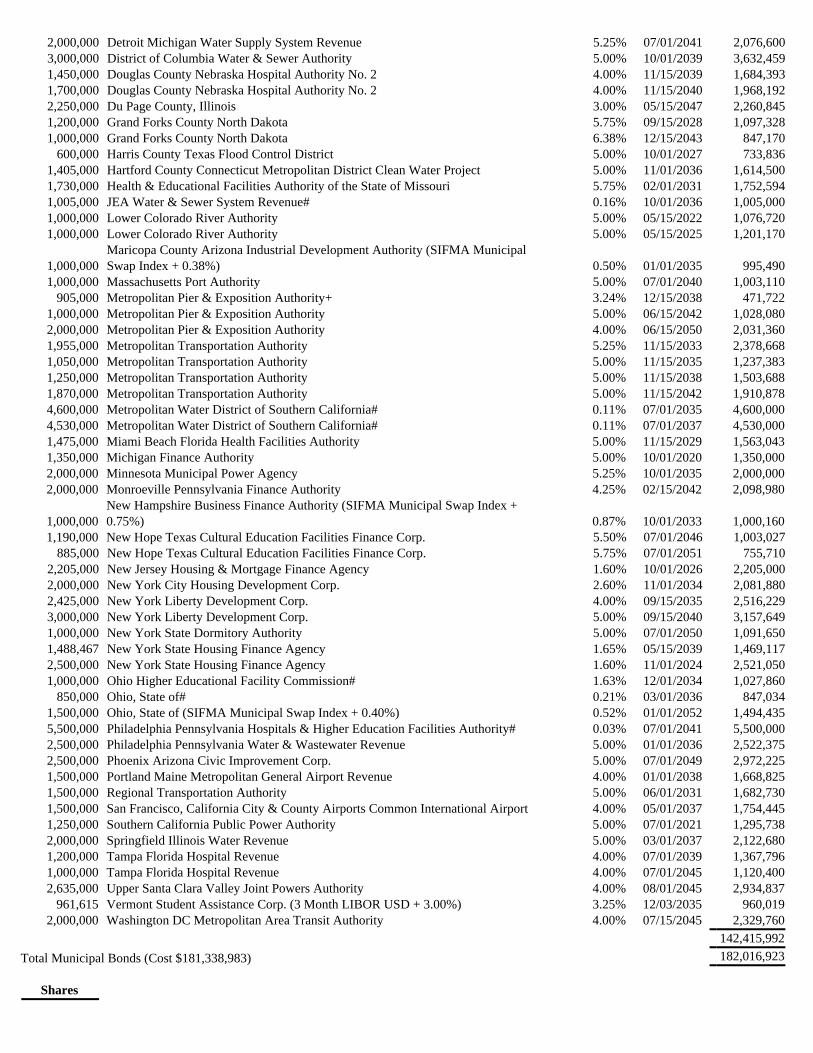
2,000,000 Detroit Michigan Water Supply System Revenue 5.25% 07/01/2041 2,076,600 3,000,000 District of Columbia Water & Sewer Authority 5.00% 10/01/2039 3,632,459 1,450,000 Douglas County Nebraska Hospital Authority No. 2 4.00% 11/15/2039 1,684,393 1,700,000 Douglas County Nebraska Hospital Authority No. 2 4.00% 11/15/2040 1,968,192 2,250,000 Du Page County, Illinois 3.00% 05/15/2047 2,260,845 1,200,000 Grand Forks County North Dakota 5.75% 09/15/2028 1,097,328 1,000,000 Grand Forks County North Dakota 6.38% 12/15/2043 847,170 600,000 Harris County Texas Flood Control District 5.00% 10/01/2027 733,836 1,405,000 Hartford County Connecticut Metropolitan District Clean Water Project 5.00% 11/01/2036 1,614,500 1,730,000 Health & Educational Facilities Authority of the State of Missouri 5.75% 02/01/2031 1,752,594 1,005,000 JEA Water & Sewer System Revenue# 0.16% 10/01/2036 1,005,000 1,000,000 Lower Colorado River Authority 5.00% 05/15/2022 1,076,720 1,000,000 Lower Colorado River Authority 5.00% 05/15/2025 1,201,170
1,000,000 Maricopa County Arizona Industrial Development Authority (SIFMA MunicipalSwap Index + 0.38%) 0.50% 01/01/2035 995,490
1,000,000 Massachusetts Port Authority 5.00% 07/01/2040 1,003,110 905,000 Metropolitan Pier & Exposition Authority+ 3.24% 12/15/2038 471,722 1,000,000 Metropolitan Pier & Exposition Authority 5.00% 06/15/2042 1,028,080 2,000,000 Metropolitan Pier & Exposition Authority 4.00% 06/15/2050 2,031,360 1,955,000 Metropolitan Transportation Authority 5.25% 11/15/2033 2,378,668 1,050,000 Metropolitan Transportation Authority 5.00% 11/15/2035 1,237,383 1,250,000 Metropolitan Transportation Authority 5.00% 11/15/2038 1,503,688 1,870,000 Metropolitan Transportation Authority 5.00% 11/15/2042 1,910,878 4,600,000 Metropolitan Water District of Southern California# 0.11% 07/01/2035 4,600,000 4,530,000 Metropolitan Water District of Southern California# 0.11% 07/01/2037 4,530,000 1,475,000 Miami Beach Florida Health Facilities Authority 5.00% 11/15/2029 1,563,043 1,350,000 Michigan Finance Authority 5.00% 10/01/2020 1,350,000 2,000,000 Minnesota Municipal Power Agency 5.25% 10/01/2035 2,000,000 2,000,000 Monroeville Pennsylvania Finance Authority 4.25% 02/15/2042 2,098,980
1,000,000 New Hampshire Business Finance Authority (SIFMA Municipal Swap Index +0.75%) 0.87% 10/01/2033 1,000,160
1,190,000 New Hope Texas Cultural Education Facilities Finance Corp. 5.50% 07/01/2046 1,003,027 885,000 New Hope Texas Cultural Education Facilities Finance Corp. 5.75% 07/01/2051 755,710 2,205,000 New Jersey Housing & Mortgage Finance Agency 1.60% 10/01/2026 2,205,000 2,000,000 New York City Housing Development Corp. 2.60% 11/01/2034 2,081,880 2,425,000 New York Liberty Development Corp. 4.00% 09/15/2035 2,516,229 3,000,000 New York Liberty Development Corp. 5.00% 09/15/2040 3,157,649 1,000,000 New York State Dormitory Authority 5.00% 07/01/2050 1,091,650 1,488,467 New York State Housing Finance Agency 1.65% 05/15/2039 1,469,117 2,500,000 New York State Housing Finance Agency 1.60% 11/01/2024 2,521,050 1,000,000 Ohio Higher Educational Facility Commission# 1.63% 12/01/2034 1,027,860 850,000 Ohio, State of# 0.21% 03/01/2036 847,034 1,500,000 Ohio, State of (SIFMA Municipal Swap Index + 0.40%) 0.52% 01/01/2052 1,494,435 5,500,000 Philadelphia Pennsylvania Hospitals & Higher Education Facilities Authority# 0.03% 07/01/2041 5,500,000 2,500,000 Philadelphia Pennsylvania Water & Wastewater Revenue 5.00% 01/01/2036 2,522,375 2,500,000 Phoenix Arizona Civic Improvement Corp. 5.00% 07/01/2049 2,972,225 1,500,000 Portland Maine Metropolitan General Airport Revenue 4.00% 01/01/2038 1,668,825 1,500,000 Regional Transportation Authority 5.00% 06/01/2031 1,682,730 1,500,000 San Francisco, California City & County Airports Common International Airport 4.00% 05/01/2037 1,754,445 1,250,000 Southern California Public Power Authority 5.00% 07/01/2021 1,295,738 2,000,000 Springfield Illinois Water Revenue 5.00% 03/01/2037 2,122,680 1,200,000 Tampa Florida Hospital Revenue 4.00% 07/01/2039 1,367,796 1,000,000 Tampa Florida Hospital Revenue 4.00% 07/01/2045 1,120,400 2,635,000 Upper Santa Clara Valley Joint Powers Authority 4.00% 08/01/2045 2,934,837 961,615 Vermont Student Assistance Corp. (3 Month LIBOR USD + 3.00%) 3.25% 12/03/2035 960,019 2,000,000 Washington DC Metropolitan Area Transit Authority 4.00% 07/15/2045 2,329,760 142,415,992 Total Municipal Bonds (Cost $181,338,983) 182,016,923
Shares

Short-Term Investments - 2.6% Money Market Funds - 2.6% 4,922,523 First American Government Obligations Fund — Class Z, 0.05%* 4,922,523 Total Short-Term Investments (Cost $4,922,523) 4,922,523 Total Investments - 100.6% (Cost $186,261,506) 186,939,446 Liabilities in Excess of Other Assets - (0.6)% (1,171,773)
NET ASSETS - 100.0% $ 185,767,673
+ Zero coupon bond. Rate disclosed is calculated yield to maturity as of the date of this report. # Variable rate security. Rate disclosed is as of the date of this report. ^ Security exempt from registration under Rule 144A of the Securities Act of 1933. These securities may be resold in transactions exempt fromregistration, normally to qualified institutional buyers.* Annualized seven-day yield as of the date of this report. Various inputs may be used to determine the value of the Fund's investments. These inputs are summarized in threebroad levels. The inputs or methodologies used to value securities are not necessarily an indication of the risk associatedwith investing in those securities. Level 1 - Quoted prices in active markets for identical securities. Level 2 - Evaluated price based on other significant observable inputs (including quoted prices for similar securities,interest rates, prepayment spreads, credit risk, etc.). Level 3 - Significant unobservable inputs (including the Fund's own assumptions in determiningthe fair value of investments). As of the date of this report, the Fund's short-term investments were categorized as Level 1, while the Fund's investments inmunicipal bonds were categorized as Level 2.

Brown Advisory Mortgage Securities Fund Schedule of Investments September 30, 2020 (Unaudited)
Par Value Security Description Rate Maturity Value $ Mortgage Backed Securities - 97.0%
2,080,000 BAMLL Commercial Mortgage Securities Trust, Series 2018-DSNY (1 MonthLIBOR USD + 0.85%)^ 1.00% 09/15/2034 2,026,377
2,000,000 BBCMS Mortgage Trust, Series 2018-TALL A (1 Month LIBOR USD +0.72%)^ 0.87% 03/15/2037 1,926,796
986,000 DBGS Mortgage Trust, Series 2018-C1 7EA^ 4.64% 10/17/2051 953,370 48,388 FHLMC PC, Pool# N3-0530 5.50% 01/01/2029 50,661 90,109 FHLMC PC, Pool# C5-3878 5.50% 12/01/2030 102,830 216,222 FHLMC PC, Pool# C9-1366 4.50% 04/01/2031 238,579 60,331 FHLMC PC, Pool# C6-6421 6.50% 02/01/2032 67,522 214,444 FHLMC PC, Pool# N7-0078 5.50% 01/01/2033 233,511 47,312 FHLMC PC, Pool# 1B-0889 (12 Month LIBOR USD + 1.59%) 2.90% 05/01/2033 47,508 89,831 FHLMC PC, Pool# A1-4256 5.50% 10/01/2033 103,841 255,118 FHLMC PC, Pool# G3-0932 4.50% 03/01/2034 281,486 924,359 FHLMC PC, Pool# C9-1826 3.00% 05/01/2035 971,068 48,325 FHLMC PC, Pool# 1J-0204 (12 Month LIBOR USD + 1.75%) 3.21% 05/01/2035 50,991 165,656 FHLMC PC, Pool# N7-0071 6.00% 06/01/2035 182,571 67,151 FHLMC PC, Pool# A4-6629 5.00% 08/01/2035 77,266 1,099,018 FHLMC PC, Pool# K9-3365 3.50% 11/01/2035 1,188,224 400,502 FHLMC PC, Pool# K9-3349 4.00% 11/01/2035 429,435 28,076 FHLMC PC, Pool# 1L-1263 (1 Year CMT Rate + 2.25%) 3.75% 03/01/2036 29,860 25,273 FHLMC PC, Pool# 1H-1348 (1 Year CMT Rate + 2.14%) 2.73% 10/01/2036 26,665 253,275 FHLMC PC, Pool# G2-0028 7.50% 12/01/2036 288,475 100,778 FHLMC PC, Pool# B3-1891 5.38% 01/01/2037 111,464 122,186 FHLMC PC, Pool# 84-7727 (12 Month LIBOR USD + 1.74%) 3.54% 02/01/2037 122,948 197,539 FHLMC PC, Pool# B3-1900 5.38% 02/01/2037 218,586 46,260 FHLMC PC, Pool# B3-1934 5.38% 04/01/2037 51,104 70,698 FHLMC PC, Pool# B3-1950 5.10% 05/01/2037 77,636 93,882 FHLMC PC, Pool# B3-1976 5.10% 05/01/2037 103,062 172,818 FHLMC PC, Pool# A6-7884 5.38% 05/01/2037 190,974 55,992 FHLMC PC, Pool# 1J-1681 (12 Month LIBOR USD + 1.98%) 2.86% 06/01/2037 59,476 167,358 FHLMC PC, Pool# B3-2000 5.10% 06/01/2037 183,668 94,721 FHLMC PC, Pool# U3-0471 5.10% 07/01/2037 103,911 54,418 FHLMC PC, Pool# U3-0653 5.13% 07/01/2037 60,127 224,530 FHLMC PC, Pool# U3-0681 5.10% 09/01/2037 246,362 72,415 FHLMC PC, Pool# U3-0606 5.10% 09/01/2037 79,502 51,519 FHLMC PC, Pool# 1G-2249 (12 Month LIBOR USD + 1.78%) 3.65% 10/01/2037 51,948 261,865 FHLMC PC, Pool# T3-0346 5.38% 10/01/2037 291,147 1,624,347 FHLMC PC, Pool# G3-1063 3.50% 11/01/2037 1,724,795 83,443 FHLMC PC, Pool# U3-0800 5.10% 11/01/2037 91,537 143,607 FHLMC PC, Pool# U3-1874 5.38% 04/01/2038 158,821 346,051 FHLMC PC, Pool# N7-0082 6.00% 07/01/2038 385,227 192,181 FHLMC PC, Pool# G0-4655 6.00% 08/01/2038 229,186 227,693 FHLMC PC, Pool# G0-4540 6.00% 08/01/2038 271,533 110,379 FHLMC PC, Pool# U3-2470 5.10% 11/01/2038 121,135 118,863 FHLMC PC, Pool# G0-8348 5.00% 06/01/2039 136,955 600,250 FHLMC PC, Pool# C0-3427 5.50% 10/01/2039 694,423 465,789 FHLMC PC, Pool# Q3-8585 4.00% 10/01/2043 501,397 5,378,228 FHLMC PC, Pool# ZA-5113 4.00% 12/01/2047 5,868,172 483,347 FHLMC PC, Pool# G0-8828 5.50% 04/01/2048 542,529 973,021 FHLMC REMIC, Series 4318 DI~ 2.50% 08/15/2022 14,313 1,134,284 FHLMC REMIC, Series 4329 CI~ 2.50% 01/15/2023 21,519 29,722 FHLMC REMIC, Series 1843 Z 7.00% 04/15/2026 32,009 143,511 FHLMC REMIC, Series 2517 Z 5.50% 10/15/2032 159,520

1,468,683 FHLMC REMIC, Series 2907 VZ 4.50% 05/15/2034 1,621,325 321,411 FHLMC REMIC, Series 2890 ZA 5.00% 11/15/2034 372,040 531,951 FHLMC REMIC, Series 3150 DZ 5.50% 05/15/2036 623,396 234,684 FHLMC REMIC, Series 3294 CB 5.50% 03/15/2037 275,589 990,671 FHLMC REMIC, Series 4309 BI~ 3.00% 08/15/2039 30,797 250,269 FHLMC REMIC, Series 4675 CA 3.50% 02/15/2042 253,630 842,688 FHLMC REMIC, Series 4784 NB 4.00% 05/15/2042 844,002 297,199 FHLMC REMIC, Series 4775 DA 4.00% 07/15/2042 299,847 253,988 FHLMC REMIC, Series 4693 NA 3.50% 08/15/2042 257,685 951,097 FHLMC REMIC, Series 4773 EA 4.00% 10/15/2042 963,510 2,717,475 FHLMC REMIC, Series 4773 KA 4.00% 10/15/2042 2,752,945 3,779,736 FHLMC REMIC, Series 4711 NA 3.50% 11/15/2042 3,816,791 4,052,631 FHLMC REMIC, Series 4665 KA 4.00% 12/15/2042 4,128,493 2,193,597 FHLMC REMIC, Series 4740 KB 3.50% 02/15/2043 2,223,613 280,708 FHLMC REMIC, Series 4703 KA 3.50% 02/15/2043 285,631 124,071 FHLMC REMIC, Series 4808 EA 4.50% 02/15/2043 124,589 1,434,433 FHLMC REMIC, Series 4663 JA 3.50% 03/15/2043 1,461,951 4,557,290 FHLMC REMIC, Series 4747 DA 3.50% 04/15/2043 4,614,390 791,254 FHLMC REMIC, Series 4870 LA 4.00% 04/15/2043 797,978 159,583 FHLMC REMIC, Series 4845 DA 4.00% 05/15/2043 160,719 212,002 FHLMC REMIC, Series 4848 EA 4.50% 08/15/2043 213,184 3,075,000 FHLMC REMIC, Series 4801 LT 4.00% 12/15/2043 3,118,976 120,160 FHLMC REMIC, Series 4830 WA 4.00% 04/15/2044 120,952 230,576 FHLMC REMIC, Series 4848 WA 4.00% 07/15/2044 232,010 1,382,832 FHLMC REMIC, Series 4840 BH 5.00% 07/15/2044 1,402,589 3,330,483 FHLMC REMIC, Series 4800 CA 4.50% 09/15/2044 3,393,796 270,064 FHLMC REMIC, Series 4830 DA 4.50% 11/15/2044 273,368 1,440,325 FHLMC REMIC, Series 4829 JA 4.50% 12/15/2044 1,457,945 194,458 FHLMC REMIC, Series 4828 NA 4.50% 12/15/2044 197,016 592,952 FHLMC REMIC, Series 4844 HJ 4.00% 02/15/2045 600,027 1,128,453 FHLMC REMIC, Series 4827 GB 4.00% 03/15/2045 1,144,196 335,297 FHLMC REMIC, Series 4842 EA 4.50% 03/15/2045 340,364 837,534 FHLMC REMIC, Series 4818 PA 4.00% 06/15/2045 860,896 950,791 FHLMC REMIC, Series 4891 PA 3.50% 07/15/2048 997,289 1,562,772 FHLMC SCRTT, Series 2016-1 M1#^ 3.00% 09/25/2055 1,562,340 1,000,000 FHLMC SCRTT, Series 2017-1 M1#^ 4.00% 01/25/2056 1,005,744 77,499 FHLMC WLST, Series 2017-SC02 2A1 3.50% 05/25/2047 77,958 2,923,501 FHMS, Series K-017 X1#~ 1.43% 12/25/2021 29,450 13,122,343 FHMS, Series K-019 X1#~ 1.73% 03/25/2022 248,371 15,970,281 FHMS, Series K-021 X1#~ 1.54% 06/25/2022 293,342 24,251,538 FHMS, Series K-025 X1#~ 0.93% 10/25/2022 326,882 12,887,804 FHMS, Series K-035 X1#~ 0.50% 08/25/2023 117,427 73,581,382 FHMS, Series K-C02 X1#~ 0.50% 03/25/2024 865,817 20,427,605 FHMS, Series K-038 X1#~ 1.28% 03/25/2024 669,858 40,145,484 FHMS, Series K-040 X1#~ 0.85% 09/25/2024 977,302 17,872,507 FHMS, Series K-C03 X1#~ 0.63% 11/25/2024 314,696 134,257,793 FHMS, Series K-047 X1#~ 0.26% 05/25/2025 848,912 13,758,725 FHMS, Series Q-013 XPT1~ 1.66% 05/25/2025 446,443 277,991 FHMS, Series K-W01 A1 3.33% 05/25/2025 294,036 36,948,000 FHMS, Series K-C06 X1#~ 1.03% 06/25/2025 1,319,661 14,630,886 FHMS, Series K-053 X1#~ 1.02% 12/25/2025 600,655 41,773,749 FHMS, Series K-734 X1#~ 0.79% 02/25/2026 1,261,878 9,385,909 FHMS, Series K-055 X1#~ 1.50% 03/25/2026 604,502 33,050,931 FHMS, Series K-735 X1#~ 1.10% 05/25/2026 1,589,472 26,041,803 FHMS, Series K-736 X1#~ 1.44% 07/25/2026 1,652,105 6,016,457 FHMS, Series K-058 X1#~ 1.05% 08/25/2026 289,497 6,462,325 FHMS, Series K-059 X1#~ 0.43% 09/25/2026 107,288 26,765,225 FHMS, Series K-737 X1#~ 0.75% 10/25/2026 905,572 24,927,754 FHMS, Series K-C04 X1#~ 1.41% 12/25/2026 1,381,394 55,110,411 FHMS, Series K-063 X1#~ 0.42% 01/25/2027 912,441

6,092,067 FHMS, Series K-738 X1#~ 1.63% 01/25/2027 505,904 22,316,588 FHMS, Series K-064 X1#~ 0.74% 03/25/2027 784,729 6,050,000 FHMS, Series K-738 XAM#~ 1.48% 03/25/2027 491,546 8,239,370 FHMS, Series Q-013 XPT2~ 1.81% 05/25/2027 374,570 5,702,852 FHMS, Series K-W03 X1#~ 0.98% 06/25/2027 239,844 23,000,732 FHMS, Series K-C05 X1#~ 1.34% 07/25/2027 1,357,788 12,546,952 FHMS, Series K-068 X1#~ 0.56% 08/25/2027 342,485 30,339,091 FHMS, Series K-069 X1#~ 0.49% 09/25/2027 725,823 52,577,255 FHMS, Series K-070 X1#~ 0.46% 11/25/2027 1,173,272 31,662,415 FHMS, Series K-072 X1#~ 0.49% 12/25/2027 768,415 5,995,831 FHMS, Series Q-006 APT1# 2.67% 04/25/2028 6,140,665 1,813,564 FHMS, Series Q-006 APT2# 2.55% 10/25/2028 1,845,540 24,917,138 FHMS, Series K-087 X1#~ 0.51% 12/25/2028 706,503 18,182,460 FHMS, Series K-091 X1#~ 0.70% 03/25/2029 792,532 12,663,078 FHMS, Series K-092 X1#~ 0.85% 04/25/2029 690,191 9,997,520 FHMS, Series K-G01 X1#~ 1.11% 04/25/2029 621,160 6,285,919 FHMS, Series K-093 X1#~ 1.09% 05/25/2029 448,245 10,989,366 FHMS, Series K-094 X1#~ 1.02% 06/25/2029 740,761 6,250,000 FHMS, Series K-G02 X1#~ 1.14% 08/25/2029 469,808 14,492,481 FHMS, Series K-103 X1#~ 0.76% 11/25/2029 755,877 7,449,843 FHMS, Series K-108 XAM#~ 1.78% 03/25/2030 1,052,909 4,800,000 FHMS, Series K-110 XAM#~ 1.87% 04/25/2030 767,360 5,030,000 FHMS, Series K-109 XAM#~ 1.92% 04/25/2030 770,894 3,410,000 FHMS, Series K-112 XAM#~ 1.77% 05/25/2030 500,661 4,803,897 FHMS, Series K-111 XAM#~ 1.91% 05/25/2030 743,287 6,238,500 FHMS, Series K-114 XAM#~ 1.44% 06/25/2030 734,192 8,345,000 FHMS, Series K-G03 X1#~ 1.48% 06/25/2030 917,807 9,000,000 FHMS, Series K-113 XAM#~ 1.69% 06/25/2030 1,251,906 9,275,345 FHMS, Series K-115 XAM#~ 1.55% 07/25/2030 1,251,755 7,250,000 FHMS, Series K-116 XAM#~ 1.60% 08/25/2030 1,034,866 1,707,796 FHMS, Series Q-004 A2H# 2.99% 01/25/2046 1,707,908 799,420 FHMS, Series Q-010 APT1# 2.94% 04/25/2046 803,583 2,330,763 FHMS, Series Q-004 A4H# 2.79% 08/25/2046 2,366,948 4,152,809 FHMS, Series Q-007 APT1# 2.98% 10/25/2047 4,288,244 3,746,625 FHMS, Series Q-007 APT2# 3.30% 10/25/2047 4,037,968 2,170,000 FHMS, Series K-112 X3#~ 3.10% 07/25/2048 503,156 1,000,000 FHMS, Series Q-013 APT1# 1.16% 05/25/2050 1,147,071 1,563,016 FHS, Series 366 IO~ 4.00% 08/15/2049 301,526 23,000 FNMA, Pool# 922791 6.50% 12/01/2021 23,180 402,050 FNMA, Pool# BL0273 4.36% 10/01/2023 432,112 1,000,000 FNMA, Pool# AN9202 3.32% 05/01/2025 1,105,946 1,204,222 FNMA, Pool# 109465 3.58% 08/01/2025 1,318,482 37,380 FNMA, Pool# 336422 (H15T3Y + 2.30%) 4.65% 10/01/2025 37,672 118,050 FNMA, Pool# 344903 5.50% 10/01/2025 130,951 1,000,000 FNMA, Pool# AN0287 2.95% 11/01/2025 1,101,805 466,011 FNMA, Pool# BL1166 3.62% 01/01/2026 522,353 446,594 FNMA, Pool# BL1165 3.62% 01/01/2026 500,588 76,457 FNMA, Pool# 356232 6.50% 01/01/2026 85,587 35,999 FNMA, Pool# 406521 (1 Year CMT Rate + 2.52%) 3.90% 05/01/2026 35,960 1,500,000 FNMA, Pool# BL0723 3.84% 09/01/2026 1,740,471 56,949 FNMA, Pool# 356329 (1 Year CMT Rate + 2.64%) 4.26% 01/01/2027 57,247 18,533 FNMA, Pool# 363850 (1 Year CMT Rate + 2.13%) 3.63% 04/01/2027 18,712 38,804 FNMA, Pool# 406380 (1 Year CMT Rate + 2.17%) 2.89% 11/01/2027 38,949 841,498 FNMA, Pool# 257203 5.00% 05/01/2028 928,003 830,875 FNMA, Pool# 958720 5.65% 10/01/2028 943,992 742,797 FNMA, Pool# 957502 3.98% 07/01/2029 821,084 43,154 FNMA, Pool# 520478 (1 Year CMT Rate + 2.10%) 3.85% 11/01/2029 43,245 38,598 FNMA, Pool# 559439 (1 Year CMT Rate + 2.27%) 4.02% 09/01/2030 38,681 51,115 FNMA, Pool# 573097 (1 Year CMT Rate + 2.21%) 3.96% 02/01/2031 51,214 148,538 FNMA, Pool# AL0898 5.00% 02/01/2031 167,030

38,776 FNMA, Pool# 590852 (1 Year CMT Rate + 2.11%) 2.49% 07/01/2031 38,981 2,200,611 FNMA, Pool# AI4717 4.50% 07/01/2031 2,431,585 41,475 FNMA, Pool# 656181 (1 Year CMT Rate + 2.16%) 3.75% 08/01/2031 41,545 37,436 FNMA, Pool# 723313 (1 Year CMT Rate + 2.54%) 2.79% 09/01/2031 37,575 10,156 FNMA, Pool# 642122 (1 Year CMT Rate + 2.27%) 3.77% 03/01/2032 10,176 9,530 FNMA, Pool# 628837 6.50% 03/01/2032 10,963 29,742 FNMA, Pool# 640225 (1 Year CMT Rate + 2.27%) 3.77% 04/01/2032 29,796 40,558 FNMA, Pool# 662138 (1 Year CMT Rate + 2.30%) 2.55% 09/01/2032 40,626 40,771 FNMA, Pool# 668309 (1 Year CMT Rate + 2.02%) 2.27% 11/01/2032 41,054 29,885 FNMA, Pool# 696546 (6 Month LIBOR USD + 2.26%) 3.01% 03/01/2033 29,840 16,773 FNMA, Pool# 555819 (6 Month LIBOR USD + 1.03%) 1.90% 07/01/2033 16,943 39,029 FNMA, Pool# 744805 (6 Month LIBOR USD + 1.52%) 2.89% 11/01/2033 39,268 21,876 FNMA, Pool# 751498 (1 Year CMT Rate + 2.22%) 3.88% 11/01/2033 21,870 27,887 FNMA, Pool# 741373 (1 Year CMT Rate + 2.28%) 4.03% 12/01/2033 27,903 30,708 FNMA, Pool# 764342 (6 Month LIBOR USD + 1.52%) 2.40% 02/01/2034 30,928 29,974 FNMA, Pool# 774969 (1 Year CMT Rate + 2.28%) 3.78% 04/01/2034 30,097 119,599 FNMA, Pool# 783554 (1 Year CMT Rate + 2.21%) 2.59% 07/01/2034 119,322 21,022 FNMA, Pool# 819649 (12 Month LIBOR USD + 1.52%) 3.52% 03/01/2035 21,316 66,722 FNMA, Pool# 889829 5.00% 07/01/2035 76,754 40,781 FNMA, Pool# 830970 (12 Month LIBOR USD + 1.83%) 2.62% 08/01/2035 41,094 55,450 FNMA, Pool# 837329 (1 Year CMT Rate + 2.04%) 2.33% 09/01/2035 56,421 940,113 FNMA, Pool# AL7654 3.00% 09/01/2035 989,613 55,209 FNMA, Pool# 836715 (12 Month LIBOR USD + 1.77%) 3.77% 10/01/2035 55,245 133,312 FNMA, Pool# 842006 4.25% 10/01/2035 143,428 32,482 FNMA, Pool# 922680 (12 Month LIBOR USD + 1.91%) 3.02% 11/01/2035 34,327 265,791 FNMA, Pool# 850232 4.25% 12/01/2035 289,225 13,508 FNMA, Pool# 865849 (12 Month LIBOR USD + 1.54%) 3.54% 03/01/2036 13,580 30,940 FNMA, Pool# 877009 (12 Month LIBOR USD + 2.38%) 3.77% 03/01/2036 33,035 323,443 FNMA, Pool# AB0577 4.00% 03/01/2036 354,327 42,913 FNMA, Pool# 868568 (12 Month LIBOR USD + 1.75%) 3.63% 04/01/2036 45,365 21,211 FNMA, Pool# 745626 (1 Year CMT Rate + 2.14%) 2.78% 05/01/2036 21,356 65,055 FNMA, Pool# 882017 (6 Month LIBOR USD + 1.56%) 2.84% 05/01/2036 65,613 11,665 FNMA, Pool# 872895 (12 Month LIBOR USD + 1.70%) 2.70% 06/01/2036 11,748 22,144 FNMA, Pool# 886163 (12 Month LIBOR USD + 1.84%) 2.59% 07/01/2036 22,531 301,891 FNMA, Pool# 896838 5.45% 07/01/2036 323,961 133,296 FNMA, Pool# 745818 6.50% 09/01/2036 155,641 5,798,920 FNMA, Pool# MA2804 3.00% 11/01/2036 6,073,829 4,601 FNMA, Pool# 905193 (12 Month LIBOR USD + 1.99%) 4.11% 11/01/2036 4,610 80,298 FNMA, Pool# 902770 5.38% 11/01/2036 88,766 109,841 FNMA, Pool# 940309 (12 Month LIBOR USD + 1.50%) 3.37% 01/01/2037 110,147 41,073 FNMA, Pool# 888445 (12 Month LIBOR USD + 1.54%) 3.54% 04/01/2037 41,359 57,108 FNMA, Pool# 995521 (12 Month LIBOR USD + 1.84%) 3.43% 05/01/2037 57,670 75,542 FNMA, Pool# 950382 (6 Month LIBOR USD + 1.12%) 1.57% 08/01/2037 77,761 145,628 FNMA, Pool# 941050 (12 Month LIBOR USD + 1.70%) 2.45% 08/01/2037 145,093 57,203 FNMA, Pool# 952835 (1 Year CMT Rate + 2.32%) 2.86% 09/01/2037 60,782 3,670,465 FNMA, Pool# MA3208 4.50% 10/01/2037 4,018,901 132,894 FNMA, Pool# 955233 6.50% 12/01/2037 159,810 30,232 FNMA, Pool# 962656 (12 Month LIBOR USD + 1.18%) 3.07% 04/01/2038 30,594 6,487 FNMA, Pool# 982237 (12 Month LIBOR USD + 1.84%) 2.72% 05/01/2038 6,520 352,471 FNMA, Pool# AD0100 7.00% 12/01/2038 425,418 96,147 FNMA, Pool# 930507 6.50% 02/01/2039 111,232 2,604,652 FNMA, Pool# AS2249 4.00% 04/01/2039 2,873,154 383,990 FNMA, Pool# AL0407 6.50% 04/01/2039 448,262 313,549 FNMA, Pool# AD0427 5.50% 10/01/2039 365,941 407,464 FNMA, Pool# AD0941 5.50% 04/01/2040 480,842 613,374 FNMA, Pool# 467095 5.90% 01/01/2041 711,439 309,647 FNMA, Pool# AH8447 5.50% 04/01/2041 344,594 956,271 FNMA, Pool# 469130 4.87% 10/01/2041 1,115,609 398,213 FNMA, Pool# BC1738 4.50% 09/01/2043 435,347 511,398 FNMA, Pool# AS1429 4.00% 12/01/2043 553,471

577,734 FNMA, Pool# AV7739 4.00% 01/01/2044 642,901 400,624 FNMA, Pool# AW6485 4.00% 06/01/2044 432,720 586,005 FNMA, Pool# AY0382 4.00% 11/01/2044 633,218 514,937 FNMA, Pool# AW9534 4.00% 03/01/2045 569,436 622,475 FNMA, Pool# AZ4154 4.00% 06/01/2045 686,177 1,689,494 FNMA, Pool# AZ7828 4.00% 08/01/2045 1,827,942 959,834 FNMA, Pool# BA3674 4.50% 10/01/2045 1,056,644 439,594 FNMA, Pool# BC6366 4.50% 02/01/2046 490,088 203,637 FNMA, Pool# BD1241 4.50% 05/01/2046 220,361 1,169,474 FNMA, Pool# BD5189 4.50% 07/01/2046 1,297,719 594,866 FNMA, Pool# BD8599 4.50% 11/01/2046 668,528 871,343 FNMA, Pool# BH7686 4.50% 12/01/2047 952,886 1,277,528 FNMA, Pool# BJ8287 4.50% 01/01/2048 1,399,226 965,202 FNMA, Pool# AN8989 4.07% 04/01/2048 1,188,252 851,646 FNMA, Pool# BK5105 5.50% 05/01/2048 972,021 617,593 FNMA, Pool# BK8032 5.50% 06/01/2048 704,963 494,411 FNMA, Pool# BN0202 5.50% 09/01/2048 564,360 368,367 FNMA, Pool# BN4936 5.50% 12/01/2048 411,304 291,879 FNMA, Pool# BN4921 5.50% 01/01/2049 327,597 7,500,000 FNMA, 2.0%, Due TBA November 2.00% 11/15/2035 7,795,002 7,500,000 FNMA, 2.0%, Due TBA November 2.00% 11/15/2050 7,741,865 7,500,000 FNMA, 2.5%, Due TBA November 2.50% 11/15/2050 7,857,002 64 FNMA REMIC Trust, Series 1990-116 H 9.00% 10/25/2020 64 20,216 FNMA REMIC Trust, Series 1991-136 J 7.50% 10/25/2021 20,525 490,390 FNMA REMIC Trust, Series 2017-M5 FA1 (1 Month LIBOR USD + 0.67%) 0.85% 04/25/2024 493,873 84,436 FNMA REMIC Trust, Series 1996-23 G 6.50% 07/25/2026 90,523 2,000,000 FNMA REMIC Trust, Series 2017-M4 A2# 2.67% 12/25/2026 2,185,521 2,000,787 FNMA REMIC Trust, Series 2017-T1 A 2.90% 06/25/2027 2,221,582 1,589,614 FNMA REMIC Trust, Series 2012-139 HI~ 2.50% 12/25/2027 88,117 116,487 FNMA REMIC Trust, Series 2013-15 QI~ 3.00% 03/25/2028 7,867 2,294,258 FNMA REMIC Trust, Series 2018-M8 A1# 3.44% 06/25/2028 2,575,505 153,165 FNMA REMIC Trust, Series 2016-M10 A1 2.10% 07/25/2028 154,840 1,699,789 FNMA REMIC Trust, Series 2018-M14 A1# 3.70% 08/25/2028 1,920,343 2,848,265 FNMA REMIC Trust, Series 2019-M14 A1 2.30% 06/25/2029 3,029,418 978,513 FNMA REMIC Trust, Series 2018-78 VB 4.00% 12/25/2029 994,604 500,000 FNMA REMIC Trust, Series 2018-M13 A2# 3.82% 09/25/2030 612,999 1,302,794 FNMA REMIC Trust, Series 2013-115 AI~ 3.00% 04/25/2031 69,123 3,324,930 FNMA REMIC Trust, Series 2014-14 LI~ 3.00% 04/25/2031 68,947 25,994,738 FNMA REMIC Trust, Series 2019-M23 X3#~ 0.38% 10/27/2031 740,484 199,549 FNMA REMIC Trust, Series 2001-80 Z 6.00% 01/25/2032 222,855 365,341 FNMA REMIC Trust, Series 2006-M2 A2A# 5.27% 10/25/2032 412,843 483,107 FNMA REMIC Trust, Series 2003-71 MB 5.50% 08/25/2033 570,431 2,763,413 FNMA REMIC Trust, Series 2014-8 IQ~ 4.00% 03/25/2034 377,691 2,781,762 FNMA REMIC Trust, Series 2005-73 EZ 5.50% 08/25/2035 3,251,320 1,086,378 FNMA REMIC Trust, Series 2005-110 GL 5.50% 12/25/2035 1,273,950 504,893 FNMA REMIC Trust, Series 2006-21 Z 5.50% 04/25/2036 583,471 25,908 FNMA REMIC Trust, Series 2012-30 DA 3.00% 08/25/2036 26,161 1,548,194 FNMA REMIC Trust, Series 2006-112 QC 5.50% 11/25/2036 1,827,381 635,728 FNMA REMIC Trust, Series 2007-22 A 5.50% 03/25/2037 766,253 2,195,654 FNMA REMIC Trust, Series 2012-65 HJ 5.00% 07/25/2040 2,494,393 886,485 FNMA REMIC Trust, Series 2015-15 GA 3.00% 03/25/2041 912,021 152,176 FNMA REMIC Trust, Series 2012-10 UF (1 Month LIBOR USD + 0.55%) 0.70% 02/25/2042 153,773 1,737,823 FNMA REMIC Trust, Series 2012-27 PI~ 4.50% 02/25/2042 206,463 945,296 FNMA REMIC Trust, Series 2013-34 IG~ 3.00% 05/25/2042 81,891 1,689,036 FNMA REMIC Trust, Series 2013-M6 1AC# 3.55% 02/25/2043 1,916,419 683,148 FNMA REMIC Trust, Series 2018-21 JB 4.00% 03/25/2043 688,686 9,433 FNMA REMIC Trust, Series 2003-W10 3A5 4.30% 06/25/2043 10,451 2,702 FNMA REMIC Trust, Series 2003-W12 1A9 4.48% 06/25/2043 3,043 16,214 FNMA REMIC Trust, Series 2003-W12 1A8 4.55% 06/25/2043 18,160 9,236 FNMA REMIC Trust, Series 2003-W12 2A7 4.68% 06/25/2043 10,231

10,776 FNMA REMIC Trust, Series 2003-W12 2A6 5.00% 06/25/2043 12,124 689,657 FNMA REMIC Trust, Series 2015-40 LI~ 4.50% 03/25/2045 120,188 2,476,172 FNMA REMIC Trust, Series 2019-37 IM~ 5.00% 07/25/2049 337,199 2,729,000 FNMA REMIC Trust, Series 2019-70 CB 3.50% 12/25/2049 2,967,178 9,349,073 FREMF Mortgage Trust, Series 2012-K17 X2A^~ 0.10% 12/25/2044 6,976 21,059,960 FREMF Mortgage Trust, Series 2012-K20 X2A^~ 0.20% 05/25/2045 54,577 700,000 FREMF Mortgage Trust, Series 2017-K68 B#^ 3.98% 10/25/2049 786,064 1,300,000 FREMF Mortgage Trust, Series 2017-K64 B#^ 4.12% 05/25/2050 1,464,852 750,000 FREMF Mortgage Trust, Series 2019-K736 B#^ 3.88% 09/25/2052 829,989 10,314 GNMA, Pool# 004295M 6.00% 10/20/2023 10,439 139,405 GNMA, Pool# 783374X 5.50% 04/15/2024 147,035 223,359 GNMA, Pool# 728160X 5.25% 11/15/2024 237,957 2,699,311 GNMA, Pool# 752842X 3.95% 07/15/2025 2,745,505 296,465 GNMA, Pool# 623145X 5.50% 10/15/2028 330,608 1,240,945 GNMA, Pool# 589694X 4.50% 08/15/2029 1,377,111 39,463 GNMA, Pool# 728157X 3.75% 11/15/2029 42,079 361,391 GNMA, Pool# 770225C 4.25% 08/20/2031 392,888 453,520 GNMA, Pool# 003160M 6.00% 11/20/2031 520,890 637,874 GNMA, Pool# 003489M 6.00% 12/20/2033 737,940 339,864 GNMA, Pool# 782173M 5.50% 05/20/2035 403,267 147,788 GNMA, Pool# 784315X 6.00% 06/15/2036 164,349 367,980 GNMA, Pool# 770226C 4.75% 09/20/2036 403,772 212,400 GNMA, Pool# 004194M 5.50% 07/20/2038 252,083 94,383 GNMA, Pool# 706295C 5.10% 12/20/2038 103,160 1,025,701 GNMA, Pool# AC0521C 5.50% 05/20/2042 1,176,042 1,406,845 GNMA, Pool# BM9287C 4.00% 08/20/2049 1,547,122 7,500,000 GNMA, 2.0%, Due TBA November 2.00% 11/15/2050 7,777,148 510,523 GNMA REMIC Trust, Series 2013-168 IA~ 2.50% 11/16/2028 28,773 731,417 GNMA REMIC Trust, Series 2004-93 PD 5.00% 11/16/2034 813,198 115,001 GNMA REMIC Trust, Series 2006-40 B 6.00% 08/20/2036 133,394 614,274 GNMA REMIC Trust, Series 2012-52 WA# 6.19% 04/20/2038 723,910 1,041,882 GNMA REMIC Trust, Series 2016-012 KI~ 5.00% 09/20/2038 195,778 686,242 GNMA REMIC Trust, Series 2017-083 ID~ 7.00% 01/20/2039 144,308 879,967 GNMA REMIC Trust, Series 2011-2 DP# 5.46% 03/20/2039 994,569 1,265,717 GNMA REMIC Trust, Series 2010-105 IB~ 4.50% 01/16/2040 136,757 791,860 GNMA REMIC Trust, Series 2016-68 IC#~ 6.00% 01/20/2040 151,737 682,000 GNMA REMIC Trust, Series 2011-156 PM 2.00% 04/20/2040 688,493 1,490,856 GNMA REMIC Trust, Series 2017-083 IK~ 6.00% 05/20/2040 367,379 422,058 GNMA REMIC Trust, Series 2016-112 AW# 7.10% 12/20/2040 507,314 1,959,426 GNMA REMIC Trust, Series 2012-143 IC~ 5.00% 10/16/2041 344,313 831,612 GNMA REMIC Trust, Series 2012-97 GB 2.00% 08/16/2042 853,218 1,393,547 GNMA REMIC Trust, Series 2017-103 IM~ 5.00% 06/20/2043 245,684 1,145,371 GNMA REMIC Trust, Series 2013-86 IA~ 5.00% 06/20/2043 175,321 725,000 GNMA REMIC Trust, Series 2012-44 B 2.95% 08/16/2043 742,953 761,468 GNMA REMIC Trust, Series 2014-06 IG~ 4.50% 01/16/2044 99,468 994,890 GNMA REMIC Trust, Series 2018-127 PB 3.00% 09/20/2047 1,054,101 262,009 GNMA REMIC Trust, Series 2018-166 AB 4.00% 10/20/2047 276,234 1,593,593 GNMA REMIC Trust, Series 2018-166 BA 3.50% 11/20/2047 1,656,469 3,846,217 GNMA REMIC Trust, Series 2017-167 SE (1 Month LIBOR USD + 6.20%)~ 6.04% 11/20/2047 791,501 925,498 GNMA REMIC Trust, Series 2018-153 QA 3.50% 11/20/2048 1,007,306 3,072,982 GNMA REMIC Trust, Series 2014-135 I0#~ 0.71% 01/16/2056 103,341 2,955,710 GNMA REMIC Trust, Series 2015-172 I0#~ 0.78% 03/16/2057 125,978 4,808,730 GNMA REMIC Trust, Series 2016-40 I0#~ 0.69% 07/16/2057 202,063 3,843,049 GNMA REMIC Trust, Series 2016-56 I0#~ 0.87% 11/16/2057 207,703 5,159,527 GNMA REMIC Trust, Series 2016-98 I0#~ 0.90% 05/16/2058 301,559
745,000 GS Mortgage Securities Corp. Trust, Series 2017-500K (1 Month LIBOR USD +0.70%)^ 0.85% 07/15/2032 743,923
765,000 JPMCC, Series 2019-M A (1 Month LIBOR USD + 0.96%)^ 1.11% 07/15/2036 746,929
813,650 KKR Industrial Portfolio Trust, Series 2020-AIP D (1 Month LIBOR USD +2.03%)^ 2.18% 03/16/2037 813,637

2,000,000 MSC, Series 2017-CLS A (1 Month LIBOR USD + 0.70%)^ 0.85% 11/15/2034 1,996,171 634,209 SBA, Pool# 522053 (PRIME + 0.58%) 3.83% 05/25/2026 653,427 1,122,000 Velocity Commercial Capital Loan Trust, Series 2017-1 M1#^ 3.55% 05/25/2047 1,126,560 Total Mortgage Backed Securities (Cost $263,097,500) 273,566,205 Asset Backed Securities - 4.0% 1,982,125 American Homes 4 Rent Trust, Series 2014-SFR2 A^ 3.79% 10/17/2036 2,145,774 2,130,000 American Homes 4 Rent Trust, Series 2014-SFR2 B^ 4.29% 10/17/2036 2,306,969 1,231,622 American Homes 4 Rent Trust, Series 2014-SFR3 A^ 3.68% 12/18/2036 1,331,498 328,879 American Homes 4 Rent Trust, Series 2015-SFR1 A^ 3.47% 04/18/2052 352,261 225,057 American Homes 4 Rent Trust, Series 2015-SFR2 A^ 3.73% 10/18/2052 245,706 250,000 American Homes 4 Rent Trust, Series 2015-SFR2 C^ 4.69% 10/18/2052 276,672 1,112,573 FHF Trust, Series 2020-1A A^ 2.59% 12/15/2023 1,121,221 600,000 Invitation Homes Trust, Series 2017-SFR2 C (1 Month LIBOR USD + 1.45%)^ 1.60% 12/19/2036 603,174 1,500,000 Oportun Funding IX LLC, Series 2018-B A^ 3.91% 07/08/2024 1,526,474 875,000 Theorem Funding Trust, Series 2020-1^ 2.48% 10/15/2026 879,537 525,012 Westgate Resorts LLC, Series 2018-1A C^ 4.10% 12/20/2031 517,809 Total Asset Backed Securities (Cost $10,756,228) 11,307,095 Corporate Bonds & Notes - 1.6% 1,250,000 Darden Restaurants, Inc. 3.85% 05/01/2027 1,324,720
800,000 Enterprise Products Operating LLC (Fixed until 08/16/2022, then 3 MonthLIBOR USD + 2.99%) 4.88% 08/16/2077 698,888
460,000 Land O'Lakes, Inc.^ 7.25% 07/14/2027 428,626 500,000 Marriott International, Inc. 5.75% 05/01/2025 558,791 1,000,000 Marriott International, Inc. 4.65% 12/01/2028 1,067,860
521,000 Southern California Edison Co. (Fixed until 02/01/2022, then 3 Month LIBORUSD + 4.20%) 6.25% 08/01/2049 513,012
Total Corporate Bonds & Notes (Cost $4,681,381) 4,591,897 U.S. Treasury Notes - 5.3% 15,000,000 United States Treasury Note 0.38% 03/31/2022 15,056,543 Total U.S. Treasury Notes (Cost $15,044,104) 15,056,543
Shares Preferred Stocks - 0.6%
32,768 AGNC Investment Corp., Series C, 7.00% (Fixed until 10/15/2022, then 3 MonthLIBOR USD + 5.11%) 780,861
35,000 Annaly Capital Management, Inc., Series G, 6.50% (Fixed until 03/31/2023, then3 Month LIBOR USD + 4.17%) 732,200
Total Preferred Stocks (Cost $1,664,864) 1,513,061 Short-Term Investments - 3.2% Money Market Funds - 3.2% 9,125,815 First American Government Obligations Fund - Class Z, 0.05%* 9,125,815 Total Short-Term Investments (Cost $9,125,815) 9,125,815 Total Investments - 111.7% (Cost $304,369,892) 315,160,616 Liabilities in Excess of Other Assets - (11.7)% (33,068,681)
NET ASSETS - 100.0% $ 282,091,935
# Variable rate security. Rate disclosed is as of the date of this report. ^Security exempt from registration under Rule 144A of the Securities Act of 1933. These securities may be resold in transactions exempt fromregistration, normally to qualified institutional buyers.~ Interest Only Security *Annualized seven-day yield as of the date of this report. Various inputs may be used to determine the value of the Fund's investments. These inputs are summarized inthree broad levels. The inputs or

methodologies used to value securities are not necessarily an indication of the risk associatedwith investing in those securities.
Level 1 - Quoted prices in active markets for identical securities.Level 2 - Evaluated price based on other significant observable inputs (including quoted prices for similarsecurities, interest rates, prepayment spreads, credit risk, etc.).Level 3 - Significant unobservable inputs (including the Fund's own assumptions indetermining the fair value of investments).
As of the date of this report, the Fund's investments in preferred stocks and money market funds, with a total market value of $10,638,876, werecategorized as Level 1, while the Fund'sinvestments in mortgage backed securities, asset backed securities, Corporate Bonds & Notes, and U.S. Treasury Notes, with a total market value of$304,521,740, were categorized as Level 2. TheFund's investments in futures contracts, with total unrealized depreciation of $66,783, werevalued using Level 1 inputs.
Futures Contracts - ShortThe Brown Advisory Mortgage Securities Fund had the following open short futures contracts as of the date of this report:
Issue ContractsExpiration
DateNotionalAmount
NotionalValue
UnrealizedAppreciation
(Depreciation) U.S. Treasury 5-Year Note Futures (150) 12/31/2020 $ (18,884,066) $ (18,904,688) $ (20,622)U.S. Treasury 10-Year Ultra Note Futures (60) 12/21/2020 (9,549,152) (9,595,313) (46,161)
$ (28,433,218) $ (28,500,001) $ (66,783)
There is no variation margin due to or from the Fund as of the date of this report.

Brown Advisory - WMC Strategic European Equity Fund Schedule of Investments September 30, 2020 (Unaudited)
Shares Security Description Value $ Common Stocks - 95.0% Austria - 0.3% 65,488 Porr AG* 895,002 Belgium - 4.1% 114,823 UCB S.A. 13,040,948 Denmark - 0.8% 7,574 ALK-Abello A/S* 2,490,322 France - 11.4% 49,951 Amundi S.A.* 3,520,799 153,196 Bureau Veritas S.A.* 3,453,261 334,632 Elior Group S.A. 1,548,412 511,947 Elis S.A.* 6,462,793 96,444 Legrand S.A. 7,681,743 38,818 Pernod Ricard S.A. 6,189,020 72,565 Safran S.A.* 7,139,503 35,995,531 Germany - 14.6% 30,600 Beiersdorf AG 3,474,265 122,330 Brenntag AG 7,778,014 219,406 Fresenius SE & Co. KGaA 9,977,397 12,201 Hannover Rueck SE 1,888,858 47,380 Jenoptik AG 1,270,401 60,391 Merck KGaA 8,804,597 125,867 Siemens Healthineers AG 5,650,008 165,517 United Internet AG 6,329,872 28,406 Washtec AG* 1,231,824 46,405,236 Netherlands - 8.2% 11,133 ASM International NV 1,595,846 1,937 ASML Holding NV 715,480 129,194 Heineken NV 11,501,794 145,826 QIAGEN NV* 7,574,178 53,982 Wolters Kluwer NV 4,604,824 25,992,122 Portugal - 2.1% 412,366 Jeronimo Martins SGPS S.A. 6,631,037 Spain - 2.4% 286,220 Almirall S.A. 3,206,089 71,119 Laboratorios Farmaceuticos Rovi S.A.* 2,620,975 26,996 Viscofan S.A. 1,797,967 7,625,031 Sweden - 14.3% 398,551 Alfa Laval AB* 8,797,819 345,635 Assa Abloy AB 8,080,987 318,381 Cloetta AB* 921,756 508,888 Epiroc AB 7,371,878 361,508 Hexpol AB* 3,233,732 113,888 Swedish Match AB 9,312,250 422,111 Trelleborg AB* 7,454,087 45,172,509 Switzerland - 12.9% 1,421 Geberit AG 840,698

218,737 Julius Baer Group, Ltd. 9,290,284 5,023 Kuehne & Nagel International AG 975,333
185,677 Novartis AG 16,121,280 1,220,330 UBS Group AG 13,634,631
40,862,226 United Kingdom - 23.9%
1,047,176 Beazley PLC 4,145,808 215,605 Bunzl PLC 6,961,145 282,780 Compass Group PLC 4,247,876
1,335,576 ConvaTec Group PLC 3,076,785 100,837 Diageo PLC 3,463,637 946,602 Electrocomponents PLC 8,676,783 597,584 GlaxoSmithKline PLC 11,203,260 26,842 Hikma Pharmaceuticals PLC 899,676
177,268 IMI PLC 2,391,300 237,264 Lancashire Holdings Ltd. 2,120,817 484,031 Prudential PLC 6,945,063 790,449 Rotork PLC 2,865,885 439,558 Smith & Nephew PLC 8,610,692 301,472 Smiths Group PLC 5,332,954 80,272 Softcat PLC 1,248,188
109,455 Spectris PLC 3,436,350 75,626,219
Total Common Stocks (Cost $261,842,901) 300,736,183
Preferred Stocks - 1.0%Germany - 1.0%
64,782 Fuchs Petrolub SE 3,293,909 Total Preferred Stocks (Cost $2,605,553) 3,293,909
Short-Term Investments - 2.9%Money Market Funds - 2.9%
9,004,036 First American Government Obligations Fund - Class Z, 0.05%# 9,004,036 Total Short-Term Investments (Cost $9,004,036) 9,004,036 Total Investments - 98.9% (Cost $273,452,490) 313,034,128 Other Assets in Excess of Liabilities - 1.1% 3,425,130
NET ASSETS - 100.0% $ 316,459,258
* Non-IncomeProducing# Annualized seven-day yield as of the date of this report.
Various inputs may be used to determine the value of the Fund's investments. These inputs are summarized in three broadlevels. The inputsor methodologies used to value securities are not necessarily an indication of the risk associated with investing in thosesecurities.Level 1 - Quoted prices in active markets for identical securities.Level 2 - Evaluated price based on other significant observable inputs (including quoted prices for similar securities,interest rates, prepaymentspreads, credit risk,etc.).Level 3 - Significant unobservable inputs (including the Fund's own assumptions in determining the fairvalue of investments).
As of the date of this report, the Fund's investments were categorized asfollows:
Level 1 Level 2 Level 3 Common Stocks $ 7,574,178 $ 293,162,005 $ -

Preferred Stocks - 3,293,909 - Short-TermInvestments 9,004,036 - - Total Investments $ 16,578,214 $ 296,455,914 $ -

Brown Advisory Emerging Markets Select Fund Schedule of Investments September 30, 2020 (Unaudited)
Shares Security Description Value $ Common Stocks - 95.0% Brazil - 0.3% 370,200 Ambev S.A. 829,273 China - 41.9% 625,915 AIA Group, Ltd. 6,221,656 19,500 Alibaba Group Holding, Ltd.* 715,867 68,301 Alibaba Group Holding, Ltd. ADR* 20,079,128 20,123 Baidu, Inc. ADR* 2,547,370 4,685 BeiGene, Ltd. ADR* 1,341,971 3,187,000 China Construction Bank Corp. 2,070,825 687,922 China Mengniu Dairy Co., Ltd.* 3,244,753 569,454 China Merchants Bank Co., Ltd. 2,702,296 450,500 China Mobile, Ltd. 2,891,888 475,611 China Resources Beer Holdings Co., Ltd. 2,921,149 308,817 China Resources Gas Group Ltd. 1,386,568 3,254,000 China Resources Power Holdings Co., Ltd. 3,609,041 91,192 China Tourism Group Duty Free Corp., Ltd. 2,995,780 4,253,811 Dongfeng Motor Group Co., Ltd. 2,660,787 142,871 ENN Energy Holdings, Ltd. 1,567,759 4,000 Everest Medicines Ltd.* 28,673 383,000 Galaxy Entertainment Group Ltd. 2,589,348 76,316 Hong Kong Exchanges & Clearing Ltd. 3,592,460 6,600 Huazhu Group Ltd.* 292,953 40,961 Huazhu Group Ltd. ADR 1,771,154 2,088,000 Industrial & Commercial Bank of China, Ltd. 1,087,630 8,203 Kweichow Moutai Co., Ltd. 2,017,497 3,774,000 Lenovo Group, Ltd. 2,495,229 430,980 Longfor Group Holdings, Ltd. 2,442,011 245,000 Midea Group Co., Ltd. 2,625,868 22,072 New Oriental Education & Technology Group, Inc. ADR* 3,299,764 984,000 Ping An Bank Co., Ltd. 2,201,675 355,900 Ping An Insurance Group Co. of China, Ltd. 3,694,544 409,000 Sany Heavy Industry Co., Ltd. 1,502,458 745,666 Shimao Group Holdings Ltd. 3,110,879 50,366 TAL Education Group ADR* 3,829,831 147,516 Techtronic Industries Co., Ltd. 1,961,329 191,558 Tencent Holdings, Ltd. 12,938,477 188,893 Tencent Music Entertainment Group ADR* 2,789,950 234,362 Trip.com Group, Ltd. ADR* 7,298,033 111,684 WuXi AppTec Co., Ltd. 1,615,036 1,080,500 Yue Yuen Industrial Holdings Ltd. 1,751,154 53,602 Yum China Holdings, Inc. 2,838,226 13,457 Zai Lab Ltd. ADR* 1,119,219 125,850,236 Czech Republic - 0.8% 128,318 CEZ AS 2,426,319 Hungary - 0.6% 55,507 OTP Bank* 1,670,691 India - 9.6% 86,777 Apollo Hospitals Enterprise, Ltd. 2,528,905 229,239 Aurobindo Pharma, Ltd. 2,482,385 39,805 Bajaj Auto, Ltd. 1,556,055 94,414 Escorts, Ltd. 1,694,354

83,271 Godrej Properties, Ltd.* 975,156 3,552 Housing Development Finance Corp., Ltd. 83,771 350,131 ICICI Bank, Ltd.* 1,692,970 333,706 Mahindra & Mahindra Ltd. 2,758,983 2,567,802 NTPC, Ltd. 2,970,958 172,411 Oberoi Realty, Ltd.* 923,539 79,980 PVR, Ltd. 1,313,149 156,678 Reliance Industries Ltd. 4,751,717 956,482 State Bank of India* 2,414,206 637,868 Wipro, Ltd. 2,714,495 28,860,643 Indonesia - 1.2% 954,385 Bank Central Asia Tbk PT 1,742,140 5,435,600 Bank Mandiri Persero Tbk PT 1,817,805 3,559,945 Philippines - 0.7% 750,982 Universal Robina Corp. 2,082,796 Russia - 2.8% 77,642 LUKOIL PJSC ADR 4,486,227 793,836 Rosneft Oil Co. PJSC GDR 3,899,490 8,385,717 Singapore - 1.2% 1,076,008 Wilmar International, Ltd. 3,493,633 South Africa - 0.5% 203,017 Sasol, Ltd. 1,560,970 South Korea - 13.0% 551 Big Hit Entertainment Co., Ltd.* 63,604 115,260 DB Insurance Co., Ltd. 4,454,420 25,970 Hana Financial Group, Inc. 623,879 82,797 Hankook Tire & Technology Co., Ltd. 2,231,115 9,069 Hugel, Inc.* 1,413,363 39,350 KB Financial Group, Inc. 1,267,070 37,575 Korea Shipbuilding & Offshore Engineering Co., Ltd.* 2,650,032 1,584 LG Household & Health Care, Ltd. 1,954,744 34,381 POSCO 5,755,853 284,320 Samsung Electronics Co., Ltd. 14,114,828 93,720 Shinhan Financial Group Co., Ltd. 2,198,725 34,697 SK Hynix, Inc. 2,487,177 39,214,810 Taiwan - 13.9% 171,482 Advantech Co., Ltd. 1,735,279 445,000 Catcher Technology Co., Ltd. 2,811,730 270,220 Chroma ATE, Inc. 1,440,383 1,969,000 Compal Electronics, Inc. 1,302,202 341,023 Delta Electronics, Inc. 2,239,308 151,262 Globalwafers Co., Ltd. 2,023,931 1,699,000 Hon Hai Precision Industry Co., Ltd. 4,567,781 167,288 MediaTek, Inc. 3,544,661 1,280,325 Taiwan Semiconductor Manufacturing Co., Ltd. 19,261,310 1,270,181 Uni-President Enterprises Corp. 2,750,908 41,677,493 Thailand - 1.4% 713,800 Bangkok Bank PCL NVDR 2,174,099 1,062,300 Siam Commercial Bank PCL NVDR 2,187,575 4,361,674 Turkey - 1.3% 2,279,143 Akbank T.A.S.* 1,501,322 221,288 Ford Otomotiv Sanayi A.S. 2,507,195
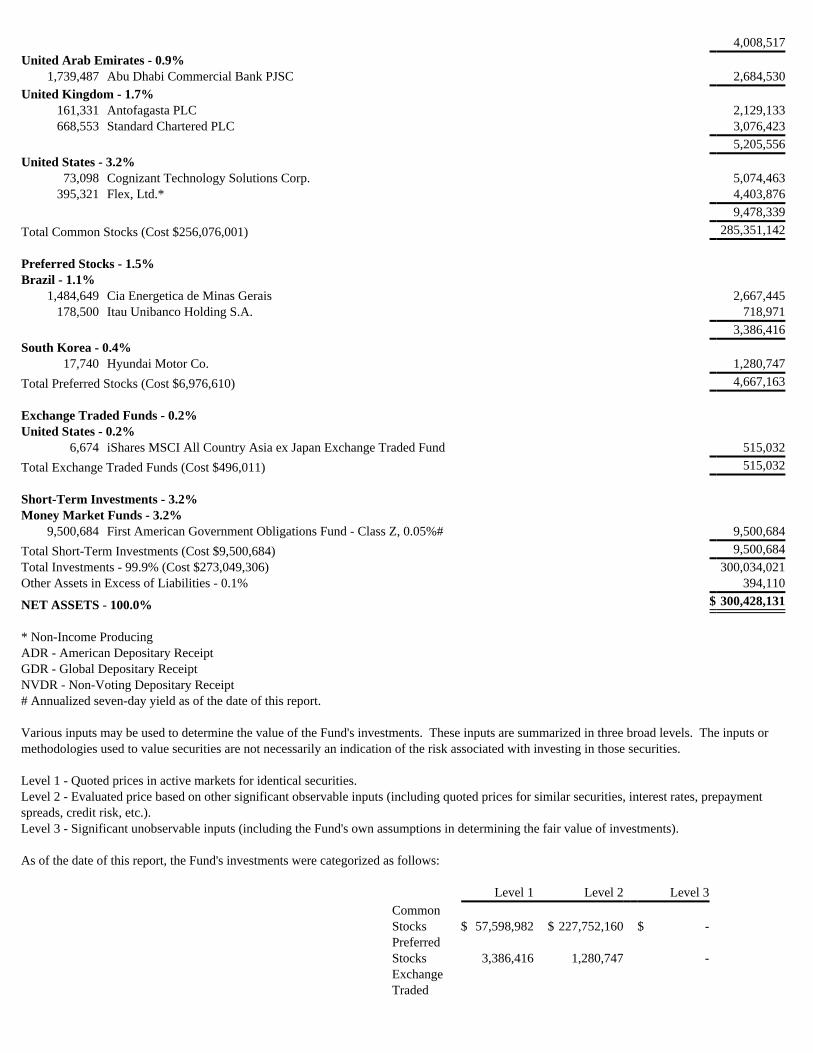
4,008,517 United Arab Emirates - 0.9% 1,739,487 Abu Dhabi Commercial Bank PJSC 2,684,530 United Kingdom - 1.7% 161,331 Antofagasta PLC 2,129,133 668,553 Standard Chartered PLC 3,076,423 5,205,556 United States - 3.2% 73,098 Cognizant Technology Solutions Corp. 5,074,463 395,321 Flex, Ltd.* 4,403,876 9,478,339 Total Common Stocks (Cost $256,076,001) 285,351,142 Preferred Stocks - 1.5% Brazil - 1.1% 1,484,649 Cia Energetica de Minas Gerais 2,667,445 178,500 Itau Unibanco Holding S.A. 718,971 3,386,416 South Korea - 0.4% 17,740 Hyundai Motor Co. 1,280,747 Total Preferred Stocks (Cost $6,976,610) 4,667,163 Exchange Traded Funds - 0.2% United States - 0.2% 6,674 iShares MSCI All Country Asia ex Japan Exchange Traded Fund 515,032 Total Exchange Traded Funds (Cost $496,011) 515,032 Short-Term Investments - 3.2% Money Market Funds - 3.2% 9,500,684 First American Government Obligations Fund - Class Z, 0.05%# 9,500,684 Total Short-Term Investments (Cost $9,500,684) 9,500,684 Total Investments - 99.9% (Cost $273,049,306) 300,034,021 Other Assets in Excess of Liabilities - 0.1% 394,110
NET ASSETS - 100.0% $ 300,428,131
* Non-Income Producing ADR - American Depositary Receipt GDR - Global Depositary Receipt NVDR - Non-Voting Depositary Receipt # Annualized seven-day yield as of the date of this report. Various inputs may be used to determine the value of the Fund's investments. These inputs are summarized in three broad levels. The inputs ormethodologies used to value securities are not necessarily an indication of the risk associated with investing in those securities. Level 1 - Quoted prices in active markets for identical securities.Level 2 - Evaluated price based on other significant observable inputs (including quoted prices for similar securities, interest rates, prepaymentspreads, credit risk, etc.).Level 3 - Significant unobservable inputs (including the Fund's own assumptions in determining the fair value of investments). As of the date of this report, the Fund's investments were categorized as follows:
Level 1 Level 2 Level 3 CommonStocks $ 57,598,982 $ 227,752,160 $ - PreferredStocks 3,386,416 1,280,747 - ExchangeTraded

Funds 515,032 - - Short-TermInvestments 9,500,684 - - TotalInvestments $ 71,001,114 $ 229,032,907 $ -

Brown Advisory - Beutel Goodman Large-Cap Value Fund Schedule of Investments September 30, 2020 (Unaudited)
Shares Security Description Value $ Common Stocks - 96.1% Communication Services - 14.4% 562,280 Comcast Corp. 26,011,073 506,642 Omnicom Group, Inc. 25,078,779 480,390 Verizon Communications, Inc. 28,578,401 79,668,253 Consumer Discretionary - 5.5% 10,735 AutoZone, Inc.* 12,641,965 712,589 Harley-Davidson, Inc. 17,486,934 30,128,899 Consumer Staples - 10.5% 387,170 Campbell Soup Co. 18,727,413 374,371 Kellogg Co. 24,180,622 100,860 Kimberly-Clark Corp. 14,892,988 57,801,023 Financials - 15.2% 277,300 American Express Co. 27,799,325 163,810 Ameriprise Financial, Inc. 25,244,759 28,695 BlackRock, Inc. 16,171,067 85,080 JPMorgan Chase & Co. 8,190,652 135,340 SEI Investments Co. 6,864,445 84,270,248 Health Care - 12.6% 284,421 AmerisourceBergen Corp. 27,566,083 78,085 Amgen, Inc. 19,846,084 266,035 Merck & Co., Inc. 22,067,603 69,479,770 Industrials - 17.7% 106,215 Cummins, Inc. 22,428,359 454,824 Flowserve Corp. 12,412,147 726,274 Ingersoll Rand, Inc.* 25,855,355 66,870 Parker-Hannifin Corp. 13,530,476 61,950 Trane Technologies PLC 7,511,438 259,865 Westinghouse Air Brake Technologies Corp. 16,080,446 97,818,221 Information Technology - 16.6% 400,757 Amdocs, Ltd. 23,007,459 26,300 KLA Corp. 5,095,362 847,610 NortonLifeLock, Inc. 17,664,192 515,220 Oracle Corp. 30,758,635 155,910 TE Connectivity, Ltd. 15,238,643 91,764,291 Materials - 3.6% 161,085 PPG Industries, Inc. 19,665,257 Total Common Stocks (Cost $489,213,287) 530,595,962 Short-Term Investments - 3.1% Money Market Funds - 3.1% 17,220,621 First American Government Obligations Fund - Class Z, 0.05%# 17,220,621 Total Short-Term Investments (Cost $17,220,621) 17,220,621 Total Investments - 99.2% (Cost $506,433,908) 547,816,583

Other Assets in Excess of Liabilities - 0.8% 4,474,959
NET ASSETS - 100.0% $ 552,291,542
* Non-Income Producing# Annualized seven-day yield as of the date of this report. Various inputs may be used to determine the value of the Fund's investments. These inputs are summarized in three broad levels. The inputs ormethodologies used to value securities are not necessarily an indication of the risk associated with investing in those securities. Level 1 - Quoted prices in active markets for identical securities.Level 2 - Evaluated price based on other significant observable inputs (including quoted prices for similar securities, interest rates, prepaymentspreads, credit risk, etc.).Level 3 - Significant unobservable inputs (including the Fund's own assumptions in determining the fair value of investments). As of the date of this report, all of the Fund's investments were categorized as Level 1 securities. The Global Industry Classification Standard (GICS®) was developed by and is the exclusive property of MSCI, Inc. and Standard & Poor’s Financial Services LLC ('S&P'). (GICS®) is a service mark of MSCI, Inc. and S&P and has been licensed for use by the Fund's Administrator, U.S.Bancorp Fund Services, LLC.