Brower et al. 2011 - Hamilton...
20
VOLUME 65, NUMBER 1 27 Journal of the Lepidopterists’ Society 65(1), 2011, 27–46 OVERWINTERING CLUSTERS OF THE MONARCH BUTTERFLY COINCIDE WITH THE LEAST HAZARDOUS VERTICAL TEMPERATURES IN THE OYAMEL FOREST LINCOLN P. BROWER, Department of Biology, Sweet Briar College, Sweet Briar, Virginia 24595; email: [email protected] ERNEST H. WILLIAMS, Department of Biology, Hamilton College, Clinton, New York 13323 LINDA S. FINK, Department of Biology, Sweet Briar College, Sweet Briar, Virginia 24595 DANIEL A. SLAYBACK, Science Systems and Applications, Inc., Biospheric Sciences Branch, Code 614.4, NASA Goddard Space Flight Center, Greenbelt MD 20771 M. ISABEL RAMÍREZ, Centro de Investigaciones en Geografia Ambiental, Universidad Nacional Autonoma de Mexico, Antigua Carretera a Pátzcuaro, 8701, CP 58190, Morelia, Michoacan, Mexico M. VÁN LIMÓN GARCÍA, Instituto de Geografia, Facultad de Ciencias, Ciudad Universitaria, Universidad Nacional Autonoma de Mexico, 04510, Coyoacan, Mexico D.F., Mexico RAÚL R. ZUBIETA, Posgrado en Ciencias Biologicas, Universidad Nacional Autonoma de Mexico, 04510, Coyoacan, Mexico D.F., Mexico STUART B. WEISS, Creekside Center for Earth Observations, 27 Bishop Lane, Menlo Park, CA 94025 WILLIAM H. CALVERT 503 East Mary Street, Austin TX 78704 AND WILLOW ZUCHOWSKI Apdo. 50-5655, Monteverde, Costa Rica ABSTRACT. During winter, monarch butterflies form dense colonies in oyamel fir forests on high mountains in central Mexico, where the forest canopy serves both as a blanket, moderating temperature, and an umbrella, shielding the butterflies from rain. In this study we investi- gated the vertical dimension of the butterflies' use of the oyamel forest: we predicted that clusters form at the heights above ground that pro- vide the greatest protection from freezing. By suspending temperature recorders at eight heights, from ground level up to 22m, we established two vertical transects in the forest. We set one transect in a densely forested area and the other in a thinned area, and we recorded hourly tem- peratures from Jan 13 through Feb 5, 2006. Intermediate heights in the forest, from 10 to 15m above ground, remained the warmest during the cold night and early morning. We also determined that this temperature distribution matched available records of the vertical distribution of butterflies roosting in branch and trunk clusters. The vertical temperature profiles became uniform during mid-day. Temperature extremes were moderated more during clear than during cloudy periods and more in the denser than in the thinned forest. Our results illustrate how the monarch butterfly is behaviorally adapted to the three-dimensional complexity of microclimate in the oyamel forest. A denser forest provides better protection for the overwintering survival of monarch butterflies than a thinned forest. This research bolsters our other microclimatic stud- ies, all of which point to the urgency of prohibiting logging within the oyamel forest used as wintering habitat by monarch butterflies. Additional key words: Danaus plexippus; conservation; Monarch Butterfly Biosphere Reserve; forest management; microclimate; trunk and bough clustering behavior; vertical temperature distribution; negative effects of forest thinning
Transcript of Brower et al. 2011 - Hamilton...

VOLUME 65, NUMBER 1 27
Journal of the Lepidopterists’ Society65(1), 2011, 27–46
OVERWINTERING CLUSTERS OF THE MONARCH BUTTERFLY COINCIDE WITH THE LEASTHAZARDOUS VERTICAL TEMPERATURES IN THE OYAMEL FOREST
LINCOLN P. BROWER,Department of Biology, Sweet Briar College, Sweet Briar, Virginia 24595; email: [email protected]
ERNEST H. WILLIAMS,Department of Biology, Hamilton College, Clinton, New York 13323
LINDA S. FINK,Department of Biology, Sweet Briar College, Sweet Briar, Virginia 24595
DANIEL A. SLAYBACK,Science Systems and Applications, Inc., Biospheric Sciences Branch, Code 614.4, NASA Goddard Space Flight Center, Greenbelt MD 20771
M. ISABEL RAMÍREZ,Centro de Investigaciones en Geografia Ambiental, Universidad Nacional Autonoma de Mexico, Antigua Carretera a Pátzcuaro,
8701, CP 58190, Morelia, Michoacan, Mexico
M. VÁN LIMÓN GARCÍA,Instituto de Geografia, Facultad de Ciencias, Ciudad Universitaria, Universidad Nacional Autonoma de Mexico,
04510, Coyoacan, Mexico D.F., Mexico
RAÚL R. ZUBIETA,Posgrado en Ciencias Biologicas, Universidad Nacional Autonoma de Mexico, 04510, Coyoacan, Mexico D.F., Mexico
STUART B. WEISS,Creekside Center for Earth Observations, 27 Bishop Lane, Menlo Park, CA 94025
WILLIAM H. CALVERT503 East Mary Street, Austin TX 78704
AND
WILLOW ZUCHOWSKIApdo. 50-5655, Monteverde, Costa Rica
ABSTRACT. During winter, monarch butterflies form dense colonies in oyamel fir forests on high mountains in central Mexico, where theforest canopy serves both as a blanket, moderating temperature, and an umbrella, shielding the butterflies from rain. In this study we investi-gated the vertical dimension of the butterflies' use of the oyamel forest: we predicted that clusters form at the heights above ground that pro-vide the greatest protection from freezing. By suspending temperature recorders at eight heights, from ground level up to 22m, we establishedtwo vertical transects in the forest. We set one transect in a densely forested area and the other in a thinned area, and we recorded hourly tem-peratures from Jan 13 through Feb 5, 2006. Intermediate heights in the forest, from 10 to 15m above ground, remained the warmest during thecold night and early morning. We also determined that this temperature distribution matched available records of the vertical distribution ofbutterflies roosting in branch and trunk clusters. The vertical temperature profiles became uniform during mid-day. Temperature extremes weremoderated more during clear than during cloudy periods and more in the denser than in the thinned forest. Our results illustrate how themonarch butterfly is behaviorally adapted to the three-dimensional complexity of microclimate in the oyamel forest. A denser forest providesbetter protection for the overwintering survival of monarch butterflies than a thinned forest. This research bolsters our other microclimatic stud-ies, all of which point to the urgency of prohibiting logging within the oyamel forest used as wintering habitat by monarch butterflies.
Additional key words: Danaus plexippus; conservation; Monarch Butterfly Biosphere Reserve; forest management; microclimate; trunk andbough clustering behavior; vertical temperature distribution; negative effects of forest thinning

2828 JOURNAL OF THE LEPIDOPTERISTS’ SOCIETY
Fall migrant monarch butterflies (Danaus plexippusL., Lepidoptera, Danainae) overwinter in the oyamel(Abies religiosa H.B.K., Pinaceae) forest ecosystem on12 mountain ranges in the Transverse Neovolcanic Beltin central Mexico (Slayback et al. 2007; Slayback &Brower 2007). The current archipelago-like distributionof the oyamel ecosystem is a remnant of a much widerforest that retreated up onto the taller volcanicmountains as the environment warmed at the end of thePleistocene (Manzanilla 1974; Rzedowski 1978; Snook1993; review in Brower 1995). In this forest, fromNovember through March the butterflies form coloniesat elevations of 2,700 to 3,300 m, with extremely denseclusters on both the branches and trunks. Although thebutterfly area is south of the Tropic of Cancer, becauseof its high elevation it is subjected to freezingtemperatures on cold nights during much of the winter(Calvert & Brower 1986). Moreover, because the N–Srunning Sierra Madre mountain systems north of thevolcanic highlands do not block northern polar airincursions (Hill 1969), the overwintering area can bestrongly affected by cold fronts that interact with PacificOcean moisture and generate winter storms with rain,hail, snow, and rime ice (Lauer 1973; Garcia 1997).
Given that the monarch belongs to the tropicalbutterfly subfamily Danainae and has only moderatefreeze resistance (Larsen & Lee 1994; Anderson &Brower 1996), it is a seeming paradox that the easternNorth American population migrates to and spends thewinter at such high elevations. The reason thebutterflies do so is that the cool temperature andmoisture inside the oyamel forest maintain thebutterflies in a state of reproductive diapause (James,1993) and allow them to conserve their lipid energyreserves that fuel their five month wintering period andtheir April remigration to the Gulf Coast states (Masterset al. 1988; Brower et al. 2006).
Anderson & Brower (1996) determined that 50% ofmonarchs die at -8ºC if they are dry, whereas if they arewet, 50% die at -4ºC, 80% are killed at -5ºC, and 100%are killed at -7ºC. The lethal combination for theoverwintering butterflies is to be wetted by a winterstorm and then subjected to freezing temperaturescaused by the intense radiant heat loss when the skyclears. The effects of three killer storms on thebutterflies have been documented by Calvert et al.(1983) for January 1981, by Brower et al. (2009) forFebruary 1992, and by Brower et al. (2004) for January2002. The 2002 storm killed an estimated 80% of alloverwintering monarchs in Mexico.
An intact oyamel canopy moderates the microclimatewithin the forest in three ways. The canopy operates asa blanket that helps to hold heat inside the forest
(Calvert et al. 1982, 1984, 1986; Anderson & Brower1996). From 5–7 Jan 2008, for example, the minimumtemperature beneath the forest canopy was +3.3º C,whereas in a nearby clearing it was –3.2ºC, i.e., 6.5º Ccolder (Brower et al. 2008b; see also Brower et al. 2009,Fig. 5). The canopy also serves as an umbrella shelteringthe butterflies from rain (Anderson & Brower 1996) andfrom heavy dew formation. Several of our field studieshave documented the presence of heavy dew and severefrosting in open areas ("llanos") and their absence withinforests immediately adjacent to overwintering colonies(Calvert & Brower 1981; Calvert et al. 1982, 1986;Calvert & Cohen 1983; Alonso-Meija et al. 1992, 1993).Finally, oyamel tree trunks retain heat during the night,maintaining the butterflies' temperatures when theyrest on the trunks (Brower et al. 2009). Thus, theoyamel forest contributes blanket, umbrella, and hot-water bottle effects, microclimatic factors that can becritically important during extreme freezes that followwinter storms.
Monarch butterflies do not distribute themselvesevenly at all heights within the oyamel forest. In initialdescriptions of the Sierra Chincua overwintering colony,Urquhart & Urquhart (1976), Brower (1977), andBrower et al. (1977) noted that the oyamel tree crownswere devoid of monarchs. This crown avoidance wasconfirmed during extensive aerial reconnaissance of thebutterfly colonies (Slayback et al. 2007; see Fig. 1 inBrower et al. 2008b). At the lowest forest stratum,Calvert et al. (1982) and Calvert & Brower (1986)observed that mid-winter branch and trunk clustersrarely occur close to the ground.
Geiger (1950) and Geiger et al.'s (2003) summaries offorest microclimate led us to embrace a hypothesis thatthe butterflies avoid both the tree tops and the groundto reduce their probability of freezing. As Geigerpointed out, the tops of forest trees are colder at nightthan the branches beneath the canopy because tree topslose heat through radiation to the open sky. Geiger et al.(2003) also noted that tree tops are subject to heavy dewcondensation and rime ice deposition. We witnessedthe latter during storms in January 1981 and 2002(Calvert & Brower 1986; Brower et al. 2004). Finally,nighttime temperatures near the ground are oftencolder than at mid-forest levels due to radiant heat lossthrough openings in the canopy, cold air drainage(especially in mountainous terrains), and loss to the soil,which can serve as a heat sink.
The current study, spurred by our growing awarenessof the spatial and temporal complexity of microclimateswithin oyamel forests, addresses the relationship of thebutterflies' clustering behavior to the forest's verticaltemperature profile. We first quantify the vertical
VOLUME 65, NUMBER 1 29
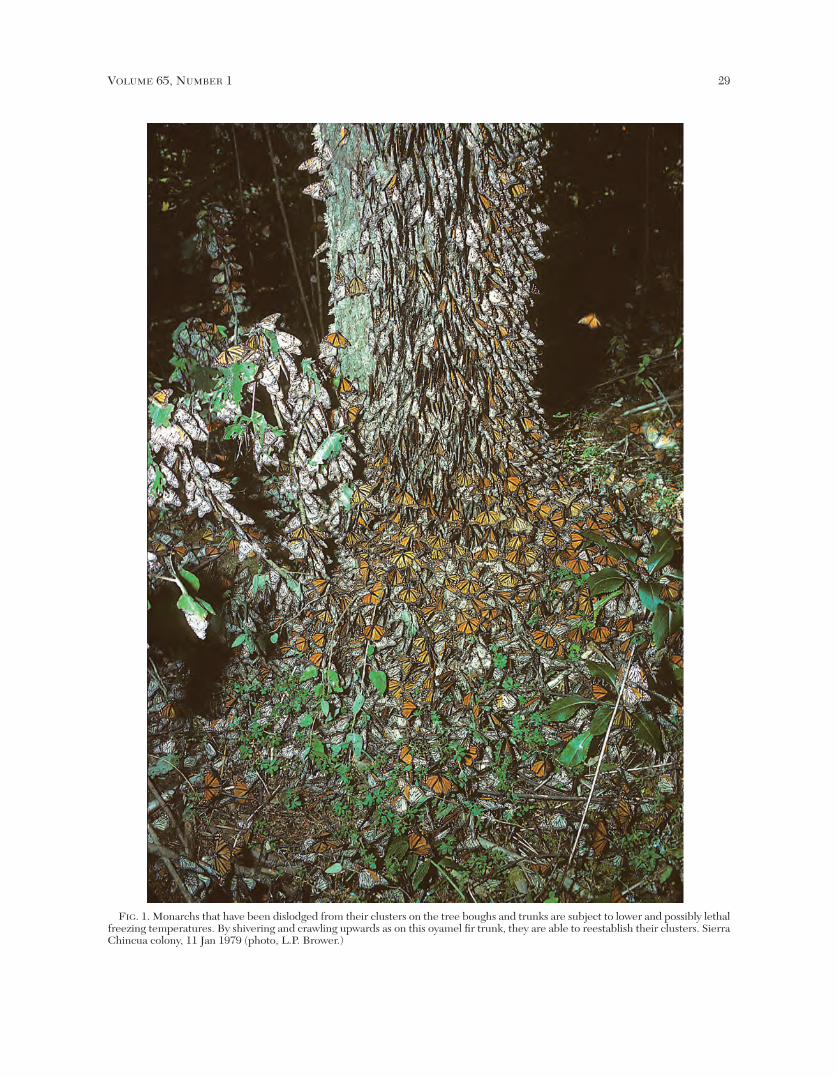
FIG. 1. Monarchs that have been dislodged from their clusters on the tree boughs and trunks are subject to lower and possibly lethalfreezing temperatures. By shivering and crawling upwards as on this oyamel fir trunk, they are able to reestablish their clusters. SierraChincua colony, 11 Jan 1979 (photo, L.P. Brower.)
3030 JOURNAL OF THE LEPIDOPTERISTS’ SOCIETY
distribution of the trunk and bough clusters on theoyamel trees. We next compare temperatures recordedin an open area with those recorded beneath the forestcanopy to demonstrate how the forest moderates thetemperatures during mid-winter. We then compare theforest temperature moderation over 24 hours on clearversus cloudy days. Finally, we present the verticaltemperature profiles within the oyamel forest atdifferent times of day, for both clear and cloudyconditions, and for two trees differing in their degree ofcanopy cover.
We ask six questions: (1) What is the verticaldistribution of monarchs? (2) How does air temperaturevary with height within the forest? (3) Is verticalvariation in temperature different during clear andcloudy periods? (4) How does the vertical temperatureprofile change over 24 hours? (5) Is the verticaltemperature profile different in a closed versus an openforest? (6) Could the vertical distribution of themonarch clusters provide thermal benefits for thebutterflies?
Answers to these questions amplify our knowledge ofthe microclimatic consequences for monarchs becauseof their association with the oyamel forests. They alsohave implications for how oyamel forests should bemanaged for the long-term conservation of the monarchbutterfly.
MATERIALS AND METHODS
Measuring the vertical distributions of monarchclusters on oyamel trees. On 1 Mar 1979, W. Calvertand W. Zuchowski used a Spiegel Relaskop (ForestrySuppliers, Jackson, MS) to measure the verticaldistributions of monarch trunk clusters on ten oyamelsand the heights of nine of the ten trees (Table 1). These
data were gathered in the Sierra Chincua 4 colony,located in Arroyo Zapatero, as described in Calvert &Brower (1986). On 5–6 Feb 2008 we measured thevertical distribution of branch clusters on 18 oyameltrees in the Arroyo Hondo colony, also on the SierraChincua, as described in Brower et al. (2008b). For the2008 measurements, we used a stick method as follows:we first marked the 2 m height on a tree trunk; then,from approximately 30 m away, we held a short stick atarm’s length that by eye matched the 2 m height on thetree; finally, we estimated the number of multiples ofthe 2 m length required to reach the cluster bottom, thecluster top, and the tree top. This method (OntarioWoodlot Assoc. 2003) provides estimates with anaccuracy of approximately ±10%. Both the 1979 and2008 measurements were taken in colonies that had notbeen affected by winter storms. The vertical extents oftrunk and branch clusters generally coincide exceptafter storms or other disturbances when the dislodgedbutterflies crawl back up the trunks as shown in Fig. 1.
The vertical transect study area. We conductedour vertical transect study in an oyamel forest on a ridgebehind Chincua Station located in the Ejido losRemedios (Fig. 2). As described in Brower et al. (2009),the forest is within the elevational range of the knownmonarch overwintering areas on the Sierra Chincua andis 2–4 km ESE of where butterfly colonies have formedevery year since the first Chincua colony was discoveredin 1975. Even though monarch colonies have neverbeen reported in this specific location, the forestcharacteristics (species composition, tree density, sizedistribution, slope, elevation, and southern exposure)are similar to the areas where monarchs do formcolonies on the Sierra Chincua massif. The study areaincludes one of the sites used in Brower et al. (2009).
TABLE 1. Vertical distribution of monarch clusters on oyamel trees on the Sierra Chincua. Data shown are mean ± s.d. and (range).
1979 trunk clusters 2008 branch clusters diff
Clusters
top of clusters 15.7 ± 3.0 m (10.0 to 19.8) 15.4 ± 2.4 m (11.0 to 20.7) n.s.
bottom of clusters 7.2 ± 1.1 m (4.8 to 8.9) 5.9 ± 2.5 m (1.5 to 10. 4) n.s.
vertical extent 8.5 ± 2.9 m (3.5 to 12.0) 9.5 ± 2.9 m (5.5 to 17.1) n.s.
Trees with these clusters
height 26.6 ± 4.8 m (15.5 to 30.5) 20 to 30 m **
dbh 37.1 ± 14.5 cm (20.3 to 66.2) 14.9 ± 4.4 cm (6.8 to 20.8) p<.001
Sample size 10 * 18
*N = 9 for tree height measureiments
**estimated

VOLUME 65, NUMBER 1 31
FIG. 2. The main map shows the location of our weather station as a red triangle, the Monarch Butterfly Biosphere Reserve(MBBR) Field Station (on el Llano de las Papas), the locations of Trees 1 and 2, and elevation contours at 20 m intervals, on top ofa GeoEye-1 satellite image (© GeoEye) made on 11 April 2009. The distance from the weather station to Tree 1 is 350 m and toTree 2 is 290 m. Tree 1 and 2 are 140 m apart. The down-slope facing aspects were 150º for Tree 1 and 160º for Tree 2. The insetmap shows the location of this site within the MBBR and the location of the Sierra Chincua on top of a Landsat 7 satellite imagemade on 16 Jan 2003.

3232 JOURNAL OF THE LEPIDOPTERISTS’ SOCIETY
FIG. 3. The experimental trees. (A) view of the vertical transect at Tree 1; (B) same, Tree 2. Four of the eight cylinders in whichthe Thermochrons were mounted are visible in A, while two are visible in B; two cylinders in each photo are marked by arrows.The canopy above Tree 1 is 34% open to the sky, and Tree 2 is 13% open. (Photos, L. P. Brower, from the same facing angles asthe transects.)
VOLUME 65, NUMBER 1 33
Small-scale timber removal has taken place in this siteperiodically, and all trees are relatively young, similar tothose in the Chincua colony when studied during the2007–2008 overwintering season (Brower et al. 2009).
Two trees were selected within the forest that differedin the immediately surrounding forest cover. The imagesin Fig. 3 were taken from the ground looking straight upat each tree's canopy with a Canon D-20 camera and anEF-S 17–40 mm lens set at 17 mm. Adobe Photoshoppixel analysis (Hein 2006) indicated that 34% of the opensky showed above Tree 1 and 13% above Tree 2; that is,Tree 1 was in a relatively open area of the forest whereasTree 2 was in a more closed area. Both trees wereapproximately 40 cm in diameter and 30 m tall. Theslopes at Trees 1 and 2, measured with a clinometer, wereboth approximately 15 degrees, and their aspects were140º and 150º, respectively. For reasons of security andequipment, our data acquisition was limited to two trees.
We used a Garmin GPS MAP60CSx unit to locate thepositions of the two oyamel trees and plotted them on anorthorectified, pan-sharpened GeoEye-1 satellite image(© GeoEye) with 0.50 m resolution, taken on 11 April2009. The location of our weather station and the twooyamel fir trees are shown in Fig. 2. The coordinates forthe weather station were: 19º 39' 41.9" N and 100º 16'6.2"W, at an elevation of 3160 m. The tree coordinateswere: Tree 1: 19º39' 52" N and 100º16' 10'' W; Tree 2:19º39' 48" N and 100º16' 13'' W.
Setting the vertical transects. The vertical line andcylinders for Tree 1 were set on 11 Jan 2006 with the linefacing 340º; those for Tree 2 were set on 12 Jan 2006 withthe line facing 255º. Both Fig. 3 A & B were taken on 12Jan 2006, an overcast day. We used a Big Shot slingshot(Sherrill Arborist Supply, Greensboro, N.C.) to throw anylon string over an upper bough on each oyamel. Foreach height, one temperature data logger (see below) wasmounted on a lateral wall inside a white plastic PVCcylinder (12.5 cm long, inside diameter 5.2 cm, outsidediameter 6.0 cm). The cylinders were suspendedhorizontally from nylon strings tied through small holesbored 1.25 cm from each end. The cylinder strings wereattached to the suspended vertical line, which was pulledup so that the cylinders were suspended at eight heights(0, 3, 6, 9, 13, 16, 19, and 22 m above the ground). Thecylinders were free to rotate. The temperature recorderswere shielded from direct sunlight by the PVC cylinderand by the forest canopy. The main string was securednear the base of the tree so that the transect hung 0.5 to1 m away from the tree trunk (Fig. 3A & B).
Temperature measurements. Each hour theweather station (WeatherHawk, Model 232, Logan, UT)recorded the previous hour's average, minimum, andmaximum temperatures, with an accuracy of 0.01ºC.
Vertical transect temperatures were measured withiButton Thermochrons (Model DS1921G, MaximIntegrated Products, Dallas Semiconductor). Thesesmall (1.6 cm by 0.7 cm) digital recorders measuretemperature in 0.5ºC increments, with a range of -40º to85ºC and a rated accuracy of ±1.0ºC (DallasSemiconductor); we have previously determined thatunder our experimental conditions their accuracy isbetter than ±0.5ºC (Brower et al. 2008b). Weprogrammed the Thermochrons to record oneinstantaneous reading each hour. They were in place bymid-afternoon on 12 Jan 2006 and were retrieved on 6Feb 2006. We used the data for 24 days, from 13 Janthrough 5 Feb 2006. For a comparison of temperatureprofiles during different weather conditions, we selectedfive cloudy days (Jan 25, 26, 28, 29, and 31) and five cleardays (Jan 13, 18, 19, and Feb 4, 5) for analysis of mid-morning, mid-day, and afternoon temperature profiles.Similar choices were made for nighttime comparisons(19:00 through 07:00 hrs) under cloudy conditions on Jan24–25, 25–26, 26–27, 27–28, 28–29) and under clearconditions (Jan 13–14, 18–19, 19–20, Feb 3–4, 4–5). Thedifference between the cloudy and clear days (Duchon &O’Malley 1999) is illustrated by comparing the highestrecorded solar output for each day (recorded hourly); theaverages of the daily high readings (mean ± 95% C.I.)were 519.2 ± 56.0 watts/sq-meter for the five cloudy daysand 814.8 ± 22.2 watts/sq-meter for the five clear days (t-test, p < 0.001). The only precipitation recorded duringthe 24-day study was on cloudy days, 6 mm on Jan 26 and9 mm on Jan 27.
Analysis. All data were analyzed using SPSS versions16 and 17 (SPSS, 2008). We analyzed patterns in thevertical profiles using regression analysis, both linear andpolynomial, with tree incorporated as a fixed effect andday as a random effect in a mixed effects model. Allregressions used height and height squared asexplanatory variables. The daily temperature ranges ofthe two trees were compared by paired t-tests, with astrict Bonferroni correction (Walsh, 2004) applied to thecomparisons at all heights.
To examine temporal autocorrelation of the data, wedeveloped a correlogram based on time lags j = 1 to 9 hr(Diggle 1990). The results revealed significantautocorrelation for time lags up to four hours butnegligible effects for longer lags. Thus, measurementsclose in time on the same day are not independent, whilerecords from different days provide independentmeasures. To ensure correctness of the patterns we’rereporting, we assessed the validity of these patterns bycomparing them to the same analyses using only thosedata that were separated by five or more hours.

RESULTS
Vertical distribution of the trunk and boughclusters on oyamels. The trunk clusters in 1979extended, on average, between 7.2 m and 15.7 m abovethe forest floor, with an average vertical extent of 8.5 m(Table 1). The average tree height was 26.6 m, that is,11 m above the top of the clusters. The branch clustersin 2008 showed a similar pattern: the clusters werebetween 5.9 m and 15.4 m above the ground, with anaverage vertical extent of 9.5 m (Table 1). Although wedid not measure tree heights in 2008, we estimatedthem to be between 20 and 30 m; thus, the canopyextended 5 to 15 m above the topmost clusters. Fig. 4summarizes these vertical distributions of the clusterson a 27 m oyamel.
Moderation of daily temperature extremes bythe forest canopy. The moderating effect of thecanopy on temperatures is evident from a comparison of
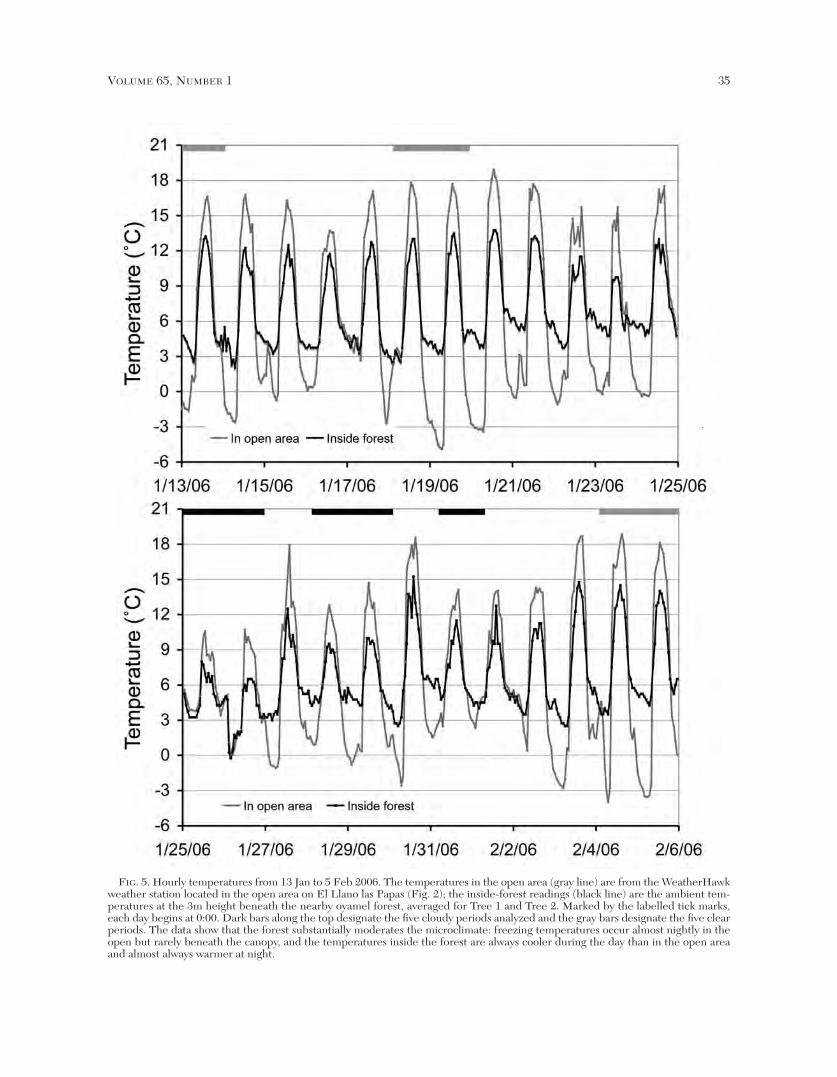
the ambient temperatures at the 3m height at our twostudy trees with those at the nearby weather station(Fig. 5). The temperatures inside the forest beneath thecanopy are always cooler during the day and almostalways warmer at night than they are in the open area.Through the 24 days, the temperature range at theweather station was 23.8ºC (from –4.9º to +18.9ºC),while the temperature range for the two forest trees was15.6ºC (from –0.3º to +15.3ºC). Thus, the temperaturevaried in the open area 8.2ºC more than beneath theforest canopy, and freezing temperatures occurred onlyonce in the forest compared to most nights in the open.
Comparison of the temperature patterns duringcloudy versus clear conditions. The temperatureregimes on cloudy and clear days at the 3 m heightunder the forest canopy and in the nearby open areareveal an interaction between the effects of canopy andcloud cover (Fig. 6A and B). Each hourly temperatureinside the forest is based on the average of Trees 1 and
3434 JOURNAL OF THE LEPIDOPTERISTS’ SOCIETY
FIG. 4. The relationship of nighttime vertical temperatures (right) and monarch cluster heights (center) on an oyamel fir of aver-age height (27 m, left). The black height bars are mean m above the ground ± 1 s.d. (data from Table 1). The blue and red lines showthe fitted nighttime vertical temperature profiles from measurements made from the ground to 22 m on two oyamels; the blue lineis from Tree 1 in the thinned forest, while the red line is from Tree 2 in the denser forest (data from Fig. 7; regressions given in thetext). The height of the lowest branches varies. The clusters averaged 6.4 m above the ground and extended on average upwards to15.5 m, which is more than 10 m below the canopy (Table 1), with most monarchs concentrated at middle levels. The mid sectionof both trees is about 1–2º warmer than both the ground and the upper canopy temperatures. The data thus indicate that the but-terflies behaviorally select the safest microclimate by avoiding the ground and the treetop, where they would be subjected to moresevere cold temperatures, and (in the treetop) to wetting by dew. The vertical temperature profile for the tree in the thinned forestis up to 1ºC colder at all heights. The tree image is based on Earle (2009).
VOLUME 65, NUMBER 1 35
FIG. 5. Hourly temperatures from 13 Jan to 5 Feb 2006. The temperatures in the open area (gray line) are from the WeatherHawkweather station located in the open area on El Llano las Papas (Fig. 2); the inside-forest readings (black line) are the ambient tem-peratures at the 3m height beneath the nearby oyamel forest, averaged for Tree 1 and Tree 2. Marked by the labelled tick marks,each day begins at 0:00. Dark bars along the top designate the five cloudy periods analyzed and the gray bars designate the five clearperiods. The data show that the forest substantially moderates the microclimate: freezing temperatures occur almost nightly in theopen but rarely beneath the canopy, and the temperatures inside the forest are always cooler during the day than in the open areaand almost always warmer at night.
3636 JOURNAL OF THE LEPIDOPTERISTS’ SOCIETY
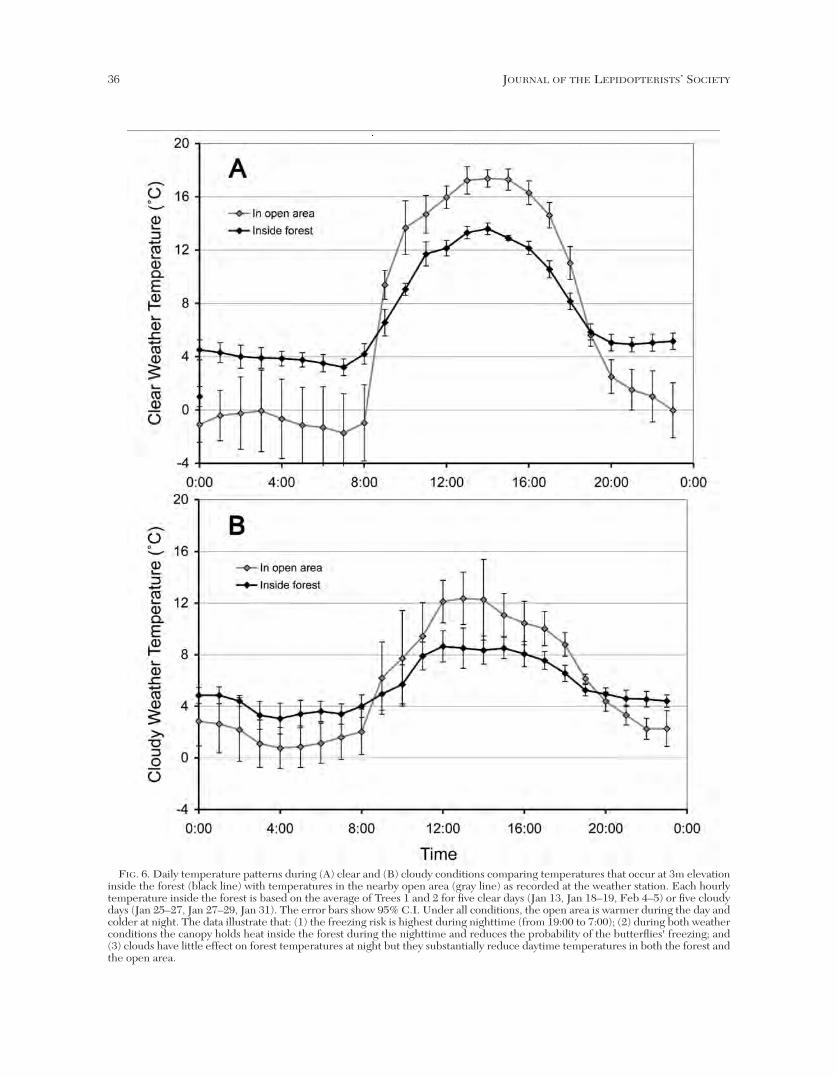
FIG. 6. Daily temperature patterns during (A) clear and (B) cloudy conditions comparing temperatures that occur at 3m elevationinside the forest (black line) with temperatures in the nearby open area (gray line) as recorded at the weather station. Each hourlytemperature inside the forest is based on the average of Trees 1 and 2 for five clear days (Jan 13, Jan 18–19, Feb 4–5) or five cloudydays (Jan 25–27, Jan 27–29, Jan 31). The error bars show 95% C.I. Under all conditions, the open area is warmer during the day andcolder at night. The data illustrate that: (1) the freezing risk is highest during nighttime (from 19:00 to 7:00); (2) during both weatherconditions the canopy holds heat inside the forest during the nighttime and reduces the probability of the butterflies' freezing; and(3) clouds have little effect on forest temperatures at night but they substantially reduce daytime temperatures in both the forest andthe open area.

2 for five cloudy days or for five clear days. The openarea temperatures are based on the same 5 days fromthe weather station.
Under clear conditions, for all hours from 10:00through 17:00 the daytime forest temperature wassignificantly cooler, by 3–4ºC, than in the open. Thenighttime forest temperature was significantly warmer,by 4–5ºC, between 21:00 and 08:00. In contrast, undercloudy conditions the difference between the forest andopen sites was reduced, especially at night. Thedaytime temperature rise was smaller both in the openand in the forest; the difference between the two siteseach hour was 1–4ºC, and significant during only four ofthe hours. On cloudy nights the difference between theforest and open sites was reduced to 2–3ºC, and wassignificantly different for only two nighttime hours.
These results illustrate that clouds (1) reduce theradiant energy loss at night in open areas, but (2) havelittle effect inside the forest. The data also indicate thatthe forest (3) maintains cooler daytime temperaturesduring both clear and cloudy daytimes and (4) alsomaintains warmer temperatures at night irrespective ofcloud cover. Moreover, (5) the moderating effect of thecanopy is greater under clear conditions than undercloud cover. Most importantly, the blanket effect of theforest during the night reduces the risk of thebutterflies' freezing and during the day reduces thetemperatures and therefore also the rate at which thebutterflies burn lipids.
Vertical temperature profiles during thenighttime. During the night and early morning, from19:00 through 07:00 hrs, the intermediate heights werewarmer than the ground and the top of the forest forboth vertical transects (Fig. 7). At each height and foreach transect, the average temperature was based on312 measurements (13 records per night for 24 days). Apolynomial model yielded the best fit for each tree, andthe regressions were significant (Tree 1, F=228.58,p<0.001; Tree 2, F=68.96, P<0.001). The regressionsfor the two trees were also significantly different(t=15.424, p<0.001). For Tree 1, Temp = –0.010 Ht2 +0.259 Ht + 3.311; for Tree 2: Temp = –0.006 Ht2 +0.147 Ht + 4.405. Equivalent results obtained whenusing only separated data points per night to avoidautocorrelation (three records per night, at 20:00,01:00, and 06:00 hrs, for 24 days): Tree 1, Temp =–0.010 Ht2 + 0.260 Ht + 3.338; for Tree 2: Temp =–0.006 Ht2 + 0.151 Ht + 4.443; statistics in Table 2).The warmest heights given by the regressions were at13.0 m for Tree 1 and at 12.2 m for Tree 2; based on theactual measurements, the warmest temperatures werefrom 6 to 16 m for Tree 1 and from 13 to 16 m for Tree2. The regressions indicate that the ground was 1.7ºCcolder than the warmest intermediate heights for Tree1 and 0.9ºC colder for Tree 2, and that the temperatureat 22m was 0.8ºC colder than the warmest intermediateheight for Tree 1 and 0.6ºC colder for Tree 2. Bothregressions were significant, as were the curvilinear
VOLUME 65, NUMBER 1 37
TABLE 2. Regression statistics for analyses of the nighttime temperature profiles measured at eight heights on two oyamel trees(2496 measurements for each when all data are analyzed; 576 measurements for separated, independent temperatures). For theanalysis by temperature differences, the temperature at the 3 m height was subtracted from the temperature at each of the sevenother heights. The regression statistics show the fit of the polynomial (curvilinear) model to the temperature data, while the qua-dratic coefficients show the significance of the curvilinear component. These statistical results confirm that nighttime temperaturesare significantly warmer at intermediate heights.
Tree 1 Tree 2
Analysis by actual temperatures
regression F = 228.58; p < 0.001 F = 68.96; p < 0.001
quadratic coefficient t = 17.367; p < 0.001 t = 10.579; p < 0.001
R square 0.155 0.052
Analysis by separated temperatures
regression F = 55.498; p < 0.001 F = 19.624; p < 0.001
quadratic coefficient t = 8.545; p < 0.001 t = 5.696; p < 0.001
R square 0.159 0.061
Analysis by temperature differences
regression F = 1584.25; p < 0.001 F = 521.25; p < 0.001
quadratic coefficient t = 45.721; p < 0.001 t = 29.084; p < 0.001
R square 0.560 0.295
(quadratic) components of the regressions (Table 2).The temperatures were consistently lower for Tree 1,which had 34% of the canopy opened to the sky,compared to Tree 2 which had only 13% of the canopyopened to the sky (Fig. 2A and B). The curvilinearregressions of nighttime temperatures for Tree 1 andTree 2 are summarized diagrammatically in Fig. 4 anddemonstrate that the vertical distribution of monarchclusters matches the safest part of the verticaltemperature profiles in the oyamel forests.
Similar patterns resulted when we ran a separateanalysis of the vertical temperature profiles based onthe temperature differences between the actual readingat each height and the temperature measured at the 3m height. We ran this analysis to exclude the influenceof some days being warmer than others (treating time asa random effect), and therefore to reduce the variancein day-to-day measurements. As a result, the R squarevalues were much higher, as were the F and t statistics(Table 2). The regression equations based on thetemperature differences are identical to the regressionequations based on the actual temperatures, except forthe axis intercepts (–0.729 for Tree 1 and –0.786 forTree 2). Thus, the curvature of each line (thedependence of temperature on height above theground) and the interpretation of the results wereidentical whether the regressions were based on actualtemperatures or temperature differences.
We examined the influence of cloud cover on thenighttime temperature profiles. Our initial analysesshowed that, when we separated the data for clear andcloudy nights, a polynomial regression provided a betterfit than a linear regression for temperatures of bothtrees under both clear and cloudy conditions. Thisresult was similar to that with all data combined (Fig.7). Comparisons of the polynomial model to the linearmodel gave these measures of fit: Tree 1 clear weather,R square (polynomial) =0.656 versus R square (linear)=0.266; Tree 1 cloudy 0.326 versus 0.041; Tree 2 clear0.412 versus 0.118; Tree 2 cloudy 0.168 versus 0.002).From the regressions, intermediate heights (12 to 14m)of Tree 1 were 3.0º warmer than the ground duringclear nights but only 1.0º warmer on cloudy nights. ForTree 2, in the denser part of the forest, the differenceswere less, at 1.3º for clear nights but only 0.6º for cloudynights. From the analyses for Tree 1, we found greatercurvature (a greater difference between temperaturesat intermediate heights and those at the top and bottomof the transect) on clear nights than on cloudy nights(t=2.971, p=0.003). For Tree 2, the differences duringclear and cloudy conditions were reduced and not quitesignificant (greater curvature on clear nights, t=1.754,p=0.080).
Nighttime temperatures may also be viewedseparately for cloudy and clear nights (Fig. 8). Thesame vertical pattern is apparent as in Fig. 7, with Tree1 being colder than Tree 2 but with the cloudy nightshaving lower temperatures.
Temperature profiles during mid-morninghours. During morning hours (0900 and 1000; Fig. 9)of clear days, the temperature increased significantlyfrom the ground towards the canopy (regression, effectof height: t=3.890, p<0.001 for Tree 1; t=1.991,p=0.048 for Tree 2). The averages over all heights were8.7±0.5ºC for Tree 1 and 9.0±0.5ºC for Tree 2. Incontrast, on cloudy days the vertical temperature profilewas remarkably uniform (regression, effect of height:t=0.277, n.s. for Tree 1; t=0.312, n.s. for Tree 2) andaveraged 5.3±0.5ºC for both trees. This average was lessthan 1ºC warmer than the nighttime average (Figs. 7,8). The differences between clear and cloudy days weresignificant (Tree 1: t=12.198, p<0.001; Tree 2: t=11.627,p<0.001), with the average temperature being morethan 3º cooler on cloudy days than on clear days.
Temperature profiles during the mid-day hours.By mid-day (12:00 and 13:00) the nighttime profile wasfully erased on both clear and cloudy days, andtemperatures were uniform throughout the verticalprofiles (Fig. 10). There was no effect of height ontemperature for either transect (Tree 1: t=0.007, n.s.;Tree 2: t=0.309, n.s.). The clear days, however, weresignificantly warmer than cloudy days (Tree 1: t=11.279,p<0.001; Tree 2: t=12.015, p<0.001). For Tree 1, mid-day temperatures averaged 12.7º on clear days and 8.5ºon cloudy days, while for Tree 2, the averages were12.3º and 7.9º.
Temperature profiles during the afternoonhours. On clear and cloudy days, the afternoon hours(from 1500 to 1700) continued to produce a mostlyuniform vertical temperature profile (Fig. 11) as overalltemperatures began to decrease. Similar to mid-day,there was no effect of height on temperature for eithertransect under cloudy conditions (Tree 1: t=0.153, n.s.;Tree 2: t=0.216, n.s.), and despite some variability intemperatures, there was no consistent effect of heightduring clear conditions either (Tree 1: t=0.883, n.s.;Tree 2: t=1.137, n.s.). On Tree 1, we suspect that the 19m Thermochron received direct insolation on cleardays, producing a temperature spike at that height. Aswas true during morning and at mid-day, temperatureswere significantly higher on clear than on cloudy days(Tree 1: t=16.684, p<0.001; Tree 2: t=23.410, p<0.001);the averages were 12.7º on clear days and 8.1º on cloudydays for Tree 1 and 11.8º on clear days and 7.8º oncloudy days for Tree 2.
Daily pattern. Comparison of Figs. 7-10 shows that,
3838 JOURNAL OF THE LEPIDOPTERISTS’ SOCIETY

VOLUME 65, NUMBER 1 39
FIG. 8. Average nighttime (19:00 to 07:00 hrs) temperature measurements at eight heights above the ground for Tree 1 andTree 2 during five cloudy nights and five clear nights. Error bars show 95% C.I. Fig. 7, in contrast, shows the overall comparisonof Tree 1 and Tree 2 during all nights.
FIG. 7. Average nighttime (19:00 to 07:00 hrs) temperature measurements at eight heights above the ground for Tree 1 (blackline) and Tree 2 (gray line) over 24 days (13 Jan through 5 Feb 2006). Error bars show 95% C.I.; statistics are in Table 2. These re-sults, in combination with Table 1, indicate that the vertical distribution of monarch clusters matches the safest part of the verticaltemperature profiles in the oyamel forests. At night Tree 2 averages 0.55 degrees warmer than Tree 1, which is more exposed. Thecurvilinear regression lines are displayed along with the monarch cluster height preferences in Fig. 4.

4040 JOURNAL OF THE LEPIDOPTERISTS’ SOCIETY
FIG. 9. Vertical temperature profiles during mornings (0900 and 1000 hr) for both Tree 1 and Tree 2, with a comparison of cloudyand clear days. Each data point is an average calculated from 10 measurements during five cloudy days and five clear days. Errorbars represent 95% C.I.
FIG 10. Vertical temperature profiles at mid-day (1200 and 1300 hrs). The temperature profiles became vertically uniform by mid-day on both cloudy and clear days, and clear days were uniformly about 4º warmer than cloudy days at all heights. Each average wascalculated from 10 data points (2 hours per day over 5 days that were either cloudy or clear); error bars represent 95% C.I.

VOLUME 65, NUMBER 1 41
FIG. 11. Vertical temperature profiles for afternoon (1500, 1600, 1700 hr) temperatures for both transects, showing a comparisonof cloudy and clear days. These afternoon temperature profiles were nearly the same as mid-day (Fig. 10) and were uniform andnearly identical for the two trees on cloudy days. On clear days, they were both about 4ºC warmer, with no vertical differences inTree 2. The spike in temperature for Tree 1 at the 19 m level resulted from its receiving direct insolation in the late afternoon. Eachaverage is calculated from 15 measurements (3 hours across 5 days); error bars represent 95% C.I.
FIG. 12. The average daily range in temperatures at each height along the vertical transects of Tree 1 (black line) and Tree 2 (grayline). Tree 1, in the more open area of the forest, varies more in temperature each day than does Tree 2. The temperature spike forTree 1 at 19 m was caused by late afternoon sunlight directly warming the Thermochron. Error bars represent 95% C.I.
4242 JOURNAL OF THE LEPIDOPTERISTS’ SOCIETY
during both clear and cloudy weather, the curvilinearnighttime profile (Fig. 7) becomes uniform as the dayadvances (Figs. 9–11), and the temperatures at allheights are about 4º warmer on clear days than oncloudy days (Figs. 9–11).
Effect of forest density. The vertical temperatureswithin the forest were further moderated by the extentof tree cover (Fig. 12). Each point in the graph showsthe average daily range (daily maximum minus the dailyminimum temperatures) for each tree at each heightover the 24 days of the study. The daily range intemperature for Tree 1, in a more open part of theforest, averaged 9.6±2.7ºC, whereas the daily range forTree 2, in denser forest, averaged 8.2±2.0ºC. Theoverall difference is significant (paired t-test, t=9.509,df=183, p<0.001), and the differences at each heightexcept the ground are also significant (paired t-testswith strict Bonferroni correction [Walsh 2004], fromt=3.990 to t=6.633, df=22, p ≤ 0.001 for each of theseven heights above the ground; n.s. at ground level).These results illustrate that opening of the forest canopyincreases the daily temperature range at all heights inthe forest, a result that has conservation implications.
DISCUSSION AND CONCLUSION
Why do monarchs cluster at intermediateheights? The data presented in this paper establishthat monarch butterflies form clusters on the oyamelboughs and trunks at intermediate heights beneath theforest canopy (Fig. 4) and that these heights coincidewith the warmest nighttime temperatures in the forest(Fig. 7). Clustering at these slightly warmerintermediate levels during severe cold events may becritical when the temperature drops below –3ºC, thetemperature at which the freezing risk for wetbutterflies increases dramatically (Anderson & Brower1996). We interpret these data as indicating an adaptivebehavior that reduces the probability of freezingmortality in the oyamel overwintering forests.
A behavioral response to the warmest parts of coniferforests is not unique to monarchs. For example,Wachob (1996a, b) reported that mountain chickadeesseek out the warmest microclimates in a high elevationconiferous forest for nesting and foraging. The clustersmay moderate their own immediate microclimate(Brower et al. 2008b), in part by blocking wind andreducing convection. Furthermore, there is evidencethat trunk clusters attain greater thermal protectionthan do branch clusters (Brower et al. 2009).
Exceptions to the typical vertical cluster distributionhave occurred after storms that dislodge millions ofbutterflies (Brower et al. 2002) and also after theclusters have been disrupted by wind or by logging.
Monarch butterflies are unable to fly below a thoracictemperature of approximately 13–15ºC (Masters et al.1988; Alonso-Meija et al.1993), but they are capable ofcrawling when their thoracic temperatures are as low as4ºC (Alonso-Meija et al. 1993). The daytimetemperatures we measured beneath the forest wereusually high enough (Fig. 6) to enable the butterflies tocrawl back up onto the tree trunks (Fig. 1) andeventually reestablish their clusters at intermediateheights (Brower & Calvert unpubl. obs.).
Opportunities for butterflies to remainquiescent or fly during the day. From morningthrough afternoon, on both clear and cloudy days (Figs.9–11), the temperatures at all heights in the forest wereas much as 10ºC below flight threshold, except when thesun hit the highest branches (Fig. 11). Under theseconditions, butterflies were able to remain quiescentand minimize consumption of their lipid reserves. Incontrast, in the nearby open area (Fig. 6), the flightthreshold was exceeded for four or more hours on mostclear days, from at least 12:00 to 16:00.
Despite the energetic benefits of remaining cool andinactive, however, on sunny days, large numbers ofbutterflies leave their clusters and fly to water. Wehypothesize that they must drink periodically tomaintain their water balance. Although butterfliesshaded by the forest cannot bask, at ambienttemperatures greater than 6ºC they can elevate theirthoracic temperature by shivering (Alonso-Meija et al.1993). When ambient temperatures are 1–3º belowflight threshold, shivering butterflies can reach flightthreshold (Masters et al. 1988). On clear days,therefore, between approximately 11:00 and 16:00, thebutterflies clustering at all levels within the forest couldshiver, reach flight threshold, and fly to water orperform other necessary behaviors. Those that bask indirect sunlight could rapidly raise their thoracictemperatures (Masters et al. 1988) and fly either backinto shaded areas or engage in other active behaviors.In contrast, on many cloudy days the butterflies are notable to reach flight threshold and therefore cannot leavethe colony.
Effect of canopy openings on the verticaltemperature profile. Previous experiments havedemonstrated that for butterflies stranded at groundlevel, denser forests provide greater protection againstfreezing than do more open forests (Calvert et al. 1982,1983, 1984; Calvert & Brower 1986; Brower et al. 2004).Comparison of the vertical transects of Tree 1 and Tree2 (Fig. 3A & B) demonstrates that this pattern holdstrue above the forest floor, as well: even a slight openingin the canopy increases the daily temperature range atall heights within the forest. During the dangerous
VOLUME 65, NUMBER 1 43
nighttime period, the temperatures beneath the moreexposed tree were colder at all heights by at least 0.5º(Fig. 7). Furthermore, the variation of the dailytemperature measured at all heights was 0.5º to 4º Cgreater beneath the more open canopy (Fig. 12). Theseslight temperature differences can be critical when theambient temperature beneath the forest canopy dropsbelow –3ºC (Anderson & Brower 1996). More generally,our results are consistent with the findings of Chen et al.(1999), who determined that openings in a Douglas-firforest (Pseudotsuga menziesii [Mirb.] Franco) inWashington impaired the ability of the canopy to bufferthe understory radiant energy exchange.
Implications for lipid conservation. An additionalchallenge that confronts monarchs during theoverwintering season is conserving the lipid reservesupon which they depend for their winter survival andtheir spring migration back into the southern U.S.breeding habitat in late March and early April (Brower etal. 2006). Our vertical temperature data show that thetemperature beneath the forest canopy during thedaytime at all heights and on both clear and cloudy dayswas several degrees cooler than in the nearby open area(Fig. 6). Thus, the forest canopy provides substantialmoderation of temperature extremes that results in thedual benefits of freezing protection during the night andlipid conservation during the day. The uniform verticaltemperature profile during the daytime indicates that thebutterflies' resting height does not affect their lipid use,as long as the butterflies avoid the highest canopy layer.
Future Research. The lowest temperature recordedat a weather station in an oyamel forest area (in the Vallede Mexico) was –11ºC (Madrigal-Sánchez 1967). Thelowest temperatures recorded so far in an open area inthe Sierra Chincua has been –8ºC (Alonso-Meija et al.1992), and inside a colony, where whole branch clustersof wetted monarchs froze in situ, the low was estimatedto have been -4.4ºC (Brower et al. 2004). Measuring thevertical temperature distribution beneath canopiesduring severe cold periods is imperative. We predict thatthe intermediate heights beneath the closed oyamelcanopy remain the safest areas within which to cluster.
Collecting data from additional vertical transects,including relative humidity as well as temperature, andextending the measurements to the tops of the oyamels,would provide a more complete understanding of howthe butterflies respond to the complex verticalmicroclimate. We predict that the microclimate of theexposed upper canopy will resemble that of the openfield area by being exposed to heavy dew and frost and bybeing dangerously colder at night and warmer during theday.
An important variable that we have not addressed is
wind, which can substantially alter the microclimaticprofile in coniferous forests (Raynor 1971; Gustavsson etal. 1998). Based on occasional direct field observations(Brower unpubl.) as well as the aftereffects of theJanuary 2002 storm (Brower et al. 2004), there can belittle doubt that forest thinning increases the negativeimpacts of wind, both on cluster architecture and indisrupting the vertical microclimate profile.
Following the vertical microclimate profile andrelating it to colony architecture from colony formationin November through the winter and into the springmay provide an adaptive explanation of why the coloniesmove down arroyos in February and March (Calvert &Brower 1986). Are the butterflies tracking a shiftingoptimal microclimatic profile as the dry seasonadvances?
On the south side of Cerro Pelon (located in thesouthernmost part of the Reserve, map in Slayback et al.2007), monarchs regularly form colonies in mixed foreststands of oyamel, Mexican cedar (Cupressus lusitanicaMiller, Cupressaceae), and smooth bark Mexican pine(Pinus pseudostrobus Lindl., Pinaceae). In contrast tothe pines and the cedars, the oyamel brancharchitecture allows monarchs to form very large bag-likeclusters that provide them with a temperatureadvantage (Brower et al. 2008b). We predict that thevertical temperature profiles beneath both cedars andpines will be found to provide a suboptimalmicroclimate compared to that beneath oyamels.
Implications for conservation of the oyamelforests. The vertical temperature profiles illustrate thethree-dimensional complexity of the microclimatewithin the oyamel forest and add to an understanding ofthe importance of dense, undisturbed forest inprotecting overwintering monarch butterflies. The factthat the temperature in the transect of the less denseforest was lower at night and had a wider daily range atall heights means that dense forest provides greatertemperature protection during winter cold events.
Observations dating back to 1977 have led us toconclude that the oyamel fir is almost certainly thepreferred tree species on which monarchs cluster (Soto-Nunez & Garcia 1993; Calvert 2004; Brower unpubl.field notes) and has likely been so since pre-historicaltimes. This conclusion is supported by fragmentaryreports of the original forests in this region (e.g.,Leopold 1950). Based on observations made around1938, Loock (1950, p. 32) stated: “between the altitudesof 9,500 and 11,000 feet, there is another clearly markedzone which is occupied by Abies religiosa. Thismagnificent tree occurs in pure stands of dense forest,reaching heights of up to 150 or more feet withdiameters of up to 5 or 6 feet." Such large trees in the
4444 JOURNAL OF THE LEPIDOPTERISTS’ SOCIETY
primordial overwintering forests would have providedadditional temperature buffering against freezing for thebutterflies that clustered on their trunks (Brower et al.2009). While we may never know what the originalclimax oyamel forest was like, it is instructive to considerhow its original forest architecture may have affected thebutterflies' clustering behavior and winter survival. Oneapproach to this question would be to compare andcontrast the three dimensional complexity and the effectsof disturbances in current oyamel forests with those inold growth Douglas-fir forests in the Cascades inWashington (Spies & Franklin 1991; Ishii et al. 2004;Nadkarni et al. 2004; Parker et al. 2004). How might thestructure of such forests, including trees of variableheights and ages and the occurrence of forest gaps, snags,and complex spacing, have provided the microclimate towhich monarch butterflies originally adapted?
If the oyamel forest is the safest overwinteringenvironment, why do the butterflies also cluster on cedarsand pines? The most likely explanation is that themonarchs are returning to overwintering areas that wereformerly oyamel climax forests (Soto-Nunez & Garcia1993). The current mixed forests are almost certainlysuccessional, resulting from repeated logging and break-away forest fires that are ignited to clear land foragriculture (Loock 1950; Leopold 1950; Perry 1991;Snook 1993; Brower & Missrie 1998).
Firmly establishing that oyamels provide the optimaloverwintering microclimate is important for managingboth the core and buffer zones in the Monarch ButterflyBiosphere Reserve. Extensive illegal logging hasoccurred in both zones, and limited logging is allowed inthe buffer zone. Reforestation policy should be based ona scientific assessment of the original stand compositionson the known overwintering massifs. It is possible thatthe best policy within the Reserve is to restore pureoyamel stands at higher elevations and mixedoyamel/pine/cedar forests at lower elevations.
This paper provides evidence that small openings inthe forest canopy cause a lessening in the temperaturebuffering provided by the oyamels at mid-heights of theforest, i.e., those heights at which the butterflies formtheir clusters. The greatest threat to maintaining theseforests as safe overwintering havens is the illegal loggingthat has accelerated in recent years (Ramirez et al. 2003,2005; Anon. 2004, 2008; Brower et al. 2008a, 2009;Honey-Roses 2009a, b). The accumulating microclimaticinformation underscores the necessity of stopping loggingand overwhelmingly supports our assertion that the keyto winter survival of the butterflies is the microclimateprotection provided by the intact coniferous forestcanopy, principally by the oyamel fir.
ACKNOWLEDGEMENTS
We are indebted to Prof. Rudolf Geiger for his pioneeringsyntheses of microclimate. We thank Jennifer Wiley and CarlosCarrillo Tellez for help in setting the vertical transects. We aregrateful to Ing. Concepcion Miguel Martinez, former Directorof the Monarch Butterfly Biosphere Reserve, for facilitating ouraccess to the study area, and to the Arizmendi family for provid-ing accommodations in Angangueo. We are grateful to MyronZalucki and Jenny Williams for critiques of the manuscript andto Zach Dietz for extensive advice on statistical analyses. Sup-port during the 1978–1979 overwintering season was providedby National Science Foundation grant 14265 to Amherst Col-lege with L.P. Brower as principal investigator, and during 2006by NSF grant DEB-0415340 to Sweet Briar College with L.P.Brower and L.S. Fink as principal investigators. We are gratefulfor additional support from the October Hill Foundation, theMonarch Butterfly Sanctuary Foundation, and SCION NaturalScience Association. Ernest Williams was supported by theLeonard C. Ferguson and Christian A. Johnson ProfessorshipFunds at Hamilton College. DGAPA-PAPIIT (IN114707) pro-vided financial support to M. Isabel RamÌrez.
LITERATURE CITED
ALONSO-MEIJA, A., A. ARELLANO-GUILLERMO, & L.P. BROWER. 1992.Influence of temperature, surface body moisture and heightabove ground on survival of monarch butterflies overwintering inMexico. Biotropica 24: 415–419.
ALONSO-MEIJA, A., J.I. GLENDINNING, & L.P. BROWER. 1993. The in-fluence of temperature on crawling, shivering, and flying in over-wintering monarch butterflies in Mexico. In Biology and Conser-vation of the Monarch Butterfly (eds S.B. Malcolm & M.P.Zalucki), pp. 309–314. Los Angeles County Museum of NaturalHistory, Los Angeles.
ANDERSON, J.B. & L.P. BROWER. 1996. Freeze-protection of overwin-tering monarch butterflies in Mexico: Critical role of the forest asa blanket and an umbrella. Ecological Entomology 21: 107–116.
ANON. 2004. La tala ilegal y su impacto en la Reserva de la BiosferaMariposa Monarca. 35 pp. Last accessed 12 October 2009. Avail-able at URL: http://www.wwf.org.mx/wwfmex/descargas/010604_Informe_Tala_Reserva.doc
–––––. 2008. Deforestación y degradación forestal en la Reserva de laBiosfera Mariposa Monarca 2007–2008. World Wildlife FundMexico Report July 2008, pp. 1–3. Last accessed 12 Oct 2009.Available at URL: http://www.wwf.org.mx/wwfmex/descargas/res_ejec_monitoreo_forestal_monarca_2007–2008.pdf
BROWER, L.P. 1977. Monarch migration. Natural History 86: 40–53.–––––. 1995. Understanding and misunderstanding the migration of
the monarch butterfly (Nymphalidae) in North America:1857–1995. Journal of the Lepidopterists' Society, 49, 304–385.
BROWER, L.P., W.H. CALVERT, L.E. HEDRICK, & J. CHRISTIAN. 1977.Biological observations on an overwintering colony of monarchbutterflies (Danaus plexippus L., Danaidae) in Mexico. Journal ofthe Lepidopterists' Society 31: 232–242.
BROWER, L.P., G. CASTILLEJA, A. PERALTA, J. LOPEZ-GARCIA, L. BO-JORQUEZ-TAPIA, S. DIAZ, D. MELGAREJO, & M. MISSRIE. 2002.Quantitative changes in forest quality in a principal overwinteringarea of the monarch butterfly in Mexico: 1971 to 1999. Conserva-tion Biology 16: 346–359.
BROWER, L.P., L.S. FINK, & P. WALFORD. 2006. Fueling the fall migration of the monarch butterfly. Integrative and ComparativeBiology 46: 1123–1142.
BROWER, L.P., D.R. KUST, E. RENDON-SALINAS, E.G. SERRANO, K.R.KUST, J. MILLER, J.C. FERNANDEZ DEL REY, & K. PAPE. 2004.Catastrophic winter storm mortality of monarch butterflies inMexico during January 2002. Pp. 151–166. In K.S. Oberhauserand M.J. Solensky (eds.), The Monarch Butterfly: Biology andConservation. Cornell Univ. Press, Ithaca, NY.
BROWER, L.P., & M. MISSRIE. 1998. Fires in the monarch butterfly

VOLUME 65, NUMBER 1 45
sanctuaries in Mexico, Spring 1998. Que Pasa (Toronto, Canada)3: 9–11.
BROWER, L.P., D. SLAYBACK, & I. RAMIREZ. 2008a. Image of the Day(Deforestation in the Monarch Butterfly Biosphere Reserve inMexico), Vol. 2008. NASA Earth Observatory. Last accessed 12Oct 2009. Available at URL: http://earthobservatory.nasa.gov/IOTD/view.php?id=8506
BROWER, L.P., E.H. WILLIAMS, L.S. FINK, R.R. ZUBIETA, & M.I.RAMIREZ. 2008b. Monarch butterfly clusters provide microcli-matic advantages during the overwintering season in Mexico.Journal of the Lepidopterists’ Society 62: 177–188.
BROWER, L. P., E.H. Williams, D.A. Slayback, L.S. Fink, M.I.Ramirez, R.R. Zubieta, M.I. Limon Garcia, P. Gier, J.A. Lear, &T. van Hook. 2009. Oyamel fir forest trunks provide thermal ad-vantages for overwintering monarch butterflies in Mexico. InsectConservation and Diversity 2: 163–175.
CALVERT, W.H. 2004. Two methods of estimating overwinteringmonarch population size in Mexico. Pp. 121–127. In K.S. Ober-hauser and M.J. Solensky (eds.), The Monarch Butterfly: Biologyand Conservation. Cornell Univ. Press, Ithaca, NY.
CALVERT, W. H., & L.P. BROWER. 1981. The importance of forest coverfor the survival of overwintering monarch butterflies (Danausplexippus, Danaidae). Journal of the Lepidopterists' Society 35:216–225.
–––––. 1986. The location of monarch butterfly (Danaus plexippus L.)overwintering colonies in Mexico in relation to topography andclimate. Journal of the Lepidopterists’ Society 40: 164–187.
CALVERT, W. H. & J.A. COHEN. 1983. The adaptive significance ofcrawling up onto foliage for the survival of grounded overwinter-ing monarch butterflies (Danaus plexippus) in Mexico. EcologicalEntomology 8: 471–474.
CALVERT, W.H., M.B. HYATT, & N.P. MENDOZA-VILLASENOR. 1986.The effects of understory vegetation on the survival of overwin-tering monarch butterflies, (Danaus plexippus L.) in Mexico. ActaZoologica Mexicana (nueva serie) 18: 1–17.
CALVERT, W.H., W. ZUCHOWSKI, & L.P. BROWER. 1982. The impact offorest thinning on microclimate in monarch butterfly (Danausplexippus L.) overwintering areas of Mexico. Boletin de la So-ciedad de la Botanica de Mexico 42: 11–18.
–––––. 1983. The effect of rain, snow, and freezing temperatures onoverwintering monarch butterflies in Mexico. Biotropica 15:42–47.
–––––. 1984. Monarch butterfly conservation: interactions of coldweather, forest thinning and storms on the survival of overwinter-ing monarch butterflies (Danaus plexippus L.) in Mexico. Atala 9:2–6.
CHEN, J., S.C. SAUNDERS, T.R. CROW, R.J. NAIMAN, K.D. BROSOFSKE,G.D. MROZ, B.L. BROOKSHIRE, & J.F. FRANKLIN. 1999. Microcli-mate in forest ecosystems and landscape ecology. Bioscience 49:288–297.
DIGGLE, P.J. 1990. Time Series: A Biostatistical Introduction. Claren-don Press, Oxford, U.K.
DUCHON, C.E., & M.S. O’MALLEY. 1999. Estimating cloud type frompyranometer observations. J of Applied Meteorology 38:132–141.
EARLE, C. 2009. The Gymnosperm Database. Last accessed 7 Sep2009. http://www.conifers.org/index.html
GARCIA, E. 1997. Climatologia de la zona de hibernacion de la mari-posa monarca en La Sierra Transvolcanica de Mexico, invierno1991–1992. Serie Varia 16, Instituto de Geografia, UNAM, Mex-ico. pp.1–26.
GEIGER, R. 1950. The Climate Near the Ground Harvard UniversityPress, Cambridge, Massachusetts.
GEIGER, R., R.H. ARON, & P. TODHUNTER. 2003. The Climate Nearthe Ground, 6th ed. Rowman and Littlefield Publishers, NewYork.
GUSTAVSSON, T., M. KARLSSON, J. BOGREN, & S. LINDQUIST. 1998. De-velopment of temperature pattern during nocturnal cooling. Jour-nal of Applied Meteorology 37: 559–571.
HEIN, J. M. 2006 Lipid content and wing wear of Danaus plexippusreturning to northeastern Wisconsin in June, 1985–2006. Masters
of Science in Teaching, University of Wisconsin Stevens Point,Stevens Point, Wisconsin, pp i–xi +123.
HILL, J.B. 1969. Temperature variability and synoptic cold fronts inthe winter climate of Mexico. Department of Geography Clima-tological Research Series No. 4, McGill University, Montreal,Canada, pp. 1–71.
HONEY-ROSES, J. 2009a. Disentangling the proximate factors of defor-estation: The case of the Monarch Butterfly Biosphere Reserve inMexico. Land Degradation and Development 20: 22–32.
–––––. 2009b. Illegal logging in common property forests. Society andNatural Resources 22: 916–930.
ISHII, H.T., R. VAN PELT, G.G. PARKER, & N.M. NARDKARNI. 2004.Age-related development of canopy structure and its ecologicalfunctions. Pp. 102–117. In M.D. Lowman and H.B. Rinker (eds.),Forest Canopies, 2nd ed. Academic Press, New York.
JAMES, D.G. 1993. Migration biology of monarchs in Australia. Pp.189–200. In S.B. Malcolm and M.P. Zalucki (eds.), Biology andConservation of the Monarch Butterfly. Science Series No. 38,Publications of the Los Angeles County Museum of Natural His-tory, Los Angeles, CA.
LARSEN, K.L., & R.E. LEE, Jr. 1994. Cold tolerance including rapidcold-hardening and inoculative freezing of fall migrant monarchbutterflies in Ohio, Journal of Insect Physiology 40: 859–864.
LAUER, W. 1973. The altitudinal belts of the vegetation in the CentralMexican highlands and their climatic conditions. Arctic andAlpine Research 5: A-99 to A-113.
LEOPOLD, A.S. 1950. Vegetation zones of Mexico. Ecology 31:507–518.
LOOCK, E.E.M. 1950. The Pines of Mexico and British Honduras. L.S.Gray, Government Publication, Department of Forestry, Pretoria,Union of South Africa.
MADRIGAL-SÁNCHEZ, X. 1967. Contribucion al conocimietno de laecología de los bosques de oyamel (Abies religiosa (H.B.K.) Schl.et Cham.) en el Valle de México. Instituto Nacional de Investiga-ciones Forestales Mexico, Boletín Técnico, No. 18. Pp. 94 + 1map.
MANZANILA, H. 1974. Investigaciones Epidométricas y Sílvicolas enBosques Mexicanós de Abies religiosa. Dirección General de In-formación y Relaciones Públicas, Secretaría de Agricultura yGanadería, México, D.F., México. pp. x+165.
MASTERS, A.R., S.B. MALCOLM, & L.P. BROWER. 1988. Monarch but-terfly (Danaus plexippus) thermoregulatory behavior and adapta-tions for overwintering in Mexico. Ecology 69: 458–467.
NADKARNI, N.M., PARKER, G.G., RINKER, H.B., & JARZEN, D.M. 2004.The nature of forest canopies. P. 3–23. In M.D. Lowman andH.B. Rinker (eds.), Forest Canopies, 2nd ed. Academic Press,New York.
ONTARIO WOODLOT ASSOC. 2003. Simple tools for measuring treeheights. Last accessed 28 Oct 2009. URL = www.ontariowood-lot.com/pdf_older/simple_tools_measuring.pdf
PARKER, G.G., M.E. HARMON, M.A. LEFSKY, J. CHEN, R. VAN PELT,S.B. WEISS, S.C. THOMAS, W.E. WINNER, D.C. SHAW, & J.F.FRANKLING. 2004. Three dimensional structure of an old-growthPseudotsuga-Tsuga canopy and its implications for radiation bal-ance, microclimate, and gas exchange. Ecosystems 7: 440–453.
PERRY Jr., J.P. 1991. The Pines of Mexico and Central America. Tim-ber Press, Inc., Portland, Oregon. Pp. 1–231.
RAMIREZ, M.I., J.G. AZCARATE, & L. LUNA. 2003. Effects of human ac-tivities on monarch butterfly habitat in protected mountainforests, Mexico. Forestry Chronicle 79: 242–246.
RAMIREZ-RAMIREZ, M.I., M. JIMENEZ-CRUZ, & A.I. MARTINEZ-PACHECO. 2005. Estructura y densidad de la red de caminos en laReserva de la Biosfera Mariposa Monarca. Inv.Geograficas Bol.57: 68–80.
RAYNOR, G.S. 1971. Wind and temperature structure in a coniferousforest and a contiguous field. Forest Science 17: 351–363.
RZEDOWSKI, J. 1978. Vegetación de México. Editorial Limusa, Mexico,D.F. pp. 1–432.
SLAYBACK, D.A. & L.P. BROWER. 2007. Further aerial surveys confirmthe extreme localization of overwintering monarch butterfly
4646 JOURNAL OF THE LEPIDOPTERISTS’ SOCIETY
colonies in Mexico American Entomologist 53: 146–149.SLAYBACK, D.A., L.P. BROWER, M.I. RAMIREZ, & L.S. FINK. 2007. Es-
tablishing the presence and absence of overwintering colonies ofthe monarch butterfly in Mexico by the use of small aircraft.American Entomologist 53: 28–39 and cover photograph.
SNOOK, L.C. 1993. Conservation of the monarch butterfly reserves inMexico: focus on the forest. Pp. 363–375. In S.B. Malcolm &M.P. Zalucki (eds.), Biology and Conservation of the MonarchButterfly. Natural History Museum of Los Angeles County, LosAngeles.
SOTO-NÚÑEZ, J.C.S., & L.V. VAZQUEZ-GARCÍA. 1993. Vegetation typesof monarch butterfly overwintering habitat in Mexico. Pp.287–293. In S.B. Malcolm & M.P. Zalucki (eds.), Biology andConservation of the Monarch Butterfly. Natural History Museumof Los Angeles County, Los Angeles.
SPIES, T.A. & J.F. FRANKLIN. 1991. The structure of natural young,mature and old-growth Douglas-fir forests in Oregon and Wash-ington. Pp. 533–544. In L.F. Ruggiero, K.B. Aubry, & M.H.Brooks (eds.), Wildlife and vegetation of unmanaged Douglas-Fir
Forests. U.S. Department of Agriculture, Forest Service, PacificNorthwest Research Station, Portland.
SPSS. 2008. Statistics 16.0. SPSS, Inc., Chicago, IL.URQUHART, F.A., & N.R. URQUHART. 1976. The overwintering site of
the eastern population of the monarch butterfly (Danaus p. plex-ippus; Danaidae) in southern Mexico. Journal of the Lepidopter-ists' Society 30: 153–158.
WACHOB, D.G. 1996a. A microclimate analysis of nest-site selection byMountain Chickadees. Journal of Field Ornithology 67: 525–533.
–––––. 1996b. The effect of thermal microclimate on foraging site se-lection by wintering Mountain Chickadees. Condor 98: 114–122.
WALSH, B. 2004. Multiple comparisons: Bonferroni corrections andfalse discovery rates. Last accessed 11 Nov 2009. Available atURL: http://nitro.biosci.arizona.edu/workshops/Aarhus2006/pdfs/Multiple.pdf
Received for publication 5 January 2010; revised and accepted 28May 2010.