
BrO/SO molar ratios from scanning DOAS · PDF file410 P. Lübcke et al.: BrO/SO2 from the...
16
Solid Earth, 5, 409–424, 2014 www.solid-earth.net/5/409/2014/ doi:10.5194/se-5-409-2014 © Author(s) 2014. CC Attribution 3.0 License. BrO / SO 2 molar ratios from scanning DOAS measurements in the NOVAC network P. Lübcke 1,2 , N. Bobrowski 1 , S. Arellano 3 , B. Galle 3 , G. Garzón 4 , L. Vogel 1,* , and U. Platt 1 1 Institute of Environmental Physics, University of Heidelberg, Heidelberg, Germany 2 Max Planck Institute for Chemistry, Mainz, Germany 3 Department of Earth and Space Sciences, Chalmers University of Technology, Gothenburg, Sweden 4 FISQUIM Research Group, Laboratory Division, Colombian Geological Survey, Cali, Colombia * now at: Earth Observation Science Group, Space Research Centre, Department of Physics and Astronomy, University of Leicester, Leicester, UK Correspondence to: P. Lübcke ([email protected]) Received: 30 September 2013 – Published in Solid Earth Discuss.: 5 November 2013 Revised: 25 March 2014 – Accepted: 31 March 2014 – Published: 4 June 2014 Abstract. The molar ratio of BrO to SO 2 is, like other halo- gen / sulfur ratios, a possible precursor for dynamic changes in the shallow part of a volcanic system. While the predictive significance of the BrO / SO 2 ratio has not been well con- strained yet, it has the major advantage that this ratio can be readily measured using the remote-sensing technique dif- ferential optical absorption spectroscopy (DOAS) in the UV. While BrO / SO 2 ratios have been measured during several short-term field campaigns, this article presents an algorithm that can be used to obtain long-term time series of BrO / SO 2 ratios from the scanning DOAS instruments of the Network for Observation of Volcanic and Atmospheric Change (NO- VAC) or comparable networks. Parameters of the DOAS re- trieval of both trace gases are given. The influence of co- adding spectra on the retrieval error and influences of radia- tive transfer will be investigated. Difficulties in the evalu- ation of spectroscopic data from monitoring instruments in volcanic environments and possible solutions are discussed. The new algorithm is demonstrated by evaluating data from the NOVAC scanning DOAS systems at Nevado del Ruiz, Colombia, encompassing almost 4 years of measurements between November 2009 and end of June 2013. This data set shows variations of the BrO / SO 2 ratio several weeks prior to the eruption on 30 June 2012. 1 Introduction The molar ratio of halogen (mainly HCl, HF) to sul- fur species (mainly SO 2 ) in volcanic plumes has long been known as a possible tracer for volcanic activity (e.g. Noguchi and Kamiya, 1963; Menyailov, 1975; Pennisi and Le Cloarec, 1998). This is due to the different solubility of volatiles in magma (e.g. Carroll and Holloway, 1994) and its dependence on pressure. As a consequence, different gaseous species are exsolved in equilibrium at different mag- mastatic pressures, i.e. at different depths in the magma col- umn. The most commonly used example of halogen / sulfur ratios has been the measurement of the HCl/SO 2 molar ratio (e.g. Noguchi and Kamiya, 1963). Another halogen species is BrO, which has now been detected at several volcanoes (e.g. Bobrowski et al., 2003; Bobrowski and Platt, 2007; Boichu et al., 2011; Kelly et al., 2012; Hörmann, 2013) and whose abundance was suggested as an additional indicator for changes in volcanic activity (Bobrowski and Giuffrida, 2012). One major advantage of measuring the BrO / SO 2 mo- lar ratio is that both species can be detected in a single spec- troscopic remote sensing measurement using differential op- tical absorption spectroscopy (DOAS) in the UV (Platt and Stutz, 2008), which is a rather simple-to-implement and sen- sitive technique. Scanning DOAS has become the most widespread method for measuring the emission rate of volcanic SO 2 (e.g. Galle et al., 2003). In particular, within the framework of the EU project NOVAC (Network for Observation of Volcanic and Published by Copernicus Publications on behalf of the European Geosciences Union.
Transcript of BrO/SO molar ratios from scanning DOAS · PDF file410 P. Lübcke et al.: BrO/SO2 from the...

Solid Earth, 5, 409–424, 2014www.solid-earth.net/5/409/2014/doi:10.5194/se-5-409-2014© Author(s) 2014. CC Attribution 3.0 License.
BrO / SO2 molar ratios from scanning DOAS measurements in theNOVAC networkP. Lübcke1,2, N. Bobrowski1, S. Arellano3, B. Galle3, G. Garzón4, L. Vogel1,*, and U. Platt1
1Institute of Environmental Physics, University of Heidelberg, Heidelberg, Germany2Max Planck Institute for Chemistry, Mainz, Germany3Department of Earth and Space Sciences, Chalmers University of Technology, Gothenburg, Sweden4FISQUIM Research Group, Laboratory Division, Colombian Geological Survey, Cali, Colombia* now at: Earth Observation Science Group, Space Research Centre, Department of Physics and Astronomy, University ofLeicester, Leicester, UK
Correspondence to:P. Lübcke ([email protected])
Received: 30 September 2013 – Published in Solid Earth Discuss.: 5 November 2013Revised: 25 March 2014 – Accepted: 31 March 2014 – Published: 4 June 2014
Abstract. The molar ratio of BrO to SO2 is, like other halo-gen / sulfur ratios, a possible precursor for dynamic changesin the shallow part of a volcanic system. While the predictivesignificance of the BrO / SO2 ratio has not been well con-strained yet, it has the major advantage that this ratio canbe readily measured using the remote-sensing technique dif-ferential optical absorption spectroscopy (DOAS) in the UV.While BrO / SO2 ratios have been measured during severalshort-term field campaigns, this article presents an algorithmthat can be used to obtain long-term time series of BrO / SO2ratios from the scanning DOAS instruments of the Networkfor Observation of Volcanic and Atmospheric Change (NO-VAC) or comparable networks. Parameters of the DOAS re-trieval of both trace gases are given. The influence of co-adding spectra on the retrieval error and influences of radia-tive transfer will be investigated. Difficulties in the evalu-ation of spectroscopic data from monitoring instruments involcanic environments and possible solutions are discussed.The new algorithm is demonstrated by evaluating data fromthe NOVAC scanning DOAS systems at Nevado del Ruiz,Colombia, encompassing almost 4 years of measurementsbetween November 2009 and end of June 2013. This data setshows variations of the BrO / SO2 ratio several weeks priorto the eruption on 30 June 2012.
1 Introduction
The molar ratio of halogen (mainly HCl, HF) to sul-fur species (mainly SO2) in volcanic plumes has longbeen known as a possible tracer for volcanic activity (e.g.Noguchi and Kamiya, 1963; Menyailov, 1975; Pennisi andLe Cloarec, 1998). This is due to the different solubilityof volatiles in magma (e.g. Carroll and Holloway, 1994)and its dependence on pressure. As a consequence, differentgaseous species are exsolved in equilibrium at different mag-mastatic pressures, i.e. at different depths in the magma col-umn. The most commonly used example of halogen / sulfurratios has been the measurement of the HCl/SO2 molar ratio(e.g. Noguchi and Kamiya, 1963). Another halogen speciesis BrO, which has now been detected at several volcanoes(e.g. Bobrowski et al., 2003; Bobrowski and Platt, 2007;Boichu et al., 2011; Kelly et al., 2012; Hörmann, 2013) andwhose abundance was suggested as an additional indicatorfor changes in volcanic activity (Bobrowski and Giuffrida,2012). One major advantage of measuring the BrO / SO2 mo-lar ratio is that both species can be detected in a single spec-troscopic remote sensing measurement using differential op-tical absorption spectroscopy (DOAS) in the UV (Platt andStutz, 2008), which is a rather simple-to-implement and sen-sitive technique.
Scanning DOAS has become the most widespread methodfor measuring the emission rate of volcanic SO2 (e.g. Galleet al., 2003). In particular, within the framework of the EUproject NOVAC (Network for Observation of Volcanic and
Published by Copernicus Publications on behalf of the European Geosciences Union.
410 P. Lübcke et al.: BrO / SO2 from the NOVAC network
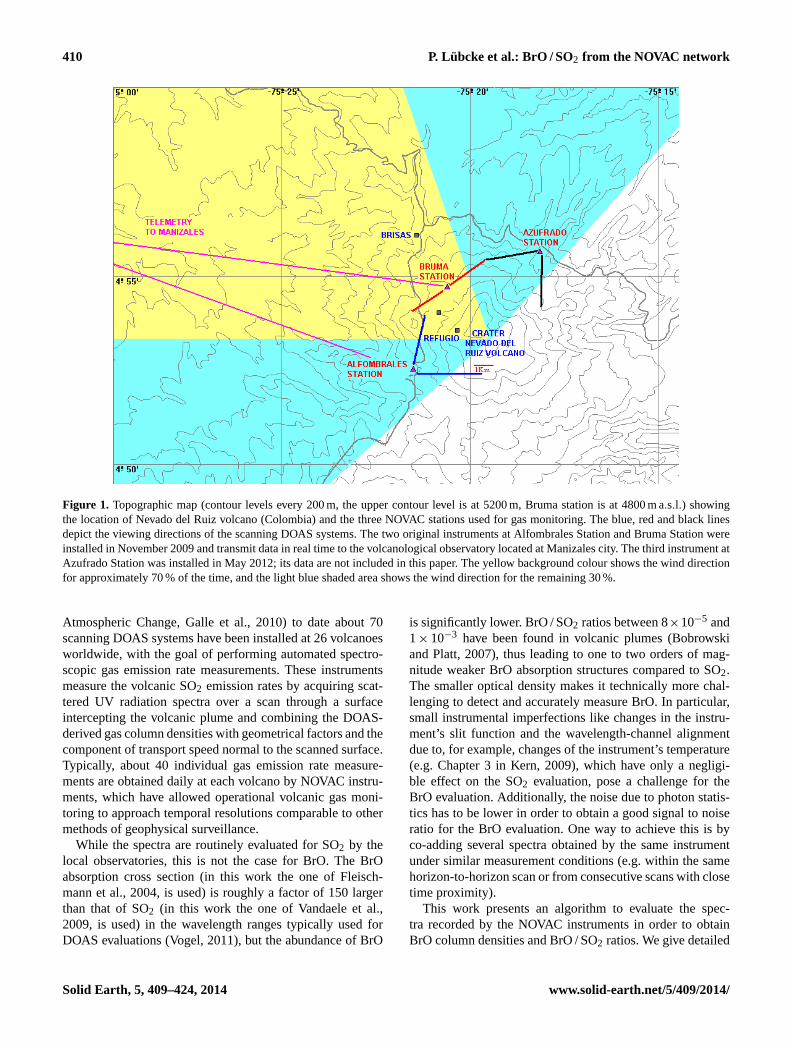
Figure 1. Topographic map (contour levels every 200 m, the upper contour level is at 5200 m, Bruma station is at 4800 m a.s.l.) showingthe location of Nevado del Ruiz volcano (Colombia) and the three NOVAC stations used for gas monitoring. The blue, red and black linesdepict the viewing directions of the scanning DOAS systems. The two original instruments at Alfombrales Station and Bruma Station wereinstalled in November 2009 and transmit data in real time to the volcanological observatory located at Manizales city. The third instrument atAzufrado Station was installed in May 2012; its data are not included in this paper. The yellow background colour shows the wind directionfor approximately 70 % of the time, and the light blue shaded area shows the wind direction for the remaining 30 %.
Atmospheric Change, Galle et al., 2010) to date about 70scanning DOAS systems have been installed at 26 volcanoesworldwide, with the goal of performing automated spectro-scopic gas emission rate measurements. These instrumentsmeasure the volcanic SO2 emission rates by acquiring scat-tered UV radiation spectra over a scan through a surfaceintercepting the volcanic plume and combining the DOAS-derived gas column densities with geometrical factors and thecomponent of transport speed normal to the scanned surface.Typically, about 40 individual gas emission rate measure-ments are obtained daily at each volcano by NOVAC instru-ments, which have allowed operational volcanic gas moni-toring to approach temporal resolutions comparable to othermethods of geophysical surveillance.
While the spectra are routinely evaluated for SO2 by thelocal observatories, this is not the case for BrO. The BrOabsorption cross section (in this work the one of Fleisch-mann et al., 2004, is used) is roughly a factor of 150 largerthan that of SO2 (in this work the one of Vandaele et al.,2009, is used) in the wavelength ranges typically used forDOAS evaluations (Vogel, 2011), but the abundance of BrO
is significantly lower. BrO / SO2 ratios between 8×10⁻⁵ and1× 10−3 have been found in volcanic plumes (Bobrowskiand Platt, 2007), thus leading to one to two orders of mag-nitude weaker BrO absorption structures compared to SO2.The smaller optical density makes it technically more chal-lenging to detect and accurately measure BrO. In particular,small instrumental imperfections like changes in the instru-ment’s slit function and the wavelength-channel alignmentdue to, for example, changes of the instrument’s temperature(e.g. Chapter 3 in Kern, 2009), which have only a negligi-ble effect on the SO2 evaluation, pose a challenge for theBrO evaluation. Additionally, the noise due to photon statis-tics has to be lower in order to obtain a good signal to noiseratio for the BrO evaluation. One way to achieve this is byco-adding several spectra obtained by the same instrumentunder similar measurement conditions (e.g. within the samehorizon-to-horizon scan or from consecutive scans with closetime proximity).
This work presents an algorithm to evaluate the spec-tra recorded by the NOVAC instruments in order to obtainBrO column densities and BrO / SO2 ratios. We give detailed
Solid Earth, 5, 409–424, 2014 www.solid-earth.net/5/409/2014/
P. Lübcke et al.: BrO / SO2 from the NOVAC network 411
−50 0 50
0
1
2
3
4
5x 10
18
Viewing Angle from Zenith [°]
SO2 C
olum
n D
ensi
ty [m
olec
/cm
2]
SO
2
Plume RegionReference Region
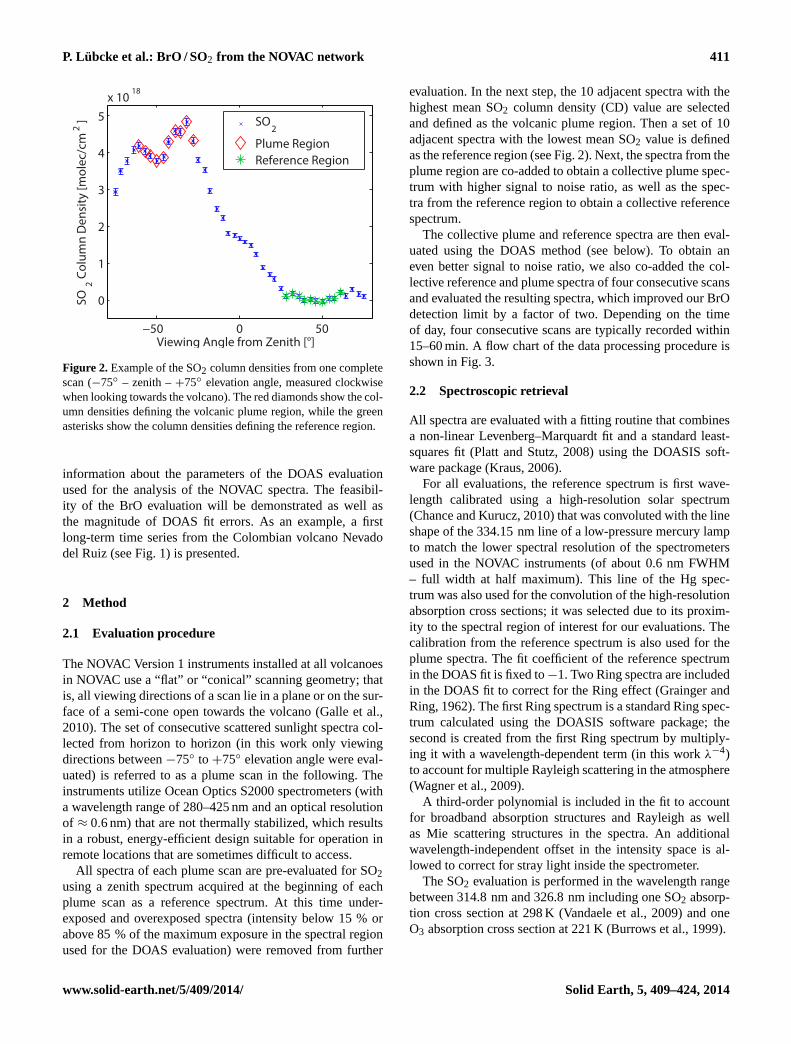
Figure 2. Example of the SO2 column densities from one completescan (−75◦ – zenith –+75◦ elevation angle, measured clockwisewhen looking towards the volcano). The red diamonds show the col-umn densities defining the volcanic plume region, while the greenasterisks show the column densities defining the reference region.
information about the parameters of the DOAS evaluationused for the analysis of the NOVAC spectra. The feasibil-ity of the BrO evaluation will be demonstrated as well asthe magnitude of DOAS fit errors. As an example, a firstlong-term time series from the Colombian volcano Nevadodel Ruiz (see Fig. 1) is presented.
2 Method
2.1 Evaluation procedure
The NOVAC Version 1 instruments installed at all volcanoesin NOVAC use a “flat” or “conical” scanning geometry; thatis, all viewing directions of a scan lie in a plane or on the sur-face of a semi-cone open towards the volcano (Galle et al.,2010). The set of consecutive scattered sunlight spectra col-lected from horizon to horizon (in this work only viewingdirections between−75◦ to +75◦ elevation angle were eval-uated) is referred to as a plume scan in the following. Theinstruments utilize Ocean Optics S2000 spectrometers (witha wavelength range of 280–425 nm and an optical resolutionof ≈ 0.6 nm) that are not thermally stabilized, which resultsin a robust, energy-efficient design suitable for operation inremote locations that are sometimes difficult to access.
All spectra of each plume scan are pre-evaluated for SO2using a zenith spectrum acquired at the beginning of eachplume scan as a reference spectrum. At this time under-exposed and overexposed spectra (intensity below 15 % orabove 85 % of the maximum exposure in the spectral regionused for the DOAS evaluation) were removed from further
evaluation. In the next step, the 10 adjacent spectra with thehighest mean SO2 column density (CD) value are selectedand defined as the volcanic plume region. Then a set of 10adjacent spectra with the lowest mean SO2 value is definedas the reference region (see Fig. 2). Next, the spectra from theplume region are co-added to obtain a collective plume spec-trum with higher signal to noise ratio, as well as the spec-tra from the reference region to obtain a collective referencespectrum.
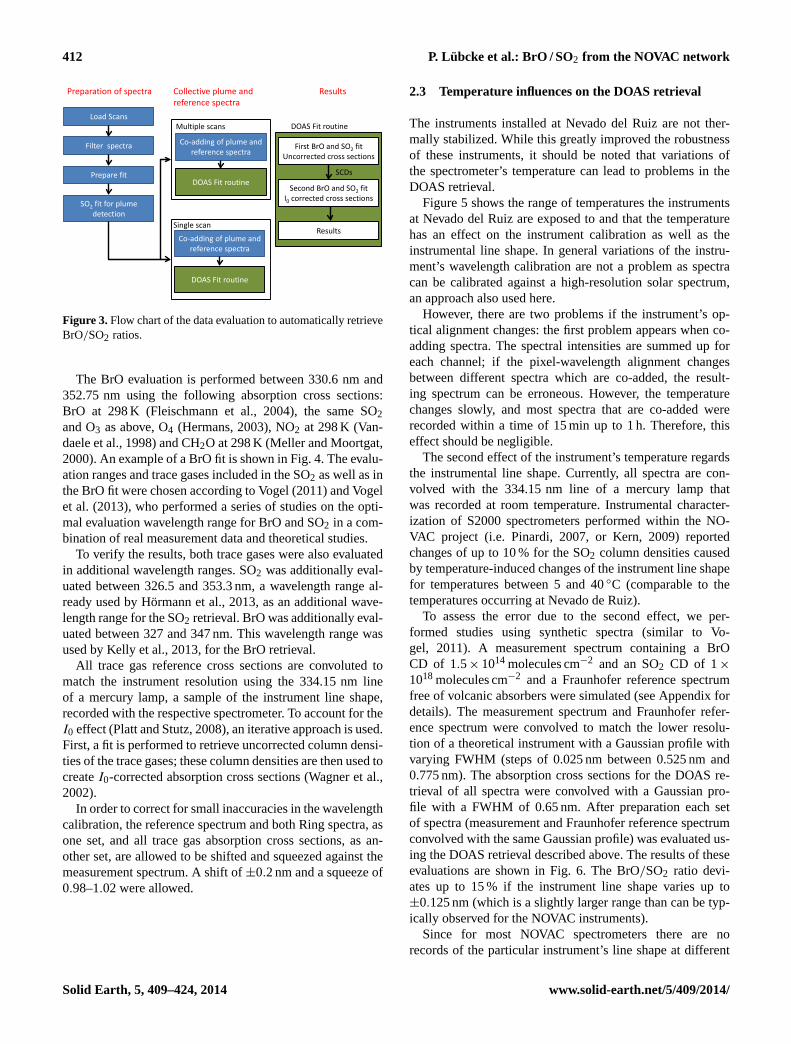
The collective plume and reference spectra are then eval-uated using the DOAS method (see below). To obtain aneven better signal to noise ratio, we also co-added the col-lective reference and plume spectra of four consecutive scansand evaluated the resulting spectra, which improved our BrOdetection limit by a factor of two. Depending on the timeof day, four consecutive scans are typically recorded within15–60 min. A flow chart of the data processing procedure isshown in Fig.3.
2.2 Spectroscopic retrieval
All spectra are evaluated with a fitting routine that combinesa non-linear Levenberg–Marquardt fit and a standard least-squares fit (Platt and Stutz, 2008) using the DOASIS soft-ware package (Kraus, 2006).
For all evaluations, the reference spectrum is first wave-length calibrated using a high-resolution solar spectrum(Chance and Kurucz, 2010) that was convoluted with the lineshape of the 334.15 nm line of a low-pressure mercury lampto match the lower spectral resolution of the spectrometersused in the NOVAC instruments (of about 0.6 nm FWHM– full width at half maximum). This line of the Hg spec-trum was also used for the convolution of the high-resolutionabsorption cross sections; it was selected due to its proxim-ity to the spectral region of interest for our evaluations. Thecalibration from the reference spectrum is also used for theplume spectra. The fit coefficient of the reference spectrumin the DOAS fit is fixed to−1. Two Ring spectra are includedin the DOAS fit to correct for the Ring effect (Grainger andRing, 1962). The first Ring spectrum is a standard Ring spec-trum calculated using the DOASIS software package; thesecond is created from the first Ring spectrum by multiply-ing it with a wavelength-dependent term (in this workλ−4)to account for multiple Rayleigh scattering in the atmosphere(Wagner et al., 2009).
A third-order polynomial is included in the fit to accountfor broadband absorption structures and Rayleigh as wellas Mie scattering structures in the spectra. An additionalwavelength-independent offset in the intensity space is al-lowed to correct for stray light inside the spectrometer.
The SO2 evaluation is performed in the wavelength rangebetween 314.8 nm and 326.8 nm including one SO2 absorp-tion cross section at 298 K (Vandaele et al., 2009) and oneO3 absorption cross section at 221 K (Burrows et al., 1999).
www.solid-earth.net/5/409/2014/ Solid Earth, 5, 409–424, 2014
412 P. Lübcke et al.: BrO / SO2 from the NOVAC network
Load Scans
Filter spectra
Prepare fit
SO2 fit for plume detection
First BrO and SO2 fit Uncorrected cross sections
Second BrO and SO2 fit I0 corrected cross sections
SCDs
Results
DOAS Fit routine
Co-adding of plume and reference spectra
Co-adding of plume and reference spectra
Single scan
Multiple scans
DOAS Fit routine
DOAS Fit routine
Preparation of spectra Collective plume and reference spectra
Results
Figure 3.Flow chart of the data evaluation to automatically retrieveBrO/SO2 ratios.
The BrO evaluation is performed between 330.6 nm and352.75 nm using the following absorption cross sections:BrO at 298 K (Fleischmann et al., 2004), the same SO2and O3 as above, O4 (Hermans, 2003), NO2 at 298 K (Van-daele et al., 1998) and CH2O at 298 K (Meller and Moortgat,2000). An example of a BrO fit is shown in Fig. 4. The evalu-ation ranges and trace gases included in the SO2 as well as inthe BrO fit were chosen according to Vogel (2011) and Vogelet al. (2013), who performed a series of studies on the opti-mal evaluation wavelength range for BrO and SO2 in a com-bination of real measurement data and theoretical studies.
To verify the results, both trace gases were also evaluatedin additional wavelength ranges. SO2 was additionally eval-uated between 326.5 and 353.3 nm, a wavelength range al-ready used by Hörmann et al., 2013, as an additional wave-length range for the SO2 retrieval. BrO was additionally eval-uated between 327 and 347 nm. This wavelength range wasused by Kelly et al., 2013, for the BrO retrieval.
All trace gas reference cross sections are convoluted tomatch the instrument resolution using the 334.15 nm lineof a mercury lamp, a sample of the instrument line shape,recorded with the respective spectrometer. To account for theI0 effect (Platt and Stutz, 2008), an iterative approach is used.First, a fit is performed to retrieve uncorrected column densi-ties of the trace gases; these column densities are then used tocreateI0-corrected absorption cross sections (Wagner et al.,2002).
In order to correct for small inaccuracies in the wavelengthcalibration, the reference spectrum and both Ring spectra, asone set, and all trace gas absorption cross sections, as an-other set, are allowed to be shifted and squeezed against themeasurement spectrum. A shift of±0.2 nm and a squeeze of0.98–1.02 were allowed.
2.3 Temperature influences on the DOAS retrieval
The instruments installed at Nevado del Ruiz are not ther-mally stabilized. While this greatly improved the robustnessof these instruments, it should be noted that variations ofthe spectrometer’s temperature can lead to problems in theDOAS retrieval.
Figure5 shows the range of temperatures the instrumentsat Nevado del Ruiz are exposed to and that the temperaturehas an effect on the instrument calibration as well as theinstrumental line shape. In general variations of the instru-ment’s wavelength calibration are not a problem as spectracan be calibrated against a high-resolution solar spectrum,an approach also used here.
However, there are two problems if the instrument’s op-tical alignment changes: the first problem appears when co-adding spectra. The spectral intensities are summed up foreach channel; if the pixel-wavelength alignment changesbetween different spectra which are co-added, the result-ing spectrum can be erroneous. However, the temperaturechanges slowly, and most spectra that are co-added wererecorded within a time of 15 min up to 1 h. Therefore, thiseffect should be negligible.
The second effect of the instrument’s temperature regardsthe instrumental line shape. Currently, all spectra are con-volved with the 334.15 nm line of a mercury lamp thatwas recorded at room temperature. Instrumental character-ization of S2000 spectrometers performed within the NO-VAC project (i.e. Pinardi, 2007, or Kern, 2009) reportedchanges of up to 10 % for the SO2 column densities causedby temperature-induced changes of the instrument line shapefor temperatures between 5 and 40◦C (comparable to thetemperatures occurring at Nevado de Ruiz).
To assess the error due to the second effect, we per-formed studies using synthetic spectra (similar to Vo-gel, 2011). A measurement spectrum containing a BrOCD of 1.5× 10¹⁴ molecules cm−2 and an SO2 CD of 1×
1018 molecules cm−2 and a Fraunhofer reference spectrumfree of volcanic absorbers were simulated (see Appendix fordetails). The measurement spectrum and Fraunhofer refer-ence spectrum were convolved to match the lower resolu-tion of a theoretical instrument with a Gaussian profile withvarying FWHM (steps of 0.025 nm between 0.525 nm and0.775 nm). The absorption cross sections for the DOAS re-trieval of all spectra were convolved with a Gaussian pro-file with a FWHM of 0.65 nm. After preparation each setof spectra (measurement and Fraunhofer reference spectrumconvolved with the same Gaussian profile) was evaluated us-ing the DOAS retrieval described above. The results of theseevaluations are shown in Fig.6. The BrO/SO2 ratio devi-ates up to 15 % if the instrument line shape varies up to±0.125 nm (which is a slightly larger range than can be typ-ically observed for the NOVAC instruments).
Since for most NOVAC spectrometers there are norecords of the particular instrument’s line shape at different
Solid Earth, 5, 409–424, 2014 www.solid-earth.net/5/409/2014/

P. Lübcke et al.: BrO / SO2 from the NOVAC network 413
332 334 336 338 340 342 344 346 348 350 35212.6
12.8
13
13.2
13.4
Fit result
Wavelength [nm]
Inte
nsity
[log
]
332 334 336 338 340 342 344 346 348 350 352
−1
0
1
x 10−3
Residual
Wavelength [nm]
Inte
nsity
[log
]
332 334 336 338 340 342 344 346 348 350 352
−0.4
−0.38
−0.36
Polynomial
Wavelength [nm]
Inte
nsity
[log
]
332 334 336 338 340 342 344 346 348 350 3524.86
4.88
4.9
4.92
O�set Constant
Wavelength [nm]
Inte
nsity
[log
]
332 334 336 338 340 342 344 346 348 350 35213
13.2
13.4
13.6
13.8Reference spectrum
Wavelength [nm]
Inte
nsity
[log
]
332 334 336 338 340 342 344 346 348 350 352
−20
−10
0
x 10−4
Ring spectrum
Wavelength [nm]
Inte
nsity
[log
]
332 334 336 338 340 342 344 346 348 350 352−4
−2
0
x 10−3
BrO
Wavelength [nm]
Inte
nsity
[log
]
332 334 336 338 340 342 344 346 348 350 352
−15
−10
−5
0
x 10−3 SO
2
Wavelength [nm]
Inte
nsity
[log
]
332 334 336 338 340 342 344 346 348 350 352
−1
0
1
x 10−3 O
4
Wavelength [nm]
Inte
nsity
[log
]
332 334 336 338 340 342 344 346 348 350 352
−1
0
1
2x 10
−3 O3
(271K)
Wavelength [nm]
Inte
nsity
[log
]
332 334 336 338 340 342 344 346 348 350 352−2
−1
0
1
x 10−3 NO
2
Wavelength [nm]
Inte
nsity
[log
]
332 334 336 338 340 342 344 346 348 350 352
−1
0
1
x 10−3 CH
2O
Wavelength [nm]
Inte
nsity
[log
]
332 334 336 338 340 342 344 346 348 350 352−10
−5
0
5
x 10−3
Ring spectrum x λ4
Wavelength [nm]
Inte
nsity
[log
]
c = 7.38E+18 ± 5.10E+17c = 2.51E+14 ± 1.40E+13
Figure 4. Example of a DOAS BrO evaluation performed in the wavelength range of 330.6–352.75 nm. The red lines show the fit, theblue lines the measurement data. A reference spectrum and two Ring spectra were included in the DOAS fit. The BrO column density is2.51× 1014molecules cm−2. Besides BrO, other trace gases (SO2, O4, O3, NO2, and CH2O) were included in the DOAS evaluation. Thespectra recorded for this example were recorded on 31 October 2012 between 16:32 and 17:05 GMT.
temperatures available, one possible way to further improvedata quality would be to determine the instrument line shapefrom a comparison between the high-resolution solar refer-ence spectrum and measurement spectra at different temper-atures.
2.4 Radiative transfer modelling
The distance between the instrument and the volcanic plumeand clouds can both influence the retrieved trace gas CDs.To assess the order of magnitude of errors due to these in-fluences, we performed calculations using the 3-D radiativetransfer model McArtim (Deutschmann, 2011). The SO2 andBrO CDs were approximated by simulations at the centreof the wavelength interval used for the DOAS evaluation(320 nm for SO2 and 340 nm for BrO).
A volcanic plume with a circular cross-section shape withdiameter 1 km in thex − z plane was simulated. The plumecentred at 6 km altitude and was assumed to be infinitelyextended in they direction (see Fig.7). Typical profilesof the trace gases O3, O4 and NO2 and a Rayleigh atmo-sphere were used to account for non-volcanic absorbers andscattering. Trace-gas concentrations of SO2 and BrO wereset to 1× 10¹³ molecules cm−3 and 1× 10⁹ molecules cm−3
respectively, inside the volcanic plume. This leads to col-umn densities of 1× 10¹⁸ molecules cm−2 for SO2 and 1×10¹⁴ molecules cm−2 for BrO, assuming the light path is
Figure 5. Shift and squeeze for a DOAS fit only containing onereference spectrum with an instrument temperature of 15◦C. Forthis plot half a year of data were evaluated. It can be clearly seenthat the instrument pixel-to-wavelength alignment is influenced bychanges in the ambient temperature.
a straight line through the plume centre. The resultingBrO/SO2 ratio is 1.0×10⁻⁴. The instrument was placed be-low the plume at a height of 4.5 km, and the viewing direc-tion was always directed towards the centre of the volcanicplume. The influence of an increasing distance between in-strument and plume has been investigated by varying the lat-eral distance between 0 km and 6.5 km.
In order to investigate the influence of clouds, we simu-lated clouds in different heights. Three different cloud lay-ers with heights between 5.5 and 6.5 km (the height of the
www.solid-earth.net/5/409/2014/ Solid Earth, 5, 409–424, 2014

414 P. Lübcke et al.: BrO / SO2 from the NOVAC network
0.55 0.6 0.65 0.7 0.750.94
0.96
0.98
1
1.02
1.04
1.06
1.08
FWHM of Spectra [nm]
Rela
tive
BrO
/SO
2
Figure 6. Deviation of the BrO/SO2 ratio for varying syntheticspectra with different optical resolution. All spectra were evaluatedusing absorption cross sections that were convolved with a Gaussianprofile with a FWHM of 0.65 nm.
volcanic plume, CS I), 5 and 5.5 km (a cloud layer betweenthe volcanic plume and the instrument, CS 2) and 6.5 and7 km (a cloud layer above the instrument, CS 3) were simu-lated. Aerosol with an Ångström exponent of 1, a single scat-tering albedo of 1 and an asymmetry parameterg = 0.85 wasused in simulating the cloud (see, e.g. Wagner et al., 2013).Two different aerosol extinction coefficients were simulatedto assess variations of the cloud optical depth. The aerosolextinction coefficient was chosen so that the aerosol opticaldepth for an upward looking instrument was 4.25 and 4 or12.75 and 12 at 320 and 340 nm, respectively. Additionallyas a fourth scenario an enhanced aerosol abundance coin-ciding with the volcanic plume was simulated. For all cloudsimulations only two geometries – an instrument below thevolcanic plume with an upward-looking telescope (elevationangle 90◦), and an instrument at a lateral distance of 1.5 kmwith an elevation angle of 45◦ – were simulated.
3 Results from Nevado del Ruiz
Nevado del Ruiz is a 5400 m high stratovolcano located inthe Andes in Colombia, approximately 130 km west of Bo-gotá. Nevado del Ruiz became infamous in 1985, when onthe 13 November approximately 23 000 people were killedby lahars in the aftermath of an eruption. A map showingthe location of Nevado del Ruiz and the original two NO-VAC instruments whose data are used in this work and theirscanning directions are given in Fig. 1.
3.1 Spectroscopy results
Scans between November 2009 and the end of June 2013were evaluated for two instruments at Nevado del Ruiz,Colombia. Figure8 shows the number distribution of the BrODOAS retrieval errors for both instruments (with identifica-
5000 m
6000 m
7000 m
I
II
III
plume
upward!geometry45° elevation
IV
x-axis
z-axis
Figure 7. Sketch of the simulated geometries for the McArtim sim-ulations. A round plume with a diameter of 1 km was simulated withthe instrument either directly below the volcanic plume or at a hor-izontal distance. The hatched areas indicate the three different re-gions in which clouds were simulated. The fourth scenario assumesthe absence of clouds but a homogeneous aerosol enhancement in-side the volcanic plume (round grey area).
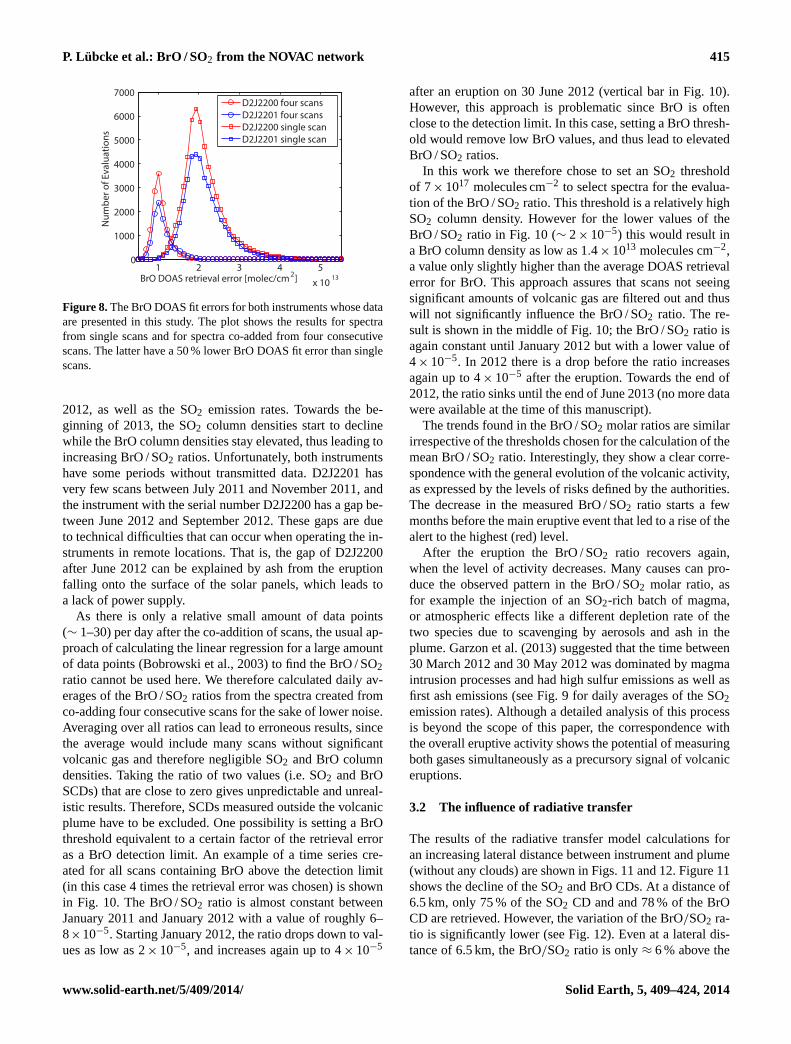
tion numbers D2J2200 for Bruma and D2J2201 for Alfom-brales; see Fig. 1). The fit error is shown for the evaluation ofspectra from individual scans as well as for spectra resultingfrom co-adding four consecutive scans. The DOAS fit errorsfor the two instruments are essentially equal. For a singlescan the fit error is centred around 2×10¹³ molecules cm−2;for the co-added spectra the fit error is centred around 1×
1013 molecules cm−2. That is, averaging four scans reducesto half the fit error, which indicates that the evaluation is stilllimited by photon shot noise.
Adding up spectra from different scans is always a trade-off between gaining in signal to noise and losing in abso-lute signal (for some spectra) and time resolution of the re-trieved slant column densities (SCDs). An additional prob-lem may be caused by a drifting spectral instrument responsedue to changes of the instrument temperature, which wouldcompromise the accuracy of the results when summing upspectra. The variability of the instrument slit function andthe wavelength-channel alignment with changing instrumenttemperature for the spectrometers used in this study is shownin Fig. 5. For this example, one zenith looking spectrum wasfitted to spectra from half a year of data with a fit range cov-ering the SO2 and the BrO evaluation range. Figure5 shows,as one example, the shift and squeeze of the reference spec-trum, which both clearly vary with changes of the ambienttemperature.
However, as the signal to noise ratio for four consecutivescans is still close to the ideal photon statistics limited case,the approach to add up spectra from four consecutive scans isthought to not be influenced by these temperature issues andis used in the rest of this manuscript.
SO2 and BrO column density time series and the SO2emission rates are shown in Fig.9. Both the SO2 and theBrO column densities start to increase at the beginning of
Solid Earth, 5, 409–424, 2014 www.solid-earth.net/5/409/2014/
P. Lübcke et al.: BrO / SO2 from the NOVAC network 415
1 2 3 4 5
x 1013
0
1000
2000
3000
4000
5000
6000
7000
BrO DOAS retrieval error [molec/cm2]
Num
ber o
f Eva
luat
ions
D2J2200 four scansD2J2201 four scansD2J2200 single scanD2J2201 single scan
Figure 8.The BrO DOAS fit errors for both instruments whose dataare presented in this study. The plot shows the results for spectrafrom single scans and for spectra co-added from four consecutivescans. The latter have a 50 % lower BrO DOAS fit error than singlescans.
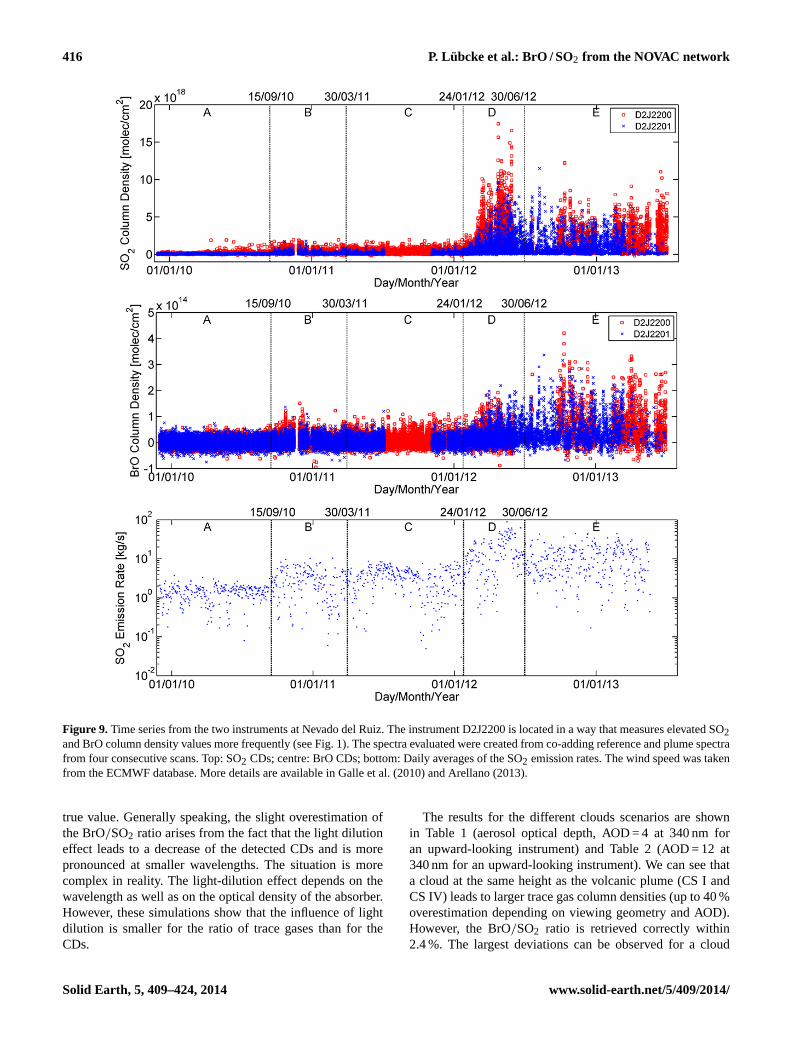
2012, as well as the SO2 emission rates. Towards the be-ginning of 2013, the SO2 column densities start to declinewhile the BrO column densities stay elevated, thus leading toincreasing BrO / SO2 ratios. Unfortunately, both instrumentshave some periods without transmitted data. D2J2201 hasvery few scans between July 2011 and November 2011, andthe instrument with the serial number D2J2200 has a gap be-tween June 2012 and September 2012. These gaps are dueto technical difficulties that can occur when operating the in-struments in remote locations. That is, the gap of D2J2200after June 2012 can be explained by ash from the eruptionfalling onto the surface of the solar panels, which leads toa lack of power supply.
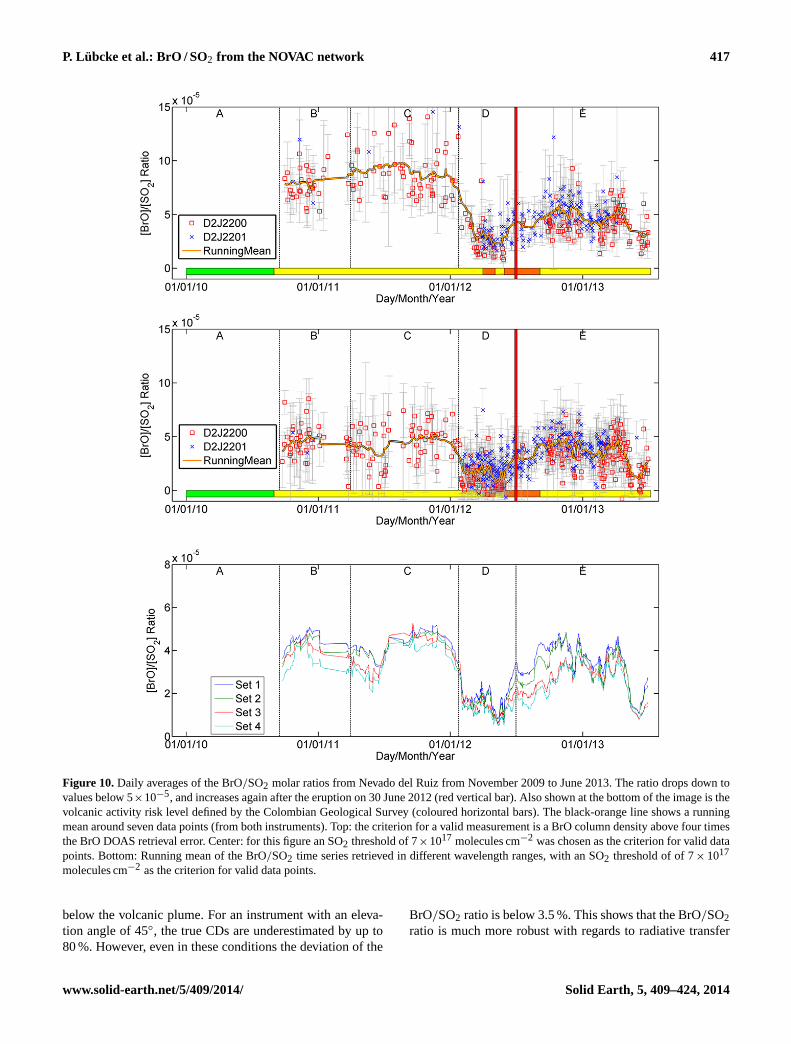
As there is only a relative small amount of data points(∼ 1–30) per day after the co-addition of scans, the usual ap-proach of calculating the linear regression for a large amountof data points (Bobrowski et al., 2003) to find the BrO / SO2ratio cannot be used here. We therefore calculated daily av-erages of the BrO / SO2 ratios from the spectra created fromco-adding four consecutive scans for the sake of lower noise.Averaging over all ratios can lead to erroneous results, sincethe average would include many scans without significantvolcanic gas and therefore negligible SO2 and BrO columndensities. Taking the ratio of two values (i.e. SO2 and BrOSCDs) that are close to zero gives unpredictable and unreal-istic results. Therefore, SCDs measured outside the volcanicplume have to be excluded. One possibility is setting a BrOthreshold equivalent to a certain factor of the retrieval erroras a BrO detection limit. An example of a time series cre-ated for all scans containing BrO above the detection limit(in this case 4 times the retrieval error was chosen) is shownin Fig. 10. The BrO / SO2 ratio is almost constant betweenJanuary 2011 and January 2012 with a value of roughly 6–8×10⁻⁵. Starting January 2012, the ratio drops down to val-ues as low as 2× 10⁻⁵, and increases again up to 4× 10⁻⁵
after an eruption on 30 June 2012 (vertical bar in Fig. 10).However, this approach is problematic since BrO is oftenclose to the detection limit. In this case, setting a BrO thresh-old would remove low BrO values, and thus lead to elevatedBrO / SO2 ratios.
In this work we therefore chose to set an SO2 thresholdof 7× 10¹⁷ molecules cm−2 to select spectra for the evalua-tion of the BrO / SO2 ratio. This threshold is a relatively highSO2 column density. However for the lower values of theBrO / SO2 ratio in Fig.10 (∼ 2× 10⁻⁵) this would result ina BrO column density as low as 1.4× 10¹³ molecules cm−2,a value only slightly higher than the average DOAS retrievalerror for BrO. This approach assures that scans not seeingsignificant amounts of volcanic gas are filtered out and thuswill not significantly influence the BrO / SO2 ratio. The re-sult is shown in the middle of Fig.10; the BrO / SO2 ratio isagain constant until January 2012 but with a lower value of4× 10−5. In 2012 there is a drop before the ratio increasesagain up to 4× 10⁻⁵ after the eruption. Towards the end of2012, the ratio sinks until the end of June 2013 (no more datawere available at the time of this manuscript).
The trends found in the BrO / SO2 molar ratios are similarirrespective of the thresholds chosen for the calculation of themean BrO / SO2 ratio. Interestingly, they show a clear corre-spondence with the general evolution of the volcanic activity,as expressed by the levels of risks defined by the authorities.The decrease in the measured BrO / SO2 ratio starts a fewmonths before the main eruptive event that led to a rise of thealert to the highest (red) level.
After the eruption the BrO / SO2 ratio recovers again,when the level of activity decreases. Many causes can pro-duce the observed pattern in the BrO / SO2 molar ratio, asfor example the injection of an SO2-rich batch of magma,or atmospheric effects like a different depletion rate of thetwo species due to scavenging by aerosols and ash in theplume. Garzon et al. (2013) suggested that the time between30 March 2012 and 30 May 2012 was dominated by magmaintrusion processes and had high sulfur emissions as well asfirst ash emissions (see Fig.9 for daily averages of the SO2emission rates). Although a detailed analysis of this processis beyond the scope of this paper, the correspondence withthe overall eruptive activity shows the potential of measuringboth gases simultaneously as a precursory signal of volcaniceruptions.
3.2 The influence of radiative transfer
The results of the radiative transfer model calculations foran increasing lateral distance between instrument and plume(without any clouds) are shown in Figs.11and12. Figure11shows the decline of the SO2 and BrO CDs. At a distance of6.5 km, only 75 % of the SO2 CD and and 78 % of the BrOCD are retrieved. However, the variation of the BrO/SO2 ra-tio is significantly lower (see Fig.12). Even at a lateral dis-tance of 6.5 km, the BrO/SO2 ratio is only≈ 6 % above the
www.solid-earth.net/5/409/2014/ Solid Earth, 5, 409–424, 2014
416 P. Lübcke et al.: BrO / SO2 from the NOVAC network
Figure 9. Time series from the two instruments at Nevado del Ruiz. The instrument D2J2200 is located in a way that measures elevated SO2and BrO column density values more frequently (see Fig. 1). The spectra evaluated were created from co-adding reference and plume spectrafrom four consecutive scans. Top: SO2 CDs; centre: BrO CDs; bottom: Daily averages of the SO2 emission rates. The wind speed was takenfrom the ECMWF database. More details are available in Galle et al. (2010) and Arellano (2013).
true value. Generally speaking, the slight overestimation ofthe BrO/SO2 ratio arises from the fact that the light dilutioneffect leads to a decrease of the detected CDs and is morepronounced at smaller wavelengths. The situation is morecomplex in reality. The light-dilution effect depends on thewavelength as well as on the optical density of the absorber.However, these simulations show that the influence of lightdilution is smaller for the ratio of trace gases than for theCDs.
The results for the different clouds scenarios are shownin Table 1 (aerosol optical depth, AOD = 4 at 340 nm foran upward-looking instrument) and Table2 (AOD = 12 at340 nm for an upward-looking instrument). We can see thata cloud at the same height as the volcanic plume (CS I andCS IV) leads to larger trace gas column densities (up to 40 %overestimation depending on viewing geometry and AOD).However, the BrO/SO2 ratio is retrieved correctly within2.4 %. The largest deviations can be observed for a cloud
Solid Earth, 5, 409–424, 2014 www.solid-earth.net/5/409/2014/
P. Lübcke et al.: BrO / SO2 from the NOVAC network 417
Figure 10.Daily averages of the BrO/SO2 molar ratios from Nevado del Ruiz from November 2009 to June 2013. The ratio drops down tovalues below 5×10⁻⁵, and increases again after the eruption on 30 June 2012 (red vertical bar). Also shown at the bottom of the image is thevolcanic activity risk level defined by the Colombian Geological Survey (coloured horizontal bars). The black-orange line shows a runningmean around seven data points (from both instruments). Top: the criterion for a valid measurement is a BrO column density above four timesthe BrO DOAS retrieval error. Center: for this figure an SO2 threshold of 7×10¹⁷ molecules cm−2 was chosen as the criterion for valid datapoints. Bottom: Running mean of the BrO/SO2 time series retrieved in different wavelength ranges, with an SO2 threshold of of 7× 10¹⁷
molecules cm−2 as the criterion for valid data points.
below the volcanic plume. For an instrument with an eleva-tion angle of 45◦, the true CDs are underestimated by up to80 %. However, even in these conditions the deviation of the
BrO/SO2 ratio is below 3.5 %. This shows that the BrO/SO2ratio is much more robust with regards to radiative transfer
www.solid-earth.net/5/409/2014/ Solid Earth, 5, 409–424, 2014

418 P. Lübcke et al.: BrO / SO2 from the NOVAC network
0 1 2 3 4 5 60
2
4
6
8
10x 10
17
Lateral Distance [km]
SO2
CD
[mol
ec/c
m2
]
0 1 2 3 4 5 60
2
4
6
8
10x 10
13
BrO
CD
[mol
ec/c
m2 ]
SO2
BrO
Figure 11. The influence of an increasing lateral distance betweeninstrument and plume on the SO2 and BrO CDs. For all calculationsthe volcanic plume was simulated 1.5 km above the instrument. TheSO2 column densities were simulated at 320 nm, the BrO columndensities at 340 nm.
issues than individual SO2 or BrO CDs, as one would expectintuitively.
As an additional verification step for the retrievedBrO/SO2 ratios, both trace gases were evaluated in differentwavelength ranges. As the alternative SO2 evaluation range(326.8–353.5 nm) does not contain the strong SO2 absorptionbands, the DOAS fit error was found to be roughly 10 timeshigher than in our standard range. We found good correlationbetween the SO2 CDs retrieved in the two evaluation ranges.The SO2 CDs in the alternative wavelength range are≈ 30 %higher than in the standard wavelength range. However, thealternative evaluation range should be treated with care be-cause of the greater instability of the fitting algorithm due tothe lower absorption of SO2.
The BrO CDs retrieved in the two evaluation ranges aregenerally the same. The BrO fit error in the alternative wave-length range (327–347 nm) was found to be≈ 30 % higherthan in the standard range.
Time series of the BrO/SO2 ratio were created for all com-binations of the different wavelength ranges:
– Set 1 SO2: 314.8–326.8 nm, BrO: 330.6–352.75 nm;this are the standard evaluation ranges used in the restof this work
– Set 2SO2: 314.8–326.8 nm, BrO: 327–347 nm
– Set 3SO2: 326.8–353.5 nm, BrO: 330.6–352.75 nm
– Set 4SO2: 326.8–353.5 nm, BrO: 327–347 nm
For a clearer presentation only the running mean valuesfor the four sets are shown at the bottom of Fig.10. The samegeneral trend is observed for all evaluation ranges, with a ten-dency of higher BrO/SO2 ratios for set 1 and 2. These obser-vations follow the previous findings on the effect of different
0 1 2 3 4 5 6−2%
0%
2%
4%
6%
8%
Lateral Distance [km]
Dev
iatio
n fr
om th
e tr
ue B
rO/S
O2
Rat
io
Figure 12.McArtim results for the influence of an increasing lateraldistance between instrument and volcanic plume on the SO2/BrOratio. The ratio of the two trace gases is only slightly influenced byan increasing distance.
evaluation ranges for SO2. Evaluating SO2 at larger wave-lengths leads to higher CDs for two reasons: the influence ofthe light-dilution effect is lower at larger wavelengths, andthe DOAS retrieval is less influenced by non-linearities thatcan occur for strong absorbers. The larger SO2 CDs lead tolower BrO/SO2 ratios when evaluating SO2 in the alternativewavelength range.
3.3 Comparison with geophysical data and observations
We compared our obtained time series of BrO/SO2 ratioswith seismic activities as reported in Herrick (2012) andin the technical reports of the SGC – Servicio GeológicoColombiano1 (formerly INGEOMINAS). Based on the SO2emission rate and number of volcano-tectonic (VT) and long-period (LP) seismic events, we divided the observation pe-riod in five different intervals.
In the first interval (A) between November 2009 (whenthe instruments where first installed) until mid-September2010, we observe low average daily SO2 emission rates be-low 3 kg s−1. Gas emissions are too low to successfully re-trieve BrO/SO2 ratios. At the same time seismic activity (seeFigs.13 and14) is very low, and the national park was openfor tourists visiting Nevado del Ruiz.
Interval B, between mid-September 2010 and end ofMarch 2011, is characterized by higher SO2 emission ratesup to 10 kg s−1. Gas emissions are high enough to retrieveBrO/SO2 ratios with an average value of≈ 5× 10⁻⁵. Thenumber of VT and LP events per month increases by an or-der of magnitude. At 6:30 a.m. on 5 November 2010, a firsthigh volcanic column with a height of 900 m was reported byneighbours located more than 50 km from Nevado del Ruiz.On 11 December 2010 a first explosion was registered in the
1http://www.sgc.gov.co/lastaccessed:28.02.2014.
Solid Earth, 5, 409–424, 2014 www.solid-earth.net/5/409/2014/

P. Lübcke et al.: BrO / SO2 from the NOVAC network 419
Table 1. SO2 CDs, BrO CDs and the BrO/SO2 ratios for the different cloud scenarios and a cloud optical density of 4 at 340 nm. (0) is acloud-free atmosphere, (I) a cloud layer between 5.5 and 6.5 km, (II) a cloud layer between 5 and 5.5 km, (III) a cloud layer between 6.5 and7 km, and (IV) an enhanced aerosol abundance coinciding with the volcanic plume.
SO2 BrO BrO/SO2 Deviation[molec/cm2] ratio [%]
×1018×1014
×10−4
0 90◦ 0.97 0.98 1.006 0.645◦ 0.92 0.93 1.014 1.4
I 90◦ 1.09 1.09 1.000 0.045◦ 1.04 1.05 1.013 1.3
II 90◦ 0.95 0.97 1.028 2.845◦ 0.28 0.27 0.976 −2.5
III 90◦ 0.96 0.96 1.000 0.045◦ 1.01 1.02 1.008 0.8
IV 90◦ 1.08 1.08 0.999 −0.145◦ 1.07 1.09 1.013 1.3
Table 2.SO2 CDs, BrO CDs and the BrO/SO2 ratios for the different cloud scenarios and a cloud optical density of 12 at 340 nm. (0) is acloud free atmosphere, (I) a cloud layer between 5.5 and 6.5 km, (II) a cloud layer between 5 and 5.5 km, (III) a cloud layer between 6.5 and7 km, and (IV) a cloud layer coinciding with the volcanic plume.
SO2 BrO BrO/SO2 Deviation[molec/cm2] ratio [ %]
×1018×1014
×10−4
0 90◦ 0.97 0.98 1.006 0.645◦ 0.92 0.93 1.014 1.4
I 90◦ 1.37 1.36 0.997 −0.345◦ 1.17 1.20 1.023 2.3
II 90◦ 0.81 0.83 1.034 3.445◦ 0.22 0.22 0.996 −0.4
III 90◦ 0.99 0.99 0.999 −0.145◦ 1.03 1.04 1.006 0.6
IV 90◦ 1.26 1.26 0.999 −0.145◦ 1.20 1.22 1.024 2.4
centre of the active Arenas crater of Nevado del Ruiz at 12:51local time.
Interval C, between April 2011 and mid-January 2012,shows SO2 emission rates and BrO/SO2 ratios similar to in-terval B. The number of LP events stays similar as well, butthe number of monthly VT events drops to approximatelyhalf of the number in interval B. On 21 August 2011 anotherrelatively high volcanic column with a height of 900 m wasobserved on the top of Nevado del Ruiz volcano. This pe-riod was accompanied by small explosions and some glacieravalanches around the main active Arenas crater.
Interval D starts at the beginning of February 2012 andends with the explosion of Nevado del Ruiz on 30 June 2012.The SO2 emission rate is generally largely increased withmaximum values of the daily average emission rate up to88 kg s−1. In this interval the BrO/SO2 ratio drops to lowervalues≈ 1−2×10⁻⁵. At this time the number of VT eventsreaches similar values to interval B and the number of
monthly LP events increases by an order of magnitude. Ashemissions were observed at the end of February (Garzónet al., 2013). The time between March and May 2012 wasdescribed as dominated by magma intrusion processes byGarzón et al. (2013).
Interval E starts after the explosion on 30 June and lasts tillthe end of our observations. The SO2 emission rates slightlydecrease (maximum daily averages of 45 kg s−1), and theBrO/SO2 ratio recovers to values of≈ 5× 10⁻⁵. However,another drop of the BrO/SO2 ratio can be observed frommid-April 2013 until the end of our observations (June 2013).The number of LP events is lower again, similar to periodsB and C. The number of VT events is characterized by highvariations. The highest number of VT events coincides withanother decrease of the BrO/SO2 ratio. During this periodash emissions can be observed occasionally.
We can summarize that there are changes of the BrO/SO2ratio that coincide with variations of seismic signals. At the
www.solid-earth.net/5/409/2014/ Solid Earth, 5, 409–424, 2014

420 P. Lübcke et al.: BrO / SO2 from the NOVAC network
01/01/10 01/01/11 01/01/12 01/01/130
2000
4000
6000
8000
10000
Num
ber V
T Ev
ents
Day/Month/Year
15/09/10 30/03/11 24/01/12 30/06/12
B C D EA
Figure 13.Number of volcano tectonic events per month. Data aretaken from the SGC reports fromhttp://www.sgc.gov.co/.
01/01/10 01/01/11 01/01/12 01/01/1310
2
103
104
105
Day/Month/Year
Num
ber L
P Ev
ents
15/09/10 30/03/11 24/01/12 30/06/12
C D EBA
Figure 14. Number of long period seismic events per month. Dataare taken from the SGC reports fromhttp://www.sgc.gov.co/.
same time as the first drop of the BrO/SO2 ratio (IntervalD), the SGC reports indicate a large increase in the numberof LP events. During the second drop of the BrO/SO2 ratio,the number of VT events increases.
A robust interpretation of the observed BrO/SO2 ratiosis difficult with our current knowledge. Only few measure-ments of solubility of bromine have been carried out (e.g.Villemant and Boudon, 1999, Bureau et al., 2000, and 2010,Balcone-Boissard et al., 2010). No information can be foundwhether bromine exsolves from the magma earlier than sul-fur. We therefore briefly discuss both possibilities. Assum-ing that bromine exsolves later than sulfur, we could iden-tify interval B and C as a system in some kind of inter-mediate equilibrium with a BrO/SO2 ratio of ≈ 5× 10⁻⁵.In case of a pressure decrease, we then expect first a de-crease in the BrO/SO2 ratio caused by the exsolution ofsulfur. If the pressure decreases further at a certain point,bromine becomes exsolved as well and the BrO/SO2 in-creases again, which can be observed in the data at the tran-sition between intervals D and E.
However, the observed pattern can also be interpreted rea-sonably assuming that bromine exsolves from the magma be-fore sulfur as suggested in Bobrowski and Giuffrida (2012).In this case we would expect an increase in bromine emis-sions (and therefore of the BrO/SO2 ratio) when the pressurestarts to decrease. This cannot be excluded nor confirmed
from our data set. The BrO/SO2 ratio could have increasedin interval A, where general gas emissions were too low toexceed the detection limit. Small increases of the BrO/SO2ratio can be observed at the beginning of interval B and in themiddle of interval C. We can also not exclude (with our timeresolution) that an increase of the BrO/SO2 ratio was too fastto be detected. The seismic signals already indicate changesof the volcanic system in interval B and C. As the pressuredecreases further (Interval D), a relatively larger fraction ofsulfur exsolves from the magma. As magma generally con-tains more sulfur than bromine, this leads to a decrease of theBrO/SO2 ratio.
Another factor affecting the relative speciation ofBrO/SO2 in the plume is the effect of magma ascent rateon the efficiency of segregation of volatile species. Balcone-Boissard et al. (2010) found that for felsic magmas Cl, Brand I are extracted efficiently at high pressure during slowmagma ascent, but remained in the melt during explosive de-gassing. Although the magmatic composition of Nevado delRuiz is not felsic, a similar dynamical effect could be presentin this volcano. The drop in the BrO/SO2 ratio preceding theexplosive phase of the eruption may thus indicate accelera-tion of the magma from the reservoir, affecting in differentways the exsolution of the two species.
4 Discussion of results and outlook
We have for the first time demonstrated that BrO columndensities can be automatically evaluated from spectra rou-tinely recorded by the NOVAC type 1 instruments of theNOVAC network. This proof of concept shows the possi-bility of achieving a 5-year or even longer time series ofBrO/SO2 ratios at many (if not all) volcanoes observed bythe NOVAC network. The instruments with which the datawere analysed in this study have exactly the same design asany other NOVAC type 1 instrument. In fact 2 years of data(January 2011–December 2012) at Galeras, Colombia, werealso evaluated. While in general showing too low SO2 levelsfor a successful BrO detection, the BrO DOAS retrieval errorwas comparable to the error from the instruments at Nevadodel Ruiz. Since Nevado del Ruiz was chosen for this studydue to the interesting activity and the good continuous dataset, not for superior instrument performance, we have no in-dications that the other instruments from NOVAC should per-form differently. Furthermore, there are other networks (i.e.the Flame network at Stromboli, Italy; Burton et al., 2009)that use comparable spectrometers, which could give fur-ther insight into volcanic BrO/SO2 ratios. Evaluating BrOand SO2 in different wavelength ranges and radiative trans-fer calculations showed that the BrO/SO2 ratio is more ro-bust against influences of radiative transfer than the trace-gascolumn densities.
The large NOVAC data set already gives the possibilityto determine other influences than changes of the volcanic
Solid Earth, 5, 409–424, 2014 www.solid-earth.net/5/409/2014/
P. Lübcke et al.: BrO / SO2 from the NOVAC network 421
activity on the BrO/SO2 molar ratio. BrO is not primarilyemitted by volcanoes but forms from HBr when volcanicgases are released into the atmosphere (e.g. Bobrowski et al.,2003; Oppenheimer et al., 2006, von Glasow, 2010). Whilethis potentially makes it more difficult to use the BrO/SO2ratio as an indicator of volcanic activity, Bobrowski andGiuffrida (2012) have found that the BrO/SO2 molar ratioincreases only in the first minutes after release into the at-mosphere. The authors found that, at a distance of approxi-mately 5 km after release into the atmosphere, the BrO/SO2molar ratio is constant (of course depending on the windspeed). The vast amount of available data in the NOVACdatabase allows the further investigation of influences likethe residence time of the volcanic gas in the ambient atmo-sphere by estimating the time of transport from the volcanicvent to the point of measurement, or meteorological influ-ences on the BrO/SO2 molar ratio, as well as its dependenceon height and latitude.
The BrO evaluation scheme presented in this manuscriptwas implemented for automatic operation to re-process thearchived data. In the future, it is planned to be implementedinto the routine evaluation for the NOVAC observatories.Besides the automated evaluation there are chances to fur-ther improve the quality of the BrO/SO2 ratios.
One possible pitfall in the DOAS evaluation of volcanicgas measurements is the requirement of a reference spectrumfree of volcanic gas. For instance, this problem is discussedin Salerno et al. (2009), where the authors state that wide vol-canic gas plumes, covering the complete range of viewingdirections, are frequently observed. This problem is prob-ably most frequently observed during periods of low windspeeds, when meaningful gas emission rate measurementsare difficult anyways. Therefore, it is not the main concernfor SO2 emission rate measurements. However, using gas-free reference spectra can improve the BrO retrieval. An ap-proach similar to that described by Salerno et al. (2009) forthe evaluation of SO2 without a reference spectrum could beimplemented. The background spectrum for the evaluation ismodelled on the basis of an extraterrestrial solar referencespectrum (Chance and Kurucz, 2010). Unfortunately, whileworking well for volcanic SO2, the approach of using mod-elled spectra does not yield sufficient accuracy for the BrOevaluation at this time.
However, this method could be used to identify “plume-free” spectra, by their SO2 signatures, which subsequentlycan be used as reference spectra to evaluate the data for bothBrO and SO2. If all spectra from a particular scan of the skycontain significant SO2 column densities, one could, for ex-ample, use a reference spectrum from a different scan or day,with similar atmospheric conditions and a similar instrumenttemperature.
Another possible approach to further improve the accuracyof our algorithm is taking temperature effects of the instru-ments, which were discussed in the Methods section, into ac-
count. This could further help to improve the quality of dataevaluation.
The results presented in this work are – although thereis still ample potential for improvements – encouraging andshow that data recorded by NOVAC can be used to routinelyperform measurements of the BrO/SO2 molar ratio as an ad-ditional tracer of volcanic activity. The sample data set pre-sented here already demonstrates that the BrO/SO2 showedsignificant changes several weeks prior to major eruptiveevents. The variations of the BrO/SO2 ratio occur at a similartime as increased seismic activity. If BrO/SO2 ratios couldbe considered as an additional indicator of changes in thevolcanic activity, even earlier warnings and discussion aboutpotential risk could be initiated. However, more data are nec-essary to confirm this behaviour – but they might be soonavailable considering the large database of NOVAC.
Acknowledgements.The authors would like to thank Mike Burtonfor editing and two anonymous reviewers for their comments on themanuscript, which greatly helped to improve it. We would like tothank the European Commission Framework 6 Research Programfor funding of the NOVAC project. We kindly acknowledge theNOVAC partners from the Colombian Geological Survey (formerlyINGEOMINAS), especially the FISQUIM Research Group andthe technical staff at the Manizales Volcanological Observatory,which permanently works for the maintenance of the energy supplyfor the ScanDOAS systems located around the main crater ofNevado del Ruiz volcano. The authors would like to thank TimDeutschmann for providing the radiative transfer model McArtim.N. Bobrowski thanks for financial support from the DFG projectDFG BO 3611/1-1. The authors thank the DFG project DFG PL193/14-1 for financial support.
The service charges for this open access publicationhave been covered by the Max Planck Society.
Edited by: M. Burton
www.solid-earth.net/5/409/2014/ Solid Earth, 5, 409–424, 2014

422 P. Lübcke et al.: BrO / SO2 from the NOVAC network
Appendix A:
We simulated synthetic spectra as outlined in Vogel (2011).Measurement and Fraunhofer reference spectra (FRS) wereboth simulated. The BrO content of the measurement spec-trum was 1.5× 10¹⁴ molecules cm−2, and the SO2 contentwas 1×10¹⁸ molecules cm−2. The synthetic spectra are basedon the Chance and Kurucz (2011) solar atlas. The Beer–Lambert law was applied on the wavelength grid of the so-lar atlas using stratospheric absorbers and in the case of themeasurement spectrum additionally BrO and SO2. Then thehigh-resolution spectra were convolved to a lower resolutionwith a Gaussian profile with varying FWHM. The FWHMwas varied between 0.525 and 0.775 nm in steps of 0.025 nm.For each FWHM a set of measurement and FRS spectrum(convolved with the same Gaussian profile) were evaluatedusing the DOAS retrieval as outlined in the Methods section.The absorption cross sections were convolved with a Gaus-sian profile with a FWHM of 0.65 nm. This approach mim-ics the situation in NOVAC. While a constant FWHM is usedfor the convolution of the absorption cross sections, the in-strument line shape of both spectra varies with temperature.Figure6 shows the deviation of the BrO/SO2 ratio from theBrO/SO2 ratio retrieved with both spectra using the sameinstrument line shape. The results show that the error in theBrO/SO2 ratio is below 15 % for variations of the instrumentline shape of up to 0.125 nm.
Solid Earth, 5, 409–424, 2014 www.solid-earth.net/5/409/2014/

P. Lübcke et al.: BrO / SO2 from the NOVAC network 423
References
Arellano, S. R.: Studies of Volcanic Plumes with Spectroscopic Re-mote Sensing Techniques, Licentiate thesis, Chalmers Universityof Technology, Göteborg, Sweden, 2013.
Balcone–Boissard, H., Villemant, B. and Boudon, G.: Behavior ofhalogens during the degassing of felsic magmas, Geochem. Geo-phy. Geosy., 11, Q09005, doi:10.1029/2010GC003028, 2010.
Bobrowski, N. and Giuffrida, G.: Bromine monoxide/sulphur diox-ide ratios in relation to volcanological observations at Mt. Etna2006–2009, Solid Earth, 3, 433–445, 2012.
Bobrowski, N. and Platt, U.: SO2/BrO ratios studied in five volcanicplumes, J. Volcanol. Geoth. Res., 166, 147–160, 2007.
Bobrowski, N., Hönninger G., Galle, B., and Platt, U.: Detection ofbromine monoxide in a volcanic plume, Nature, 423, 273–276,2003.
Boichu, M., Oppenheimer, C., Roberts, T. J., Tsanev, V., andKyle, P. R.: On bromine, nitrogen oxides and ozone depletion inthe tropospheric plume of Erebus volcano (Antarctica), Atmos.Environ., 45, 3856–3866, 2011.
Bureau, H., Keppler, H. and Métrich, N.: Volcanic degassing ofbromine and iodine: experimental fluid/melt partitioning data andapplications to stratospheric chemistry, EARTH PLANET SCLETT, 183, 51–60, 2000.
Bureau, H., Foy, E., Raepsaet, C., Somogyi, A., Munsch, P., Si-mon, G., and Kubsky, S.: Bromine cycle in subduction zonesthrough in situ Br monitoring in diamond anvil cells, GEOCHIMCOSMOCHIM AC, 74, 3839–3850, 2010.
Burrows, J. P., Richter, A., Dehn, A., Deters, B., Himmelmann, S.,Voigt, S., and Orphal, J.: Atmospheric remote-sensing referencedata from GOME-2. Temperature-dependent absorption crosssections of O3 in the 231–794 nm range. J. Quant. Spectrosc.Ra., 61, 509–517, 1999.
Burton, M. R., Caltabiano, T., Murè, F., Salerno, G., and Ran-dazzo, D.: SO2 flux from Stromboli during the 2007 eruption:results from the FLAME network and traverse measurements, J.Volcanol. Geoth. Res., 182, 214–220, 2009.
Carroll, M. R. and Holloway, J. R.: Volatiles in Magmas, Miner-alogical Society of America, Washington DC, 517 pp., 1994.
Chance, K. and Kurucz, R. L.: An improved high-resolution solarreference spectrum for earth’s atmosphere measurements in theultraviolet, visible, and near infrared, J. Quant. Spectrosc. Ra.,111, 1289–1295, 2010.
Deutschmann, T., Beirle, S., Fried, U., Grzegorski, M., Kern, C.,Kritten, L., Platt, U., Prados-Román, C., Puckite, J., Wagner, T.,Werner, B., and Pfeilsticker, K.: The Monte Carlo atmosphericradiative transfer model McArtim: Introduction and validation ofJacobians and 3D features, Journal of Quantitative Spectroscopyand Radiative Transfer, 112, 1119–1137, 2011.
Fleischmann, O. C., Hartmann, M., Burrows, J. P., and Orphal, J.:New ultraviolet absorption cross-sections of BrO at atmospherictemperatures measured by time-windowing Fourier transformspectroscopy, J. Photoch. Photobio. A, 168, 117–132, 2004.
Galle, B., Oppenheimer, C., Geyer, A., McGonigle, A. J. S., Ed-monds, M., and Horrocks, L.: A miniaturised ultraviolet spec-trometer for remote sensing of SO2 fluxes: a new tool for volcanosurveillance, J. Volcanol. Geoth. Res., 119, 241–254, 2003.
Galle, B., Johannson, M., Rivera, C., Zhang, Y., Kihlmann, M.,Kern, C., Lehmann, T., Platt, U., Arellano, S., and Hidalgo, S.:Network for Observation of Volcanic and Atmospheric Change
(NOVAC) – a global network for volcanic gas monitoring:Network layout and instrument description, B. Volcanol., 115,D05304, doi:10.1029/2009JD011823, 2010.
Garzon, G., Silva, B., Narvaez, A., Chacon, Z., and Galle, B.: As-sessment of SO2 emissions from three Colombian active volca-noes (2007–2012), GEOCHANGE: Problems of Global Changesof the Geological Environment, vol. 2, edited by: Khalilov, E.,Science Without Borders, London, 6–14, 2013.
Grainger, J. F. and Ring, J.: Anomalous Fraunhofer line profiles,Nature, 193, 762, doi:10.1038/193762a0, 1962.
Hermans, C., Vandaele, A. C., Fally, S., Carleer, M., Colin, R.,Coquart, B., Jenouvrier, A., Merienne, M.-F.: Absorption cross-section of the collision-induced bands of oxygen from the UVto the NIR, in: Weakly Interacting Molecular Pairs: Unconven-tional Absorbers of Radiation in the Atmosphere, edited by:Camy-Peyret, C. and Vigasin, A., Springer, Netherlands, 193–202, 2003.
Herrick, J., Bulletin of the Global volcanism Network (August2012), vol. 37, 8. last accessed on 27 Nov 2013 fromhttp://www.volcano.si.edu/reports_bgvn.cfm, 2012.
Hörmann, C., Sihler, H., Bobrowski, N., Beirle, S., Penning deVries, M., Platt, U., and Wagner, T.: Systematic investigationof bromine monoxide in volcanic plumes from space by usingthe GOME-2 instrument, Atmos. Chem. Phys., 13, 4749–4781,doi:10.5194/acp-13-4749-2013, 2013.
Kelly, P. J., Kern, C., Roberts, T. J., Lopez, T., Werner, C., andAiuppa, A.: Rapid chemical evolution of tropospheric volcanicemissions from Redoubt Volcano, Alaska, based on observationsof ozone and halogen-containing gases, J. Volcanol. Geoth. Res.,259, 317–333, 2012.
Kern, C.: Spectroscopic measurements of volcanic gas emissionsin the ultra-violet wavelength region, Ph.D. Thesis, Institute ofEnviromental Physics, University of Heidelberg, 2009.
Kraus, S.: DOASIS, A Framework Design for DOAS, Ph.D. Thesis,University of Mannheim, 2006.
Meller, R. and Moortgat, G. K.: Temperature dependence of the ab-sorption cross sections of formaldehyde between 223 and 323 Kin the wavelength range 225–375 nm, J. Geophys. Res-Atmos.,105, 7089–7101, 2000.
Menyailov, I. A.: Prediction of eruptions using changes in compo-sition of volcanic gases, B. Volcanol., 39, 112–125, 1975.
Noguchi, K. and Kamiya, H.: Prediction of volcanic eruption bymeasuring the chemical composition and amounts of gases, B.Volcanol., 26, 367–378, doi:10.1007/BF02597298, 1963.
Oppenheimer, C., Tsanev, V. I., Braban, C. F., Cox, R. A.,Adams, J. W., Aiuppa, A. Bobrowski, N., Delmelle, P., Bar-clay, J., and McGonigle, A. J. S.: BrO formation in volcanicplumes, Geochim. Cosmochim. Ac., 70, 2935–2941, 2006.
Pennisi, M. and Le Cloarec, M.-F.: Variations of Cl, F, and S inMount Etna’s plume, Italy, between 1992 and 1995, J. Geophys.Res-Sol Ea., 103, 5061–5066, 1998,.
Pinardi, G., Roozendael, M. V., and Fayt, C.: The influence of spec-trometer temperature variability on the data retrieval of SO2., InNOVAC second annual activity report, NOVAC consortium, 44–48, 2007.
Platt, U. and Stutz, J.: Differential Optical Absorption Spectroscopy– Principles and Applications, Physics of Earth and Space Envi-ronments, 1st Edn., Springer, Berlin, Heidelberg, New York, 597pp., 2008.
www.solid-earth.net/5/409/2014/ Solid Earth, 5, 409–424, 2014

424 P. Lübcke et al.: BrO / SO2 from the NOVAC network
Salerno, G. G., Burton, M. R., Oppenheimer, C., Caltabiano, T.,Tsanev, V. I., and Bruno, N.: Novel retrieval of volcanic SO2abundance from ultraviolet spectra, J. Volcanol. Geoth. Res.,181, 141–153, 2009.
Vandaele, A. C., Hermans, C., Simon, P. C., Carleer, M.,Colin, R., Fally, S., Merienne, M., Jenouvrier, A., and Co-quart, B.:, Measurements of the NO2 absorption cross-sectionfrom 42 000 cm−1 to 10 000 cm−1(238–1000 nm) at 220 K and294 K, J. Quant. Spectrosc. Ra., 59, 171–184, 1998.
Vandaele, A. C., Hermans, C., and Fally, S.: Fourier transform mea-surements of SO2 absorption cross sections: I I.: Temperaturedependence in the 29 000–44 000 cm−1 (227–345 nm) region, J.Quant. Spectrosc. Ra., 110, 2115–2126, 2009.
Villemant, B. and Boudon, G.: H2O and halogen (F, Cl, Br) be-haviour during shallow magma degassing processes, EARTHPLANET SC LETT, 168, 271–286, 1999.
Vogel, L.: Volcanic plumes: Evaluation of spectroscopic measure-ments, early detection and bromine chemistry, Ph.D. thesis, Ru-perto Carola University of Heidelberg, Germany, available at:http://www.ub.uni-heidelberg.de/archiv/13219, 2011.
Vogel, L., Sihler, H., Lampel, J., Wagner, T., and Platt, U.: Retrievalinterval mapping: a tool to visualize the impact of the spectral re-trieval range on differential optical absorption spectroscopy eval-uations, Atmos. Meas. Tech., 6, 275–299, 2013,http://www.atmos-meas-tech.net/6/275/2013/.
von Glasow, R.: Atmospheric chemistry in volcanic plumes, P. Natl.Acad. Sci. USA, 107, 6594–6599, 2010.
Wagner, T., Chance, K., Frieß, U., Gil, M., Goutail, F., Hönninger,G., Johnston, P., Karlsen-Tørnkvist, K., Kostadinov, I., Leser, H.,Petritoli, A., Richter, A., Van Roozendael, M., and Platt, U.: Cor-rection of the ring effect and I0 effect for DOAS observations ofscattered sunlight, ESA Technical Report, 2002.
Wagner, T., Beirle, S., and Deutschmann, T.: Three-dimensionalsimulation of the Ring effect in observations of scattered sunlight using Monte Carlo radiative transfer models, Atmos. Meas.Tech., 2, 113–124, doi:10.5194/amt-2-113-2009, 2009.
Wagner, T., Beirle, S., Dörner, S., Friess, U., Remmers, J., andShaiganfar, R.: Cloud detection and classification based onMAX-DOAS observations, Atmos. Meas. Tech. Discuss., 6,10297–10360, doi:10.5194/amtd-6-10297-2013, 2013.
Solid Earth, 5, 409–424, 2014 www.solid-earth.net/5/409/2014/