The St. Louis Bridge, the Brooklyn Bridge, and the feud between

Brooklyn Bridge Park Financial Plan
A. BACKGROUND B. CONSTRUCTION BUDGET COSTS BY
ELEMENTC. MAINTENANCE AND OPERATIONS
BUDGETD. DEVELOPMENT REVENUE BUDGET
1
JANUARY 29, 2009

BACKGROUND

BACKGROUND AND HISTORY – SUBJECT SITE
• 85 ACRES• 1.3 MILES ALONG WATERFRONT• ATLANTIC AVE TO JAY STREET• SITE INCLUDES:
• PIERS 1-6• FULTON FERRY LANDING• BROOKLYN BRIDGE PLAZA• NYS EMPIRE FULTON FERRY PARK• NYC MAIN STREET PARK• CON ED SITE
3
SUBJECT SITE PRE-DEMOLITION CONDITION 4

SUBJECT SITE FULL PARK BUILD OUT 5
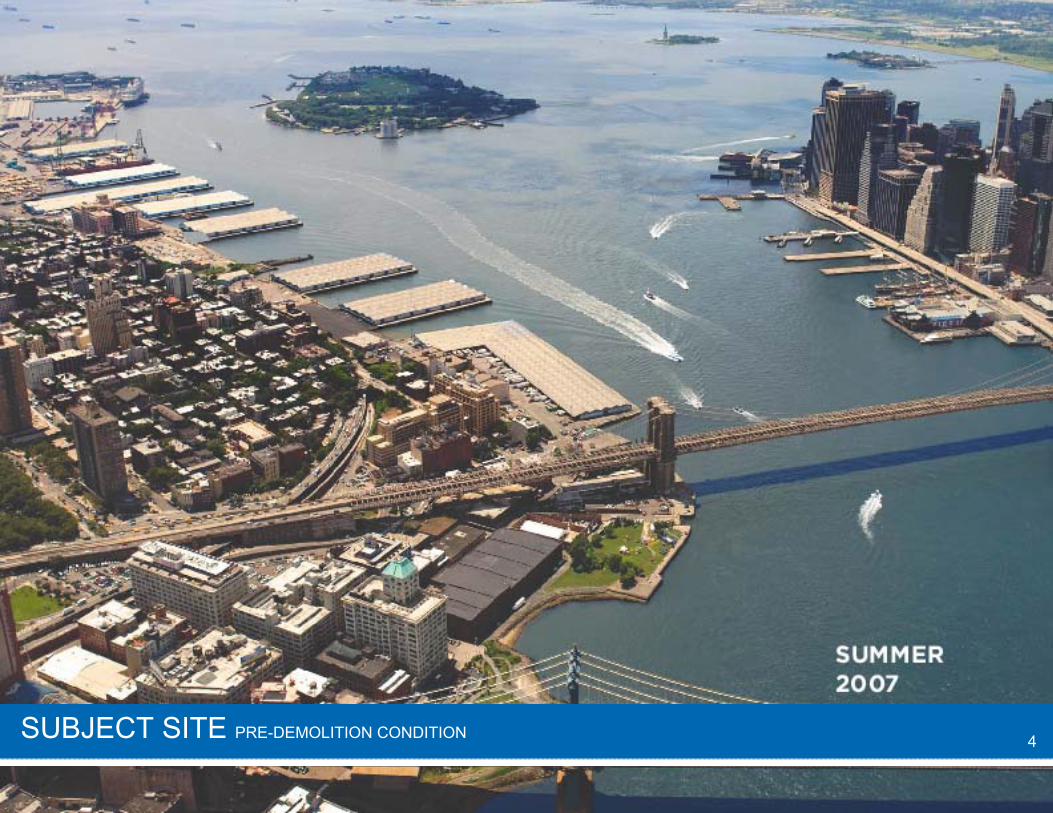
PARK DEVELOPMENT TIMELINE
2002: NYC/NYS MOU – BBPDC CREATED
2004: FUNDING AGREEMENTS WITH NYC AND PA
2006: GENERAL PROJECT PLAN ADOPTED
2008: DEMOLITION AND SITE PREP
2009: CONSTRUCTION BEGINS
6

FINANCIAL PLAN:UPDATE AND REVIEW
• BBPDC has updated construction costs based on actual bid data for first phases.
• BBPDC has re-projected both the maintenance and operations expense budget and the development revenue forecasts.
7

CONSTRUCTION BUDGET: COSTS BY ELEMENT

CONSTRUCTION BUDGET - SOURCES
PORT AUTHORITY: $85 MILLION+NEW YORK CITY: $65 MILLION+ADDITONAL NEW YORK CITY: $81 MILLION
TOTAL CURRENTLY AVAILABLE: $231 MILLION
ESTIMATE FOR ENTIRE PARK: ~$350 MILLION
9

PARK PHASING PHASE 1: CURRENTLY FUNDED
Pier 6
NYC Main St. Park
Pier 4Pier 5
Pier 3Pier 2 Pier 1
NYS Empire Fulton Ferry Park
Brooklyn Bridge Plaza
10

CONSTRUCTION BUDGET
11
CAPITAL COSTS BY ELEMENT FULL PARK BUILDOUT
BASE COSTS56%
CORE PARK ELEMENTS
34%
UNIQUE PARK ELEMENTS
10%

CONSTRUCTION BUDGET
CAPITAL COSTS BY ELEMENT – FULL PARK BUILDOUT
BASE COSTS COST % OF TOTAL PARK BUDGETUTILITIES / INFRASTRUCTURE $61,500,000 18%BULKHEAD / WATERFRONT $26,600,000 8%DEMOLITION / SITE PREP $22,200,000 6%ENVIRONMENTAL REVIEW $4,200,000 1%CONSTRUCTION MANAGEMENT & GC $41,300,000 12% ARCHITECTURE AND ENGINEERNG $20,400,000 6% MISCELLANEOUS SOFT COSTS $13,100,000 3%CONTINGENCIES $5,000,000 2%
TOTAL BASE COSTS $194,300,000 56%
12
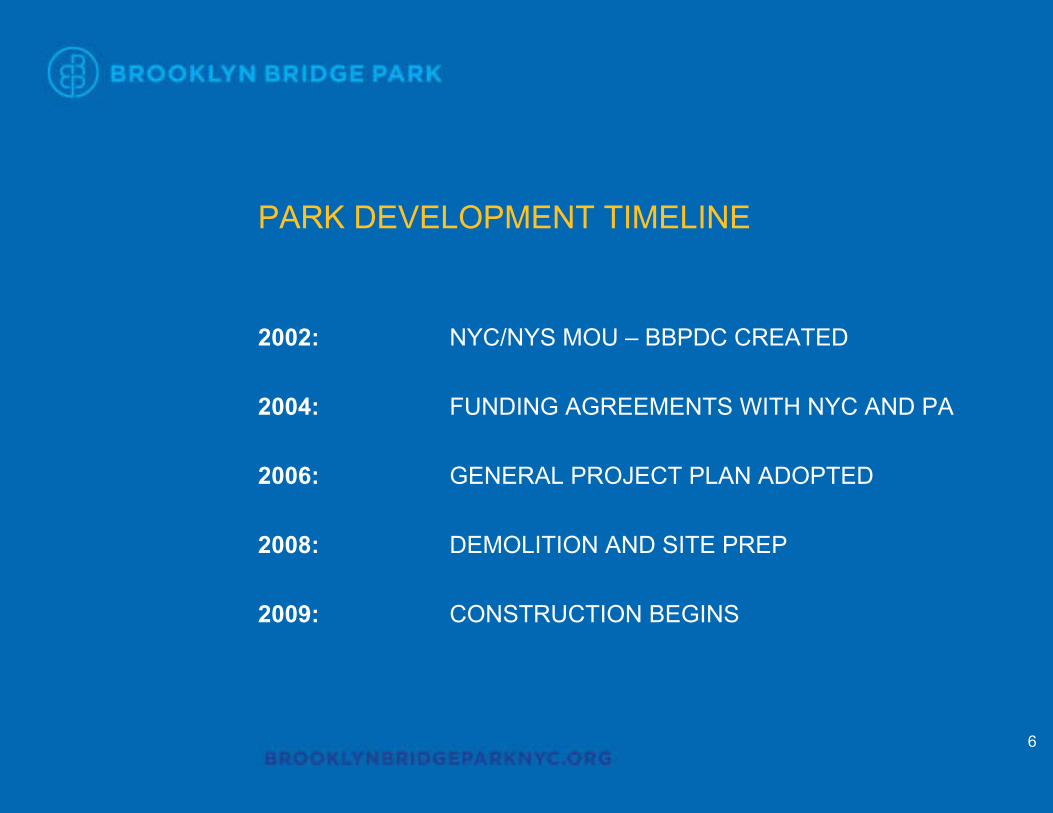
CONSTRUCTION BUDGET
CAPITAL COSTS BY ELEMENT – FULL PARK BUILDOUT (CONTINUED)
PARK ELEMENT COST % OF TOTAL PARK BUDGETBASE COSTS $194,300,000 56%
CORE PARK ELEMENTSPROMENADE / PATHWAYS / PLAZAS $38,500,000 11%PARK STRUCTURES $27,800,000 8%PARKLAND NORTH OF BROOKLYN BRIDGE $14,600,000 4%PLANTED AREAS $14,500,000 4%ACTIVE SPORTS COURTS/FIELDS $12,000,000 3%LAWNS $8,300,000 3%PLAYGROUNDS $3,900,000 1%
UNIQUE PARK ELEMENTSWAVE ATTENUATION $16,400,000 5%NATURAL WATERFRONT & WETLANDS $9,500,000 3%BERMS $7,000,000 2%
TOTAL $347,000,000 100%13

CONSTRUCTION COSTS
• SUMMARY• Base Costs (i.e. Costs which must be incurred no matter what is
built on the site) – constitute approximately $200M out of the $350M budget.
• Many elements of the current plan are fully integrated and serve multiple purposes.
• The current plan represents the most efficient and economical use of the site to create parkland given the existing site conditions, load- bearing capacity, environmental concerns and funding constraints.
14

MAINTENANCE AND OPERATIONS BUDGET

OPERATIONS MODEL FOR A SELF-SUSTAINING PARK
Park DesignEstimate
Maintenance Budget
Determine Appropriate Size, Type, and
Location of Development
Estimate Projected Revenue to Support Maintenance Budget
Maintenance & Operations Budget = Development Revenues + PILOT Payments
16

MAINTENANCE AND OPERATIONS BUDGET
• OPERATING COMPONENT• LANDSCAPE MAINTENANCE
• PATHS, PLAZAS & PROMENADES• PLAYGROUNDS• NATURAL TURF• PLANTED AREAS• WATER AREAS
• SECURITY AND RECREATION STAFF• UTILITIES AND INSURANCE
• ELECTRIC• WATER• HEATING
• PROPERTY/LIABILITY INSURANCE
• ADMINISTRATIVE EXPENSES
17

MAINTENANCE AND OPERATIONS BUDGET
• CAPITAL COMPONENT• MARITIME MAINTENANCE
• PILE PROTECTION• REPAIR DECKS• BULKHEAD MAINTENANCE• FENDERING• RIP RAP
• VEHICLE REPLACEMENT
• SANITATION VEHICLES• LANDSCAPING VEHICLES• UTILITIES MAINTENANCE VEHICLES
• CAPITAL RESERVE
18
MAINTENANCE AND OPERATIONS BUDGET
• CALCULATION ASSUMPTIONS IN EIS• Budget originally calculated in 2004 using 2004$
• Budget calculated for full park build out
• Budget based on annual stabilized costs
• Maritime Infrastructure costs based on 50-year average
19

MAINTENANCE AND OPERATIONS BUDGET
• NEW 2008 PROJECTED EXPENSES – FULL PARK BUILDOUT
• Figures adjusted to account for inflation from 2004 to 2008.
• Landscape Maintenance & Operating costs reduced slightly to reflect more specific park design. Costs have been assessed by NYC Department of Parks and Recreation and found to be consistent with operating costs for large waterfront parks.
• Utilities costs reduced to reflect introduction of sustainable design elements such as photovoltaic cells and re-use of storm water for irrigation.
• Vehicle Replacement costs reduced to reflect smaller vehicle fleet.
20

MAINTENANCE AND OPERATIONS BUDGETEIS Projection Adjusted New2004 $ 2008 $ equiv* 2008 Projection
• Landscape Maint. & Op. $4,475,000 $5,046,000 $4,813,000
• Security and Recreation Staff $2,682,000 $3,024,000 $3,024,000
• Utilities & Insurance $1,037,000 $1,170,000 $507,000
• Administrative Expenses $1,380,000 $1,556,000 $1,556,000
• Marine Infrastructure $3,600,000 $4,060,000 $4,060,000
• Vehicle Replacement $202,000 $228,000 $160,000
• Capital Reserve $1,820,000 $2,052,000 $1,984,000
• TOTAL: $15,200,000 $17,136,000 $16,104,000
*Adjusted to reflect inflation of 3% per year21
MAINTENANCE AND OPERATIONS BUDGET
• LANDSCAPE MAINTENANCE AND OPERATIONS INCLUDES:
• Horticulture: Mowing, pruning, planting, weeding, raking, fertilizing, seeding, etc.
• Sanitation: Trash removal, bathroom cleaning, graffiti removal, snow removal, power washing, pest control, etc.
• Minor Repair: Bench repair, replacing swings and basketball hoops, pothole repair, touch up painting, changing light bulbs, etc.
• Irrigation/ Setting/monitoring irrigation system, cleaning catch basins, Storm Water: repairing irrigation heads, etc.
22

MAINTENANCE AND OPERATIONS BUDGET
MAINTENANCE COSTS FOR DIFFERENT LANDSCAPE TYPES
CURRENT % OF TOTAL % OF LANDSCAPELANDSCAPE TYPE COST/SF PARK AREA MAINT. BUDGET
PATHS, PLAZAS & PROMENADES $0.76 55% 34%
LAWNS $1.56 26% 34%
PLAYGROUNDS $2.26 2% 3%
MIXED PLANTINGS $4.34 5% 18%
GENERAL PLANTING $1.67 3% 5%
WETLAND GARDENS $1.17 3% 4%
WATERFRONT $0.85 5% 4%
INTENSIVE PLANTINGS $5.65 1% 1%23

MAINTENANCE AND OPERATIONS BUDGET
• ADMINISTRATION AND SECURITY• Security: Comparable parks (Hudson River
Park, Battery Park City , Riverside Park, Central Park, Prospect Park, etc.) provide proprietary security in addition to NYPD.
• Administrative Expenses: Represents required staffing costs, whether a new
entity is formed or park is managed through an existing entity/agency.
24

MAINTENANCE AND OPERATIONS BUDGET
• UTILITIES & INSURANCE
• Not typically covered by City parks operating budgets since City parks are not billed for utilities and NYC self-insures
• CAPITAL RESERVE
• Capital reserve calculated as a percentage of construction budget, representing annualized cost of replacing large systems as they reach the end of their expected lifecycles.
• City Parks do not have capital reserves and must rely on the availability of funds from the City’s Capital budget – which can lead to deferred maintenance
25

MAINTENANCE AND OPERATIONS BUDGET
• MARINE INFRASTRUCTURE COSTS
• Piers 2 through 6 are built on approximately 12,000 timber piles, which must be encapsulated to protect them from marine borers.
• The cost of this work could be as high as $150 million, which must be performed over the next 15 years.
• No public agency (City or State) is able to fund this work as a capital expense, therefore it must be covered in our operating budget.
26

DEVELOPMENT REVENUE BUDGET

DEVELOPMENT SITES
Pier 6
NYC Main St. Park
Pier 4Pier 5
Pier 3Pier 2 Pier 1
NYS Empire Fulton Ferry Park
Brooklyn Bridge Plaza
Pier 6 (A & B) One Brooklyn Bridge Park Pier 1 (A & B) Empire Stores John St.
28
Existing Buildings
New Development Footprint

• ANNUAL REVENUES FROM GROUND RENT & PILOT – FULL PARKPROJECTED % OF TOTAL % OF
DEVELOPMENT SITE REVENUE REVENUE PROJECT AREA
One Brooklyn Bridge Park $2,982,000 18% 3.5% (existing)
Empire Stores $1,075,000 6% 2.0% (existing)
Pier 1 $5,246,000 31% 2.6%
Pier 6A $4,604,000 27% 0.3%
Pier 6B $2,147,000 13% 0.3%
John St $855,000 5% 0.3%
TOTAL $16,909,000 100% 9.0%
PROJECTED DEVELOPMENT REVENUES
29

OPERATIONS MODEL
• SHORT-TERM BUSINESS MODEL
• BBPDC collects approximately $3 million annually from One Brooklyn Bridge Park in ground rent and PILOT.
• BBPDC will have collected approximately $5 million in ground rent and PILOT fees from One Brooklyn Bridge Park prior to Park opening.
• M&O costs for the “early openings” of the park will be approximately $4 million annually (excluding maritime infrastructure costs) and increase as more of the Park is built and opened.
• Projected expenses are covered by available revenue funds in the early years.
• As more sections of the Park’s first phase are built, the approved development sites must be phased in to ensure that revenues cover operating expenses and maritime infrastructure rehabilitation.
30

OPERATIONS MODEL
• SUMMARY• The short term model allows the Park to cover projected expenses
in the early years and as more sections of the Park’s first phase are built, the approved development sites must be phased in to ensure that revenues cover operating expenses and maritime infrastructure rehabilitation.
• Current long-term projections of revenues and expenses are within 5% of each other. It is not possible to responsibly consider eliminating any development revenue sources at this time.
31

FULL PARK PLAN
Pier 6
NYC Main St. Park
Pier 4Pier 5
Pier 3Pier 2 Pier 1
NYS Empire Fulton Ferry Park
Brooklyn Bridge Plaza
32