Brooke Fortson and Gordon Robinson, SAS Institute...
10
1 Paper SAS495-2017 Investigating Connections between Disparate Data Sources with SAS® Visual Investigator Brooke Fortson and Gordon Robinson, SAS Institute Inc. ABSTRACT In 1993, Erin Brockovich, a legal clerk to Edward L. Masry, began a lengthy manual investigation after discovering a link between elevated clusters of cancer cases in Hinkley, CA, and contaminated water in the same area due to the disposal of chemicals from a utility company. In this session, we combine disparate data sources—cancer cases and chemical spillages—to identify connections between the two data sets using SAS® Visual Investigator. Using the map and network functionalities, we visualize the contaminated areas and their link to cancer clusters. What took Erin Brockovich months and months to investigate, we can do in minutes with SAS® Visual Investigator. INTRODUCTION When Erin Brockovich began organizing papers for a pro bono real estate case, she didn’t realize that she’d spend countless hours in her law firm connecting the dots between medical records and toxic spills in Hinkley, CA. Brockovich quickly learned how difficult it can be to bring together disparate data sources to expose obscured patterns and reveal hidden connections. After months and months of research, she was able to identify illnesses that correlated with a Chromium 6 toxic spill that had been poisoning Hinkley’s water for over 30 years. In this paper, we tackle an analysis similar to Brockovich’s, bringing together data around cancer cases and toxic spills. This analysis helps us to identify cancer clusters in a geographical location and see whether there is any correlation of those clusters to contaminated areas. We create alerts to notify an investigator when there is a possible cancer cluster or new cases within an existing cluster, so that we can take action quickly and confidently. Here are some things to consider: What if the contamination is at a workplace? There might not be a geographical cluster based on home address. Cancer could take quite some time to present itself. What if the residents have moved away? These are realistic scenarios that would be nearly impossible for a human to detect, and they illustrate why it took Erin Brockovich so long to complete her research. With SAS Visual Investigator configured to look at this data, the movie Erin Brockovich would have been a 90-second trailer. CONNECTING THE DOTS / MAKING ANALYTICS ACTIONABLE “It is impossible to connect the dots looking forward but very, very clear looking backwards.” – Steve Jobs While Jobs’ observation might be true for humans, SAS Visual Investigator is able to connect the dots in real time using scenarios. In today’s world there is so much data. How do you know what is important and what is just noise? What do you prioritize and what can be discarded? When you import millions of rows of data, most of it is going to be meaningless, unimportant information. But what if there’s a small but important data point that could get overlooked? Or what if there’s a nearly undetectable pattern? When thinking about SAS Visual Investigator, I always think about the evidence boards in crime shows, where investigators are trying to link together evidence and make connections between people and places. The wall is always covered in maps, timelines, and mug shots, all connected by strings and other evidence. Not only is this relying on investigators to manually detect patterns and connections, but it’s also a singular snapshot, only accessible by the people in the room. For Erin Brockovich, her evidence
Transcript of Brooke Fortson and Gordon Robinson, SAS Institute...

1
Paper SAS495-2017
Investigating Connections between Disparate Data Sources with
SAS® Visual Investigator
Brooke Fortson and Gordon Robinson, SAS Institute Inc.
ABSTRACT In 1993, Erin Brockovich, a legal clerk to Edward L. Masry, began a lengthy manual investigation after discovering a link between elevated clusters of cancer cases in Hinkley, CA, and contaminated water in the same area due to the disposal of chemicals from a utility company. In this session, we combine disparate data sources—cancer cases and chemical spillages—to identify connections between the two data sets using SAS® Visual Investigator. Using the map and network functionalities, we visualize the contaminated areas and their link to cancer clusters. What took Erin Brockovich months and months to investigate, we can do in minutes with SAS® Visual Investigator.
INTRODUCTION When Erin Brockovich began organizing papers for a pro bono real estate case, she didn’t realize that she’d spend countless hours in her law firm connecting the dots between medical records and toxic spills in Hinkley, CA. Brockovich quickly learned how difficult it can be to bring together disparate data sources to expose obscured patterns and reveal hidden connections. After months and months of research, she was able to identify illnesses that correlated with a Chromium 6 toxic spill that had been poisoning Hinkley’s water for over 30 years.
In this paper, we tackle an analysis similar to Brockovich’s, bringing together data around cancer cases and toxic spills. This analysis helps us to identify cancer clusters in a geographical location and see whether there is any correlation of those clusters to contaminated areas. We create alerts to notify an investigator when there is a possible cancer cluster or new cases within an existing cluster, so that we can take action quickly and confidently.
Here are some things to consider:
What if the contamination is at a workplace? There might not be a geographical cluster based onhome address.
Cancer could take quite some time to present itself. What if the residents have moved away?
These are realistic scenarios that would be nearly impossible for a human to detect, and they illustrate why it took Erin Brockovich so long to complete her research.
With SAS Visual Investigator configured to look at this data, the movie Erin Brockovich would have been a 90-second trailer.
CONNECTING THE DOTS / MAKING ANALYTICS ACTIONABLE “It is impossible to connect the dots looking forward but very, very clear looking backwards.” – Steve Jobs
While Jobs’ observation might be true for humans, SAS Visual Investigator is able to connect the dots in real time using scenarios. In today’s world there is so much data. How do you know what is important and what is just noise? What do you prioritize and what can be discarded? When you import millions of rows of data, most of it is going to be meaningless, unimportant information. But what if there’s a small but important data point that could get overlooked? Or what if there’s a nearly undetectable pattern?
When thinking about SAS Visual Investigator, I always think about the evidence boards in crime shows, where investigators are trying to link together evidence and make connections between people and places. The wall is always covered in maps, timelines, and mug shots, all connected by strings and other evidence. Not only is this relying on investigators to manually detect patterns and connections, but it’s also a singular snapshot, only accessible by the people in the room. For Erin Brockovich, her evidence

2
board consisted of file folders and troves of medical charts, along with thousands of research hours. But with SAS Visual Investigator, you have a virtual environment that enables an investigator to interact with the data, document findings, and share insights with colleagues, making investigations efficient and collaborative.
SOURCE DATA
There are two main data sources that we are pulling into SAS Visual Investigator.
First, we want to be able to pull in details of the cancer incidents. This would include lots of data points about the individuals affected, including the following:
age.
address history. This is important in case the individual has moved, given the latency involved in developing cancer.
sex.
ethnicity.
employment history.
details of the cancer.
o type
o location
o date of diagnosis
The second data source that we pull in concerns toxic spills that occurred between 1987 and 2015 (https://www.epa.gov/toxics-release-inventory-tri-program). This data set includes details of the following:
chemical involved
date of the spillage
amount of the chemical spilled
whether the chemical is a carcinogen
facility at which the spillage occurred
parent company for the facility
USING THE DATA WITHIN SAS VISUAL INVESTIGATOR
SAS Visual Investigator provides the capabilities to bring together multiple sources, generate relationships between the data, and provide a single tool for analysts to use to perform their investigations.
The aim of the application is to enable users to leave their data where it is and use existing data sources. That said, in many cases there is some data preparation work that needs to be performed for effective investigations. For example, the address and employment histories should be standardized prior to loading them into SAS Visual Investigator. SAS provides fantastic tooling to perform this standardization.

3
CLUSTERING THE CANCER CASES
Prior to loading the cancer cases into SAS Visual Investigator, we want to first identify any geographical clusters within the incidents. There are multiple addresses for each of the cancer incidents, as the individuals involved will likely have resided at multiple addresses throughout their lifetime. It is important to be able to include this movement in the analysis to help us identify geographical clusters.
As part of a data preparation stage, we want to add a column to addresses related to the cancer cases. This column will store a key for any identified clusters. The addresses have all been geocoded, meaning that we can look for clusters based on this information.
Table 1 shows an example of what the resulting table would look like.
Latitude Longitude Cluster
35.77966 -78.5192 0
35.90939 -78.7898 0
35.91514 -78.6584 1
35.94685 -78.7449 0
35.86421 -78.4804 1
35.79364 -78.7205 1
35.77286 -78.7394 2
35.87001 -78.5129 0
35.76058 -78.541 2
Table 1. Sample Data after Clustering
We also want to generate some statistics around the cluster. For each cluster, we want to know this information:
the total number of incidents within each cluster
the number of incidents of each type of cancer
IDENTIFYING ENTITY TYPES WITHIN THE DATA
SAS Visual Investigator uses the concept of entities in relation to the data. Data models are based on multiple different entity types. For example, a banking data model is likely based upon these entity types:
Personal Customers
Business Customers
Accounts
Transactions
Each entity might have multiple tables of associated data. For example, a customer might have multiple addresses, with these being stored in a separate table. This type of relationship is described as a child entity. For example, the Personal Customer entity type might have an Address child entity type.
It’s likely there are also relationships between the entities. These take the form of either foreign key relationships within the data or of bridge tables.
When looking at data to integrate into SAS Visual Investigator, some thought has to be given to the entities that the analyst would expect to see and what will lead to most efficient investigations.
The toxic spillage data that we have pulled from the web has an entry for every spillage that has occurred in the US between 1987 and 2015. (There are around 2.5 million spillages recorded in the data.) Each row identifies the following information:

4
the chemical involved
whether the chemical is a known carcinogen
the amount of the chemical released
the facility at which the incident occurred
the parent company associated with the facility
We could present this within SAS Visual Investigator as a Spillage entity type. This wouldn’t be particularly useful to the analyst, though.
It would be more interesting to present Company and Facility entities within SAS Visual Investigator and link these together. The Facility entity type would have a child entity called Spills. This would allow the analyst to easily see all of the spillages that have occurred within that facility.
Once the spillage data has been loaded into Postgres, facility and company tables can easily be generated by using some SQL Select Distinct commands. To do this, we need to make sure that we generate the data to be able to link the companies, facilities, and spills together.
Given the data that we have for investigating cancer incidents, we have the following entity types.
Cancer Incidence
Cancer Cluster
Company
Facility
Figure 1 shows a screenshot of the Administration module of SAS Visual Investigator. This tool enables the system administrators to point at data sources and decide which items to pull in.
The administrators also have the ability to define how these entities are related to each other (for example, defining how the Company entities are related to the Facility entities).
Display 1. Administering Entity Types within SAS Visual Investigator
One of the key strengths of SAS Visual Investigator is that it enables administrators to define how the entities are presented to the user. The page builder component enables the administrator to drag and drop controls onto a page to define what the analyst would see. Display 2 shows an example of the view that could be defined for a facility.

5
Display 2. A Facility Viewed within SAS Visual Investigator
This view of the facility allows us to easily see details such as the following:
the name of the facility
the location, plotted on a map
the types of chemicals that have been spilt at the facility
a chart showing the spillages per year
ALERTING ON CANCER INCIDENTS
The Scenario Administrator functionality of SAS Visual Investigator enables an administrator to define multiple scenarios that can be used to find cases that need to be investigated by an analyst.
Scenario Administrator allows for the following types of scenarios to be created:
Grouping Scenario – This scenario enables us to group entries in the associated table by either an associated entity type or by another column within the data. We can then look at attributes of the cluster to determine whether alerts should be created. For example, we might want to look at the minimum and maximum age at the time of diagnosis within a cancer cluster.
Record-Level Scenario – This scenario allows for rules to be run on individual entries within a table. For example, we might want to look at individual cancer incidents where the type of cancer is uncommon for the age of the individual at diagnosis.
DATA Step Scenario – This scenario allows for DATA step code to be run for more complex scenarios that can’t be achieved by the grouping or record-level scenarios.

6
Display 3. Scenario Administrator within SAS Visual Investigator
Each alert generated relates back to one of the entities that we have defined within SAS Visual Investigator. For example, we might wish to alert on the following entities:
a Cluster if we find that there are multiple incidences of the same cancer type within it
a Facility if we find too many cancer cases from employees who worked there
a Company if we find a higher than normal count at their various facilities
INVESTIGATING THE ALERTED INCIDENTS
Once alerts have been generated within SAS Visual Investigator, they can be routed to an analyst for investigation. This is achieved through the use of strategies and queues.
Strategies allow for the grouping of alerts to a defined business problem. Within a strategy, there might be multiple queues. Queues are used to control the priority of the alerts within a strategy and how these are dealt with by the analysts.
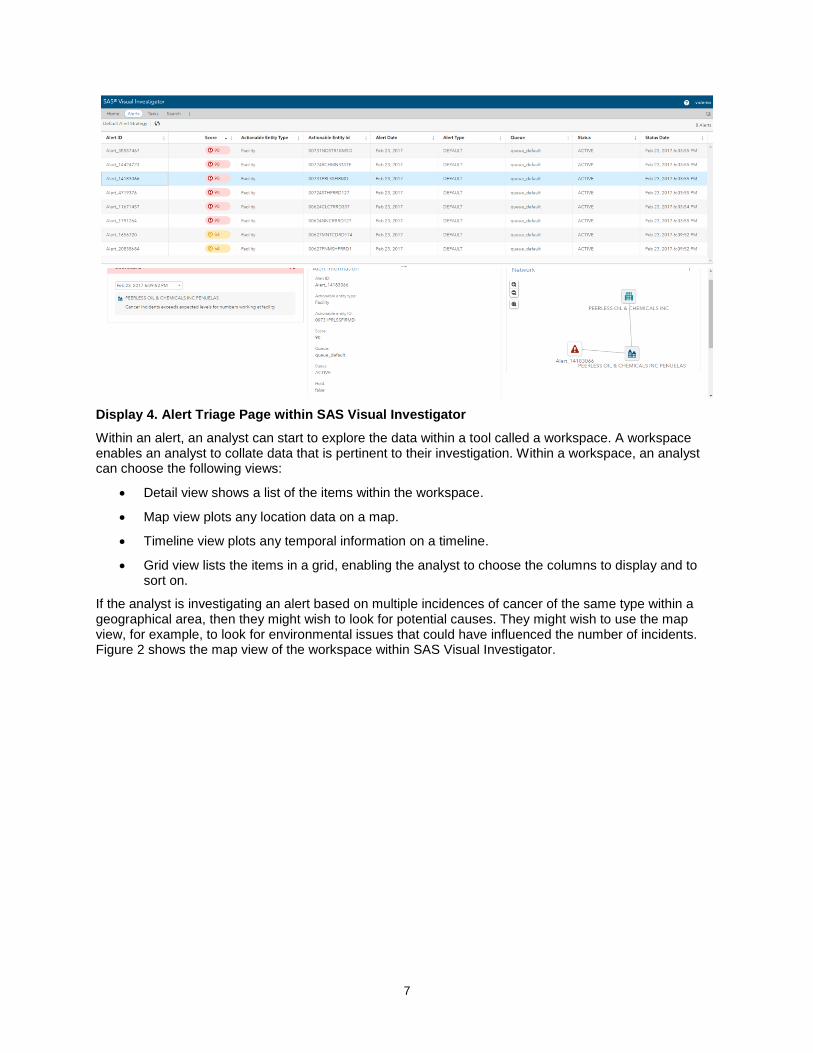
Display 4 shows the triage page provided to analysts to enable them to triage any alerts that have been generated. From this page, an analyst can view all of the alerts. Double-clicking on a row within the grid opens that alert and provides the analyst with more information about it.
7
Display 4. Alert Triage Page within SAS Visual Investigator
Within an alert, an analyst can start to explore the data within a tool called a workspace. A workspace enables an analyst to collate data that is pertinent to their investigation. Within a workspace, an analyst can choose the following views:
Detail view shows a list of the items within the workspace.
Map view plots any location data on a map.
Timeline view plots any temporal information on a timeline.
Grid view lists the items in a grid, enabling the analyst to choose the columns to display and to sort on.
If the analyst is investigating an alert based on multiple incidences of cancer of the same type within a geographical area, then they might wish to look for potential causes. They might wish to use the map view, for example, to look for environmental issues that could have influenced the number of incidents. Figure 2 shows the map view of the workspace within SAS Visual Investigator.

8
Display 5. Map View within a Workspace
If the analyst is investigating incidents of cancer within a particular work place, they might wish to use the timeline capability of the workspace to look at when the employees worked at the facility in relation to any toxic spillages that might have occurred. Figure 3 shows the timeline functionality of the workspace.
Display 6. Timeline Feature of the Workspace within SAS Visual Investigator
DOCUMENTING AN INVESTIGATION
The workspace provides an analyst with the tools that they need to perform their investigation, whereas an insight enables them to document their findings. Insights are stored within the alert or case they are associated with and are searchable within the application. This means that the results of investigations are searchable and can be used to aid future investigations.
Insights enable the analyst to snapshot copies of the visualizations that they have access to within the workspace. They can then add their notes and any images, such as a picture taken at the site of a chemical spill. Figure 4 shows an insight within the context of an alert.

9
Display 7. An Insight Documenting an Investigation
CONCLUSION
SAS Visual Investigator provides the capabilities to combine multiple data sources, generate relationships between that data, and provide a single tool for analysts to use to perform their investigations. With the use of strategies and queues, alerts can be generated, prioritized, and routed to the appropriate analyst for more efficient, targeted investigations. And with the use of dynamic workspaces, an analyst can explore data through interactive visualizations and search capabilities, and then easily document and share findings.
The tools available for investigators have changed over the past decade. Investigators are now armed with powerful intelligence analytics to proactively detect anomalies and relationships within their data. Erin Brockovich would have benefitted greatly from SAS Visual Investigator – from combining multiple sources of data, to identifying possible cancer clusters, to documenting her investigation.
Because there is so much fast-moving data in today’s world, it is imperative for investigators to keep up. It’s no longer acceptable to take months and years to investigate. Investigators need to explore data and conduct investigations with speed and precision.
REFERENCES
Erin Brockovich. “My Story.”Available http://www.brockovich.com/my-story/. Accessed on February 2, 2017.
RECOMMENDED READING
SAS® Visual Investigator 10.2: Administrator’s Guide
SAS® Visual Investigator 10.2: User’s Guide

10
CONTACT INFORMATION
Your comments and questions are valued and encouraged. Contact the authors at:
Brooke Fortson SAS Institute [email protected] Gordon Robinson SAS Institute [email protected]
SAS and all other SAS Institute Inc. product or service names are registered trademarks or trademarks of SAS Institute Inc. in the USA and other countries. ® indicates USA registration.
Other brand and product names are trademarks of their respective companies.