Bronchoscopy of lesions suspicious of malignancy ... · Marita Vågan, Yngve Seljeseth, Pascal and...
131
Bronchoscopy of lesions suspicious of malignancy: Predictors of a higher diagnostic yield, the optimal combination of sampling techniques, and evaluation of endobronchial ultrasound with a rotating miniprobe A retrospective cohort study and a prospective open randomised real-life study among physicians with various levels of experience Kjetil Roth, MD Dissertation for the degree philosophiae doctor (PhD) at the University of Bergen 2011
Transcript of Bronchoscopy of lesions suspicious of malignancy ... · Marita Vågan, Yngve Seljeseth, Pascal and...
Bronchoscopy of lesions suspicious of malignancy:
Predictors of a higher diagnostic yield, the optimal
combination of sampling techniques, and evaluation of
endobronchial ultrasound with a rotating miniprobe
A retrospective cohort study and a prospective open randomised real-life study among
physicians with various levels of experience
Kjetil Roth, MD
Dissertation for the degree philosophiae doctor (PhD)
at the University of Bergen
2011
2
Scientific environment
The study was performed in the Department of Thoracic Medicine, Haukeland
University Hospital and the Department of Internal Medicine, Helse Sunnmøre,
Ålesund Hospital, Norway.
The Bergen respiratory research group is part of the Institute of Internal Medicine,
Haukeland University Hospital. Currently, more than 10 PhD students are associated
with the group. Within the last 20 years, more than 25 doctoral theses have been
produced from the group. The group was awarded best research group at the Medical
Faculty, University in Bergen in 2007, and it was evaluated as “very good” in the
latest evaluation from the Norwegian Research Council in 2004.
3
Acknowledgements
To my supervisors for willingness to considerate
to the patients for willingness to participate
to my wife for willingness to stay
and to the employers for willingness to pay
MD Finn Wammer encouraged me as a young scholar in internal medicine to choose
pulmonary medicine as a profession. During a lung cancer course early in my career,
together with MD/PhD Christian von Plessen, I discovered an interest in
endobronchial ultrasound. A contributing factor might have been that my father, MD
Karl Roth, is a radiologist.
My main supervisor, MD/PhD Jon Hardie, an excellent scientist trained by MD/PhD
Odd Mørkve and MD/PhD Per Bakke, did his research in large epidemiological
studies by the Bergen Respiratory Research Group. One day MD/PhD Hardie and I
were sitting together in a café in Trondheim. He was hunting for a new PhD
candidate; I did not know I was his prey! We decided to use his knowledge from the
epidemiological research in a practical clinical study. Thank you, Jon, for your
patience and for your support during the whole study period.
My co-supervisor MD/PhD Tomas Eagan did a lot of hard work with the retrospective
study. He led me through my first posters and he has been a supportive friend. Thank
you Tomas for your long distance calls from the United States when you knew I
needed them, and for your and Christine’s hospitality in Bergen.
MD Alf Henrik Andreassen was the leader of the Department of Pulmonary Medicine
at Haukeland University Hospital when the study started. He encouraged us to look at
the processes, to find weaknesses in the procedures and to try new equipment in
scientific ways. Thank you Alf Henrik for your support as a leader and as a co-worker

4
during the study. The Heads of the Department of Internal Medicine in Ålesund,
MD/PhD Torstein Hole and Gro Åsnes, have also been supportive and patient, thank
you.
The study was also certainly dependent on the Departments of Pathology in Bergen
and Ålesund. The cytotechnicians and pathologists have been very helpful. Thank
you, co-worker MD Friedemann Leh and the other employees at the Departments of
pathology in Bergen and Ålesund.
My financial support during the study years was a one-year scholarship from Helse
Vest, an equipment grant from Connie Gulborg Jansen’s foundation, an equipment
grant from the Development fund at the Department of Oncology, Helse Sunnmøre;
and grants from Helse Sunnmøre. Thanks to Helse Sunnmøre for the grants that made
it possible to finish the study and to complete my PhD. Thank you GlaxoSmithKline,
Astra Zeneca and Novartis for the support that made it possible to present posters at
the ATS and ERS conferences.
To perform a study in two different cities implies a lot of travelling. Thanks to my
sister Ingunn for giving me shelter, her husband Jon Frode for lending me his car, and
to my cool nephews Ole Jørgen and Jonathan for bowling with me. Thank you, Eirunn
Waatevik Saure and Marie Waatevik, for flowers during difficult times and for
organising gatherings during my frequent stays in Bergen. Thanks to Ingvild
Helgheim Hatten and Hilde Haugedal Nordahl and your families for your hospitality.
Thank you, Inga Cecilie Sørheim, Marianne Aanerud, Trude Duelien Skorge, Louise
Persson and the other workers in the Bergen Respiratory research group for good
friendship during my stays in Bergen and during different ERS and ATS conferences.
The nurses in Ålesund and Bergen have done a great job during the study, it has
always been a pleasure to work together with them. Thanks to Gunvor Mo Norstein,
Bjørg Guldbrandsen, Gerd Eli Dale Askeland, Mona Grundeland, Lise Østgård
Monsen, Sissel Eide-Olsen, Ragny Skuseth, and the other nurses at the bronchoscopy
lab in Bergen and Ålesund for their help and co-operation during the study.
5
It is always a pleasure to work in Ålesund. A special thanks to my colleagues MD
Finn Wammer and MD Erik Dyb Liaaen, my great lunch-friends Hallvard Fremstad
and Maud-Kristine Aga Ljoså, and to Marie Thoresen who patiently has shared her
office with me. MD Ljoså and MD Thoresen reviewed the manuscript thoroughly,
thank you for the language corrections. Thanks also to Margareth Garnes, Anne
Marita Vågan, Yngve Seljeseth, Pascal and Hilda Brügger-Synnes, and the other co-
workers at the medical ward.
During the last years, I have had different trips to the country where I spent most of
my childhood: Ethiopia. Thanks to the Kiserud, Lende, and Steinhovden families for
their hospitality during these stays. Thank you Jan Hallvard Træland for your
friendship, I will always be a proud godfather for Thomas. Thanks to Martine, Olav,
Mathias, Hanne Kornelia, Torleiv Bereket, and their parents. Thanks to my friends in
Ålesund (especially Hanken, Hagerup, Tjøstheim, and Moen), my family and my
family in-law for their support during good times and bad times. The last months we
had a wonderful time in Meløy. Thanks to the great farmer Rune and his wife Trude
for the inspiration.
But most of all - thank you my one and only Laila.
6
Abstract
Aims
(1) To evaluate various predictors for a higher diagnostic yield in bronchoscopy
(2) To evaluate different combinations of sampling techniques in bronchoscopy of
endobronchial visible lesions and peripheral lesions not visible by bronchoscopy
(3) To evaluate endobronchial ultrasound (EBUS) with a rotating miniprobe for
localisation of peripheral lesions in a real-life situation among pulmonologists at
various levels of expertise
Methods
I: A retrospective cohort study evaluated the results in the study centre before the
introduction of EBUS. The study searched for predictors of a higher diagnostic yield
and evaluated different combinations of sampling techniques. All 1438
bronchoscopies performed in 2003 and 2004 at Haukeland University Hospital,
Bergen, Norway, were retrospectively reviewed and 363 patients with proven
malignant lung disease were included in the study. Sex, age, endobronchial visibility,
location (lobe), distance from the carina and tumour size were evaluated as possible
predictors for a higher detection rate for cancer. Sampling techniques performed were
biopsy, transbronchial needle aspiration (TBNA), brushing, small volume lavage
(SVL), and aspiration of fluid from the entire procedure. The predictors of a higher
detection rate were analysed in bivariate analyses and in multivariate logistic
regression. McNemars test compared different combinations of sampling techniques.
A cost-minimisation analysis evaluated different combinations of sampling
techniques for visible lesions.
II: A prospective open randomised trial evaluated EBUS for peripheral lesions and
searched for the optimal combination of sampling techniques in peripheral lesions.
The study period was from 2005 to 2008 at Haukeland University Hospital and
7
Aalesund Hospital, Norway. The included 264 patients had peripheral lesions on the
CT scan and no obvious endobronchial visible tumour on bronchoscopy. A simple
randomisation without stratification assigned the patients to either EBUS or
conventional bronchoscopy without EBUS. EBUS was performed with a 1.7 mm
rotating probe with guide sheath. The study protocol recommended fluoroscopy for
both study arms. An intention-to-treat analysis evaluated EBUS and a multivariate
analysis was performed to avoid confounding. A cost-effectiveness analysis evaluated
different combinations of biopsy, brushing, TBNA and washing.
Results
The detection rate for cancer in the retrospective study was 17 % in patients with no
endobronchial visible lesions, 34 % in patients with endobronchial constriction or
compression and 77 % in patients with endobronchial visible lesions. The multivariate
logistic regression analysis retained endobronchial visibility and size as significantly
predictors of a higher detection rate for cancer. Biopsy and brushing combined with
endobronchial needle aspiration (EBNA) was the most economical combination of
sampling techniques for endobronchial lesions in a cost-minimisation analysis.
The detection rate for cancer in the prospective study was 36 % in the EBUS group
and 44 % in the non-EBUS group (ns). The prospective study included only patients
without endobronchial visible lesions. There was a significant interaction between
size and randomisation to EBUS. Patients with lesions below 3 cm had a significantly
higher detection rate in the non-EBUS group. Lesions visualised by EBUS had a
higher detection rate for cancer than lesions not visualised by EBUS (62 % vs. 19 %,
p<0.01). The cost of one additional positive sample was 1211 euro when brushing
was added to biopsy. Based on a willingness to pay of 2800 euro for an additional
positive sample, biopsy and brushing was the most cost-effective combination of
sampling techniques for lesions not visible by bronchoscopy. The addition of TBNA
or washing had cost-effectiveness ratios above 2800 euro.
8
Conclusions
1) Endobronchial visibility and lesion size were significant predictors of a higher
detection rate for cancer in bronchoscopy.
2) For visible lesions, biopsy and brushing combined with EBNA was the most
economical combination of sampling techniques. For lesions not visible by
bronchoscopy, biopsy together with brushing was the most cost-effective combination
of sampling techniques.
3) Overall, EBUS did not increase the detection rate for cancer in peripheral lesions
when pulmonologists at various levels of expertise performed the bronchoscopies.
However, visualisation by EBUS predicted a high detection rate for cancer.
9
List of publications
Paper I: Roth, K., Hardie, J. A., Andreassen, A. H., Leh, F., and Eagan, T. M. L. “Predictors of Diagnostic Yield in Bronchoscopy: a Retrospective Cohort Study Comparing Different Combinations of Sampling Techniques”, BMC Pulmonary medicine 2010;8(2).
Paper II: Roth, K., Hardie, J. A., Andreassen, A. H., Leh, F., and Eagan, T. M. L. “Cost Minimization Analysis for Combinations of Sampling Techniques in Bronchoscopy of Endobronchial Lesions”, Respiratory Medicine 2009;103(6):888-94.
Paper III: Roth, K., Eagan, T. M. L., Andreassen, A. H., Leh, F., and. Hardie, J. A. “A Randomised trial of Endobronchial Ultrasound guided sampling in Peripheral Lung Lesions”. Lung Cancer 2011; 74(2):219-25.
Post publication correspondence:
Letter to the editor concerning our paper:
Leiro-Fernández, V., Botana-Rial, M., Represas, C., Fernández-Villar, A. Significance of endobronchial lesion appearance in the diagnostic value of different endoscopic techniques. Respiratory Medicine, 2010, 104(9):1386
Our response:
Roth, K., Eagan, T., Hardie, J. Response to Leiro-Fernández et al. Respiratory Medicine, 2010, 104(9):1387
10
Contents
SCIENTIFIC ENVIRONMENT......................................................................................................... 2
ACKNOWLEDGEMENTS................................................................................................................. 3
ABSTRACT.......................................................................................................................................... 6
LIST OF PUBLICATIONS................................................................................................................. 9
CONTENTS........................................................................................................................................ 10
1. TERMS AND ABBREVIATIONS ......................................................................................... 14
1.1 TERMS................................................................................................................................... 14
1.2 ABBREVIATIONS .................................................................................................................... 19
2. INTRODUCTION ................................................................................................................... 21
2.1 THE SUBJECT OF THE CURRENT THESIS .................................................................................. 21
2.2 HISTORICAL BACKGROUND.................................................................................................... 23
2.2.1 Bronchoscopy............................................................................................................. 23
2.2.2 Ultrasound ................................................................................................................. 24
2.2.3 Lung cancer................................................................................................................ 25
2.3 TECHNICAL DESCRIPTION OF THE ENDOBRONCHIAL ULTRASOUND MINIPROBE ...................... 27
2.4 THE DIAGNOSTIC APPROACH TO VISIBLE AND PERIPHERAL LESIONS....................................... 28
2.4.1 Papers published on bronchoscopy without endobronchial ultrasound .................... 29
2.4.2 Studies of bronchoscopy with EBUS miniprobe......................................................... 46
2.5 EVALUATION OF COSTS AND EFFECTIVENESS IN DIAGNOSTIC APPROACHES............................ 54
2.5.1 Cost analyses of strategies ......................................................................................... 54
2.5.2 Costs........................................................................................................................... 55
2.5.3 Effectiveness............................................................................................................... 55
11
3. AIMS .........................................................................................................................................57
4. MATERIAL AND METHODS ...............................................................................................58
4.1 STUDY DESIGN FOR THE RETROSPECTIVE STUDY ....................................................................58
4.2 METHODS FOR THE RETROSPECTIVE STUDY ...........................................................................60
4.3 DATA COLLECTION IN THE RETROSPECTIVE STUDY.................................................................61
4.4 PROCESSING THE DATA FILE IN THE RETROSPECTIVE STUDY...................................................61
4.4.1 Inconsistencies ............................................................................................................61
4.4.2 Missing values.............................................................................................................62
4.4.3 Variables.....................................................................................................................63
4.4.4 Statistical analyses......................................................................................................64
4.5 APPROVALS FOR THE RETROSPECTIVE STUDY.........................................................................65
4.6 STUDY DESIGN FOR THE PROSPECTIVE STUDY: STUDY SAMPLE...............................................66
4.7 METHODS FOR THE PROSPECTIVE STUDY................................................................................68
4.8 DATA COLLECTION IN THE PROSPECTIVE STUDY.....................................................................72
4.9 PROCESSING THE DATA FILE IN THE PROSPECTIVE STUDY.......................................................72
4.9.1 Inconsistencies ............................................................................................................72
4.9.2 Typing errors ..............................................................................................................73
4.9.3 Missing values.............................................................................................................73
4.9.4 Variables.....................................................................................................................74
4.9.5 Statistical analyses......................................................................................................75
4.10 APPROVALS FOR THE PROSPECTIVE STUDY........................................................................76
5. SYNOPSIS OF PAPERS..........................................................................................................77
5.1 PAPER 1..................................................................................................................................77
5.2 PAPER 2..................................................................................................................................78
12
5.3 PAPER 3................................................................................................................................. 79
6. DISCUSSION........................................................................................................................... 81
6.1 DISCUSSION OF THE METHODS............................................................................................... 81
6.1.1 Study design ............................................................................................................... 81
6.1.2 Validity ....................................................................................................................... 82
6.1.3 Internal validity.......................................................................................................... 83
Selection bias ....................................................................................................................................... 83
Information bias ................................................................................................................................... 85
Confounding ........................................................................................................................................ 86
Interactions........................................................................................................................................... 87
6.1.4 External validity ......................................................................................................... 87
Inclusion criteria, exclusion criteria and patient characteristics ........................................................... 88
The performing physicians’ level of experience................................................................................... 89
The level of costs ................................................................................................................................. 89
6.1.5 The STARD initiative and the CONSORT statement .................................................. 89
6.2 THE MAIN METHOLOGICAL STRENGTHS AND WEAKNESSES IN THE CURRENT STUDY .............. 91
6.2.1 The retrospective study............................................................................................... 91
Strengths .............................................................................................................................................. 91
Weaknesses .......................................................................................................................................... 91
6.2.2 The prospective study ................................................................................................. 92
Strengths .............................................................................................................................................. 92
Weaknesses .......................................................................................................................................... 93
6.3 DISCUSSION OF THE MAIN RESULTS ....................................................................................... 94
6.3.1 The main recommendations for bronchoscopy in published reviews......................... 94
13
6.3.2 Benign lesions .............................................................................................................95
6.3.3 Diagnostic yield in bronchoscopy...............................................................................96
Endobronchial visible lesions...............................................................................................................96
Peripheral lesions not visible by bronchoscopy....................................................................................97
6.3.4 Predictors of a higher diagnostic yield in bronchoscopy .........................................100
6.3.5 The optimal combination of sampling techniques in bronchoscopy .........................101
6.3.6 Endobronchial ultrasound ........................................................................................103
Visualisation of the lesions.................................................................................................................103
Detection rate for cancer.....................................................................................................................106
6.4 CONCLUSIONS ......................................................................................................................112
7. SUGGESTIONS FOR FUTURE RESEARCH ....................................................................113
7.1.1 Navigation.................................................................................................................113
7.1.2 Bronchography .........................................................................................................113
7.1.3 BAL ...........................................................................................................................113
7.1.4 Curettage ..................................................................................................................114
7.1.5 Catheter aspiration ...................................................................................................114
7.1.6 EBUS.........................................................................................................................114
7.1.7 The diagnostic approach to visible and peripheral lesions ......................................114
8. SOURCE OF DATA...............................................................................................................116
9. APPENDIX .............................................................................................................................132
14
1. TERMS AND ABBREVIATIONS
1.1 Terms
� When the sample size is calculated, � is the
predefined accepted probability for a type I
mistake (a false positive result). � is set as 0.05.
� In sample size calculations � is the predefined
accepted probability for a type II mistake (a
false-negative result due to insufficient study
size). � is usually set as 0.1 or 0.2.
Cohort study A study that follows a group of people for a
period of time.
Confidence interval An estimate of the variability in the data. The
estimate measures the range of values with �
above a specified level. A 95 % confidence
interval is the range of values with � above
0.05.
Cost-effectiveness analysis An analysis of alternative strategies that
compares the increase in cost to the increase in
effectiveness for the alternatives in contrast to a
reference strategy.
Cost-minimisation analysis An analysis that reveals the least costly
strategy.
15
Decision tree A figure in a decision analysis that displays the
actual strategies with all possible outcomes.
Detection rate The percentage of pathological cases correctly
detected by an investigation. The detection rate
for cancer is analogue to sensitivity for cancer.
Diagnostic yield The ability to detect distinct diagnoses
compared to a gold standard. The diagnostic
yield can include benign and malignant disease.
Incremental cost-effectiveness ratio The increase in the cost divided by the increase
in the effectiveness. If the diagnostic yield
defines the effectiveness, the incremental cost-
effectiveness ratio will be the price for one
additional positive sample.
Likelihood ratio The likelihood ratio is sensitivity divided by (1-
spesifisity).
Logistic regression Logistic regression describes the probability (p)
for an outcome based on the value of a variable
(x). The current study used logistic regression
to find significant predictors of the diagnostic
yield in bronchoscopy. Logistic regression is
based on the log odds (log odds is loge(p/(1-
p))). The logistic function e�+�x/(1+ e�+�x)
describes the probability for outcome=1 in a
group. Logit = loge(p/(1-p)) = �+�x
Logistic model The logistic model defines the logistic function:
e�+�x/(1+ e�+�x). � is a constant and � is the
coefficient for x. X is a significant predictor for
16
the outcome when the confidence interval for �
not includes 0 and the confidence interval for e�
does not include 1.
Multiple regression Multiple regression is a logistic regression
analysis that analyses the effect of multiple
variables on the outcome. For each variable, the
analysis reveals a � that is the effect of that
variable. Each variable has a significant effect
on the outcome when the 95 % confidence
interval for � of the variable does not include
zero (and the confidence interval for e� does not
include 1).
Odds The proportion with outcome=1 (p) divided by
the proportion with outcome=0 (1-p) in a
group. (p/(1-p))
Odds Ratio The odds in one group divided by the odds in
another group.
Open randomised trial A trial where the allocation to different
interventions is random, but the patient and the
investigator are aware of the allocation.
p-value The p value represents the probability for a type
1 mistake in the study.
Power The power is the study’s ability to detect a
difference and thus to reject the null hypothesis
and to avoid a type 2 mistake. Power=1- �. A
usual desired power of a study is at least 80 %
or 90 %.
17
Predictive value The proportion of patients with disease when a
test is positive is the positive predictive value
of a test. The negative predictive value of the
test is the proportion with no disease when the
test is negative.
Prospective study A study that starts at a specific date and that
includes and follows patients forward in time
until the end of inclusion and the end of follow
up. The prospective study can study cause and
effect.
Randomised trial The selection of interventions is random.
Retrospective study A study that selects patients and register
variables from a defined period prior to the start
up date. Retrospective studies can describe the
effect of different variables on each other, but
are not able to settle cause and effect.
Sensitivity The sensitivity is the number with positive test
and proven disease divided by all with proven
disease.
Specificity Specificity is the number with negative test and
no proven disease divided by all with no proven
disease. Together with sensitivity, specificity
displays the validity of the test
Solitary pulmonary nodule A nodule surrounded on all sides by healthy
pulmonary parenchyma.
Standard deviation The standard deviation describes the variation
from the average value. It is calculated as the
18
square root of the variance. (The variance is the
sum of squared deviations from the mean). 95
% of the values in the dataset will be within
1.96 standard deviations below the mean and
1.96 standard deviations above the mean in a
perfect Gauss curve.
Type I mistake The 0 hypothesis is rejected although it is true.
(False positive.)
Type II mistake The 0 hypothesis is not rejected although it is
false. (False negative.)
Willingness to pay In cost-effectiveness analyses, the willingness
to pay is the amount of money reasonable to
pay for an increase in the outcome with one
unit. For example, the price can be for one
additional quality adjusted life year (QALY).
When the diagnostic yield is the outcome, the
willingness to pay is the accepted price for one
additional positive sample.
19
1.2 Abbreviations
ATS American thoracic society
BAL Bronchoalveolar lavage
CONSORT Consolidated standards of reporting trials
CT Computed tomography
DRG Diagnosis related group
EBNA Endobronchial needle aspiration
EBUS Endobronchial ultrasound
EGFR Epidermal growth factor receptor
ERS European respiratory society
ICER Incremental cost-effectiveness ratio
MHz Megahertz
NOK Norwegian kroner
NS Not significant
PET Positron emission tomography
PhD Philosophiae doctor
QALY Quality adjusted life years
SE Standard error
SNOMED Systemised nomenclature of medicine
20
SPECT Single photon emission computed tomography
STARD Standards for reporting of diagnostic accuracy
SVL Small volume lavage
TBNA Transbronchial fine-needle aspiration
VAS Visual analogue scale
21
2. INTRODUCTION
2.1 The subject of the current thesis
A pulmonary lesion suspicious of malignancy is a common indication for
bronchoscopy. The lesions can be visible through the bronchoscope or beyond the
visual field. Different sampling techniques like biopsy, brushing, needle aspiration,
and washing are available for the physician. For lesions located beyond the visual
field, different guidance systems are available to assist in finding the right bronchial
branches. Virtual navigation from reformatted computed tomography (CT) scans can
guide a magnetic probe to the lesion. Endobronchial ultrasound (EBUS) with a
rotating miniprobe can visualise the lesion, when there is contact between the probe
and the lesion. Use of a guide sheath can lead the sampling devices back to the lesion
detected by virtual navigation or EBUS.
Regardless of the use of guidance system, diagnostic yield from a bronchoscopic
procedure will seldom be one hundred percent, neither in visible lesions nor in lesions
beyond the visual field. Several factors are likely to influence on the diagnostic yield.
Combinations of sampling techniques, the size and histology of the lesion, the
physicians’ level of experience, the selection of the patients, and the follow-up have
been significant predictors in previous studies (summarised in Table 2). A sufficiently
long and thorough follow up will be able to detect the false negative cases. The
diagnostic yield could also depend on the interpretation of the pathological results.
Cells suspicious of malignancy are likely cancerous, but may lead to a repeat of the
procedure to attain a definite diagnosis. Previous studies have shown a large variation
in diagnostic yields. The above-mentioned variables are potentially some of the
reasons for this variation. The large variation in the results from previous studies
(Figure 3) illustrates the importance to determine the diagnostic yield and to analyse
22
the predictors in our own centre. This will hopefully lead to improvement of our own
diagnostic yield and thus improved care, over time.
The three papers in the current study evaluated different predictors of a higher
diagnostic yield in bronchoscopy and compared combinations of sampling techniques.
A retrospective cohort study evaluated the diagnostic yield of bronchoscopy in the
study centre and detected the main predictors of a higher diagnostic yield. The
inclusion criteria were wide. The study evaluated the predictors for a higher
diagnostic yield in bivariate analyses and in multivariate analyses to avoid
confounding. Due to the retrospective nature of the first study, the choice of sampling
techniques was exclusively up to the physician performing the procedure. In a
prospective study, physicians at various levels of experience performed EBUS during
bronchoscopy on patients with peripheral lesions.
When the physician is choosing between different combinations of sampling
techniques, he/she must know something about the increase in the diagnostic yield.
He/she also needs knowledge about the cost of the different strategies. A cost-
minimisation model was used to analyse the costs of diagnosing visible lesions with
different sampling techniques. The model included calculated costs in the
bronchoscopy unit and in the pathological department. The cost of a missed diagnosis,
the average cost for each sampling technique, and the diagnostic yield of each
combination of sampling techniques defined the model. The cost-minimisation
analysis recommended the combination of sampling techniques that had the least
costly average price that led to diagnosis.
EBUS with a miniprobe is a possible tool to increase the diagnostic yield in peripheral
lesions. A prospective open randomised trial evaluated the use of EBUS in our centre.
All our physicians were trained to control the fluoroscope and to use EBUS with a
guide sheath. An on-site cytotechnician evaluated the transbronchial fine-needle
aspiration (TBNA) smears. The study protocol recommended the use of all sampling
techniques (biopsy, brushing, TBNA, and washing). We assumed a diagnostic yield of
40 % with fluoroscopy guidance and with all sampling techniques in the non-EBUS
23
group. The diagnostic yield in the EBUS group was predicted to 60 % based on
previous studies. Standard sample size calculation estimated that 240 patients had to
be included in the study (�=0.05, power=90 %).
An intention-to-treat analysis evaluated the use of EBUS. A multivariate analysis was
used to control for potential confounding. A cost-effectiveness analysis evaluated
different combinations of sampling techniques. The average diagnostic yield for
benign and malignant disease was the measure of effectiveness. The cost-
effectiveness analysis calculated the incremental cost-effectiveness ratio (ICER)
based on the increase in cost divided by the increase in effectiveness. ICER
represented the cost of one additional positive sample. The willingness to pay for one
additional positive sample was the average calculated cost of a repeated procedure.
When the ICER for a combination with an additional sampling technique was lower
than the willingness to pay, the sampling technique was cost-effective.
The results of the studies presented in this philosophiae doctor (PhD) thesis revealed
predictors for a higher diagnostic yield. These predictors can guide adjusted or
stratified analyses in future studies. Further, the current PhD thesis presents the most
economical combination of sampling techniques in visible and non-visible lesions and
evaluated EBUS in a real-life setting.
2.2 Historical background
2.2.1 Bronchoscopy
Gustav Killian introduced bronchoscopy in Europe when he removed a foreign body
from the trachea with an oesophagoscope in 1897(1). Killian was known to encourage
his students to analyse their results(2) and research on this method was thus started.
The father of bronchoscopy in the United States was Chevalier Jackson. Jackson
24
introduced a bronchoscope with integrated suction in 1904. Still, for both it was a
challenge to get good illumination of the bronchial tree. Killian used a light bulb
integrated in the handle of the bronchoscope, with a prism to reflect the light. Jackson
used distal illumination with a mignon bulb at the tip of the bronchoscope. A major
leap forward came when Shigeto Ikeda constructed fibreglass illumination for the
rigid bronchoscope in 1962. The fiberglass illumination contained approximately
15000 glass fibers with a size less than 15 mm(2). The fibers transported light to the
distal end of the bronchoscope, and images to the proximal part. Ikeda designed the
flexible fiberbronchoscope in 1964, and it was commercially available in 1970 from
Olympus. His paper from 1971 described flexible bronchoscopy with brushing and
curette biopsy(3). Ikeda further developed the bronchoscope with video technique in
1983-1987(2). Anderson replaced the surgical biopsy with transbronchial biopsy in
1963(4). Sackner described bronchoalveolar lavage in 1972(5). TBNA was described
by Schieppati in 1949(6), but got little attention before Wang reported his results in
1978(7).
2.2.2 Ultrasound
The brothers Jaques and Pierre Curie described the ultrasound waves in 1880. They
found that certain crystals exposed to alternating mechanical stress were excited and
produced piezoelectricity(8). Piezoelectricity was omitted from the excited crystals as
waves. After World War II, the knowledge of ultrasound from the Sound Navigation
and Ranging (SONAR) was explored for medical purposes. The A-mode ultrasonic
instrument presented blips on an oscilloscope screen. These blips marked the distance
from the transducer to the lesion. Shigeru Nakajima and Rokuro Uchida built Japan’s
first A-mode instrument in 1949, simultaneously with John Wild in the United
States(9). Some of the first reports about the diagnostic value of ultrasound came
from George Ludwig, United States(10), John Wild, United States(11) and Karl
Dussik, Austria(12). The compound 2,5 megahertz (MHz) two dimensional B-mode
25
was constructed by Ian Donald in 1957(13). John Wild and John Reid developed a
small sonographic probe for the rectum in 1957(14). A similar device was used by
Hürter et al. in the first report about endobronchial ultrasound with a rotating
miniprobe in the lungs(15). The miniprobe was commercially available in 1999.
Kurimoto et al. described in 2004 the use of a guide sheath which was guided into the
correct position with a curette(16). The curette is a bendable device; it can be rotated
360 degrees, but must be removed before the miniprobe is inserted for identification
of the lesion.
2.2.3 Lung cancer
Morgagni reported the first case of lung cancer in 1761(17). The disease was rare
until the beginning of the nineteenth century. When Adeler published his report in
1912, he found only 374 published cases with verified lung cancer worldwide(18).
Lung cancer increased like an epidemic during the 19th century. Doll’s famous report
about smoking and lung cancer was published in 1950(19), but Lickint from Germany
assumed the association between lung cancer and smoking already in 1929(20). The
early German reports have often been ignored, probably because they were associated
with the Nazi regime(21).
The age adjusted incidence of lung cancer in Norway was 10.1/100 000 for men and
2.6/100 000 for women in 1954 The incidence increased to 34.2/100 000 for men and
24.8/100 000 for women in 2008(22). Lung cancer in Norway increased from average
285 cases each year in 1954-1958 (220 men and 65 women) to 2529 cases in 2008
(1422 men and 1107 women). Currently lung cancer has the second highest incidence
of all cancers for men and the third highest incidence for women in Norway. In
Norway, 4.4 % of all men and 3.1 % of all women will develop lung cancer by the
age of 75 years(22).
26
Detection of lung cancer
The radiological evaluation of lesions suspicious of malignancy was initiated by
Röntgens discovery in 1895(23) making it possible to visualise hyperdense areas of
the lung parenchyma. The single photon emission computed tomography (SPECT)
device was invented by David Kuhl in 1964(24). SPECT visualised functional
information with a gamma camera that detected injected radioactive isotopes. Godfrey
Hounsfield invented the computed tomography (CT) imaging in 1972(25). CT was
able to give information about small lesions and provided information about the
spatial extension of the lesions. Gordon Brownell and Charles Burnham contributed
to the development of the positron emission tomography (PET) scanner in the 1950’s
and 1960’s(26). The radiopharmaceutical 2-fluorodeoxy-D-glucose (2FDG) was first
administrated to humans by Abass Alavi in 1976(27). Ron Nutt and David Townsend
invented the PET/CT in 2000(28). The PET/CT combines the functional information
from PET with the detailed anatomical CT picture. It is a sensitive device to detect
metastases.
Lung cancer management
Surgery in the lung was first performed by Milton Anthony in 1821(18). The first
lobectomy for lung cancer was performed by H. Morriston Davies in 1912, but Evarts
Graham became known as father of lung surgery with his pneumonectomy of lung
cancer with a surviving patient in 1933(29;30).
Wilhelm Conrad Röntgen discovered the X-rays in 1895 for which he received the
Nobel Prize in physics in 1901(23). Emil Grubbe tried to treat breast cancer with
irradiation the same year(31;32). Tudor Edwards reported a paper in 1946 that
described insertion of radon seeds through the bronchoscope into the bronchus. The
radon seeds were left in situ for several days similar to brachytherapy(33). Johnson
summarised the first randomised studies of irradiation therapy from the 1960’s(34).
Stereotactic irradiation with high irradiation dose in the tumour and low dose in
27
protected vital organs was available for brain tumours in the early 1980’s(35).
Stereotactic body radiation therapy for lung cancer was introduced in 1994-
1995(36;37).
Lois Goodman and Alfred Gilman tried to develop antidotes for the nerve gas
organophosphates in the early 1940’s when they discovered that nitrogen mustards
destroyed lymphatic tissue(38-40). Randomised trials of chemotherapy alone or in
combination with surgery and radiotherapy were initiated in the 1960’s for lung
cancer(41). Combinations with Cisplatin were introduced in the late 1970’s and are
still standard therapy. New insight in the mechanisms of cell growth led to targeting
therapy against tyrosine kinase activity of the epidermal growth factor receptor
(EGFR) in 2002(42).
2.3 Technical description of the endobronchial ultrasound
miniprobe
Ultrasound miniprobes are commercially available from Fujinon and Olympus. The
Fujinon miniprobes are available in different frequencies (12,15,20,25 MHz) and with
outer diameter of 1.9-2.6 mm(43). The miniprobes from Olympus are available with
outer diameter between 1.7 and 2.5 mm (frequencies 12, 20 or 30 MHz)(44).
Olympus also provides a guide sheath that covers the miniprobe when it is inserted
into the lesion(45). The guide sheath remains in the lesion when the miniprobe is
removed, and it can thus guide the insertion of the brush, biopsy equipment or TBNA
needle(16). Miniprobes from Fujinon and from Olympus have a separate driving unit
that rotates the whole probe. There is a single transmitter and a single detector in the
miniprobe. When the transmitter and the detector are rotating, the visual ultrasound
picture is 360 degrees around the miniprobe. The visual output depends on the
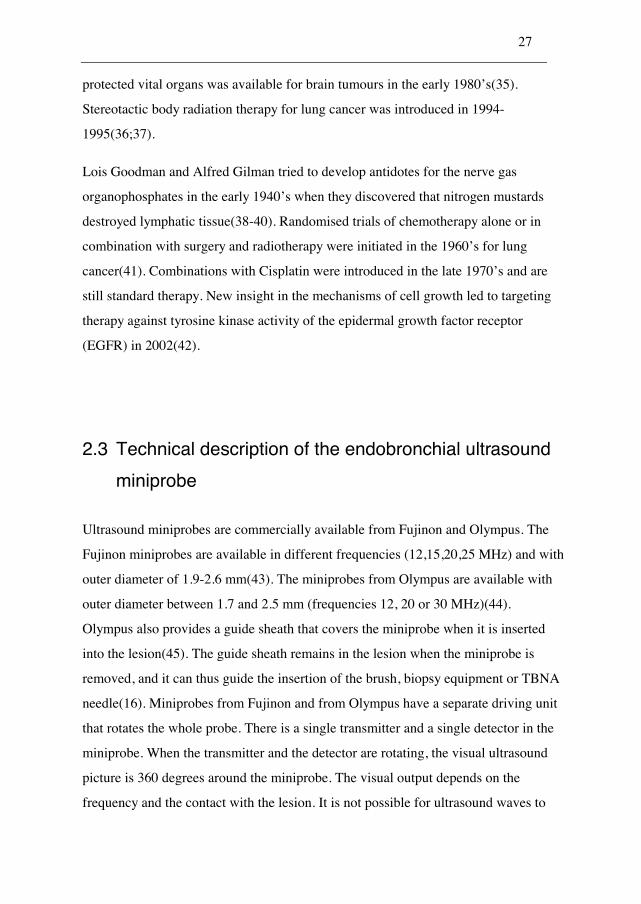
frequency and the contact with the lesion. It is not possible for ultrasound waves to
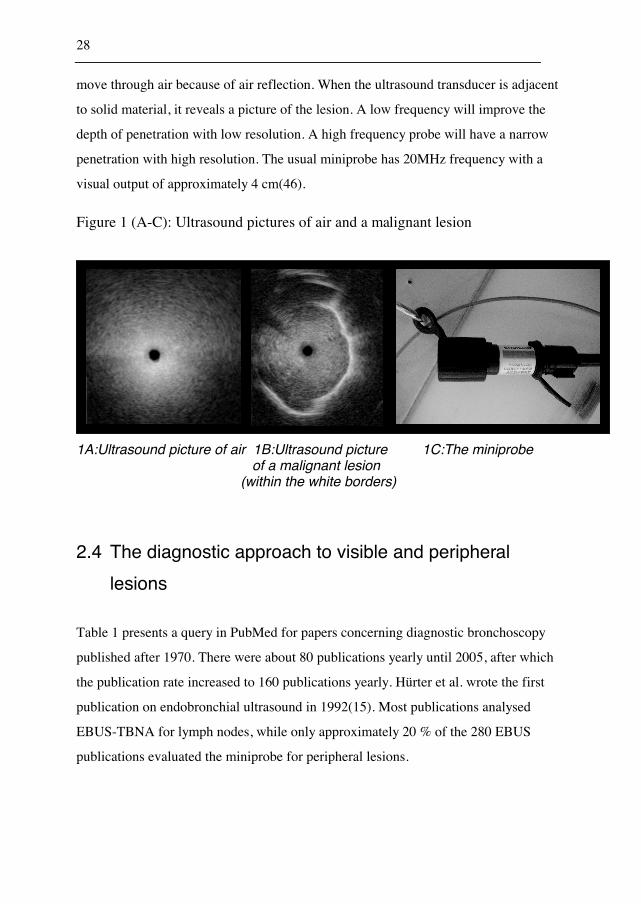
28
move through air because of air reflection. When the ultrasound transducer is adjacent
to solid material, it reveals a picture of the lesion. A low frequency will improve the
depth of penetration with low resolution. A high frequency probe will have a narrow
penetration with high resolution. The usual miniprobe has 20MHz frequency with a
visual output of approximately 4 cm(46).
Figure 1 (A-C): Ultrasound pictures of air and a malignant lesion
1A:Ultrasound picture of air 1B:Ultrasound picture 1C:The miniprobe of a malignant lesion (within the white borders)
2.4 The diagnostic approach to visible and peripheral
lesions
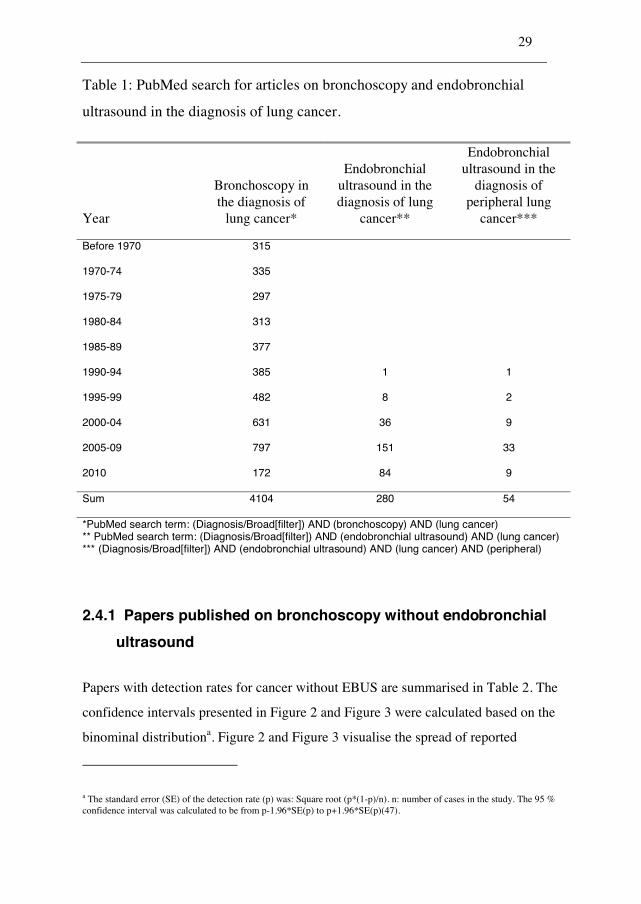
Table 1 presents a query in PubMed for papers concerning diagnostic bronchoscopy
published after 1970. There were about 80 publications yearly until 2005, after which
the publication rate increased to 160 publications yearly. Hürter et al. wrote the first
publication on endobronchial ultrasound in 1992(15). Most publications analysed
EBUS-TBNA for lymph nodes, while only approximately 20 % of the 280 EBUS
publications evaluated the miniprobe for peripheral lesions.
29
Table 1: PubMed search for articles on bronchoscopy and endobronchial
ultrasound in the diagnosis of lung cancer.
Year
Bronchoscopy in the diagnosis of
lung cancer*
Endobronchial ultrasound in the diagnosis of lung
cancer**
Endobronchial ultrasound in the
diagnosis of peripheral lung
cancer***
Before 1970 315
1970-74 335
1975-79 297
1980-84 313
1985-89 377
1990-94 385 1 1
1995-99 482 8 2
2000-04 631 36 9
2005-09 797 151 33
2010 172 84 9
Sum 4104 280 54
*PubMed search term: (Diagnosis/Broad[filter]) AND (bronchoscopy) AND (lung cancer) ** PubMed search term: (Diagnosis/Broad[filter]) AND (endobronchial ultrasound) AND (lung cancer) *** (Diagnosis/Broad[filter]) AND (endobronchial ultrasound) AND (lung cancer) AND (peripheral)
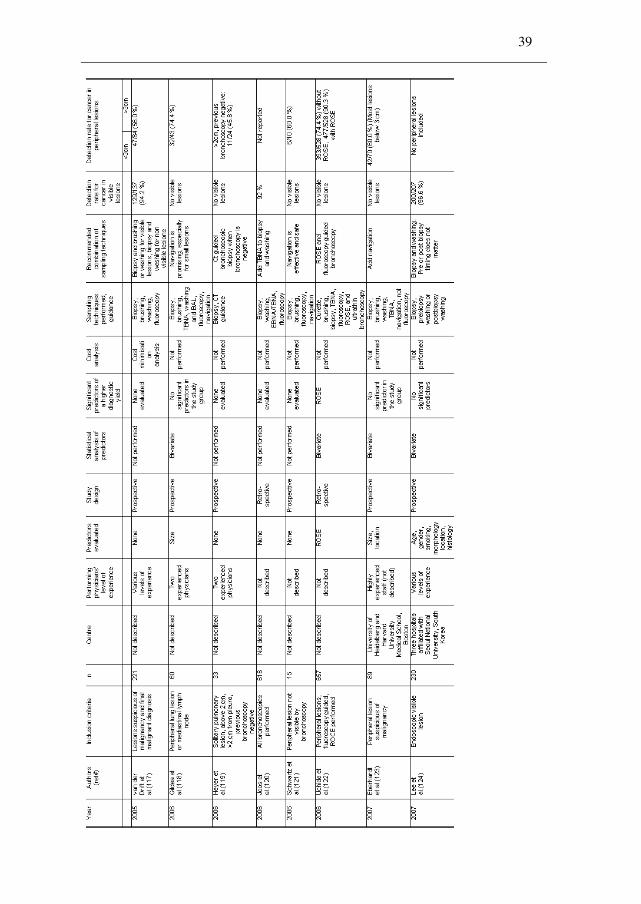
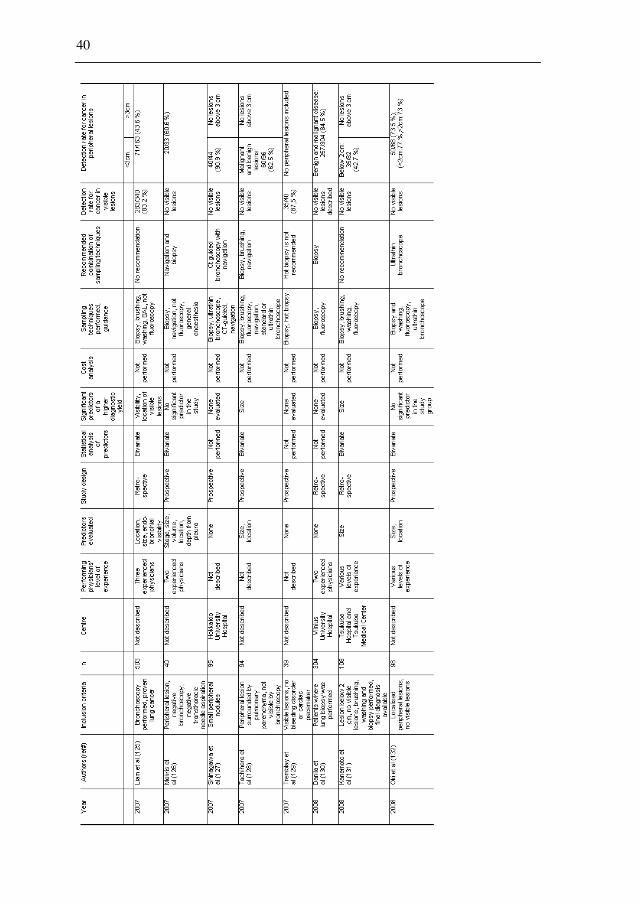
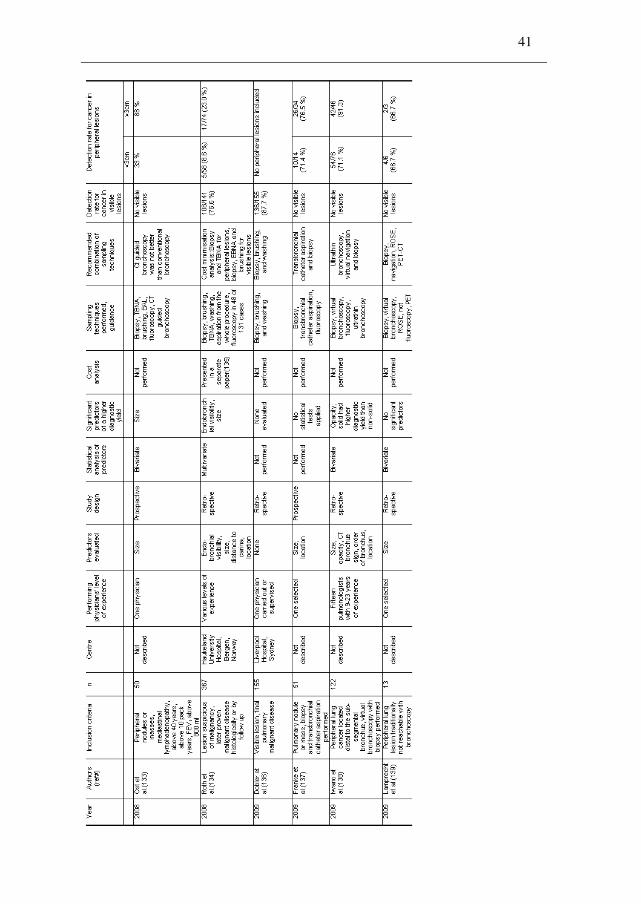
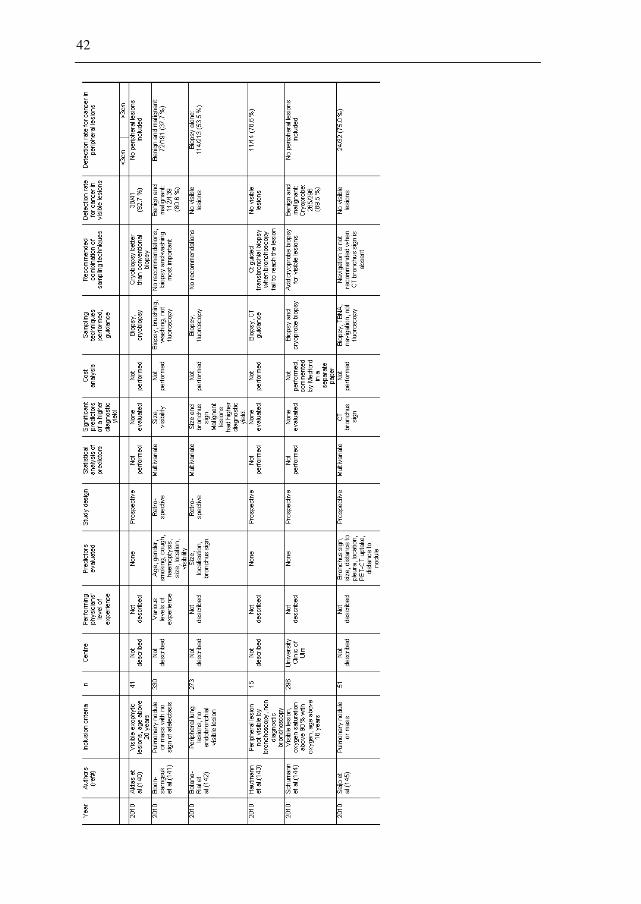
2.4.1 Papers published on bronchoscopy without endobronchial
ultrasound
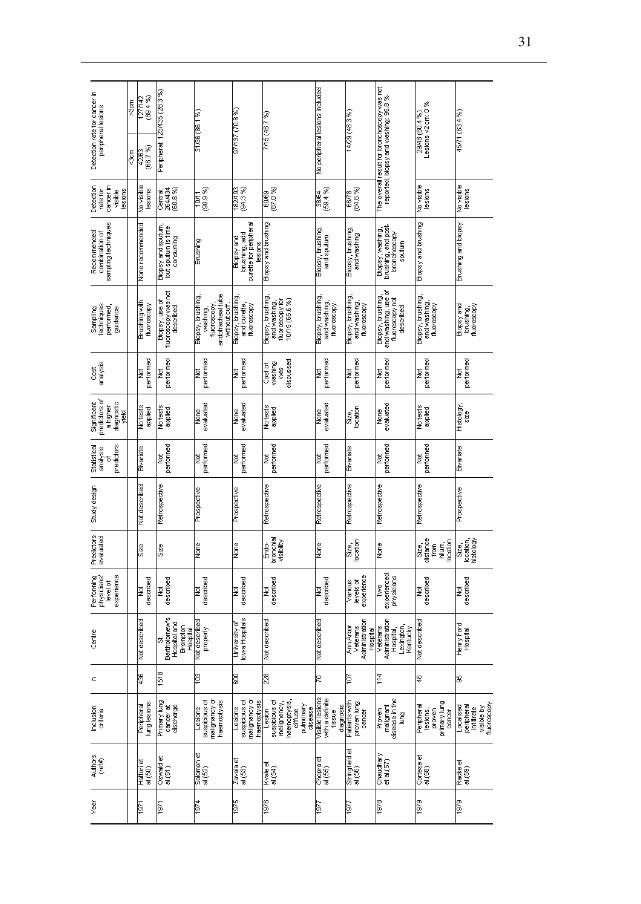
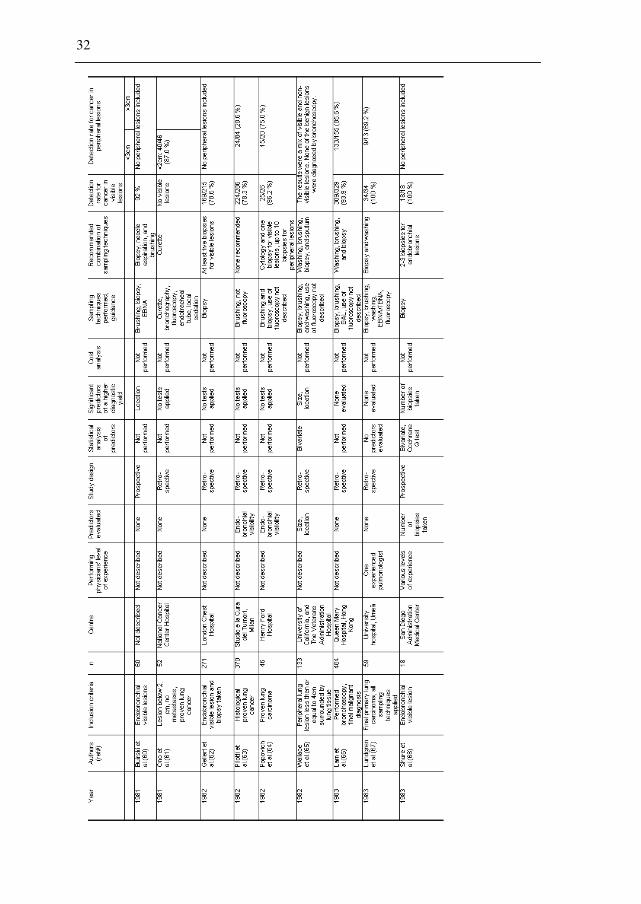
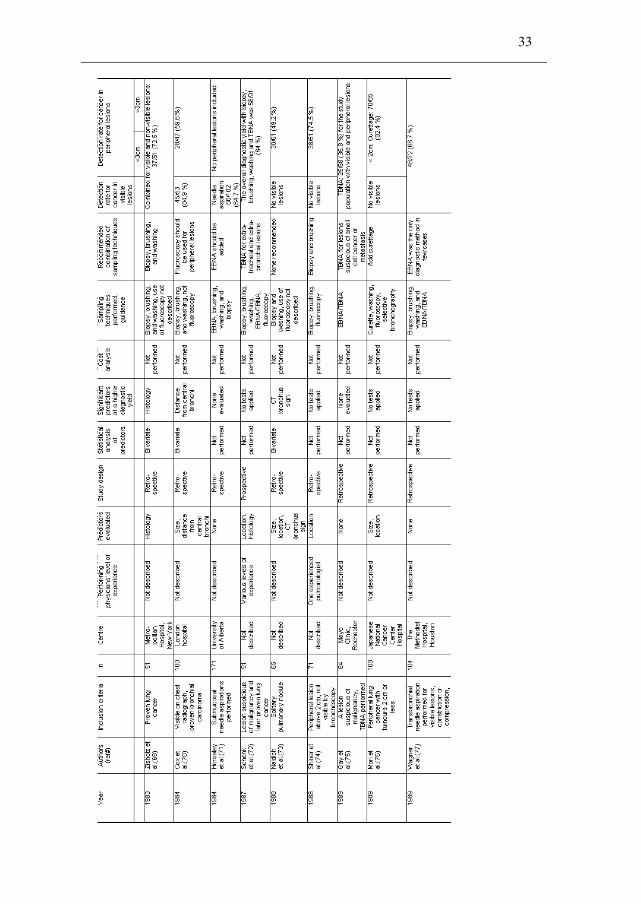
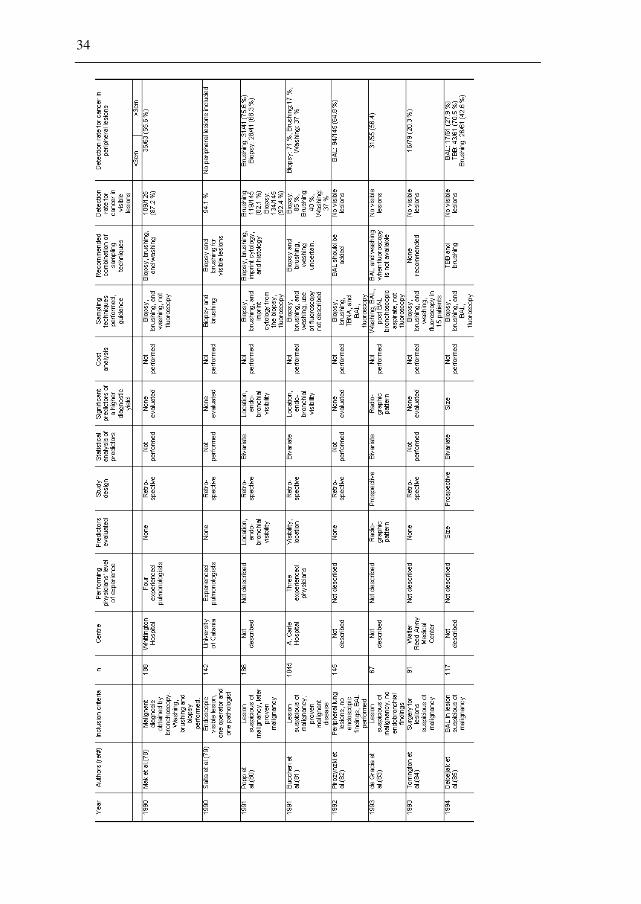
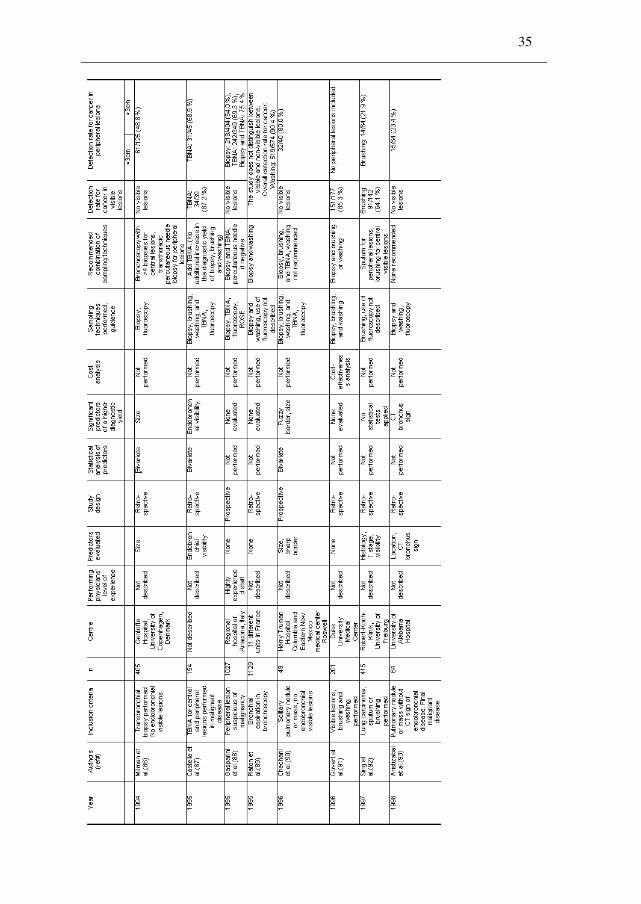
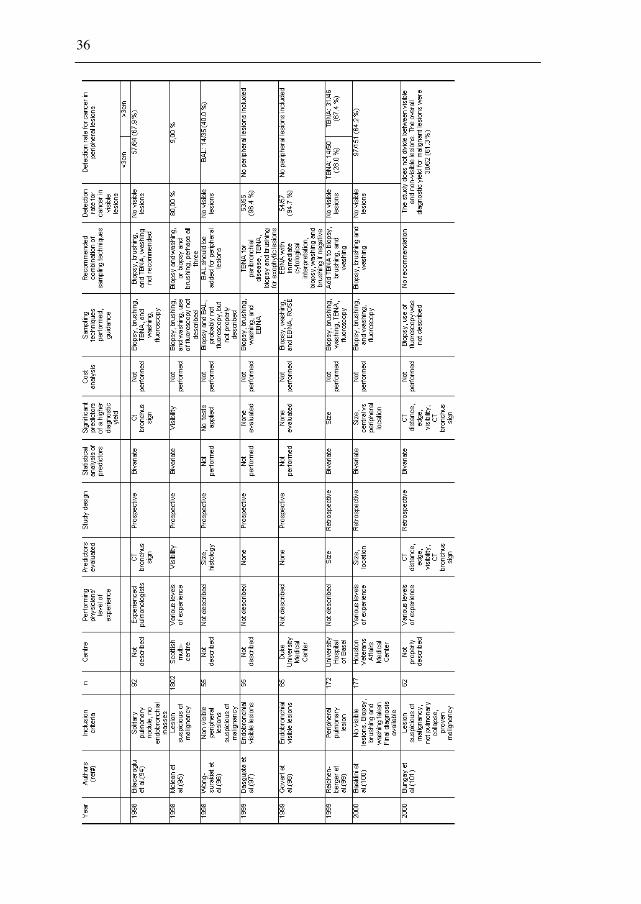
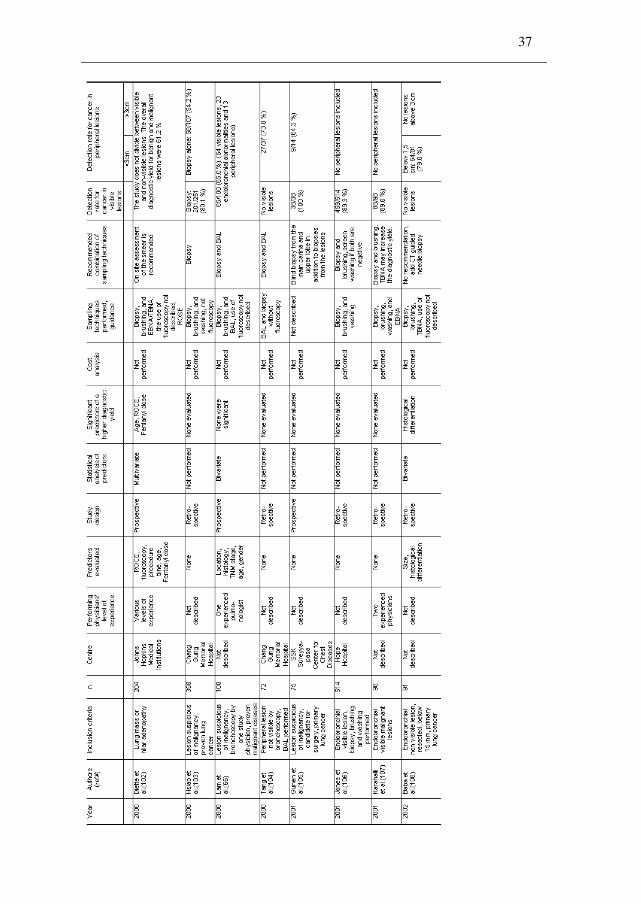
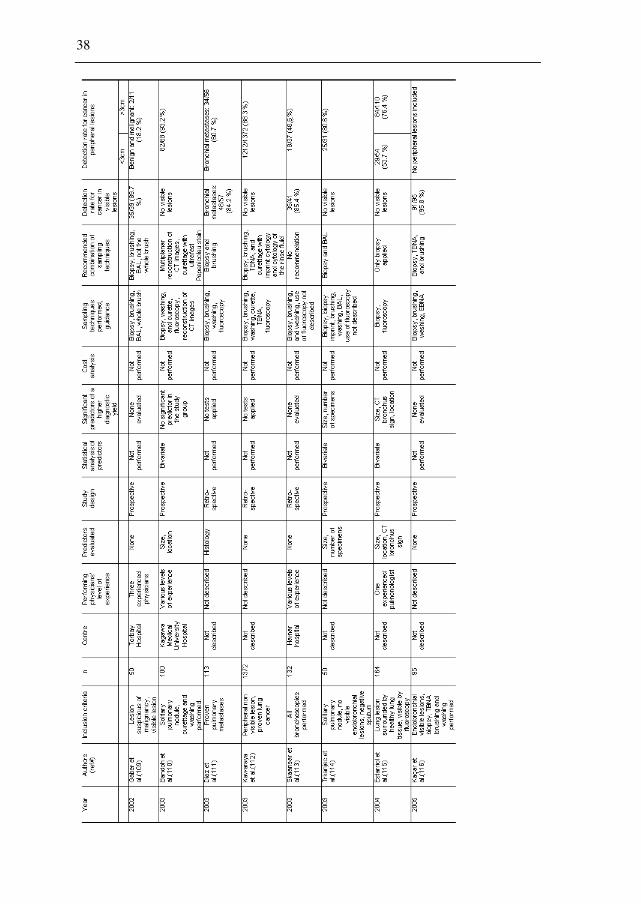
Papers with detection rates for cancer without EBUS are summarised in Table 2. The
confidence intervals presented in Figure 2 and Figure 3 were calculated based on the
binominal distributiona. Figure 2 and Figure 3 visualise the spread of reported
a The standard error (SE) of the detection rate (p) was: Square root (p*(1-p)/n). n: number of cases in the study. The 95 % confidence interval was calculated to be from p-1.96*SE(p) to p+1.96*SE(p)(47).
30
detection rates in papers about bronchoscopy for visible and peripheral lesions
respectively. The papers were identified from Schreiber et al.’s summary of published
evidence(48), Rivera et al.’s evidence-based clinical practical guideline(49), and a
PubMed search. Schreiber et al. searched MEDLINE and Cochrane from 1966 to
2001 for studies that had at least 50 patients with suspected lung cancer. Rivera et al.
updated the search and included studies up to 2004. The PubMed search included
studies from 2000 to 2010. (Search term: (Diagnosis/Broad[filter]) AND
(bronchoscopy) AND (lung cancer) AND (biopsy) AND "2000/01/01"[Publication
Date] : "2010/12/31"[Publication Date]).
Table 2: Published papers with detection rates for cancer in central visible
lesions and in peripheral lesions
31
1971 Hattori et al.(50)
1971 Oswald et al.(51)
1974 Solomon et al.(52)
1975 Zavala et al.(53)
1976 Kvale et al.(54)
1977 Chopra et al.(55)
1977 Stringfield et al.(56)
1978 Chaudhary et al.(57)
1979 Cortese et al.(58)
1979 Radke et al.(59)
1981 Buirski et al.(60)
1981 Ono et al.(61)
1982 Gellert et al.(62)
1982 Pilotti et al.(63)
1982 Popovich et al.(64)
1982 Wallace et al.(65)
1983 Lam et al.(66)
1983 Lundgren et al.(67)
1983
Shure et al.(68)
1983 Zisholz et al.(69)
1984 Cox et al.(70)
1984 Horseley et al.(71)
1987 Schenk et al.(72)
1988 Naidich et al.(73)
1988 Shiner et al.(74)
32
1989 Gay et al.(75)
1989 Mori et al.(76)
1989 Wagner et al.(77)
1990 Mak et al.(78)
1990 Saita et al.(79)
1991 Popp et al.(80)
1991 Buccheri et al.(81)
1992 Pirozynzki et al.(82)
1993 de Gracia et al.(83)
1993 Torrington et al.(84)
1994 Debeljak et al.(85)
1994 Milman et al.(86)
1995 Castella et al.(87)
1995 Gasparini et al.(88)
1995 Piaton et al.(89)
1996 Chechani et al.(90)
1996 Govert et al.(91)
1997 Sing et al.(92)
1998 Aristizabal et al.(93)
1998 Bilaceroglu et al.(94)
1998 Mclean et al.(95)
1998 Wong-surakiat et al.(96)
1999 Dasgupta et al.(97)
1999 Govert et al.(98)
1999 Reichen-berger et al.(99)
2000 Baaklini et al.(100)
2000 Bungay et al.(101)
2000 Diette et al.(102)
2000 Hsiao et al.(103)
2000 Lam et al.(66)
2000 Tang et al.(104)
2001 Gunen et al.(105)
33
2001 Jones et al.(106)
2001 Karahalli et al.(107)
2002 Baba et al.(108)
2002 Gaber et al.(109)
2003 Bandoh et al.(110)
2003 Diaz et al.(111)
2003 Kawaraya et al.(112)
2003
Skaansar et al.(113)
2003 Trkanjec et al.(114)
2004 Estarriol et al.(115)
2005 Kaçar et al.(116)
2005 van der Drift et al.(117)
2006 Gildea et al.(118)
2006 Heyer et al.(119)
2006 Joos et al.(120)
2006 Schwartz et al.(121)
2006 Uchida et al.(122)
2007 Eberhardt et al.(123)
2007 Lee et al.(124)
2007 Liam et al.(125)
2007 Makris et al.(126)
2007 Shinagawa et al.(127)
2007 Tachihara et al.(128)
2007 Tremblay et al.(129)
2008 Danila et al.(130)
34
2008 Kanemoto et al.(131)
2008 Oki et al.(132)
2008 Ost et al.(133)
2008 Roth et al.(134)
2009 Roth et al.(135)
2009 Dobler et al.(136)
2009 Franke et al.(137)
2009 Iwano et al.(138)
2009 Lamprecht et al.(139)
2010 Aktas et al.(140)
2010 Boonsarngsuk et al.(141)
2010 Botana-Rial et al.(142)
2010 Hautmann et al.(143)
2010 Schumann et al.(144)
2010 Seijo et al.(145)
35
36
37
38
39
40
41
42
43
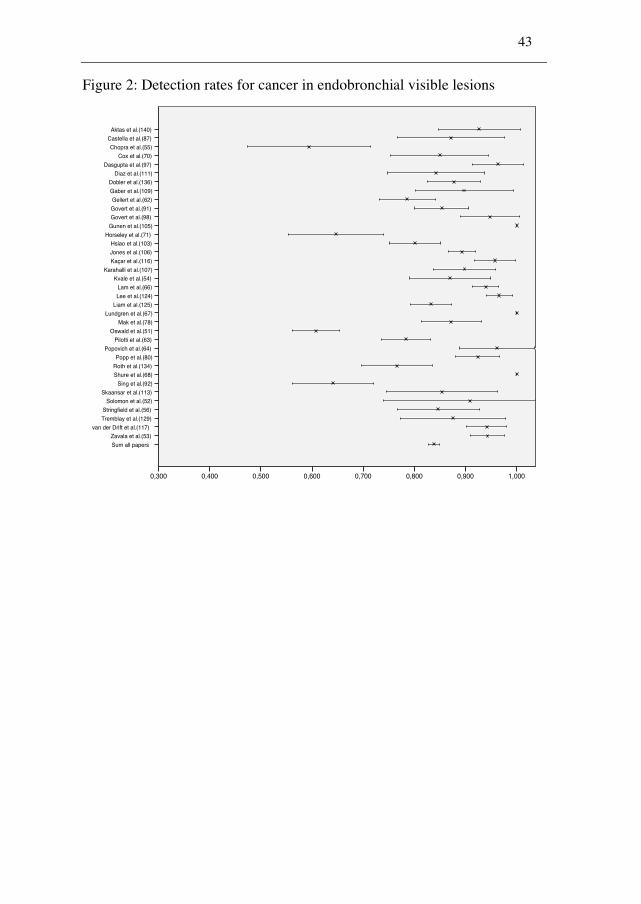
Figure 2: Detection rates for cancer in endobronchial visible lesions
Aktas et al.(140)
Castella et al.(87)
Chopra et al.(55)
Cox et al.(70)
Dasgupta et al.(97)
Diaz et al.(111)
Dobler et al.(136)
Gaber et al.(109)
Gellert et al.(62)
Govert et al.(91)
Govert et al.(98)
Gunen et al.(105)
Horseley et al.(71)
Hsiao et al.(103)
Jones et al.(106)
Kaçar et al.(116)
Karahalli et al.(107)
Kvale et al.(54)
Lam et al.(66)
Lee et al.(124)
Liam et al.(125)
Lundgren et al.(67)
Mak et al.(78)
Oswald et al.(51)
Pilotti et al.(63)
Popovich et al.(64)
Popp et al.(80)
Roth et al.(134)
Shure et al.(68)
Sing et al.(92)
Skaansar et al.(113)
Solomon et al.(52)
Stringfield et al.(56)
Tremblay et al.(129)
van der Drift et al.(117)
Zavala et al.(53)
ZZ Sum all papers
1,0000,9000,8000,7000,6000,5000,4000,300
44
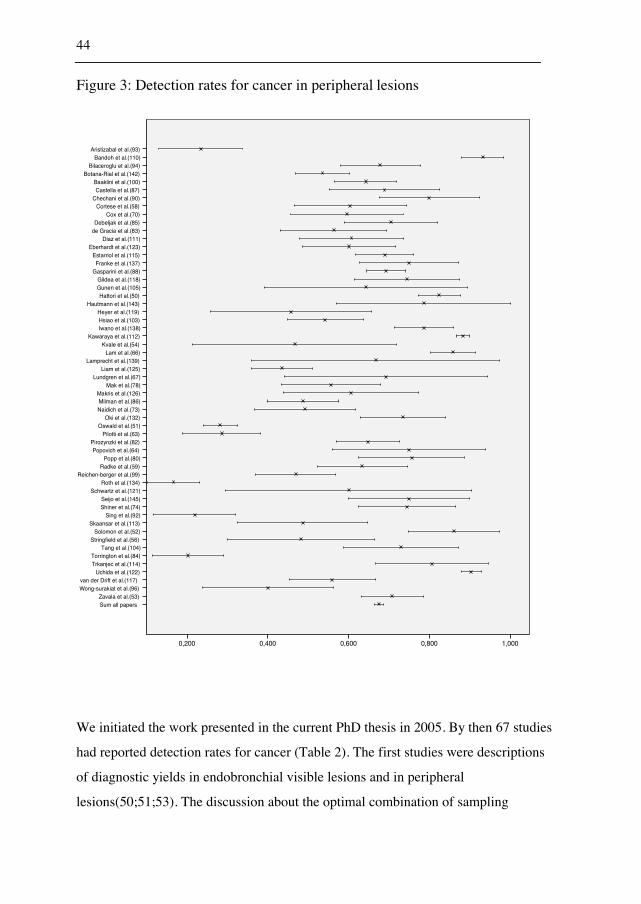
Figure 3: Detection rates for cancer in peripheral lesions
We initiated the work presented in the current PhD thesis in 2005. By then 67 studies
had reported detection rates for cancer (Table 2). The first studies were descriptions
of diagnostic yields in endobronchial visible lesions and in peripheral
lesions(50;51;53). The discussion about the optimal combination of sampling
Aristizabal et al.(93) Bandoh et al.(110)
Bilaceroglu et al.(94) Botana-Rial et al.(142)
Baaklini et al.(100) Castella et al.(87)
Chechani et al.(90) Cortese et al.(58)
Cox et al.(70) Debeljak et al.(85)
de Gracia et al.(83) Diaz et al.(111)
Eberhardt et al.(123) Estarriol et al.(115) Franke et al.(137)
Gasparini et al.(88) Gildea et al.(118) Gunen et al.(105) Hattori et al.(50)
Hautmann et al.(143) Heyer et al.(119) Hsiao et al.(103) Iwano et al.(138)
Kawaraya et al.(112) Kvale et al.(54)
Lam et al.(66) Lamprecht et al.(139)
Liam et al.(125) Lundgren et al.(67)
Mak et al.(78) Makris et al.(126) Milman et al.(86) Naidich et al.(73)
Oki et al.(132) Oswald et al.(51)
Pilotti et al.(63) Pirozynzki et al.(82) Popovich et al.(64)
Popp et al.(80) Radke et al.(59)
Reichen-berger et al.(99) Roth et al.(134)
Schwartz et al.(121) Seijo et al.(145) Shiner et al.(74)
Sing et al.(92) Skaansar et al.(113)
Solomon et al.(52) Stringfield et al.(56)
Tang et al.(104) Torrington et al.(84) Trkanjec et al.(114)
Uchida et al.(122) van der Drift et al.(117) Wong-surakiat et al.(96)
Zavala et al.(53) ZZ Sum all papers
1,0000,8000,6000,4000,200
45
techniques was introduced by Solomon in 1974(52). Previous papers recommended
different combinations of sampling techniques: brushing alone(50;52), biopsy
alone(62;68;86;115), biopsy and sputum(51), biopsy and
brushing(54;58;59;79;81;85;106), or biopsy, brushing and
washing(57;65;69;78;100;146). Some studies used a curette with good results
(53;61;76;110), others recommended to add endobronchial needle aspiration (EBNA)
for visible lesions or TBNA for peripheral lesions(71;72;75;87;88;90;94;97-
99;107;112). Bronchoalveolar lavage (BAL) was recommended in some
papers(66;82;96;104;109;114;147). The papers based the recommendations on the
diagnostic yields. Many studies were without statistical analyses, some used
McNemars test for matched pairs. There were no randomised trials.
When the physician decides the optimal combination of sampling techniques, the
increase in the diagnostic yield and the increase in cost must be considered. The
discussion of costs was introduced by Kvale et al. in 1976(54). Kvale et al.
recommended biopsy and brushing, but not washing. Govert et al. performed a cost-
effectiveness analysis in 1996 (91), but the choice of end-point (quality adjusted days)
made the analysis hard to interpret. The British Thoracic Society Guidelines on
Diagnostic Flexible Bronchoscopy recommended biopsy, brushing, and washing in
2001(148). Rivera et al. recommended addition of TBNA(149). By the initiation of
the current study there was a need of a analysis for the optimal combination of
sampling techniques that included costs and effectiveness.
As previously mentioned, the choice of sampling techniques is only one of the factors
determining diagnostic yield. Previous studies identified different predictors of a
higher diagnostic yield. The first studies identified size and endobronchial visibility as
possible predictors, but no statistical tests were used to confirm the results(50;51;54).
Stringfield et al. identified size and distance from the main carina as significant
predictors of a higher diagnostic yield in 1977(56). The predictors of higher
diagnostic yield identified before the initiation of the current study were:
size(56;59;60;65;85;86;90;99;100;115), location(56;60;65;80;81;115), endobronchial
46
visibility(80;81;87;95), CT bronchus sign(73;93;94;101;115), and radiographic
pattern(90;101;147). With so many different bivariate associations, confounding is a
problem unless a multivariate analysis is performed. The only multivariate analysis
published before the initiation of the current study was in Diette et al.’s report from
2000. The report analysed only rapid on-site evaluation (ROSE) of the cyto-
pathological material(102) and was not adjusted for size or endobronchial visibility.
Figure 2 and Figure 3 displays the diagnostic yields in previous studies for
endobronchial visible lesions and for peripheral lesions. Some previous studies were
from selected patients or from highly specialised centres where only a few physicians
performed the bronchoscopies. There was a need for more studies where all lesions
suspicious of malignancy were included and investigated by physicians with various
levels of experience.
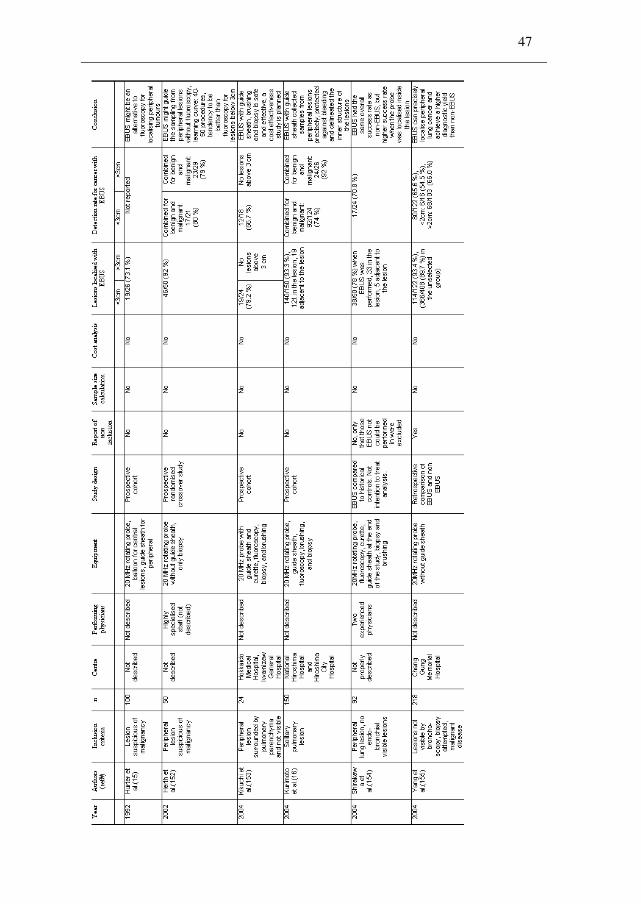
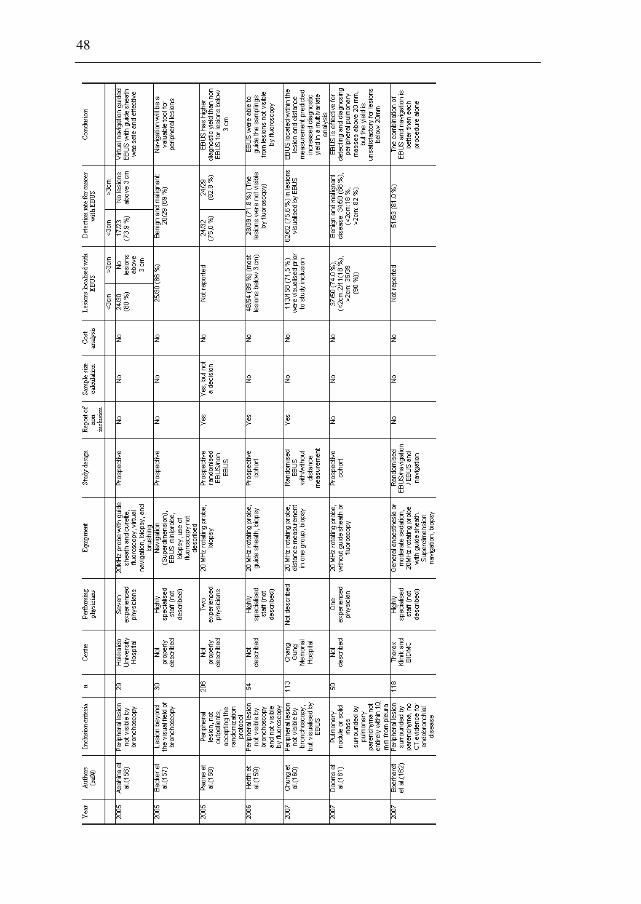
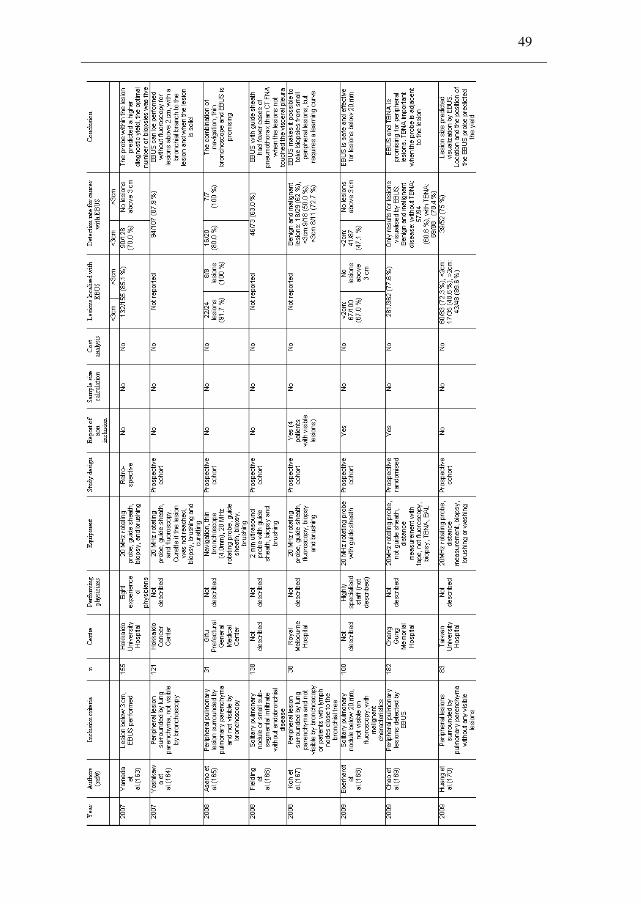
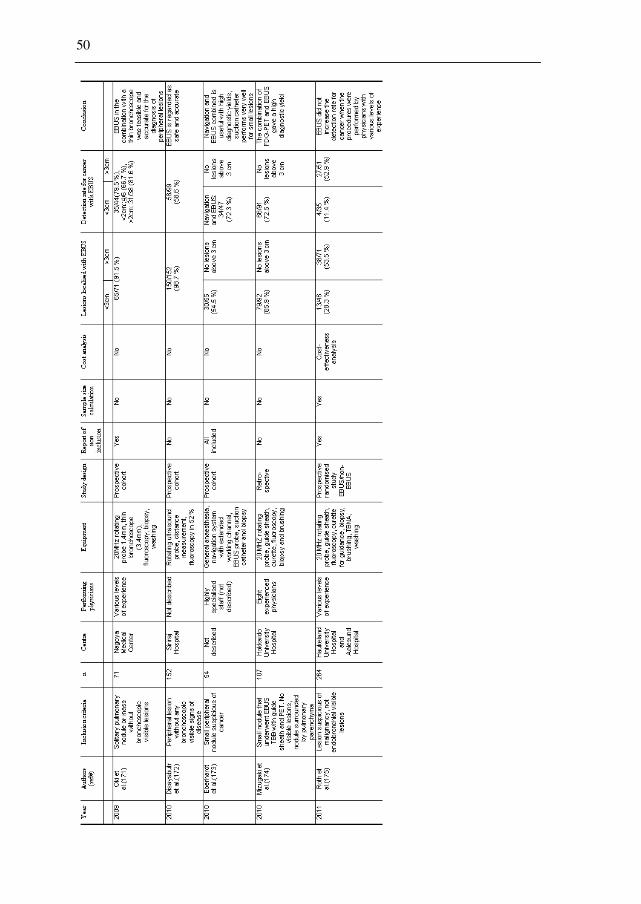
2.4.2 Studies of bronchoscopy with EBUS miniprobe
Table 3 describes the studies of endobronchial ultrasound with a miniprobe for
peripheral lesions. The studies were identified by a search in PubMed and Embase
(Search term: (Diagnosis/Broad[filter]) AND (endobronchial ultrasound) AND (lung cancer) AND
(peripheral)). Steinfort’s metaanalysis(150) and Anantham’s review(151) were searched
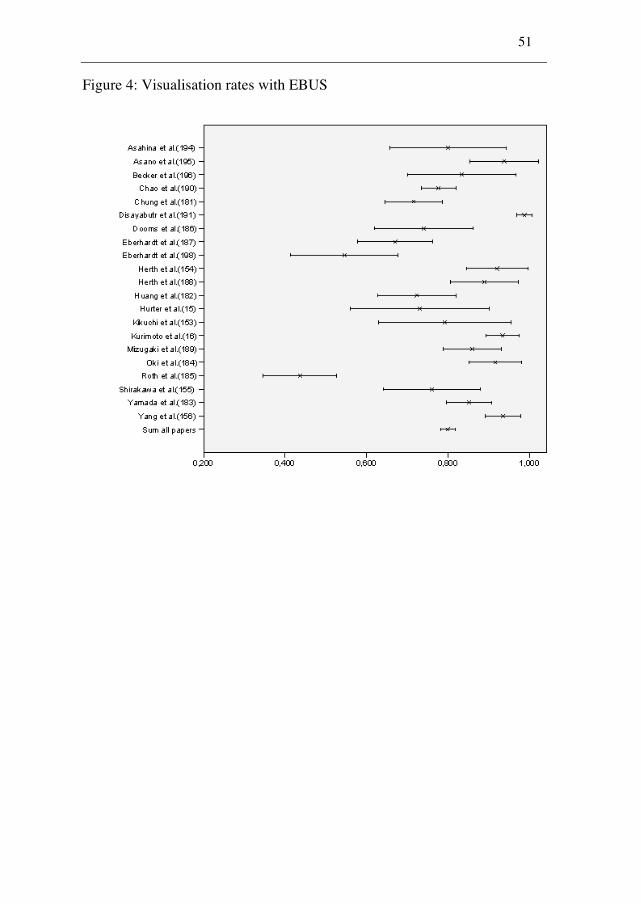
for additional papers. Figure 4 and Figure 5 display the visualisation rates and the
detection rates for cancer with confidence intervals, stratified by the physicians’ level
of experience.
Table 3: Visualisation rates and detection rates for peripheral lesions in studies
with an EBUS miniprobe
47
1992 Hurter et al.(15)
2002 Herth et al.(152)
2004 Kikuchi et al.(153)
2004 Kurimoto et al.(16)
2004 Shirakawa et al.(154)
2004 Yang et al.(155)
2005 Asahina et al.(156)
2005 Becker et al.(157)
2005 Paone et al.(158)
2006 Herth et al.(159)
2007 Chung et al.(160)
2007 Dooms et al.(161)
2007 Eberhardt et al.(162)
2007 Yamada et al.(163)
2007 Yoshikawa et al.(164)
2008 Asano et al.(165)
2008 Fielding et al.(166)
2008 Koh et al.(167)
2009 Eberhardt et al.(168)
2009 Chao et al.(169)
2009 Huang et al.(170)
2009 Oki et al.(171)
2010 Disayabutr et al.(172)
48
49
2010 Eberhardt et al.(173)
2010 Mizugaki et al.(174)
2011 Roth et al.(175)
50
51
Figure 4: Visualisation rates with EBUS
52
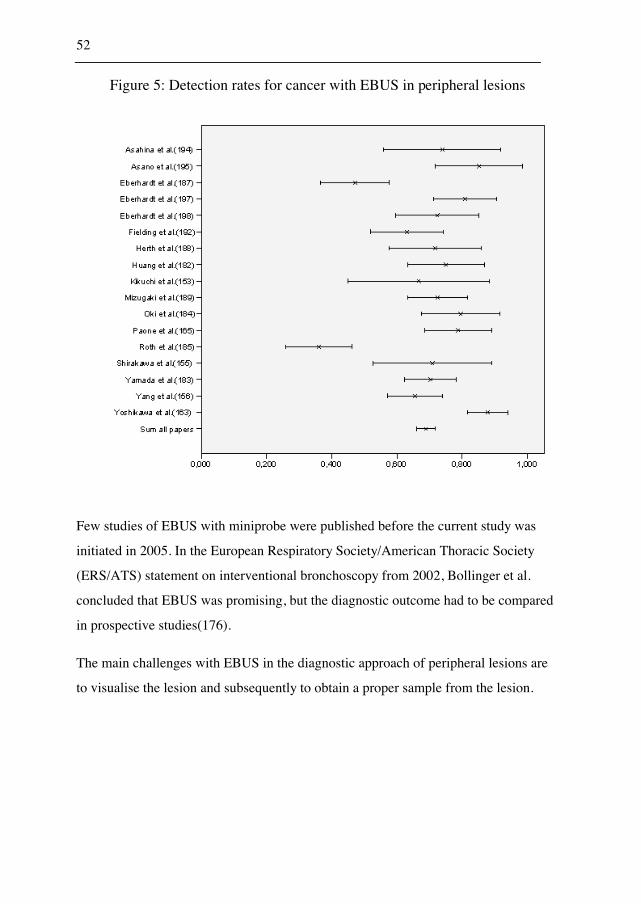
Figure 5: Detection rates for cancer with EBUS in peripheral lesions
Few studies of EBUS with miniprobe were published before the current study was
initiated in 2005. In the European Respiratory Society/American Thoracic Society
(ERS/ATS) statement on interventional bronchoscopy from 2002, Bollinger et al.
concluded that EBUS was promising, but the diagnostic outcome had to be compared
in prospective studies(176).
The main challenges with EBUS in the diagnostic approach of peripheral lesions are
to visualise the lesion and subsequently to obtain a proper sample from the lesion.
53
1) Visualisation of the lesions
Hurter et al. visualised 73 % of the lesions in his first report(15). Kikuchi et al.
reported a high visualisation rate for lesions below 3 cm (79 %)(153). Kurimoto et al.
visualised 80 % inside the lesion and 13 % adjacent to the lesion(16). Overall the
visualisation rates in the studies published before 2005 was between 73 % and
93 %(15;16;152-155).
2) Detection rates for cancer
Only studies that reported the detection rate for cancer were included in Figure 5. The
detection rates for cancer in studies before 2005 were 55 % for lesions below 2
cm(155), 66.7 % for lesions below 3 cm(153) and overall between 66 % and 71
%(153-155).
There were few comparative studies between EBUS and conventional sampling
techniques before 2005. Herth et al. published a randomised crossover study that
included 50 patients. They performed most of the procedures in general anaesthesia
with highly trained staff. The procedures were performed with EBUS and without
EBUS in each patient. The patients were randomised to EBUS first or non-EBUS
first. The knowledge of the correct position with EBUS could bias the results from the
non-EBUS group. The diagnostic yield for benign and malignant disease was 76 %
without EBUS, compared to 80 % with EBUS, but there was a trend for EBUS to be
superior for lesions smaller than 3 cm(152). Shirakwa et al. compared the results of
EBUS performed by two physicians to a historical group with patients investigated by
the same physicians(154). The detection rate for cancer was 71 % with EBUS
compared to 70 % in the historical control group without EBUS. Yang et al.
retrospectively compared EBUS to non-EBUS(155). The detection rate for cancer was
66 % in the EBUS group compared to 43 % in the non-EBUS group (p<0.01).
54
When the current study was initiated, the usefulness of EBUS was unknown in a
setting where pulmonologists at various levels of experience performed the
bronchoscopies.
2.5 Evaluation of costs and effectiveness in diagnostic
approaches
2.5.1 Cost analyses of strategies
Several analyses are available to evaluate the costs and the effectiveness of diagnostic
strategies. The most common analyses are the cost-benefit analysis, the cost-utility
analysis, the cost-minimisation analysis and the cost-effectiveness analysis(177). The
cost-benefit analysis measures the cost and the outcome (benefit) in monetary values.
One type of cost-benefit analysis compares the cost of the strategy to the average
willingness to pay for the outcome(178). The cost-utility analysis presents the number
of utility measurement units a strategy can achieve. The most common utility-based
measurement is the quality adjusted life year (QALY). The cost-utility analysis
calculates the number of QALY gained by each strategy. Alternative strategies can be
compared by calculations of cost per QALY(179). The cost-minimisation analysis
compares the costs of different strategies to a similar outcome(180). All costs of the
different strategies are calculated and the costs are compared to find the least costly
strategy. The cost-effectiveness analysis compares the increase in cost with the
increase in effectiveness. The incremental cost-effectiveness ratio (ICER) gives the
costs per life year gained, per symptom free day or for an additional positive sample.
These costs can be compared for different strategies and sensitivity analyses can
reveal the threshold values for costs and effectiveness measurements(181;182). The
threshold values are the highest cost or the lowest effectiveness for the strategy to be
55
cost-effective. The willingness to pay decides whether a strategy with higher costs
and higher effectiveness is cost-effective or not.
2.5.2 Costs
There are different types of costs: the health service costs, the costs held by the
patients, and external costs for the society. The health provider’s perspective includes
only costs for the hospital; the patient’s perspective includes only costs for the patient.
The recommended perspective is the societal perspective which include all costs for
the health provider, the patient, and the society(182). The value of the investment and
the reward will be valued differently at different times. An investment in the future is
less valued and the value of a future reward is less valued than a present reward.
Economical analyses discount the monetary value of the costs and the rewards, but the
discussion about the discount rate is not settled. A range between 3 % and 6 % yearly
might be appropriate(180;182).
2.5.3 Effectiveness
In the comparison of different combinations of sampling techniques, the increase in
the diagnostic yield is easy to interpret. The diagnostic yield can be the effectiveness
measurement. The incremental cost divided by the incremental effectiveness (ICER)
will represent the cost of an additional positive sample. Another option is to evaluate
the average cost to diagnosis for different strategies in a cost-minimisation analysis.
Two previous studies analysed costs of different combinations of sampling
techniques. Govert et al. introduced quality reduced days as an effectiveness
measurement(91). The willingness to pay was calculated to 500$ for avoiding a
reduced quality of life day in the diagnostic approach. Biopsy and brushing, or biopsy
56
and washing was recommended for endobronchial visible lesions. Sensitivity analyses
revealed that brushing or washing had to increase the diagnostic yield of
bronchoscopy with more than 3 % to be cost-effective. Van der Drift et al. analysed
the addition of brushing and washing to biopsy with simulation of costs. The average
costs of transthoracic sampling, mediastinoscopy, and thoracotomy were added when
a diagnostic sampling technique was removed(117). A cost-minimisation analysis
recommended biopsy with brushing or washing for visible lesions. For non-visible
lesions, the paper recommended biopsy and washing. Van der Drift et al. stated that
there was a need for additional studies that compared costs and effectiveness in
combinations of sampling techniques for visible lesions and peripheral lesions.
Paper 2 in the current study presented a cost-minimisation analysis for visible lesions.
The analysis assumed that all lesions were diagnosed within three bronchoscopies.
The cost-effectiveness analysis in Paper 3 used the diagnostic yield as the
effectiveness measurement.
57
3. AIMS
The main aim of the study was to identify weak points in the diagnostic process of
lung cancer, to improve the diagnostic yield, and to avoid the use of unnecessary
sampling devices. An effective diagnostic approach will reduce the waiting time for
the patient and will be cost-effective for the institution. The current study limited the
evaluation of the diagnostic approach to three aims:
(1) To evaluate various predictors for a higher diagnostic yield in bronchoscopy.
(2) To evaluate different combinations of sampling techniques in bronchoscopy of
endobronchial visible lesions and peripheral lesions not visible by bronchoscopy.
(3) To evaluate endobronchial ultrasound (EBUS) with a rotating miniprobe for
peripheral lesions in a real-life situation among pulmonologists at various levels of
expertise.
58
4. MATERIAL AND METHODS
The retrospective cohort study evaluated different predictors of the diagnostic yield in
bronchoscopy, and compared different combinations of sampling techniques for
visible lesions. The prospective open randomised trial evaluated the effectiveness of
endobronchial ultrasound for peripheral lung lesions, and compared different
combinations of sampling techniques for peripheral lesions in a cost-effectiveness
analysis.
4.1 Study design for the retrospective study
Kjetil Roth (KR) and Tomas Mikal Eagan (TME) read the bronchoscopy reports and
registered the indications and the findings in all 1438 bronchoscopies performed in
2003 and 2004 at Haukeland University Hospital. The follow-up included 493
patients with lesions suspicious of malignancy and lasted to November 2005. Of the
493 patients, 367 had malignant disease. We excluded four patients without any
samplings. Thus, 363 patients remained in the final analysis presented in Paper 1.
59
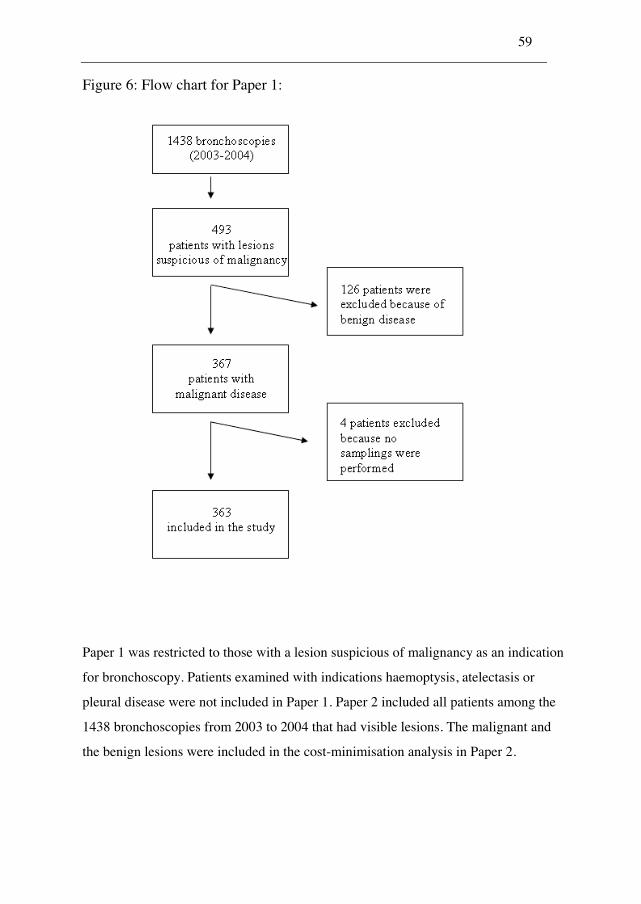
Figure 6: Flow chart for Paper 1:
Paper 1 was restricted to those with a lesion suspicious of malignancy as an indication
for bronchoscopy. Patients examined with indications haemoptysis, atelectasis or
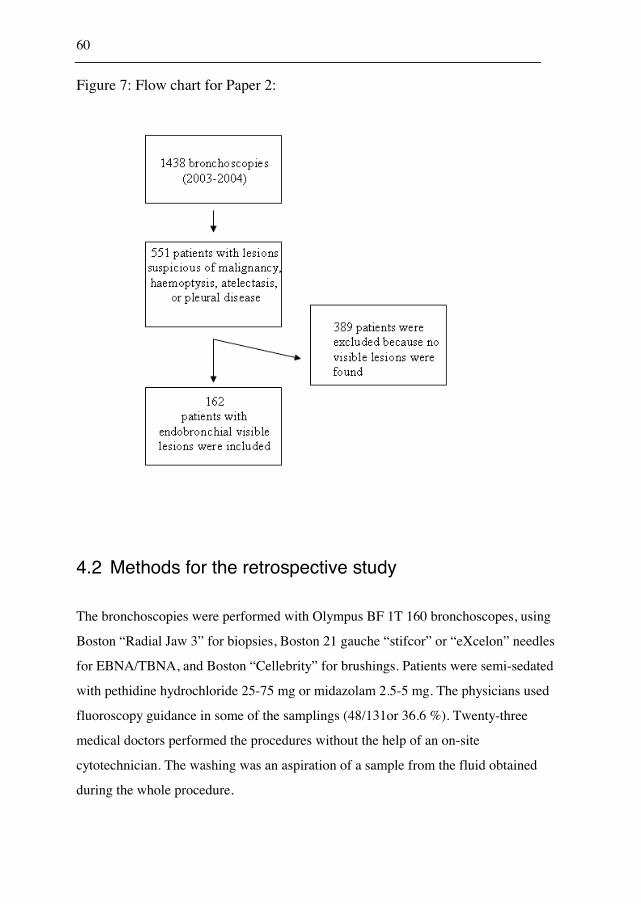
pleural disease were not included in Paper 1. Paper 2 included all patients among the
1438 bronchoscopies from 2003 to 2004 that had visible lesions. The malignant and
the benign lesions were included in the cost-minimisation analysis in Paper 2.
60
Figure 7: Flow chart for Paper 2:
4.2 Methods for the retrospective study
The bronchoscopies were performed with Olympus BF 1T 160 bronchoscopes, using
Boston “Radial Jaw 3” for biopsies, Boston 21 gauche “stifcor” or “eXcelon” needles
for EBNA/TBNA, and Boston “Cellebrity” for brushings. Patients were semi-sedated
with pethidine hydrochloride 25-75 mg or midazolam 2.5-5 mg. The physicians used
fluoroscopy guidance in some of the samplings (48/131or 36.6 %). Twenty-three
medical doctors performed the procedures without the help of an on-site
cytotechnician. The washing was an aspiration of a sample from the fluid obtained
during the whole procedure.
61
4.3 Data collection in the retrospective study
An electronic search for procedure codes and a manual search in the planning registry
for all bronchoscopies performed, detected all bronchoscopies done from 2003 to
2004. The indication for bronchoscopy, the endobronchial findings and the
complications was obtained from the bronchoscopy reports. Friedemann Leh (FL)
provided the results from the pathological department electronically in systemised
nomenclature of medicine (SNOMED) codes. KR and TME retrospectively reviewed
the CT scans and the chest radiographs of the patients included in the study; and
registered the size and the location of the lesions. To assure that all patients with
malignant disease were included in the study, KR reviewed SNOMED codes from the
pathological department, the electronically obtained mortality data and all future
medical record diagnoses until November 2005. Patients discharged with a lesion
suspicious of malignancy were followed manually by repeated searches in the patient
medical records until November 2005.
4.4 Processing the data file in the retrospective study
4.4.1 Inconsistencies
KR compared the codes from the patient medical records to the SNOMED codes, any
inconsistencies were looked up manually in medical records. The size of the lesions
was within the possible range. If the nurse registered that a procedure like biopsy,
brushing or TBNA was performed, but no SNOMED code was available, the
procedure was regarded as not performed.
62
Merging errors could occur when the data from the SNOMED registry was merged
with the data set. All SNOMED codes obtained were controlled by the diagnosis
registry and in patient medical records to avoid merging error.
4.4.2 Missing values
The physicians registered the localisations of the lesions based on the appearance in
the CT scan. It was not possible to determine the location in 12 cases. Also, three
additional cases had lesions on both sides and thus 15 cases had indeterminate
location data. The distance from the lesion to the carina was the distance between the
carina and the proximal border of the lesion on the chest radiograph. For the patients
without chest radiographs before the procedure, the physicians measured the distance
on the scout from the CT scan. It was not possible to measure the distance to carina in
40 patients. In four patients with chest radiographs, it was impossible to see the lesion
or to determine the edge of the lesion. In 36 patients without chest radiographs it was
impossible to get a CT scout or to use the scout to determine the distance from carina.
Both the variables distance to carina and location were included in the multivariate
analysis with indeterminate as separate entities.
All sampling techniques (biopsy, brushing, TBNA, and washings) were performed in
only 38 cases with visible lesions, 21 cases with compression of a visible bronchus or
impression of the lesion into the bronchus, and 4 cases with non-visible lesions. The
evaluation of combinations of sampling techniques was restricted to pairs of sampling
techniques. For visible lesions, biopsy and EBNA (n=86), biopsy and brushing
(n=46), and EBNA and brushing (n=47) were evaluated. For non-visible lesions
biopsy and TBNA (n=48), biopsy and brushing (n=42), and TBNA and brushing
(n=51) were evaluated. 162 patients were included in the cost-minimisation analysis
in Paper 2. 127 were biopsied, 50 underwent biopsy and brushing, and 41 biopsy,
brushing, EBNA, and washing.
63
4.4.3 Variables
Paper 1
The main outcome variable was the detection rate of cancer in the first bronchoscopy.
Some patients had multiple bronchoscopies, but only the first bronchoscopy was
included in the analysis. The dichotomous outcome variable was positive for a final
diagnosis obtained by the first bronchoscopy, and negative for negative or uncertain
results from the pathological department. The evaluated predictors for a higher
diagnostic yield were distance from carina, localisation, size, and endobronchial
visibility. The multivariate analysis included age and gender. Age was categorised in
four quartiles. Distance from carina, age, and size were categorised to make the
interpretation easier. The size of the lesions was divided into categories resembling
Chechani’s report from 1996(90). The categories were reduced to only four: I: <2cm,
II: 2-3cm, III: 3-4cm, and IV: >4cm. The distance from the carina of 5 cm
approximately divided the data set in two. Location was divided into categories by
side and by lobe. Mediastinum was treated as a separate entity apart from the lobes.
The cases with indeterminate data were treated as separate entities.
Paper 2
The costs of the different sampling techniques were estimated in Norwegian kroner
(NOK) 2007-value and adjusted to 2004-value with the consumer price index for
Norway. The costs were then recalculated to euro, to be comparable to other
countries. The time consumption of the workers in the bronchoscopy lab and in the
department of pathology were estimated based on 24 bronchoscopies registered in
detail, 25 registries from the pathologist, and 11 registries from the cytotechnicians.
Staff in the department of pathology provided expert opinions for some of the time
estimations. (Appendix A1 describes the calculation of costs.)
64
The diagnostic yield for each combination of sampling techniques was the combined
diagnostic yield for malignant and benign lesions (average detection rate for cancer
and the average ability to give a definite result for benign lesions in the initial
bronchoscopy). The cost-minimisation analysis assumed that the diagnostic yields for
visible lesions were similar in the first, the second, and the third bronchoscopy. The
cost-minimisation model assumed that bronchoscopy secured a diagnosis for visible
lesions within three bronchoscopies. A model with different strategies to a final
diagnosis was built based upon the diagnostic yield of the different combinations of
sampling techniques. The least costly strategy was preferred.
4.4.4 Statistical analyses
Paper 1
Chi-square tests were used to analyse the bivariate relations between the different
predictors and the detection rates for cancer. A p-value below 0.05 was considered
significant. The Chi-square test is valid for independent samples; it compares the
actual distributions to expected distributions. All (observed-expected)2/expected are
summarised and compared to a Chi-square distribution for the actual degrees of
freedom. The p-value represents the probability for the actual distribution to happen
by chance.
A multivariate logistic regression analysis was performed to detect confounding. In
the logistic regression model the probability for a positive diagnosis (y=1) is defined
by a constant (�) and the effect of a variable (�x). p(y=1)=(e�+�x/(1+ e�+�x). Multiple
variables can be evaluated: p(y=1)=(e�+ �1x1+�2x2+�3x3… /(1+ e�+ �1x1+�2x2+�3x3…) where
�1x1 represents the first variable �2x2 the second etc. The predictors are significant
when the confidence interval for e� does not include 1.
65
McNemars test was used to compare different combinations of sampling techniques.
McNemars test of A and B compares the number of cases with A+B- to the number of
cases with A-B+. All statistical analyses in Paper 1 were performed in SPSS(183).
Paper 2
The cost-minimisation analysis was performed in TreeAgePro Healthcare(184). We
constructed a decision model based on the diagnostic yield of different combinations
of sampling techniques and on the estimated cost for each sampling technique. Only
visible lesions were included. We assumed that bronchoscopy secured a diagnosis for
all visible lesions within three bronchoscopies. A comparison of costs and diagnostic
yields calculated the least costly way to a final diagnosis. Sensitivity analyses were
used to compare the costs and the diagnostic yields in the different strategies. The
costs and the diagnostic yields were increased and decreased to reveal the threshold
values for the least costly strategy.
4.5 Approvals for the retrospective study
The Regional Norwegian Ethical Committee (008.05) and the Norwegian Social
Science Data Service (12244) approved the retrospective study.
66
4.6 Study design for the prospective study: study sample
The prospective study was an open randomised trial. The sample size was calculated
to 120 patients in both study arms based on a predicted rise in the diagnostic yield
from 40 % in the non-EBUS group to 60 % in the EBUS group (standard sample size
calculation, �=0.05, power: 90 %). The predicted diagnostic yields were based on
preliminary results of bronchoscopy with fluoroscopy in the retrospective study(134)
for the non-EBUS group, and on previous studies for the EBUS
group(16;152;154;155;164). The inclusion started in June 2005 at the Department of
Thoracic Medicine, Haukeland University Hospital, Bergen. In October 2006 Ålesund
hospital was included as the second centre. There were 289 patients when the
inclusion closed in January 2009. The bronchoscopies revealed 25 patients with
unsuspected visible endobronchial lesions, thus 264 patients remained in the study
population. Based on a quality registry for all bronchoscopies in the study period, it
was possible to identify 130 additional patients that could have been included in the
study. These patients had lesions suspicious of malignancy on the CT scan and the
bronchoscopy registry reported no visible lesions. The main reasons for non-inclusion
were periods with equipment failure, patients not willing to participate, and an
incorrect assumption that there was an endobronchial visible lesion based on the CT
scan.
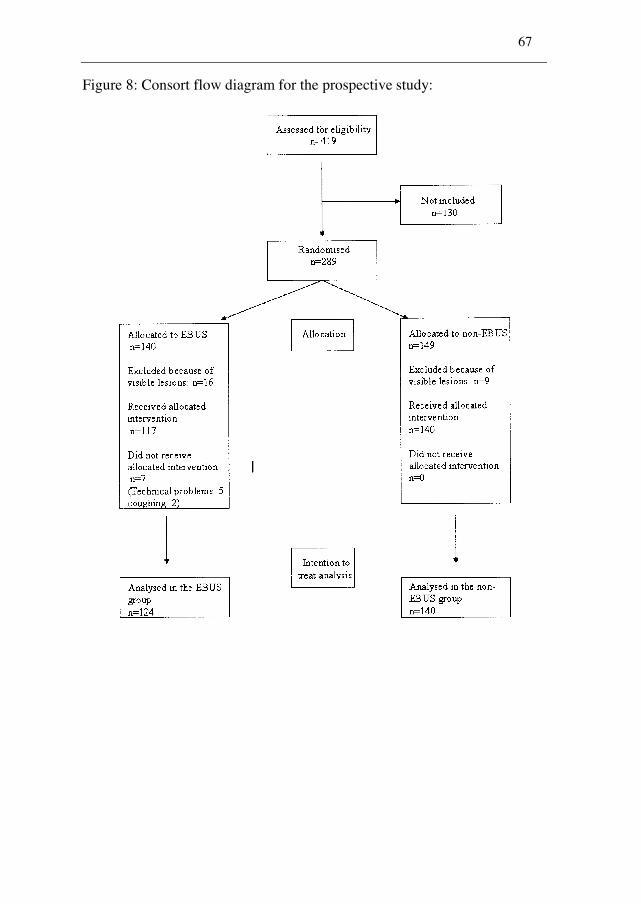
67
Figure 8: Consort flow diagram for the prospective study:
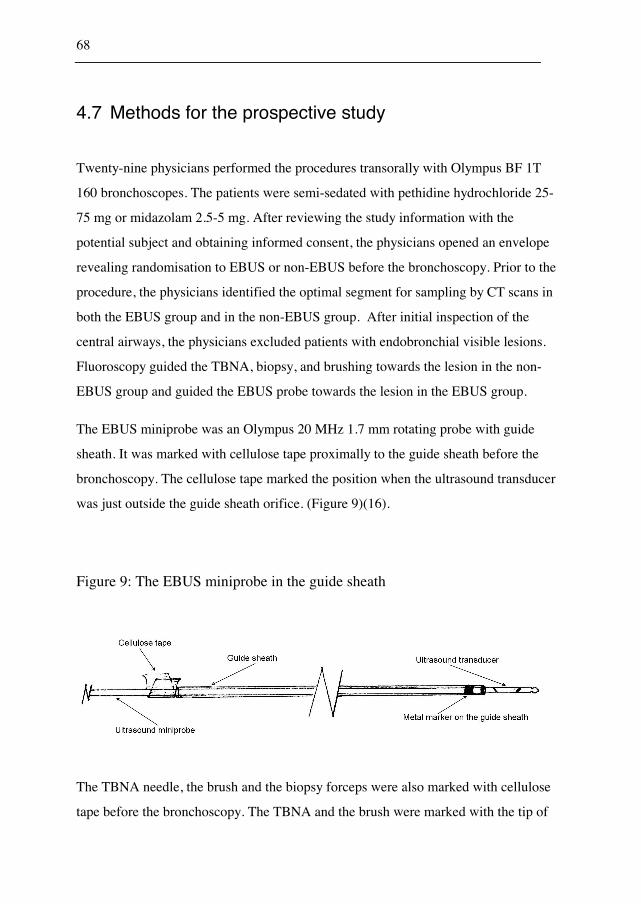
68
4.7 Methods for the prospective study
Twenty-nine physicians performed the procedures transorally with Olympus BF 1T
160 bronchoscopes. The patients were semi-sedated with pethidine hydrochloride 25-
75 mg or midazolam 2.5-5 mg. After reviewing the study information with the
potential subject and obtaining informed consent, the physicians opened an envelope
revealing randomisation to EBUS or non-EBUS before the bronchoscopy. Prior to the
procedure, the physicians identified the optimal segment for sampling by CT scans in
both the EBUS group and in the non-EBUS group. After initial inspection of the
central airways, the physicians excluded patients with endobronchial visible lesions.
Fluoroscopy guided the TBNA, biopsy, and brushing towards the lesion in the non-
EBUS group and guided the EBUS probe towards the lesion in the EBUS group.
The EBUS miniprobe was an Olympus 20 MHz 1.7 mm rotating probe with guide
sheath. It was marked with cellulose tape proximally to the guide sheath before the
bronchoscopy. The cellulose tape marked the position when the ultrasound transducer
was just outside the guide sheath orifice. (Figure 9)(16).
Figure 9: The EBUS miniprobe in the guide sheath
The TBNA needle, the brush and the biopsy forceps were also marked with cellulose
tape before the bronchoscopy. The TBNA and the brush were marked with the tip of
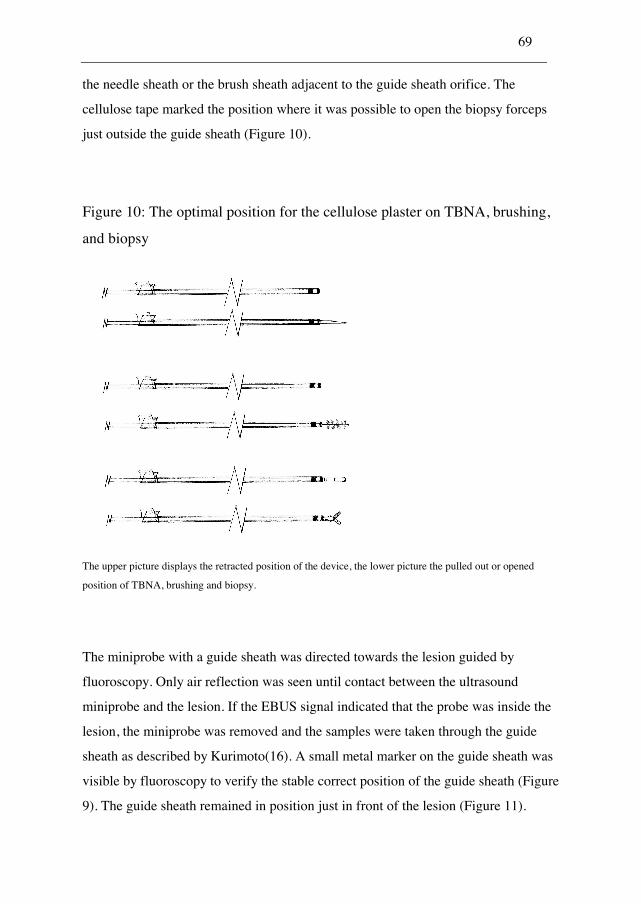
69
the needle sheath or the brush sheath adjacent to the guide sheath orifice. The
cellulose tape marked the position where it was possible to open the biopsy forceps
just outside the guide sheath (Figure 10).
Figure 10: The optimal position for the cellulose plaster on TBNA, brushing,
and biopsy
The upper picture displays the retracted position of the device, the lower picture the pulled out or opened
position of TBNA, brushing and biopsy.
The miniprobe with a guide sheath was directed towards the lesion guided by
fluoroscopy. Only air reflection was seen until contact between the ultrasound
miniprobe and the lesion. If the EBUS signal indicated that the probe was inside the
lesion, the miniprobe was removed and the samples were taken through the guide
sheath as described by Kurimoto(16). A small metal marker on the guide sheath was
visible by fluoroscopy to verify the stable correct position of the guide sheath (Figure
9). The guide sheath remained in position just in front of the lesion (Figure 11).
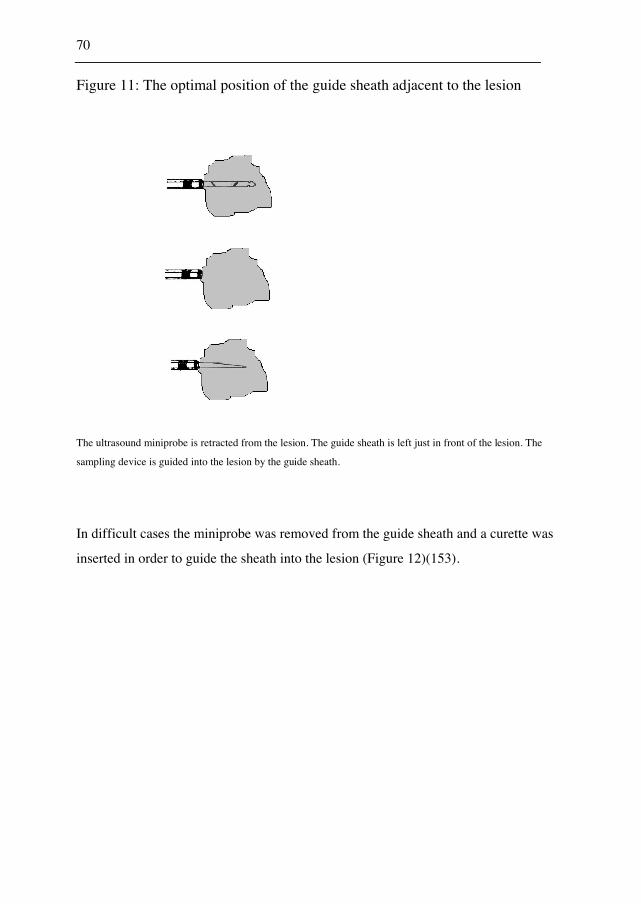
70
Figure 11: The optimal position of the guide sheath adjacent to the lesion
The ultrasound miniprobe is retracted from the lesion. The guide sheath is left just in front of the lesion. The
sampling device is guided into the lesion by the guide sheath.
In difficult cases the miniprobe was removed from the guide sheath and a curette was
inserted in order to guide the sheath into the lesion (Figure 12)(153).
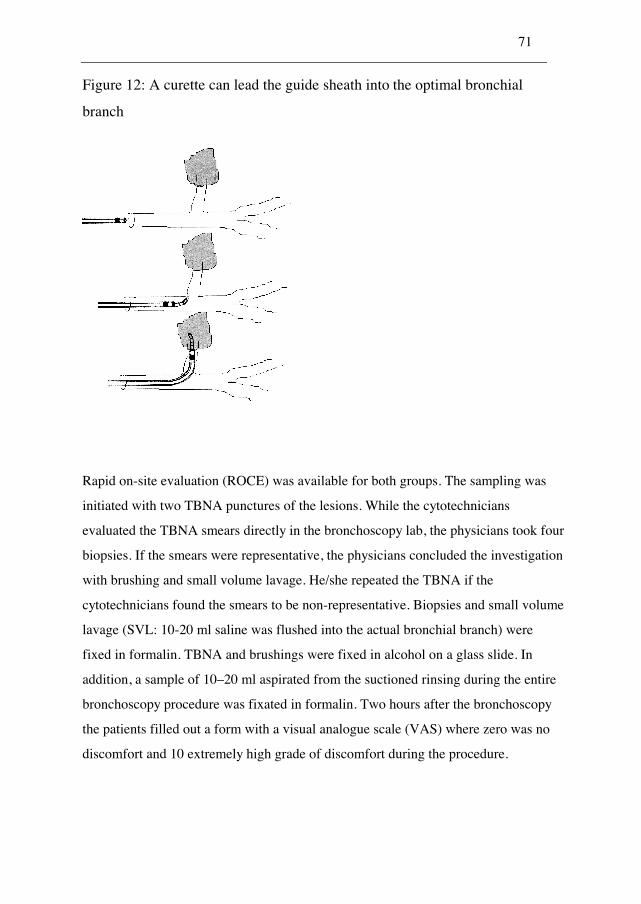
71
Figure 12: A curette can lead the guide sheath into the optimal bronchial
branch
Rapid on-site evaluation (ROCE) was available for both groups. The sampling was
initiated with two TBNA punctures of the lesions. While the cytotechnicians
evaluated the TBNA smears directly in the bronchoscopy lab, the physicians took four
biopsies. If the smears were representative, the physicians concluded the investigation
with brushing and small volume lavage. He/she repeated the TBNA if the
cytotechnicians found the smears to be non-representative. Biopsies and small volume
lavage (SVL: 10-20 ml saline was flushed into the actual bronchial branch) were
fixed in formalin. TBNA and brushings were fixed in alcohol on a glass slide. In
addition, a sample of 10–20 ml aspirated from the suctioned rinsing during the entire
bronchoscopy procedure was fixated in formalin. Two hours after the bronchoscopy
the patients filled out a form with a visual analogue scale (VAS) where zero was no
discomfort and 10 extremely high grade of discomfort during the procedure.
72
4.8 Data collection in the prospective study
KR performed a simple randomisation without stratification in the computer
programme Microsoft Excel. A physician informed the patient about the procedure
and asked if the patient would participate in the study. The patient filled in an
informed consent form. The physician opened a sealed envelope before the
bronchoscopy, with randomisation to EBUS or non-EBUS and excluded patients with
visible endobronchial lesion. The physician registered electronically the findings
during bronchoscopy for the included patients. He/she measured the sizes and
registered the locations based on the CT scans. Whether the lesion was visualised by
EBUS or reached by fluoroscopy were registered. KR followed all patients with a
non-malignant bronchoscopy conclusion until September 2009 unless operation or
autopsy confirmed a malignant diagnosis prior to this. The patients were followed by
searches in the patient medical records and by chest radiograph and CT scan
descriptions. The final diagnosis was obtained electronically from the SNOMED
registry. The diagnosis from the SNOMED code was controlled by diagnoses from
the patients medical records and diagnoses in the death registry. A quality registry
detected the non-included patients.
4.9 Processing the data file in the prospective study
4.9.1 Inconsistencies
Some reports had inconsistencies between randomisation and EBUS performance. KR
controlled these by a manual search in the patient medical records and in the
randomisation sheet. Cases with registered EBUS and randomisation to non-EBUS
were typing errors. If EBUS not was performed in the EBUS group, KR controlled
that the information was true. The codes from the medical records controlled the
73
SNOMED codes. KR controlled all the final SNOMED codes for each patient with
manual searches in the patients’ medical records. The size of the lesions was within
the possible range.
4.9.2 Typing errors
Typing errors could occur in the data obtained from the physician who performed the
bronchoscopy. Typing errors of size and location were possible, but the lesions were
within a reasonable range. KR categorised the difficulty to reach the target based on
the CT scans. This categorisation was not controlled.
Merging errors could occur when the nurse registry was combined with the data filled
in by the physicians and when the SNOMED codes were merged into the data set. KR
controlled that the SNOMED codes for each sampling technique were from the same
date and the same location. The results were confirmed in the diagnosis registry and
by manual follow up in the patient medical records.
4.9.3 Missing values
Though EBUS was not performed in 7 of 124 patients in the EBUS group, these
seven cases were included in the intention-to-treat analysis. KR registered the size and
the location retrospectively when there was missing data. There were no missing
values for baseline characteristics, final diagnoses, or for the predictors of a higher
detection rate for cancer. It was not possible to perform biopsy, brushing, TBNA, and
washing in all cases. The cost-effectiveness analysis included 178 patients with all
sampling techniques performed. The physicians used fluoroscopy in 121 of 124
procedures (98 %) in the EBUS group, 137/140 (98 %) in the non-EBUS group. The
procedure time was registered in all cases, but because the SPSS data entry
74
station(185) made a new file when the programme abruptly was ended, some data
were lost and the procedure time was available for only 221 of 264 cases. 175 of 264
patients completed discomfort forms.
4.9.4 Variables
The main outcome variable was the diagnostic yield in peripheral lesions stratified by
EBUS. The main analyses of sensitivity, specificity, positive predictive value and
negative predictive value included both the malignant and the benign cases. The
subgroup analyses and the multivariate analysis included only the cases with
malignant disease. Size, endobronchial difficulty, endobronchial visibility, and
location were possible predictors for a higher diagnostic yield. Gender and age were
not included in the multivariate analysis because there were no significant
associations with the outcome. Based on previous randomised studies of
endobronchial ultrasound, size was divided into lesions above 3cm and lesions below
3 cm(152;158). KR reviewed all CT scans and classified the endobronchial difficulty
grade. Endobronchial difficulty was divided into four categories based on previous
reports of the CT bronchus sign(93;94) and comparable to Yoshikawa’s three
categories(164). The four categories were: I) A bronchial branch straight to the lesion.
II) No direct path to the lesion, but one or two divisions to pass beyond the visible
divisions. III) No direct path to the lesion, but three or more divisions to pass beyond
the visible divisions. IV) No bronchial branch leading to the lesion. The physicians
excluded patients with endobronchial lesions, but they did not exclude patients with
endobronchial constriction or compression. Endobronchial visibility adjusted the
analysis to avoid confounding from constriction and compression. Location was
analysed by lobe.
The costs of the sampling techniques were from the values presented in Paper 2,
adjusted to euro 2007 value. The willingness to pay for one additional positive sample
75
was 2800 euro based on the cost of one additional bronchoscopy and the cost of five
days in a day ward. The day ward cost was the diagnosis related group (DRG) cost.
The willingness to pay for one additional positive sample represented the average cost
of a repeated investigation.
4.9.5 Statistical analyses
The bivariate analyses were performed with Chi-square tests when the expected
counts in all cells were above 5. The Fisher’s exact test was performed when the
expected count was below 5. A multivariate logistic regression evaluated the results
to avoid confounding and to display interactions. The statistical analyses were
performed in SPSS(183) and the interaction was analysed in STATA(186).
The cost-effectiveness analysis was performed in TreeAgePro Healthcare(184). The
main outcome was defined as the combined diagnostic yield for malignant and benign
lesions in the initial bronchoscopy. All equipment costs and the personnel costs in the
bronchoscopy unit and the pathological department were included and ICER was
calculated. ICER is the increase in cost divided by the increase in effectiveness. It
represents the cost of one additional positive sample. The willingness to pay for one
additional positive sample was the average cost for an additional diagnostic
procedure. The cost-effectiveness analysis compared different strategies with addition
of other sampling techniques to biopsy. Each addition was cost-effective when the
ICER was below the willingness to pay. Sensitivity analyses for costs and detection
rates for cancer revealed the threshold values for each strategy to be cost-effective.
76
4.10 Approvals for the prospective study
The Regional Norwegian Ethical Committee (008.05) and the Norwegian Social
Science Data Service (12244) approved the retrospective study.
The Regional Norwegian Ethical Committee (69.05) and the Norwegian Social
Science Data Service (12562) approved the prospective study. The prospective study
had ClinicalTrials.gov number NCT00398970.
77
5. SYNOPSIS OF PAPERS
The results of these studies are presented in three papers, each published in
international peer-review journals:
5.1 Paper 1
Roth, K., Hardie, J. A., Andreassen, A. H., Leh, F., and Eagan, T. M. L. Predictors of
Diagnostic Yield in Bronchoscopy: a Retrospective Cohort Study Comparing
Different Combinations of Sampling Techniques. BMC Pulmonary medicine 26-1-
2010;8(2).
Bronchoscopy is the main diagnostic method in the diagnostic approach for lesions
suspicious of malignancy in the lung. The predictors of a higher diagnostic yield can
demonstrate the main challenges in the diagnostic process and guide the choice of
sampling techniques. It is important to be aware of these predictors in the evaluation
of studies of bronchoscopy.
The objective of the first paper was to identify the main predictors for a higher
diagnostic yield in bronchoscopy and to compare the diagnostic yield in different
combinations of sampling techniques.
The detection rate for cancer was 17 % in lesions not visible by bronchoscopy, 34 %
when bronchoscopy revealed constriction or compression from the lesion, and 77 %
in procedures with endobronchial visible lesions. Gender, age, size of the lesion,
distance from carina, endobronchial visibility, and location (lobe) were analysed as
possible predictors for a higher diagnostic yield. Endobronchial visibility, size, and
distance from carina were significant in bivariate analyses, but only size and
78
endobronchial visibility remained significant in the multivariate analysis. Biopsy and
TBNA had the highest diagnostic yield among pairs of sampling techniques in visible
and non-visible lesions. The combined diagnostic yield for biopsy and TBNA was
significantly higher than the diagnostic yield for each sampling technique alone.
5.2 Paper 2
Roth, K., Hardie, J. A., Andreassen, A. H., Leh, F., and Eagan, T. M. L. Cost
Minimization Analysis for Combinations of Sampling Techniques in Bronchoscopy
of Endobronchial Lesions. Respiratory Medicine 2009;103(6):888-94.
A comparison of different sampling techniques should simultaneously evaluate both
costs and the diagnostic yields. The objective of the second paper was to find the least
costly strategy for obtaining the final diagnosis of endobronchial visible lesions.
The cost of each sampling technique included the costs in the bronchoscopy unit and
the costs in the department of pathology. The equipment costs and the average time
consumptions for the different groups of employees were calculated. The model
assumed that the diagnostic yield in the second and the third bronchoscopy was
similar to the diagnostic yield in the first bronchoscopy and that bronchoscopy
secured a diagnosis for all cases within three bronchoscopies. The diagnostic yield for
benign and malignant disease increased from 76 % for biopsy alone to 79 % for
biopsy and brushing. Biopsy, brushing, and EBNA had a diagnostic yield of 86 %,
washing did not increase the diagnostic yield. The cost-minimisation analysis revealed
biopsy, brushing and EBNA as the least costly strategy for attaining the final
diagnosis. Biopsy and brushing was less costly than biopsy alone when brushing
increased the diagnostic yield with 2 % and the cost of brushing was below 83 euro.
The combination of biopsy, brushing, and EBNA was less costly than biopsy and
79
brushing when EBNA increased the diagnostic yield with 5 % and the cost of EBNA
was below 205 euro.
5.3 Paper 3
Roth, K., Eagan, T. M. L., Andreassen, A. H., Leh, F., and. Hardie, J. A. A
Randomised trial of Endobronchial Ultrasound guided sampling in Peripheral Lung
Lesions. Lung Cancer 2011 (In Press);doi:10.1016/j.lungcan.2011.02.013
Endobronchial ultrasound with a guide sheath is a possible tool to increase the
diagnostic yield in bronchoscopy of peripheral lung lesions. When the ultrasound
transducer is inside the lesion, the ultrasound picture verifies the position. The guide
sheath can direct the various sampling techniques into the lesion.
The objective of the third paper was to evaluate endobronchial ultrasound for
localising and sampling peripheral lung lesions in a setting with multiple physicians at
various levels of experience. A cost-effectiveness analysis evaluated different
combinations of sampling techniques in peripheral lesions.
The sensitivity for cancer was 36 % in the EBUS group and 44 % in the non-EBUS
group (not significant (NS)). Size and endobronchial difficulty were significant
predictors for a higher diagnostic yield. In the multivariate analysis there was an
interaction between the use of EBUS and lesion size; lesions smaller than 3 cm had a
significantly lower diagnostic yield in the EBUS group compared to the non-EBUS
group.
The detection rate for cancer increased from 37 % for biopsy alone to 44 % for biopsy
and brushing. The cost increased from 50 euro for biopsy alone to 112 euro for biopsy
and brushing. ICER for biopsy and brushing was 1211 euro compared to biopsy
80
alone. This was below the willingness to pay for one additional positive sample (2800
euro). Additional washing or TBNA had ICER of 4761 euro for biopsy, brushing, and
washing and 8262 euro for biopsy, brushing, washing, and TBNA. Both were above
the willingness to pay. Biopsy and brushing was the most cost-effective combination
of sampling techniques for peripheral lesions when brushing increased the diagnostic
yield with minimum 3 % and the cost of brushing was below 142 euro.
81
6. DISCUSSION
6.1 Discussion of the methods
6.1.1 Study design
A retrospective cohort study analysed different predictors of the diagnostic yield and
evaluated different combinations of sampling techniques for endobronchial visible
lesions. A prospective randomised trial evaluated endobronchial ultrasound with a
miniprobe and different combinations of sampling techniques for peripheral lesions.
Generally, a retrospective study is least costly, allows inclusion of all patients, can
detect associations between variables, but cannot prove causal relationships between
exposure and outcome. Only predictors available before the choice of sampling
technique were included in the analysis. Sex, age, size, and location based on the CT
results were available before the bronchoscopy. The physician was aware of the
endobronchial visibility before the sampling started, thus the analysis included
endobronchial visibility as a potential predictor. The histological result was not
available before the bronchoscopy.
The main weakness of the retrospective design is the lack of standardisation. The
physicians performed the procedures without a protocol. The appearance of the
lesions on CT thorax probably influenced the choice of sampling techniques and the
use of fluoroscopy. The physicians applied all sampling techniques in only few cases.
There was a possibility for a selection bias in the evaluation of sampling techniques.
A randomised controlled trial evaluates the effect of the different randomised
modalities on an outcome. The confounding factors will have a similar distribution in
the exposed and non-exposed cases, thus there should be no net effect of the various
confounding factors. A double blind controlled randomised trial also has the
82
possibility to eliminate confounding effects of the physician’s or the patient’s
awareness of the modality choice. In an open prospective trial, the choice of modality
is random, but physicians and patients will be aware of the assigned groups. A
weakness of the prospective trial is the effect of non-inclusion. If the non-inclusion is
random, the results are valid. If selection is limited to a restricted group, the result
will be valid only for groups with similar limitations. The two main weaknesses of the
current prospective trial were the effect of the learning curve and the effect of non-
inclusion. The introduction of new modalities will have a learning curve where the
diagnostic yield gradually increases. The aim of the study was to evaluate
endobronchial ultrasound in a setting where several physicians at various levels of
experience performed the bronchoscopies. The high number of physicians who
participated resulted in only a few included cases for each physician. The results
might have been different with a higher level of experience. The non-inclusion might
have introduced selection bias. The results might have been different with another
selection.
6.1.2 Validity
Validity of a test is the test results compared to a gold standard. Büttner defined
validity as the ability of a diagnostic measure to answer a medical question
correctly(187). Sensitivity and specificity compare the test results to a gold standard.
Sensitivity is the tests ability to detect positive cases; specificity is the tests ability to
score negative cases as negative. The test results will depend on the definition of the
gold standard. If only cases with a final pathological malignant diagnosis are included
in the gold standard, all cases with clinically defined malignant disease will be
excluded. Cases with clinically proven cancer will always have a negative
bronchoscopy and the diagnostic yield will be higher if these cases were excluded. If
clinically defined malignant disease and malignant disease without reconfirmation are
included in the gold standard, these cases will be more prone to false positivity than
83
the cases with malignant disease confirmed by CT-biopsy, operation or autopsy. The
current study tried to reflect a real-life situation. All cases without a confirmed
malignant diagnosis were followed clinically. Clinically proven lung cancer was
included in the gold standard.
Reliability is the stability of the test. The stability is measured by test-retest reliability,
internal consistency or interrater reliability(188). Test-retest reliability measures the
ability to give the same result in a repeated test in the same patient. Internal
consistency is the ability to get the same result in equivalent patients. Interrater
reliability measures the tests ability to get the same result with different observers. It
was not considered ethically acceptable to perform repeated bronchoscopies on the
patients to measure the reliability of the bronchoscopy results.
6.1.3 Internal validity
The internal validity describes the influence of bias and confounding on the results in
the study population. Selection into the study or the information given by the patient
are possible systematic errors or biases. Systematic errors and confounding can
interfere with the results of the study.
Selection bias
Selection bias appears when the selection process disturbs the study results. In the
retrospective study, the physician who performed the bronchoscopy decided on the
use of sampling techniques. In very difficult cases, the physician might have chosen
washing alone. The comparison of different sampling techniques was probably valid
for cases with those sampling techniques performed, but there was a possibility that
cases without the actual sampling techniques were different. Even in the prospective
study, it was not possible to perform all sampling techniques in every case (all
sampling techniques were performed in 178 of 264 cases). The results of the
comparison between the techniques might be prone to selection bias. Brushing
84
increased the diagnostic yield with 9 % (from 64 % to 73 %) in cases with a bronchial
branch going directly towards the lesion. The increase was 7 % (from 33 % to 40 %)
in cases with one or two bronchial divisions to pass before reaching the lesion, and
5 % (from 23 to 28 %) in cases with three or more bronchial branches to pass before
the target lesion. The cases with no bronchial branch to the lesion had no increase in
the diagnostic yield with brushing. This exemplifies that a selection of patients based
on endobronchial difficulty might influence the choice of sampling techniques.
The predictors for a higher diagnostic yield (size and endobronchial visibility) in the
retrospective study were unlikely affected by selection bias. There might have been
some missing cases due to wrong identification from the patient medical records, but
a systematically selection bias was unlikely.
Non-inclusion in the prospective study was a possibility for selection bias as we later
identified 130 additional patients that should have been included in the study. Table 4
compares the non-included patients to the patients in the study. There was a
significant higher rate of men in the study population and a trend for more lesions in
the upper lobe for the non-included cases. Reluctance of women to participate in
randomised studies might be an explanation for the difference in gender. Location and
gender were not significant predictors of the diagnostic yield in the study. A
difference in size between the groups was expected if the physicians were reluctant to
include the difficult cases. There were no differences in size between the included and
the non-included cases.
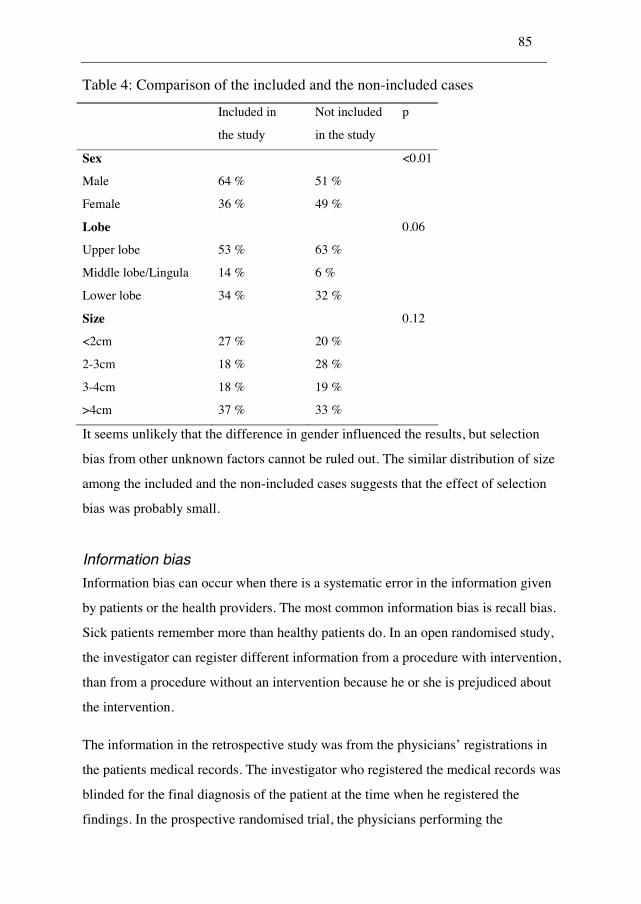
85
Table 4: Comparison of the included and the non-included cases
Included in
the study
Not included
in the study
p
Sex <0.01
Male 64 % 51 %
Female 36 % 49 %
Lobe 0.06
Upper lobe 53 % 63 %
Middle lobe/Lingula 14 % 6 %
Lower lobe 34 % 32 %
Size 0.12
<2cm 27 % 20 %
2-3cm 18 % 28 %
3-4cm 18 % 19 %
>4cm 37 % 33 %
It seems unlikely that the difference in gender influenced the results, but selection
bias from other unknown factors cannot be ruled out. The similar distribution of size
among the included and the non-included cases suggests that the effect of selection
bias was probably small.
Information bias
Information bias can occur when there is a systematic error in the information given
by patients or the health providers. The most common information bias is recall bias.
Sick patients remember more than healthy patients do. In an open randomised study,
the investigator can register different information from a procedure with intervention,
than from a procedure without an intervention because he or she is prejudiced about
the intervention.
The information in the retrospective study was from the physicians’ registrations in
the patients medical records. The investigator who registered the medical records was
blinded for the final diagnosis of the patient at the time when he registered the
findings. In the prospective randomised trial, the physicians performing the
86
bronchoscopies registered the findings. The randomisation was open, but the
physician was not aware of the final diagnosis when he/she registered the
information. Only the registration of the size of the lesions was prone to information
bias due to the open randomisation. The pathologists were not aware of the
randomisation when the diagnoses were reported. KR classified endobronchial
difficulty blinded for the randomisation.
Confounding
Confounding is when other factors, known or unknown, influence on the measured
association between an exposure of interest and a given outcome. The confounding
factors are extraneous to the suggested pathway(189). Confounding can disturb the
results of a cohort study. Randomisation effectively excludes confounding if the
distribution of the confounding factors is even among different groups. Thus, the
evaluation of EBUS was probably not confounded, but the analysis of different
predictors for a higher diagnostic yield might have been confounded in the
retrospective or in the prospective study. The current studies did not include histology
as a possible predictor of the diagnostic yield, though some previous studies
have(59;66;69;92;96;108;111;124). The physician is not aware of the tumour
histology when he/she chooses the guidance methods or the sampling techniques for
the bronchoscopy procedure. The difference in endobronchial visibility of different
cancer types might have confounded the results of histology being a predictor in
previous studies. Sing et al found a central location for small cell lung cancer in 17/23
(74 %) and for adenocarcinoma in 25/64 (39 %)(92).
To minimise confounding, the current study presented bivariate analyses and
multivariate analyses. The bivariate analyses revealed whether the association
between the predictor and the outcome was significant or not. To consider the
confounding effect and to adjust the known predictors properly, multivariate analyses
were performed. Even though the known predictors of a higher diagnostic yield were
included in the retrospective and the prospective multivariate analyses, residual
confounding could still exist.
87
Interactions
Interactions appear when the effect of the association between the variable of interest
and the outcome is inconsistent in different categories of the variable. To avoid
confounding by interactions the data can be stratified and the effect visualised in
different strata of the actual variable(190). There was one interaction between size of
the lesion and use of endobronchial ultrasound in the prospective study. The stratified
data revealed that endobronchial ultrasound had a lower diagnostic yield than
conventional bronchoscopy for small lesions. The physicians performing the
procedures in our study were just starting to learn how to use EBUS. Small lesions
can be difficult to identify with EBUS and small movements on the guide sheath can
displace the sampling position. Thus, the skills of the operator might be more
important for small lesions than for large lesions.
6.1.4 External validity
The external validity evaluates whether the effects found in the study can be
extrapolated to the target population under consideration or not(191). The inclusion
and exclusion criteria and the description of the study population are important factors
for external validity. To consider if studies of bronchoscopy are generally relevant,
the characteristics of the included patient group, the physicians’ level of experience,
and the cost level in the country being studied, should be analysed.
88
Inclusion criteria, exclusion criteria and patient characteristics
Retrospective study
A wide inclusion secured that all patients were evaluated. Only four cases where no
sampling techniques were attempted were excluded. All patients with suspected
malignant disease were included, not only those with a confirmed malignant
diagnosis. The retrospective nature of the study made it possible to include cases at all
levels of difficulty. We believe that the main results of bronchoscopy and the
detection of predictors for a higher diagnostic yield in the current study population
can be generalised to other centres where pulmonologists at various levels of
experience perform the bronchoscopies. Only cases with the actual sampling
techniques performed were included in the analysis of the optimal combination of
techniques. Thus, the results might not be valid for all kinds of lesions.
Prospective study
All cases where physicians found peripheral lesions on CT scans were to be included.
Lesions that were deemed likely to be visible by bronchoscopy were to be excluded.
The patient characteristics revealed that small lesions and hard-to-reach lesions were
included. The non-included cases were not significantly different regarding size. The
results can be generalised for patient populations where all kind of peripheral lesions
are included. Previous studies indicated that endobronchial ultrasound should be
reserved for small lesions(158) and patients with no CT bronchus sign should be
excluded(164). The subgroup analyses from the current study did not support this
selection.
89
The performing physicians’ level of experience
The physicians that performed the bronchoscopies in the retrospective study and the
prospective study were unselected and with various levels of experience. Most of the
physicians were specialists in pulmonology, but trainees participated as well. The
results of the study can be used in a setting where physicians at various levels of
experience perform the bronchosopies. The results of the study may not be applicable
to a practice where only selected sub-specialists in bronchoscopy or endoscopic
ultrasound perform the procedures.
The level of costs
The cost-minimisation analysis in Paper 2 was dependent on the level of costs in the
health care system being studied. The equipment costs may be similar in different
countries, but the wages for the staff and the cost of the waiting time for the patient
will probably be valued differently. The sensitivity analysis in Paper 2 demonstrated
that the results can be generalised if the cost of one day in a day ward was valued
above 311 euro, the total cost of brushing was below 83 euro and the total cost of
EBNA was below 205 euro.
The cost-effectiveness analysis in Paper 3 compared increase in cost to increase in the
diagnostic yield. The willingness to pay for one additional positive sample will
depend on how each health care system values the waiting time and the cost of an
additional diagnostic procedure. The sensitivity analysis in Paper 3 revealed that the
result can be generalised if the cost of brushing was below 142 euro. Acceptability
analyses (not published) revealed that the result can be generalised if the willingness
to pay for one additional positive sample was above 1350 euro and below 4350 euro.
6.1.5 The STARD initiative and the CONSORT statement
The Cochrane Diagnostic and Screening Test Methods Working Group initiated a
working group for improved quality of reporting diagnostic studies in 1999. The
90
Standards for Reporting of Diagnostic Accuracy (STARD) was published in
2003(192). STARD is a 25-item checklist that guides publications and help readers to
judge the potential bias in studies. The checklist clarifies the selection of participants,
recommends a description of methods and results. Paper 1 presented a retrospective
cohort study that reported diagnostic accuracy; the STARD checklist guided the
publication. Paper 1 did not describe test reproducibility (point 13) due to the
consideration that it was unethical to repeat the bronchoscopy in the patients. The
time from test to final diagnosis (point 17), was available, but not described in
Paper 1.
The Consolidated Standards of Reporting Trials (CONSORT) statement was
published in 1996(193) and revised in 2001(194). The CONSORT statement intended
to improve the reports from randomised controlled trials. It recommends that design,
conduct, analysis, and interpretation should be available for the reader with complete
transparency from the authors. The checklist describes a recommendation for the
report of inclusion, a clarification of the outcome, a presentation of the sample size
settled, and the randomisation process. The presentation of the results is summarised
in the report. CONSORT recommends complete transparency from the authors for the
type of analysis (intention-to-treat analysis or not) and for the number of subgroup
analyses performed. A flow diagram visualise the recruitment of cases into the study.
It describes the non-included cases, the excluded cases and the cases lost to follow up.
Paper 3 was a randomised controlled trial, it presented the CONSORT flow diagram
and the checklist guided the publication.
91
6.2 The main methological strengths and weaknesses in
the current study
6.2.1 The retrospective study
Strengths
Design: The retrospective cohort study included all plausible patients, thus sample-
selection bias was unlikely.
Validity: A clinical gold standard controlled the results concerning the final diagnosis.
Bias and confounding: The electronically obtained information avoided information
bias. Multivariate analyses allowed for control of confounding factors based on the
results of bivariate analyses.
Statistical analysis: A cost-minimisation analysis compared the increase in cost to the
increase in diagnostic yield. Sensitivity analyses found threshold values for costs and
increases in diagnostic yields.
External validity: It is possible to generalise the results to a practice where physicians
at different levels of experience do the bronchoscopies.
Weaknesses
Design: A prospective cohort study allows for better planning of the bronchoscopy
procedure, registers the possible predictors and standardise the choice of sampling
techniques. The choice of sampling techniques, and whether to use fluoroscopy, was
left to the physician to decide in the retrospective study.
Validity: The gold standard was a confirmed pathological diagnosis for some patients,
but only clinical follow up for other patients. A presumed effect of cytostatic drugs
might hide a false positive bronchoscopy result in the clinical follow-up.
92
Bias and confounding: The non-standardised selection of sampling techniques made
the result for each sampling technique prone for method-selection bias. Even though
known predictors of a higher diagnostic yield adjusted the multivariate analysis,
unknown factors could confound the results.
Statistical analysis: The cost-minimisation analysis visualise all costs to a common
end-point, but the result of a cost-effectiveness analysis is easier to compare to other
studies. The cost-minimisation analysis does not reveal the price for one additional
positive sample.
External validity: The results cannot be generalised to a practise where only highly
trained staff perform the procedures. The choice of sampling techniques and guidance
was not standardised due to the retrospective nature of the study.
6.2.2 The prospective study
Strengths
Design: The sample size calculation gave the inclusion number. The prospective
design made it possible to plan the investigations and to do the bronchoscopies
standardised. The prospective randomised study is the best study design to evaluate a
diagnostic tool. The intention-to-treat analysis resembles a clinical situation where the
equipment might fail during the procedure.
Validity: A gold standard based on reconfirmation of the pathological results and
clinical follow-up controlled the results. The reconfirmation made it possible to
describe false positive cases. The clinical follow-up avoided exclusion of false
negative cases.
Bias and confounding: There was no difference in tumour size between the non-
included cases and the included cases. A randomised design and a multivariate
analysis protected the analysis against confounding.
93
Statistical analysis: Paper 3 presented all subgroup analyses performed. A
multivariate analysis controlled the bivariate analyses. The comparison of different
combinations of sampling techniques compared the increase in cost to the increase in
diagnostic yield. Sensitivity analyses revealed threshold values.
External validity: The results are comparable to other centres for bronchoscopy of
peripheral lesions when pulmonologists at various levels of experience perform the
investigations.
Weaknesses
Design: The non-inclusion represented a threat for selection bias. The study did not
evaluate the learning curve of the physicians.
Validity: The gold standard was a confirmed diagnosis of malignancy in some cases
and clinical follow-up in other cases. The clinical follow-up could have hidden false
positive cases if the patient got treatment and the lesion disappeared. If the tumour
was growing very slowly, false negative cases could theoretically be undetected.
Bias and confounding: The cases not included represented a threat for selection bias.
The selective evaluation of the cases with all sampling techniques performed was
prone to selection bias.
Statistical analysis: Introduction of diagnostic yield as an endpoint in the cost-
effectiveness analysis made it difficult to compare the results to other studies. The
publication of subgroup analyses might be a risk for detecting p values below 5 % by
chance (type I mistake). Paper 3 did not present a Bonferroni correction (division of
the significance level by the number of subgroup analyses).
External validity: The results might not be valid in a centre where highly trained staff
performs the bronchoscopies.
94
6.3 Discussion of the main results
6.3.1 The main recommendations for bronchoscopy in published
reviews
When the British Thoracic Society published their guidelines for bronchoscopy in
2001, they distinguished between visible lesions and peripheral lesions(148). The
guidelines recommended a diagnostic yield above 80 % for visible lesions. They
recommended fluoroscopy for localised peripheral lesions and the combination of
biopsy, brushing and washing based on the papers from McLean et al.,(95) Gellert et
al.,(62) and Mak et al.(78) The guidelines did not recommend TBNA or curettage.
Schreiber et al. described the diagnostic yield of different sampling techniques for
endobronchial visible lesions and for peripheral lesions in 2003(48). The size of the
peripheral lesions was a predictor for the diagnostic yield. Few of the studies in
Schreiber’s report included all patients with suspected lung cancer(48).
Rivera et al. recommended bronchoscopy for central lesions and transthoracic needle
aspiration for peripheral lesions in 2003. The paper recommended re-evaluation of
benign results from central lesions to avoid false negative cases. The updated 2007
paper recommended an EBUS radial probe as the diagnostic approach for lesions
below 2 cm when performed by expert hands(49).
Ernst et al. published the recommendations for radial EBUS probe in 2003(46). EBUS
was an extraordinarily safe procedure to visualise lesions, to describe tumour invasion
and for differentiation between vascular and non-vascular structures. The paper
recommended that trainees performed at least 50 procedures with EBUS with balloon
to establish competency of the anatomic structures of mediastinum, but did not
recommend a number for competence in peripheral lesions.
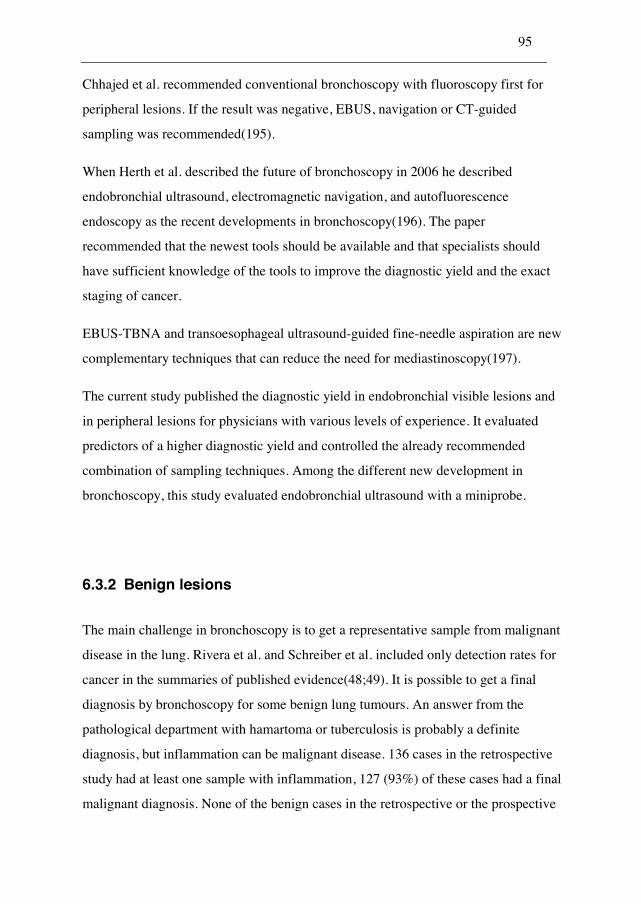
95
Chhajed et al. recommended conventional bronchoscopy with fluoroscopy first for
peripheral lesions. If the result was negative, EBUS, navigation or CT-guided
sampling was recommended(195).
When Herth et al. described the future of bronchoscopy in 2006 he described
endobronchial ultrasound, electromagnetic navigation, and autofluorescence
endoscopy as the recent developments in bronchoscopy(196). The paper
recommended that the newest tools should be available and that specialists should
have sufficient knowledge of the tools to improve the diagnostic yield and the exact
staging of cancer.
EBUS-TBNA and transoesophageal ultrasound-guided fine-needle aspiration are new
complementary techniques that can reduce the need for mediastinoscopy(197).
The current study published the diagnostic yield in endobronchial visible lesions and
in peripheral lesions for physicians with various levels of experience. It evaluated
predictors of a higher diagnostic yield and controlled the already recommended
combination of sampling techniques. Among the different new development in
bronchoscopy, this study evaluated endobronchial ultrasound with a miniprobe.
6.3.2 Benign lesions
The main challenge in bronchoscopy is to get a representative sample from malignant
disease in the lung. Rivera et al. and Schreiber et al. included only detection rates for
cancer in the summaries of published evidence(48;49). It is possible to get a final
diagnosis by bronchoscopy for some benign lung tumours. An answer from the
pathological department with hamartoma or tuberculosis is probably a definite
diagnosis, but inflammation can be malignant disease. 136 cases in the retrospective
study had at least one sample with inflammation, 127 (93%) of these cases had a final
malignant diagnosis. None of the benign cases in the retrospective or the prospective
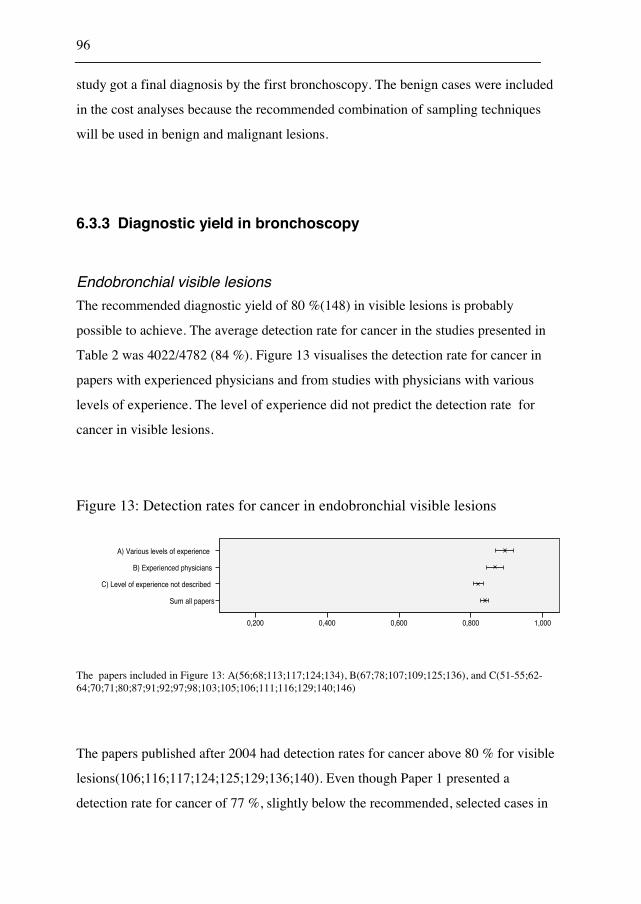
96
study got a final diagnosis by the first bronchoscopy. The benign cases were included
in the cost analyses because the recommended combination of sampling techniques
will be used in benign and malignant lesions.
6.3.3 Diagnostic yield in bronchoscopy
Endobronchial visible lesions
The recommended diagnostic yield of 80 %(148) in visible lesions is probably
possible to achieve. The average detection rate for cancer in the studies presented in
Table 2 was 4022/4782 (84 %). Figure 13 visualises the detection rate for cancer in
papers with experienced physicians and from studies with physicians with various
levels of experience. The level of experience did not predict the detection rate for
cancer in visible lesions.
Figure 13: Detection rates for cancer in endobronchial visible lesions
A) Various levels of experience
B) Experienced physicians
C) Level of experience not described
Sum all papers
1,0000,8000,6000,4000,200
The papers included in Figure 13: A(56;68;113;117;124;134), B(67;78;107;109;125;136), and C(51-55;62-64;70;71;80;87;91;92;97;98;103;105;106;111;116;129;140;146)
The papers published after 2004 had detection rates for cancer above 80 % for visible
lesions(106;116;117;124;125;129;136;140). Even though Paper 1 presented a
detection rate for cancer of 77 %, slightly below the recommended, selected cases in
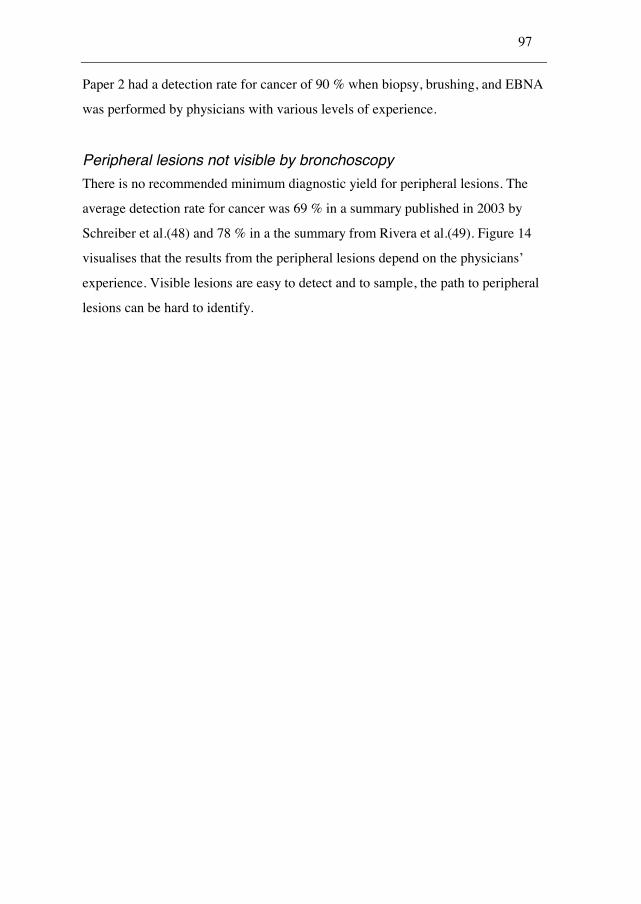
97
Paper 2 had a detection rate for cancer of 90 % when biopsy, brushing, and EBNA
was performed by physicians with various levels of experience.
Peripheral lesions not visible by bronchoscopy
There is no recommended minimum diagnostic yield for peripheral lesions. The
average detection rate for cancer was 69 % in a summary published in 2003 by
Schreiber et al.(48) and 78 % in a the summary from Rivera et al.(49). Figure 14
visualises that the results from the peripheral lesions depend on the physicians’
experience. Visible lesions are easy to detect and to sample, the path to peripheral
lesions can be hard to identify.
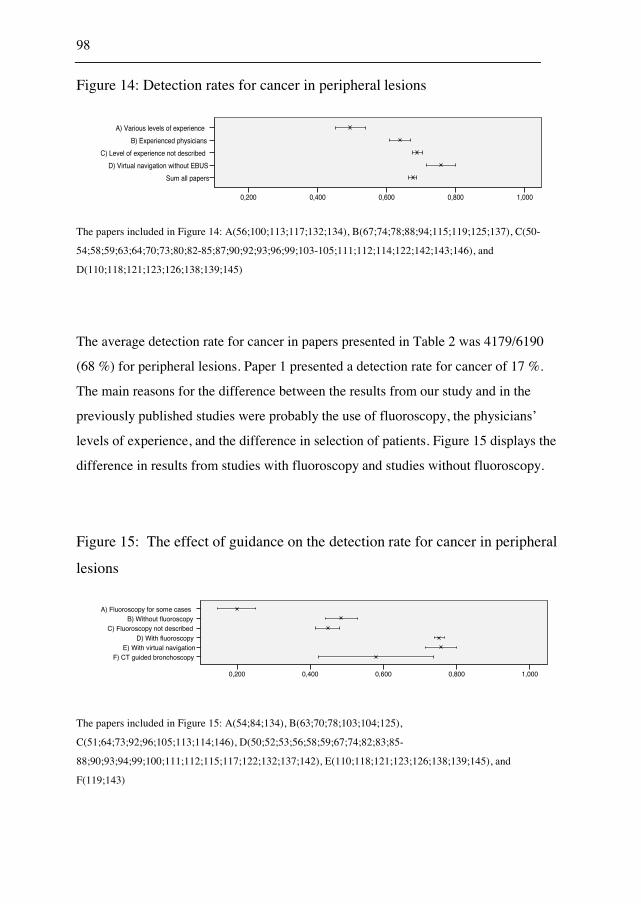
98
Figure 14: Detection rates for cancer in peripheral lesions
A) Various levels of experience
B) Experienced physicians
C) Level of experience not described
D) Virtual navigation without EBUS
Sum all papers
1,0000,8000,6000,4000,200
The papers included in Figure 14: A(56;100;113;117;132;134), B(67;74;78;88;94;115;119;125;137), C(50-
54;58;59;63;64;70;73;80;82-85;87;90;92;93;96;99;103-105;111;112;114;122;142;143;146), and
D(110;118;121;123;126;138;139;145)
The average detection rate for cancer in papers presented in Table 2 was 4179/6190
(68 %) for peripheral lesions. Paper 1 presented a detection rate for cancer of 17 %.
The main reasons for the difference between the results from our study and in the
previously published studies were probably the use of fluoroscopy, the physicians’
levels of experience, and the difference in selection of patients. Figure 15 displays the
difference in results from studies with fluoroscopy and studies without fluoroscopy.
Figure 15: The effect of guidance on the detection rate for cancer in peripheral
lesions
A) Fluoroscopy for some casesB) Without fluoroscopy
C) Fluoroscopy not describedD) With fluoroscopy
E) With virtual navigationF) CT guided bronchoscopy
1,0000,8000,6000,4000,200
The papers included in Figure 15: A(54;84;134), B(63;70;78;103;104;125),
C(51;64;73;92;96;105;113;114;146), D(50;52;53;56;58;59;67;74;82;83;85-
88;90;93;94;99;100;111;112;115;117;122;132;137;142), E(110;118;121;123;126;138;139;145), and
F(119;143)
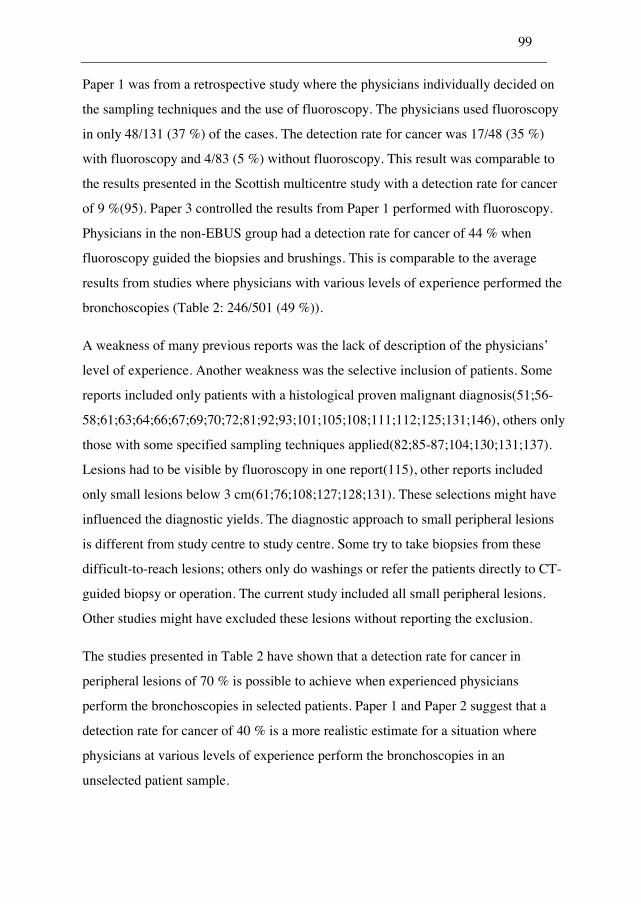
99
Paper 1 was from a retrospective study where the physicians individually decided on
the sampling techniques and the use of fluoroscopy. The physicians used fluoroscopy
in only 48/131 (37 %) of the cases. The detection rate for cancer was 17/48 (35 %)
with fluoroscopy and 4/83 (5 %) without fluoroscopy. This result was comparable to
the results presented in the Scottish multicentre study with a detection rate for cancer
of 9 %(95). Paper 3 controlled the results from Paper 1 performed with fluoroscopy.
Physicians in the non-EBUS group had a detection rate for cancer of 44 % when
fluoroscopy guided the biopsies and brushings. This is comparable to the average
results from studies where physicians with various levels of experience performed the
bronchoscopies (Table 2: 246/501 (49 %)).
A weakness of many previous reports was the lack of description of the physicians’
level of experience. Another weakness was the selective inclusion of patients. Some
reports included only patients with a histological proven malignant diagnosis(51;56-
58;61;63;64;66;67;69;70;72;81;92;93;101;105;108;111;112;125;131;146), others only
those with some specified sampling techniques applied(82;85-87;104;130;131;137).
Lesions had to be visible by fluoroscopy in one report(115), other reports included
only small lesions below 3 cm(61;76;108;127;128;131). These selections might have
influenced the diagnostic yields. The diagnostic approach to small peripheral lesions
is different from study centre to study centre. Some try to take biopsies from these
difficult-to-reach lesions; others only do washings or refer the patients directly to CT-
guided biopsy or operation. The current study included all small peripheral lesions.
Other studies might have excluded these lesions without reporting the exclusion.
The studies presented in Table 2 have shown that a detection rate for cancer in
peripheral lesions of 70 % is possible to achieve when experienced physicians
perform the bronchoscopies in selected patients. Paper 1 and Paper 2 suggest that a
detection rate for cancer of 40 % is a more realistic estimate for a situation where
physicians at various levels of experience perform the bronchoscopies in an
unselected patient sample.
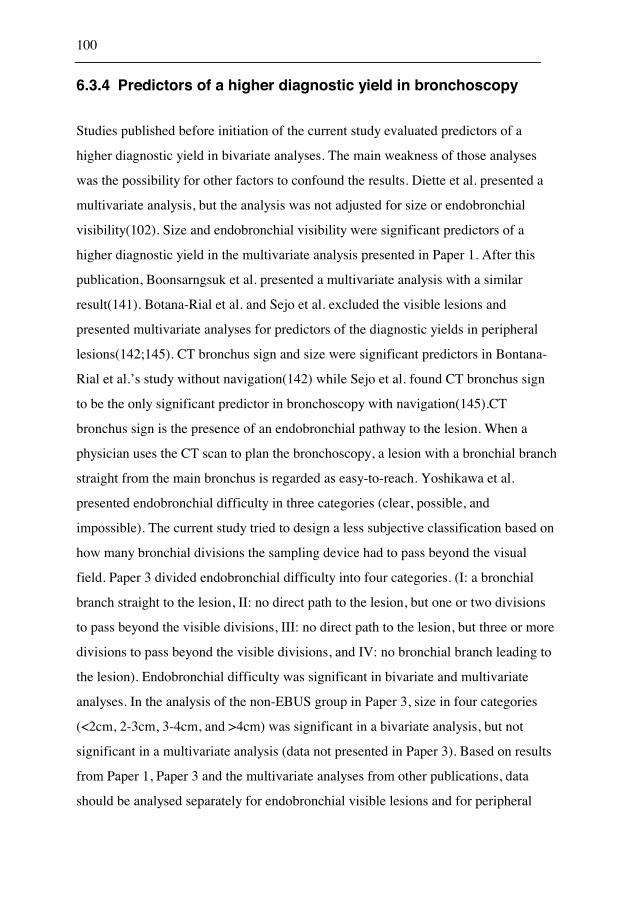
100
6.3.4 Predictors of a higher diagnostic yield in bronchoscopy
Studies published before initiation of the current study evaluated predictors of a
higher diagnostic yield in bivariate analyses. The main weakness of those analyses
was the possibility for other factors to confound the results. Diette et al. presented a
multivariate analysis, but the analysis was not adjusted for size or endobronchial
visibility(102). Size and endobronchial visibility were significant predictors of a
higher diagnostic yield in the multivariate analysis presented in Paper 1. After this
publication, Boonsarngsuk et al. presented a multivariate analysis with a similar
result(141). Botana-Rial et al. and Sejo et al. excluded the visible lesions and
presented multivariate analyses for predictors of the diagnostic yields in peripheral
lesions(142;145). CT bronchus sign and size were significant predictors in Bontana-
Rial et al.’s study without navigation(142) while Sejo et al. found CT bronchus sign
to be the only significant predictor in bronchoscopy with navigation(145).CT
bronchus sign is the presence of an endobronchial pathway to the lesion. When a
physician uses the CT scan to plan the bronchoscopy, a lesion with a bronchial branch
straight from the main bronchus is regarded as easy-to-reach. Yoshikawa et al.
presented endobronchial difficulty in three categories (clear, possible, and
impossible). The current study tried to design a less subjective classification based on
how many bronchial divisions the sampling device had to pass beyond the visual
field. Paper 3 divided endobronchial difficulty into four categories. (I: a bronchial
branch straight to the lesion, II: no direct path to the lesion, but one or two divisions
to pass beyond the visible divisions, III: no direct path to the lesion, but three or more
divisions to pass beyond the visible divisions, and IV: no bronchial branch leading to
the lesion). Endobronchial difficulty was significant in bivariate and multivariate
analyses. In the analysis of the non-EBUS group in Paper 3, size in four categories
(<2cm, 2-3cm, 3-4cm, and >4cm) was significant in a bivariate analysis, but not
significant in a multivariate analysis (data not presented in Paper 3). Based on results
from Paper 1, Paper 3 and the multivariate analyses from other publications, data
should be analysed separately for endobronchial visible lesions and for peripheral
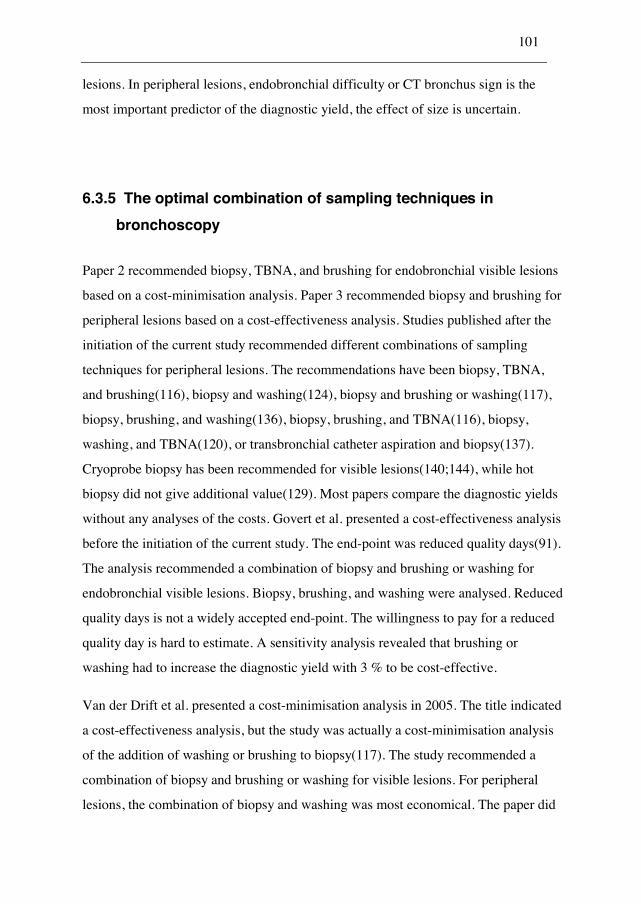
101
lesions. In peripheral lesions, endobronchial difficulty or CT bronchus sign is the
most important predictor of the diagnostic yield, the effect of size is uncertain.
6.3.5 The optimal combination of sampling techniques in
bronchoscopy
Paper 2 recommended biopsy, TBNA, and brushing for endobronchial visible lesions
based on a cost-minimisation analysis. Paper 3 recommended biopsy and brushing for
peripheral lesions based on a cost-effectiveness analysis. Studies published after the
initiation of the current study recommended different combinations of sampling
techniques for peripheral lesions. The recommendations have been biopsy, TBNA,
and brushing(116), biopsy and washing(124), biopsy and brushing or washing(117),
biopsy, brushing, and washing(136), biopsy, brushing, and TBNA(116), biopsy,
washing, and TBNA(120), or transbronchial catheter aspiration and biopsy(137).
Cryoprobe biopsy has been recommended for visible lesions(140;144), while hot
biopsy did not give additional value(129). Most papers compare the diagnostic yields
without any analyses of the costs. Govert et al. presented a cost-effectiveness analysis
before the initiation of the current study. The end-point was reduced quality days(91).
The analysis recommended a combination of biopsy and brushing or washing for
endobronchial visible lesions. Biopsy, brushing, and washing were analysed. Reduced
quality days is not a widely accepted end-point. The willingness to pay for a reduced
quality day is hard to estimate. A sensitivity analysis revealed that brushing or
washing had to increase the diagnostic yield with 3 % to be cost-effective.
Van der Drift et al. presented a cost-minimisation analysis in 2005. The title indicated
a cost-effectiveness analysis, but the study was actually a cost-minimisation analysis
of the addition of washing or brushing to biopsy(117). The study recommended a
combination of biopsy and brushing or washing for visible lesions. For peripheral
lesions, the combination of biopsy and washing was most economical. The paper did
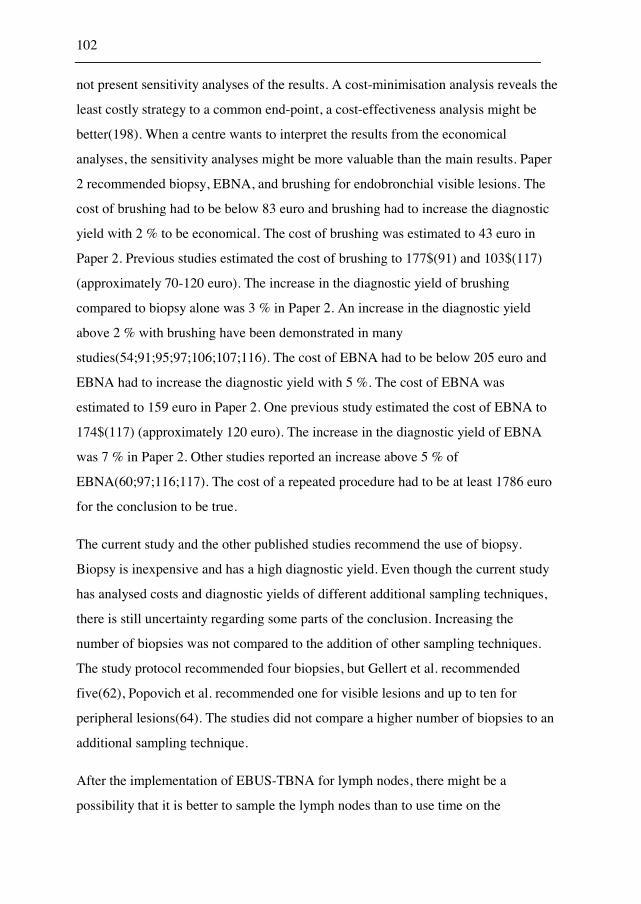
102
not present sensitivity analyses of the results. A cost-minimisation analysis reveals the
least costly strategy to a common end-point, a cost-effectiveness analysis might be
better(198). When a centre wants to interpret the results from the economical
analyses, the sensitivity analyses might be more valuable than the main results. Paper
2 recommended biopsy, EBNA, and brushing for endobronchial visible lesions. The
cost of brushing had to be below 83 euro and brushing had to increase the diagnostic
yield with 2 % to be economical. The cost of brushing was estimated to 43 euro in
Paper 2. Previous studies estimated the cost of brushing to 177$(91) and 103$(117)
(approximately 70-120 euro). The increase in the diagnostic yield of brushing
compared to biopsy alone was 3 % in Paper 2. An increase in the diagnostic yield
above 2 % with brushing have been demonstrated in many
studies(54;91;95;97;106;107;116). The cost of EBNA had to be below 205 euro and
EBNA had to increase the diagnostic yield with 5 %. The cost of EBNA was
estimated to 159 euro in Paper 2. One previous study estimated the cost of EBNA to
174$(117) (approximately 120 euro). The increase in the diagnostic yield of EBNA
was 7 % in Paper 2. Other studies reported an increase above 5 % of
EBNA(60;97;116;117). The cost of a repeated procedure had to be at least 1786 euro
for the conclusion to be true.
The current study and the other published studies recommend the use of biopsy.
Biopsy is inexpensive and has a high diagnostic yield. Even though the current study
has analysed costs and diagnostic yields of different additional sampling techniques,
there is still uncertainty regarding some parts of the conclusion. Increasing the
number of biopsies was not compared to the addition of other sampling techniques.
The study protocol recommended four biopsies, but Gellert et al. recommended
five(62), Popovich et al. recommended one for visible lesions and up to ten for
peripheral lesions(64). The studies did not compare a higher number of biopsies to an
additional sampling technique.
After the implementation of EBUS-TBNA for lymph nodes, there might be a
possibility that it is better to sample the lymph nodes than to use time on the
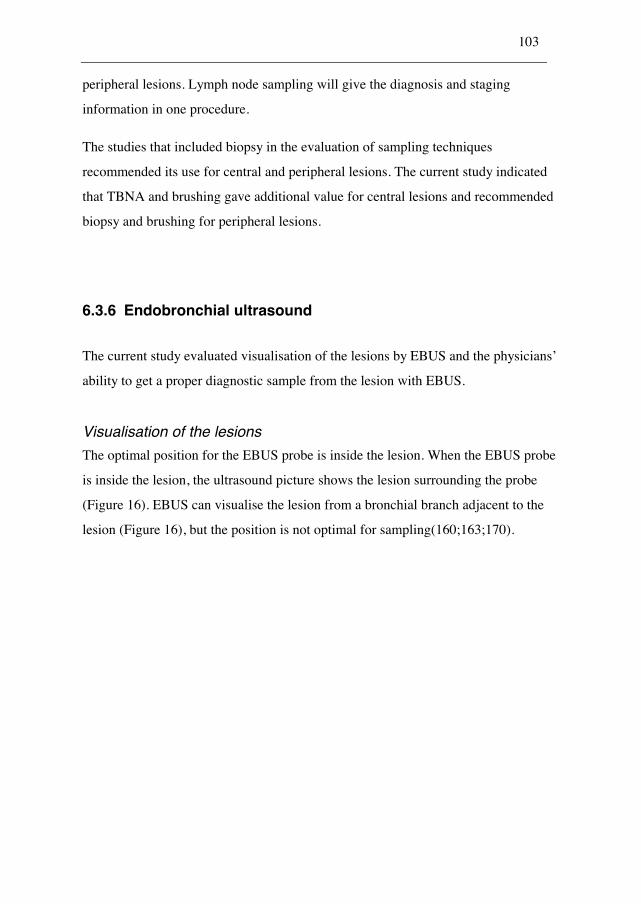
103
peripheral lesions. Lymph node sampling will give the diagnosis and staging
information in one procedure.
The studies that included biopsy in the evaluation of sampling techniques
recommended its use for central and peripheral lesions. The current study indicated
that TBNA and brushing gave additional value for central lesions and recommended
biopsy and brushing for peripheral lesions.
6.3.6 Endobronchial ultrasound
The current study evaluated visualisation of the lesions by EBUS and the physicians’
ability to get a proper diagnostic sample from the lesion with EBUS.
Visualisation of the lesions
The optimal position for the EBUS probe is inside the lesion. When the EBUS probe
is inside the lesion, the ultrasound picture shows the lesion surrounding the probe
(Figure 16). EBUS can visualise the lesion from a bronchial branch adjacent to the
lesion (Figure 16), but the position is not optimal for sampling(160;163;170).
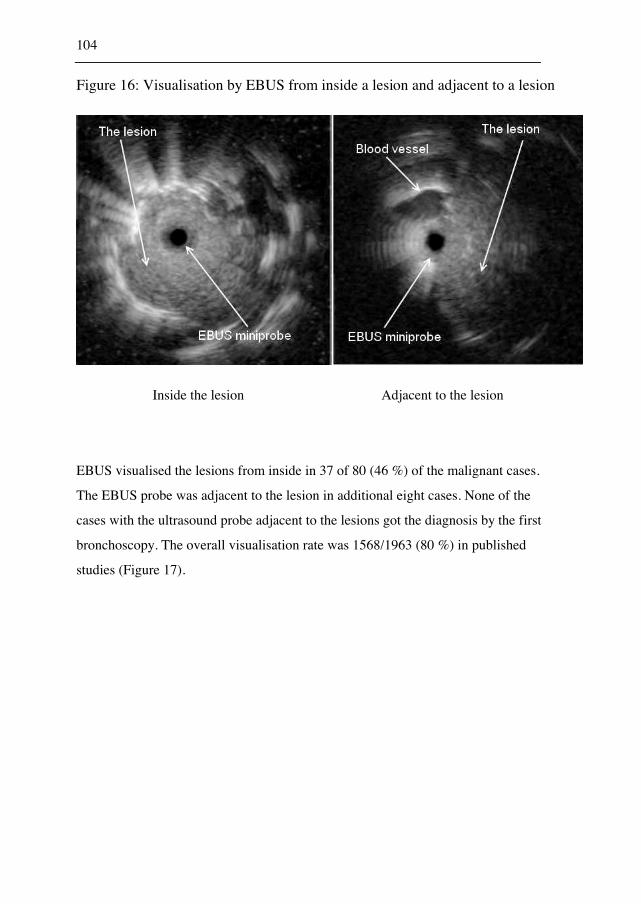
104
Figure 16: Visualisation by EBUS from inside a lesion and adjacent to a lesion
Inside the lesion Adjacent to the lesion
EBUS visualised the lesions from inside in 37 of 80 (46 %) of the malignant cases.
The EBUS probe was adjacent to the lesion in additional eight cases. None of the
cases with the ultrasound probe adjacent to the lesions got the diagnosis by the first
bronchoscopy. The overall visualisation rate was 1568/1963 (80 %) in published
studies (Figure 17).
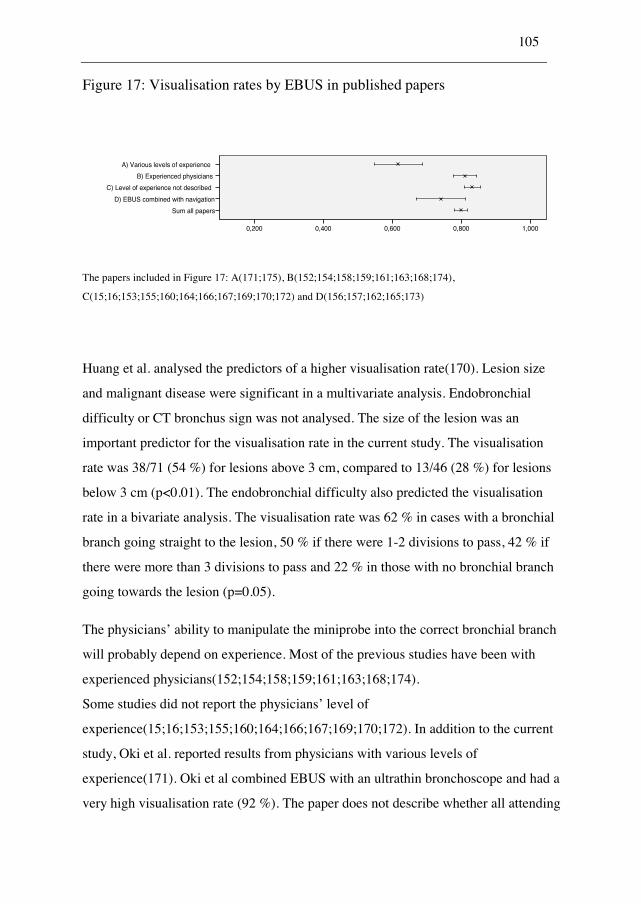
105
Figure 17: Visualisation rates by EBUS in published papers
A) Various levels of experience
B) Experienced physicians
C) Level of experience not described
D) EBUS combined with navigation
Sum all papers
1,0000,8000,6000,4000,200
The papers included in Figure 17: A(171;175), B(152;154;158;159;161;163;168;174),
C(15;16;153;155;160;164;166;167;169;170;172) and D(156;157;162;165;173)
Huang et al. analysed the predictors of a higher visualisation rate(170). Lesion size
and malignant disease were significant in a multivariate analysis. Endobronchial
difficulty or CT bronchus sign was not analysed. The size of the lesion was an
important predictor for the visualisation rate in the current study. The visualisation
rate was 38/71 (54 %) for lesions above 3 cm, compared to 13/46 (28 %) for lesions
below 3 cm (p<0.01). The endobronchial difficulty also predicted the visualisation
rate in a bivariate analysis. The visualisation rate was 62 % in cases with a bronchial
branch going straight to the lesion, 50 % if there were 1-2 divisions to pass, 42 % if
there were more than 3 divisions to pass and 22 % in those with no bronchial branch
going towards the lesion (p=0.05).
The physicians’ ability to manipulate the miniprobe into the correct bronchial branch
will probably depend on experience. Most of the previous studies have been with
experienced physicians(152;154;158;159;161;163;168;174).
Some studies did not report the physicians’ level of
experience(15;16;153;155;160;164;166;167;169;170;172). In addition to the current
study, Oki et al. reported results from physicians with various levels of
experience(171). Oki et al combined EBUS with an ultrathin bronchoscope and had a
very high visualisation rate (92 %). The paper does not describe whether all attending
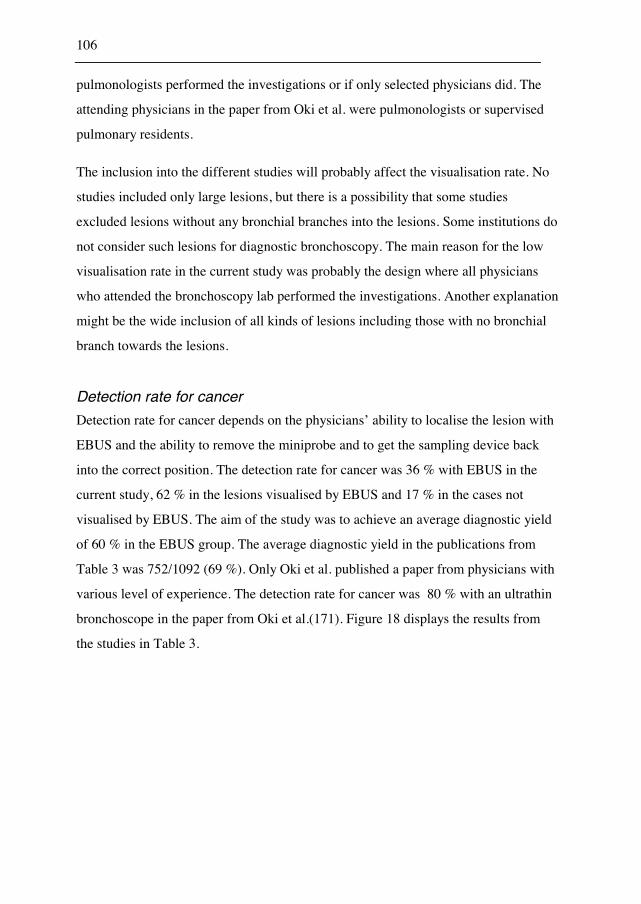
106
pulmonologists performed the investigations or if only selected physicians did. The
attending physicians in the paper from Oki et al. were pulmonologists or supervised
pulmonary residents.
The inclusion into the different studies will probably affect the visualisation rate. No
studies included only large lesions, but there is a possibility that some studies
excluded lesions without any bronchial branches into the lesions. Some institutions do
not consider such lesions for diagnostic bronchoscopy. The main reason for the low
visualisation rate in the current study was probably the design where all physicians
who attended the bronchoscopy lab performed the investigations. Another explanation
might be the wide inclusion of all kinds of lesions including those with no bronchial
branch towards the lesions.
Detection rate for cancer
Detection rate for cancer depends on the physicians’ ability to localise the lesion with
EBUS and the ability to remove the miniprobe and to get the sampling device back
into the correct position. The detection rate for cancer was 36 % with EBUS in the
current study, 62 % in the lesions visualised by EBUS and 17 % in the cases not
visualised by EBUS. The aim of the study was to achieve an average diagnostic yield
of 60 % in the EBUS group. The average diagnostic yield in the publications from
Table 3 was 752/1092 (69 %). Only Oki et al. published a paper from physicians with
various level of experience. The detection rate for cancer was 80 % with an ultrathin
bronchoscope in the paper from Oki et al.(171). Figure 18 displays the results from
the studies in Table 3.
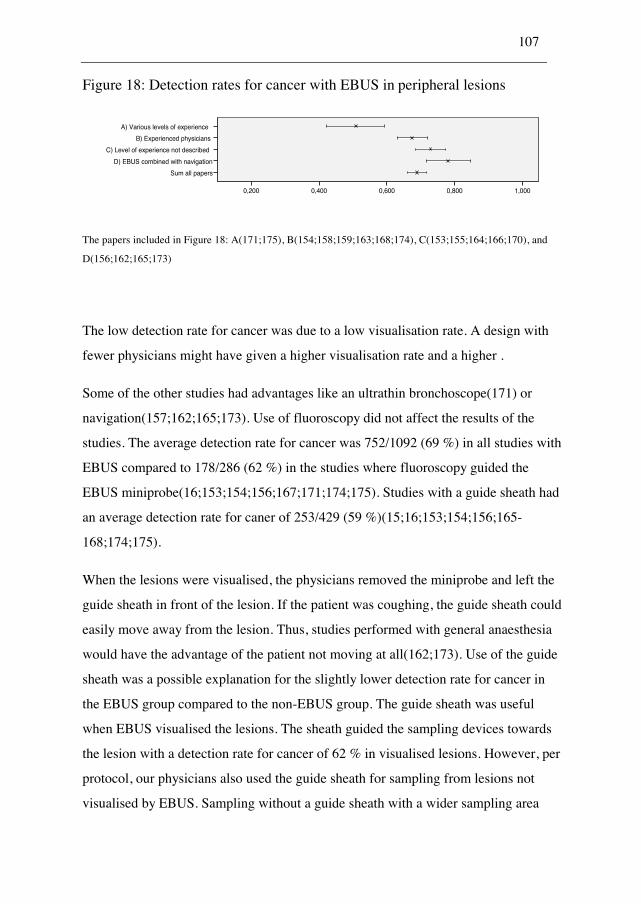
107
Figure 18: Detection rates for cancer with EBUS in peripheral lesions
A) Various levels of experience
B) Experienced physicians
C) Level of experience not described
D) EBUS combined with navigation
Sum all papers
1,0000,8000,6000,4000,200
The papers included in Figure 18: A(171;175), B(154;158;159;163;168;174), C(153;155;164;166;170), and
D(156;162;165;173)
The low detection rate for cancer was due to a low visualisation rate. A design with
fewer physicians might have given a higher visualisation rate and a higher .
Some of the other studies had advantages like an ultrathin bronchoscope(171) or
navigation(157;162;165;173). Use of fluoroscopy did not affect the results of the
studies. The average detection rate for cancer was 752/1092 (69 %) in all studies with
EBUS compared to 178/286 (62 %) in the studies where fluoroscopy guided the
EBUS miniprobe(16;153;154;156;167;171;174;175). Studies with a guide sheath had
an average detection rate for caner of 253/429 (59 %)(15;16;153;154;156;165-
168;174;175).
When the lesions were visualised, the physicians removed the miniprobe and left the
guide sheath in front of the lesion. If the patient was coughing, the guide sheath could
easily move away from the lesion. Thus, studies performed with general anaesthesia
would have the advantage of the patient not moving at all(162;173). Use of the guide
sheath was a possible explanation for the slightly lower detection rate for cancer in
the EBUS group compared to the non-EBUS group. The guide sheath was useful
when EBUS visualised the lesions. The sheath guided the sampling devices towards
the lesion with a detection rate for cancer of 62 % in visualised lesions. However, per
protocol, our physicians also used the guide sheath for sampling from lesions not
visualised by EBUS. Sampling without a guide sheath with a wider sampling area
108
might give better results for these lesions. Eberhardt et al. have published a paper with
suction from a catheter close to the lesion(173). This sampling technique also samples
from a wider area and is promising.
In the present EBUS study, the physicians were in the beginning of the learning curve
with EBUS. They were only able to achieve visualisation from inside the tumour in
46 % of the lesions. When a malignant lesion was visualised, the detection rate for
cancer was only 62 %.
Comparison of EBUS and non-EBUS for peripheral lesions
The main aim of Paper 3 was to compare the diagnostic yield of bronchoscopy with
EBUS to the diagnostic yield of bronchoscopy without EBUS in a real-life setting.
The predicted diagnostic yield in the non-EBUS group was 40 %, the detection rate
for cancer in the study was 43 %. The detection rate for cancer in the EBUS group
was 36 %, far from the predicted 60 %. Thus, there was no increase in the diagnostic
yield with EBUS in a situation where physicians with various levels of experience
performed the bronchoscopies. Subgroup analyses in Paper 3 showed that the
physicians were able to get a very high detection rate for cancer with EBUS in easy-
to-reach lesions (89 %), but the detection rate for cancer was high also for easy-to-
reach lesions in the non-EBUS group (72 %, NS). We expected EBUS to be a good
tool for hard-to-reach lesions, but in the current study, non-EBUS had higher
detection rates for cancer if there were no bronchial branches going straight to the
lesions. As discussed previously, the navigation towards the lesion can be
complicated and learning might improve the results. For inexperienced physicians
sampling without a guide sheath from a wider area was better than localised sampling
with EBUS. A guide sheath in a difficult position might easily slip away during
breathing or coughing. The multivariate analysis in Paper 3 found an interaction
between size and use of EBUS. For lesions below 3 cm the detection rate for cancer
in the EBUS group was lower than the detection rate for cancer in the non-EBUS
group. This result is contrary to the results from experienced physicians where the
109
EBUS group had a higher diagnostic yield than the non-EBUS group in small
lesions(152;158).
Few studies have compared the diagnostic yield with EBUS to the diagnostic yield
without EBUS in peripheral lesions. The first study by Herth et al. was from the
Heidelberg group(152). Although not described in the paper, very experienced
physicians performed the bronchoscopies with the patients in general anaesthesia. The
paper did not report the non-inclusion or whether hard-to-reach lesions with no
bronchial branches to the lesions were included or not. The study had a crossover
design where the physician performed a bronchoscopy with EBUS and without EBUS
in the same patient. Having first determined the position by EBUS might have biased
the results in the non-EBUS group. The study achieved a high diagnostic yield in the
EBUS group (80 %), but there was no significant increase compared to the non-EBUS
group (76 %). There was a tendency for EBUS to be better for small lesions. The
Heidelberg group has shown high detection rates for EBUS in lesions invisible by
fluoroscopy (159;168) and when EBUS was combined with navigation(157;162).
Eberhardt et al. found a significant higher detection rate for the combination of
navigation and EBUS compared to each method alone.
Yang et al. published a paper in 2004 with a comparison between EBUS and non-
EBUS. This was a retrospective study of the patients investigated before the
introduction of EBUS compared to those investigated with EBUS. There was a
significant increase in detection rate for cancer. The detection rate was 43 % without
EBUS and increased to 66 % with EBUS. The study had a wide inclusion, but did not
describe the level of experience of the performing physicians.
Shirakawa et al. compared EBUS performed by two experienced physicians to a
historical control group where the two physicians performed the bronchoscopies(154).
Their conclusion was that EBUS improves the diagnostic accuracy, but the detection
rate for cancer was 71 % in the EBUS group and 70 % in the non-EBUS group.
110
Paone et al. performed a randomised trial with sample size calculation, but without a
conclusion for the mnumber needed in the study(158). Two experienced physicians
performed all procedures. They investigated all patients with bronchoscopy before the
inclusion. 386 of 799 patients were excluded because of low compliance. Compliance
was defined as the supposed ability to accomplish a follow up algorithm. The study
found a significant increase in the detection rate for cancer. The detection rate for
cancer increased from 55 % in the non-EBUS group to 79 % in the EBUS group.
Subgroup analyses revealed there was no increase in the diagnostic yield with EBUS
for lesions above 3 cm. This study has shown that EBUS can increase the detection
rate for cancer in small lesions when performed by experienced physicians in selected
patients.
Figure 19 is a comparison of the average detection rate for cancer in studies without
EBUS (Figure 14) and the detection rate for cancer in studies with EBUS (Figure 18).
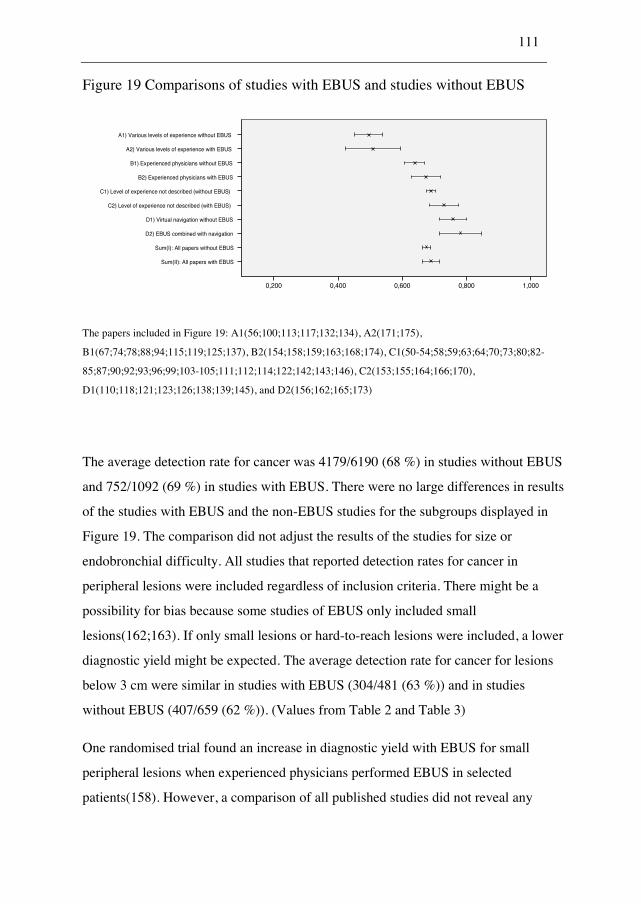
111
Figure 19 Comparisons of studies with EBUS and studies without EBUS
A1) Various levels of experience without EBUS
A2) Various levels of experience with EBUS
B1) Experienced physicians without EBUS
B2) Experienced physicians with EBUS
C1) Level of experience not described (without EBUS)
C2) Level of experience not described (with EBUS)
D1) Virtual navigation without EBUS
D2) EBUS combined with navigation
Sum(I): All papers without EBUS
Sum(II): All papers with EBUS
1,0000,8000,6000,4000,200
The papers included in Figure 19: A1(56;100;113;117;132;134), A2(171;175),
B1(67;74;78;88;94;115;119;125;137), B2(154;158;159;163;168;174), C1(50-54;58;59;63;64;70;73;80;82-
85;87;90;92;93;96;99;103-105;111;112;114;122;142;143;146), C2(153;155;164;166;170),
D1(110;118;121;123;126;138;139;145), and D2(156;162;165;173)
The average detection rate for cancer was 4179/6190 (68 %) in studies without EBUS
and 752/1092 (69 %) in studies with EBUS. There were no large differences in results
of the studies with EBUS and the non-EBUS studies for the subgroups displayed in
Figure 19. The comparison did not adjust the results of the studies for size or
endobronchial difficulty. All studies that reported detection rates for cancer in
peripheral lesions were included regardless of inclusion criteria. There might be a
possibility for bias because some studies of EBUS only included small
lesions(162;163). If only small lesions or hard-to-reach lesions were included, a lower
diagnostic yield might be expected. The average detection rate for cancer for lesions
below 3 cm were similar in studies with EBUS (304/481 (63 %)) and in studies
without EBUS (407/659 (62 %)). (Values from Table 2 and Table 3)
One randomised trial found an increase in diagnostic yield with EBUS for small
peripheral lesions when experienced physicians performed EBUS in selected
patients(158). However, a comparison of all published studies did not reveal any
112
significant benefit of EBUS. There was no increase in the diagnostic yield with EBUS
performed by physicians at various levels of experience in the current study.
6.4 Conclusions
Endobronchial visibility and lesion size were predictors for a higher diagnostic yield
in the current study of bronchoscopy. A novel classification of endobronchial
difficulty, presented in Paper 3, was a significant predictor in a separate analysis of
peripheral lesions. The optimal combination of sampling techniques was biopsy,
brushing and EBNA for visible lesions. For peripheral lesions, biopsy and brushing
was the optimal combination. There was no increase in the diagnostic yield by use of
EBUS performed by physicians at various levels of experience.
113
7. Suggestions for future research
7.1.1 Navigation
Previous studies found an advantage of the Superdimension navigation system
combined with EBUS(162). There is a need of cost-effectiveness studies for these
devices. The navigation probes are expensive and disposable with design for one-time
use only. The EBUS probe is vulnerable. LungPoint has developed a new navigation
system(199) that reads the bronchoscopy picture. The system is expensive to buy, but
does not have single use expenses. The usefulness of the LungPoint system and
virtual bronchoscopy systems integrated in the regular CT working stations, are
possible platforms for future research on bronchoscopy for visualization and sampling
from peripheral lesions.
7.1.2 Bronchography
Catheter bronchography is an inexpensive and simple method to display the bronchial
branches. The physician infuses diluted contrast medium (like Iohexol) through a
catheter into the actual bronchial segments. Two previous studies had very high
diagnostic yields with bronchography for small lesions below 2 cm(61;76). Catheter
bronchography is a possible intervention that can be tested in future studies.
7.1.3 BAL
The current study did not evaluate BAL in the diagnostic approach. BAL is the
installation of 50 ml saline into the actual bronchial branch. Some studies have shown
good results of BAL for peripheral lesions(66;104;114). The possibility to use BAL
alone for difficult-to-reach lesions is a suggestion for future research.
114
7.1.4 Curettage
The current study used the curette to manipulate the guide sheath into the correct
position. Some studies had good results of the curette as a sampling
technique(53;61;76;110;112). The curette as a sampling technique is a possible device
that needs further evaluations in future studies.
7.1.5 Catheter aspiration
Eberhardt et al. has shown promising results for catheter aspiration from the area of
the lesions(162). The technique is promising, but future studies must evaluate its
potential.
7.1.6 EBUS
The current study did not recommend EBUS for inexperienced physicians when the
lesions were small or hard-to-reach. Easy-to-reach lesions above 3 cm have a good
diagnostic yield with fluoroscopy, biopsy, and brushing regardless of the use of
EBUS. The usefulness of EBUS for small lesions with experienced physicians is still
not settled even though one randomised study has shown promising results(158).
7.1.7 The diagnostic approach to visible and peripheral lesions
Based on the current knowledge all pulmonologists can sample visible lesions with
good results. The current study recommended biopsy, brushing, and EBNA for visible
lesions, but future studies can evaluate whether a higher number of biopsies can
replace brushing or EBNA. Physicians with various levels of experience can sample
115
easy-to-reach lesions above 3 cm with fluoroscopy, biopsy, and brushing. Hard-to-
reach lesions and lesions below 3 cm are possibly to be reserved for experienced
physicians. We need future studies to settle if catheter bronchography, navigation,
EBUS, curette, BAL or catheter aspiration are cost-effective devices for the
experienced physician. Future studies can settle whether bronchoscopy or CT-guided
biopsy is preferable for lesions without any bronchial branches directly to the lesions.
The introduction of EBUS-TBNA for lymph nodes might change the need for
sampling from peripheral lesions.
116
8. Source of data
1. Marsh, B. R. Historic Development of Bronchoesophagology. Otolaryngology-Head and Neck Surgery 1996;114(6):689-716.
2. Becker, H. D. Bronchoscopy: The Past, the Present, and the Future. Clinics in Chest Medicine 2010;31(1):1-18.
3. Ikeda, Tsuboi, T, Ono, R, and Ishikawa, S. Flexible Bronchofiberscope. Jap J Clin Oncol 1971;1(1):55-65.
4. Thirumala RD and Mosenifar Z. Transbronchial Biopsy. http://emedicine.medscape.com/article/1894323-overview 2011.
5. Sackner, M. A., Wanner, A., and Landa, J. Applications of Bronchofiberoscopy. Chest 1972;62(5):S70-&.
6. Wang K.P., Mehta, A., and Turner, J. F. Transbronchial Needle Aspiration for Cytology and Histology Specimens. Flexible bronchoscopy 2004;Blackwell Science.
7. Wang, K. P., Terry, P., and Marsh, B. Bronchoscopic Needle Aspiration Biopsy of Paratracheal Tumors. American Review of Respiratory Disease 1978;118(1):17-21.
8. Frentzel-Beyme, B. The History of Diagnostic Ultrasound. Radiologe 2005;45(4):363-70.
9. Woo, J. A Short History of the Development of Ultrasound in Obstetrics and Gynecology. http://www.ob-ultrasound.net/history1.html 2002.
10. Ludwig, G. D., Bolt, R. H., Heuter, T. F., and Ballantine, H. T. Factors Influencing the Use of Ultrasound As A Diagnostic Aid. Transactions of the American Neurological Association 1950;225-8.
11. Wild, J. J. The Use of Ultrasonic Pulses for the Measurement of Biological Tissues and the Detection of Tissue Density Changes. Surgery 1950;27:183-8.
12. Http://Www.Ob-Ultrasound.Net/Dussikbio.Html. Web page 2011.
13. Donald, I. Use of Ultrasonics in Diagnosis of Abdominal Swellings. British Medical Journal 1963;(536):1154-5.
117
14. Wild, J. J. and Reid, J. M. Current Developments in Ultrasonic Equipments of Medical Diagnosis. IRE Trans.Ultrason.Engng 1957;5:44-56.
15. Hurter, T. and Hanrath, P. Endobronchial Sonography - Feasibility and Preliminary-Results. Thorax 1992;47(7):565-7.
16. Kurimoto, N., Miyazawa, T., Okimasa, S., Maeda, A., Oiwa, H., Miyazu, Y., and Murayama, M. Endobronchial Ultrasonography Using a Guide Sheath Increases the Ability to Diagnose Peripheral Pulmonary Lesions Endoscopically. Chest 2004;126(3):959-65.
17. Morgagni, G. B. De Sedibus Et Causis Morborum Per Anatomen Indagatis. (Serial) 1761.
18. Spiro, S. G. and Silvestri, G. A. One Hundred Years of Lung Cancer. American Journal of Respiratory and Critical Care Medicine 1-9-2005;172(5):523-9.
19. Doll, R. and Hill, A. B. Smoking and Carcinoma of the Lung - Preliminary Report. British Medical Journal 1950;2(4682):739-48.
20. Doll, R. Uncovering the Effects of Smoking: Historical Perspective. Stat Methods Med Res 1998;7(2):87-117.
21. Smith, G. D. and Egger, M. The First Reports on Smoking and Lung Cancer - Why Are They Consistently Ignored? Bulletin of the World Health Organization 2005;83(10):799-800.
22. Www.Kreftregisteret.No. Web page 2010.
23. "Wilhelm Conrad Röntgen - Biography". Nobelprize.Org. http://nobelprize.org/nobel_prizes/physics/laureates/1901/rontgen-bio.html 2010.
24. Kuhl, D. E., Hale, J., and Eaton, W. L. Transmission Scanning - A Useful Adjunct to Conventional Emission Scanning for Accurately Keying Isotope Deposition to Radiographic Anatomy. Radiology 1966;87(2):278-&.
25. Hounsfield, G. N. Emi Scanner. Proceedings of the Royal Society of London Series B-Biological Sciences 1977;195(1119):281-9.
26. Brownell, G. The History of Positron Imaging. http://www.mit.edu/~glb/alb.html 1999.
27. Alavi, A. and Reivich, M. The Conception of FDG-PET Imaging. Seminars in Nuclear Medicine 2002;32(1):2-5.
28. Townsend, D. W. and Beyer, T. A Combined PET/CT Scanner: the Path to True Image Fusion. British Journal of Radiology 2002;75:S24-S30.
118
29. Graham, E. A. Pneumectomy With Cautery. A Safer Substitute for the Ordinary Lobectomy in Cases of Chronic Suppuration of the Lung. J Am Med Assoc 1923;81(12):1010-2.
30. Horn, L. and Johnson, D. H. Evarts A. Graham and the First Pneumonectomy for Lung Cancer. Journal of Clinical Oncology 1-7-2008;26(19):3268-75.
31. Http://Radonc.Ucsd.Edu/Patientinformation/History.Asp. Web page 2010.
32. Heron, J. F. Some Historical Data on Radiotherapy. http://www.oncoprof.net/Generale2000/g08_Radiotherapie/Index/g08-gb_idx02.html 2010.
33. Edwards, A. T. Carcinoma of the Bronchus. Thorax 1946;1(1):1-25.
34. Johnson, R. J., Walton, R. J., Lim, M. L., Zylak, C. J., and Painchaud, L. A. A Randomized Study on Survival of Bronchogenic Carcinoma Treated With Conventional or Short Fractionation Radiation. Clinical Radiology 1973;24(4):494-7.
35. Leksell, L. Stereotactic Radiosurgery. Journal of Neurology Neurosurgery and Psychiatry 1983;46(9):797-803.
36. Blomgren, H., Lax, I., Naslund, I., and Svanstrom, R. Stereotaxic High-Dose Fraction Radiation-Therapy of Extracranial Tumors Using An Accelerator - Clinical-Experience of the First 31 Patients. Acta Oncologica 1995;34(6):861-70.
37. Hiraoka, M., Matsuo, Y., and Takayama, K. Stereotactic Body Radiation Therapy for Lung Cancer: Achievements and Perspectives. Japanese Journal of Clinical Oncology 2010;40(9):846-54.
38. Gilman, A. The Initial Clinical Trial of Nitrogen Mustard. American Journal of Surgery 1963;105(5):574-8.
39. Goodman, L. S., Wintrobe, M. M., Dameshek, W., Goodman, M. J., and Gilman, A. Nitrogen Mustard Therapy - Use of Methyl-Bis(Beta-Chloroethyl)Amine Hydrochloride and Tris(Beta-Chloroethyl)Amine Hydrochloride for Hodgkins Disease, Lymphosarcoma, Leukemia and Certain Allied and Miscellaneous Disorders. Jama-Journal of the American Medical Association 1946;132(3):126-32.
40. Ritchie, M. Alfred Gilman 1908-184. http://www.nap.edu/html/biomems/agilman.pdf 1996.
41. Stewart, L. A. Chemotherapy in Non-Small Celi Lung Cancer: a Meta-Analysis Using Updated Data on Individual Patients From 52 Randomised Clinical Trials. BMJ 1995;311:899-909.
42. Mitsudomi, T. Advances in Target Therapy for Lung Cancer. Japanese Journal of Clinical Oncology 2010;40(2):101-6.
119
43. Http://Www.Fujinon.De/En/Medical-Products/Products/Miniprobe-Ultrasound-System/. Web page 2010.
44. Http://Www.Olympusamerica.Com/Msg_Section/Msg_Eus.Asp. Web page 2010.
45. Http://Www.Olympusamerica.Com/Msg_Section/ET/Procedures /Peripheral_Bronchoscopy.Asp. Web page 2010.
46. Ernst, A., Feller-Kopman, D., and Herth, F. J. F. Endobronchial Ultrasound in the Diagnosis and Staging of Lung Cancer and Other Thoracic Tumors. Semin Thorac Cardiovasc Surg 2007;19:201-5.
47. Altman, D. G. Practical Statistics for Medical Research. Chapman & Hall, London 1991.
48. Schreiber, G. and McCrory, D. C. Performance Characteristics of Different Modalities for Diagnosis of Suspected Lung Cancer - Summary of Published Evidence. Chest 2003;123(1):115S-28S.
49. Rivera, M. P and Mehta, A. C. Initial Diagnosis of Lung Cancer: ACCP Evidence-Based Clinical Practice Guidelines (2nd Edition). Chest 2007;132(3 Suppl):131S-48S.
50. Hattori, S., Matsuda, M., NISHIHAR.H, and Horai, T. Early Diagnosis of Small Peripheral Lung Cancer - Cytologic Diagnosis of Very Fresh Cancer Cells Obtained by Tv-Brushing Technique. Acta Cytologica 1971;15(5):460-&.
51. Oswald, N. C., Hinson, K. F. W., Canti, G., and Miller, A. B. Diagnosis of Primary Lung Cancer With Special Reference to Sputum Cytology. Thorax 1971;26(6):623-&.
52. Solomon, D. A., Solliday, N. H., and Gracey, D. R. Cytology in Fiberoptic Bronchoscopy - Comparison of Bronchial Brushing, Washing and Post-Bronchoscopy Sputum. Chest 1974;65(6):616-9.
53. Zavala, D. C. Diagnostic Fiberoptic Bronchoscopy - Techniques and Results of Biopsy in 600 Patients. Chest 1975;68(1):12-9.
54. Kvale, P. A., Bode, F. R., and Kini, S. Diagnostic Accuracy in Lung-Cancer - Comparison of Techniques Used in Association With Flexible Fiberoptic Bronchoscopy. Chest 1976;69(6):752-7.
55. Chopra, S. K., Genovesi, M. G., Simmons, D. H., and Gothe, B. Fiberoptic Bronchoscopy in Diagnosis of Lung-Cancer - Comparison Pre-Bronchoscopy and Post-Bronchoscopy Sputa, Washings, Brushings and Biopsies. Acta Cytologica 1977;21(4):524-7.
56. Stringfield, J. T., Markowitz, D. J., Bentz, R. R., Welch, M. H., and Weg, J. G. Effect of Tumor Size and Location on Diagnosis by Fiberoptic Bronchoscopy. Chest 1977;72(4):474-6.
120
57. Chaudhary, B. A., Yoneda, K., and Burki, N. K. Fiberoptic Bronchoscopy - Comparison of Procedures Used in Diagnosis of Lung-Cancer. Journal of Thoracic and Cardiovascular Surgery 1978;76(1):33-7.
58. Cortese, D. A. and Mcdougall, J. C. Biopsy and Brushing of Peripheral Lung-Cancer With Fluoroscopic Guidance. Chest 1979;75(2):141-5.
59. Radke, J. R., Conway, W. A., Eyler, W. R., and Kvale, P. A. Diagnostic-Accuracy in Peripheral Lung Lesions - Factors Predicting Success With Flexible Fiberoptic Bronchoscopy. Chest 1979;76(2):176-9.
60. Buirski, G., Calverley, P. M. A., Douglas, N. J., Lamb, D., Mcintyre, M., Sudlow, M. F., and White, H. Bronchial Needle Aspiration in the Diagnosis of Bronchial-Carcinoma. Thorax 1981;36(7):508-11.
61. Ono, R., Loke, J., and Ikeda, S. Bronchofiberscopy With Curette Biopsy and Bronchography in the Evaluation of Peripheral Lung Lesions. Chest 1981;79(2):162-6.
62. Gellert, A. R., Rudd, R. M., Sinha, G., and Geddes, D. M. Fiberoptic Bronchoscopy - Effect of Multiple Bronchial Biopsies on Diagnostic Yield in Bronchial-Carcinoma. Thorax 1982;37(9):684-7.
63. Pilotti, S., Rilke, F., Gribaudi, G., and Spinelli, P. Cytologic Diagnosis of Pulmonary-Carcinoma on Bronchoscopic Brushing Material. Acta Cytologica 1982;26(5):655-60.
64. Popovich, J., Kvale, P. A., Eichenhorn, M. S., Radke, J. R., Ohorodnik, J. M., and Fine, G. Diagnostic-Accuracy of Multiple Biopsies From Flexible Fiberoptic Bronchoscopy - A Comparison of Central Versus Peripheral Carcinoma. American Review of Respiratory Disease 1982;125(5):521-3.
65. Wallace, J. M. and Deutsch, A. L. Flexible Fiberoptic Bronchoscopy and Percutaneous Needle Lung Aspiration for Evaluating the Solitary Pulmonary Nodule. Chest 1982;81(6):665-71.
66. Lam B., Wong M.P., Ooi C., Lam W.K., Chan K.N., Ho J.C., and Tsang K.W. Diagnostic Yield of Bronchoscopic Sampling Methods in Bronchial Carcinoma. Respirology 2000;5(3):265-70.
67. Lundgren, R., Bergman, F., and Angstrom, T. Comparison of Trans-Bronchial Fine Needle Aspiration Biopsy, Aspiration of Bronchial Secretion, Bronchial Washing, Brush Biopsy and Forceps Biopsy in the Diagnosis of Lung-Cancer. European Journal of Respiratory Diseases 1983;64(5):378-85.
68. Shure, D. and Fedullo, P. F. The Role of Transcarinal Needle Aspiration in the Staging of Bronchogenic-Carcinoma. Chest 1984;86(5):693-6.
69. Zisholtz, B. M. and Eisenberg, H. Lung-Cancer Cell Type As A Determinant of Bronchoscopy Yield. Chest 1983;84(4):428-30.
121
70. Cox, I. D., Bagg, L. R., Russell, N. J., and Turner, M. J. Relationship of Radiologic Position to the Diagnostic Yield of Fiberoptic Bronchoscopy in Bronchial-Carcinoma. Chest 1984;85(4):519-22.
71. Horsley, J. R., Miller, R. E., Amy, R. W. M., and King, E. G. Bronchial Submucosal Needle Aspiration Performed Through the Fiberoptic Bronchoscope. Acta Cytologica 1984;28(3):211-7.
72. Schenk, D. A., Bryan, C. L., Bower, J. H., and Myers, D. L. Trans-Bronchial Needle Aspiration in the Diagnosis of Bronchogenic-Carcinoma. Chest 1987;92(1):83-5.
73. Naidich, D. P., Sussman, R., Kutcher, W. L., Aranda, C. P., Garay, S. M., and Ettenger, N. A. Solitary Pulmonary Nodules - Ct-Bronchoscopic Correlation. Chest 1988;93(3):595-8.
74. Shiner, R. J., Rosenman, J., Katz, I., Reichart, N., Hershko, E., and Yellin, A. Bronchoscopic Evaluation of Peripheral Lung-Tumors. Thorax 1988;43(11):887-9.
75. Gay, P. C. and Brutinel, W. M. Trans-Bronchial Needle Aspiration in the Practice of Bronchoscopy. Mayo Clinic Proceedings 1989;64(2):158-62.
76. Mori, K., Yanase, N., Kaneko, M., Ono, R., and Ikeda, S. Diagnosis of Peripheral Lung-Cancer in Cases of Tumors 2 Cm Or Less in Size. Chest 1989;95(2):304-8.
77. Wagner, E. D., Ramzy, I., Greenberg, S. D., and Gonzalez, J. M. Trans-Bronchial Fine-Needle Aspiration - Reliability and Limitations. American Journal of Clinical Pathology 1989;92(1):36-41.
78. Mak, V. H. F., Johnston, I. D. A., Hetzel, M. R., and Grubb, C. Value of Washings and Brushings at Fiberoptic Bronchoscopy in the Diagnosis of Lung-Cancer. Thorax 1990;45(5):373-6.
79. Saita, S., Tanzillo, A., Riscica, C., Maresca, A., Potenza, E., and Darrigo, M. Bronchial Brushing and Biopsy - A Comparative-Evaluation in Diagnosing Visible Bronchial Lesions. European Journal of Cardio-Thoracic Surgery 1990;4(5):270-2.
80. Popp, W., Rauscher, H., Ritschka, L., Redtenbacher, S., Zwick, H., and Dutz, W. Diagnostic Sensitivity of Different Techniques in the Diagnosis of Lung-Tumors With the Flexible Fiberoptic Bronchoscope - Comparison of Brush Biopsy, Imprint Cytology of Forceps Biopsy, and Histology of Forceps Biopsy. Cancer 1-1-1991;67(1):72-5.
81. Buccheri, G., Barberis, P., and Delfino, M. S. Diagnostic, Morphological, and Histopathologic Correlates in Bronchogenic-Carcinoma - A Review of 1,045 Bronchoscopic Examinations. Chest 1991;99(4):809-14.
122
82. Pirozynski, M. Bronchoalveolar Lavage in the Diagnosis of Peripheral, Primary Lung-Cancer. Chest 1992;102(2):372-4.
83. de Gracia, J., Bravo, C., Miravitlles, M., Tallada, N., Orriols, R., Bellmunt, J., Vendrell, M., and Morell, F. Diagnostic-Value of Bronchoalveolar Lavage in Peripheral Lung-Cancer. American Review of Respiratory Disease 1993;147(3):649-52.
84. Torrington, K. G. and Kern, J. D. The Utility of Fiberoptic Bronchoscopy in the Evaluation of the Solitary Pulmonary Nodule. Chest 1993;104(4):1021-4.
85. Debeljak, A., Mermolja, M., Sorli, J., Zupancic, M., Zorman, M., and Remskar, J. Bronchoalveolar Lavage in the Diagnosis of Peripheral Primary and Secondary Malignant Lung-Tumors. Respiration 1994;61(4):226-30.
86. Milman, N., Faurschou, P., Munch, E. P., and Grode, G. Transbronchial Lung-Biopsy Through the Fiber Optic Bronchoscope - Results and Complications in 452 Examinations. Respiratory Medicine 1994;88(10):749-53.
87. Castella, J., Buj, J., Puzo, C., Anton, P. A., and Burgues, C. Diagnosis and Staging of Bronchogenic Carcinoma by Transtracheal and Transbronchial Needle Aspiration. Annals of Oncology 1995;6:21-4.
88. Gasparini, S., Ferretti, M., Secchi, E. B., Baldelli, S., Zuccatosta, L., and Gusella, P. Integration of Transbronchial and Percutaneous Approach in the Diagnosis of Peripheral Pulmonary Nodules Or Masses - Experience With 1,027 Consecutive Cases. Chest 1995;108(1):131-7.
89. Piaton, E., Grilletravigneaux, M. H., Saugier, B., and Pellet, H. Prospective-Study of Combined Use of Bronchial Aspirates and Biopsy Specimens in Diagnosis and Typing of Centrally Located Lung-Tumors. British Medical Journal 11-3-1995;310(6980):624-7.
90. Chechani, V. Bronchoscopic Diagnosis of Solitary Pulmonary Nodules and Lung Masses in the Absence of Endobronchial Abnormality. Chest 1996;109(3):620-5.
91. Govert, J. A., Kopita, J. M., Matchar, D., Kussin, P. S., and Samuelson, W. M. Cost-Effectiveness of Collecting Routine Cytologic Specimens During Fiberoptic Bronchoscopy for Endoscopically Visible Lung Tumor. Chest 1996;109(2):451-6.
92. Sing, A., Freudenberg, N., Kortsik, C., Wertzel, H., Klosa, B., and Hasse, J. Comparison of the Sensitivity of Sputum and Brush Cytology in the Diagnosis of Lung Carcinomas. Acta Cytologica 1997;41(2):399-408.
93. Aristizabal, J. F., Young, K. R., and Nath, H. Can Chest CT Decrease the Use of Preoperative Bronchoscopy in the Evaluation of Suspected Bronchogenic Carcinoma? Chest 1998;113(5):1244-9.
123
94. Bilaceroglu, S., Kumcuoglu, Z., Alper, H., Osma, E., Cagirici, U., Gunel, O., Bayol, U., Celikten, E., Perim, K., and Kose, T. CT Bronchus Sign-Guided Bronchoscopic Multiple Diagnostic: Procedures in Carcinomatous Solitary Pulmonary Nodules and Masses. Respiration 1998;65(1):49-55.
95. Mclean, A. N., Semple, P. D., Franklin, D. H., Petrie, G., Millar, E. A., and Douglas, J. G. The Scottish Multi-Centre Prospective Study of Bronchoscopy for Bronchial Carcinoma and Suggested Audit Standards. Respiratory Medicine 1998;92(9):1110-5.
96. Wongsurakiat P., Wongbunnate S., Dejsomritrutai W., Charoenratanakul S., Tscheikuna J., Youngchaiyud P., Pushpakom R., Maranetra N., Nana A., Chierakul N., Sakiyalak U., and Ruengjam C. Diagnostic Value of Bronchoalveolar Lavage and Postbronchoscopic Sputum Cytology in Peripheral Lung Cancer. Respirology 1998;3(2):131-7.
97. Dasgupta, A., Jain, P., Minai, O. A., Sandur, S., Meli, Y., Arroliga, A. C., and Mehta, A. C. Utility of Transbronchial Needle Aspiration in the Diagnosis of Endobronchial Lesions. Chest 1999;115(5):1237-41.
98. Govert, J. A., Dodd, L. G., Kussin, P. S., and Samuelson, W. M. A Prospective Comparison of Fiberoptic Transbronchial Needle Aspiration and Bronchial Biopsy for Bronchoscopically Visible Lung Carcinoma. Cancer Cytopathology 25-6-1999;87(3):129-34.
99. Reichenberger, F., Weber, J., Tamm, M., Bolliger, C. T., Dalquen, P., Perruchoud, A. P., and Soler, M. The Value of Transbronchial Needle Aspiration in the Diagnosis of Peripheral Pulmonary Lesions. Chest 1999;116(3):704-8.
100. Baaklini, W. A., Reinoso, M. A., Gorin, A. B., Sharafkanch, A., and Manian, P. Diagnostic Yield of Fiberoptic Bronchoscopy in Evaluating Solitary Pulmonary Nodules. Chest 2000;117(4):1049-54.
101. Bungay, H. K., Pal, C. R., Davies, C. W. H., Davies, R. J. O., and Gleeson, F. V. An Evaluation of Computed Tomography As an Aid to Diagnosis in Patients Undergoing Bronchoscopy for Suspected Bronchial Carcinoma. Clinical Radiology 2000;55(7):554-60.
102. Diette, G. B., White, P., Terry, P., Jenckes, M., Rosenthal, D., and Rubin, H. R. Utility of on-Site Cytopathology Assessment for Bronchoscopic Evaluation of Lung Masses and Adenopathy. Chest 2000;117(4):1186-90.
103. Hsiao CJ., Tang C.C., Hui-Chen, Wang C.H., Yu C.T., Kuo H.P., and Lin H.C. The Value of Transbronchial Lung Biopsy in the Diagnosis of Peripheral Lung Tumors According to Cell Type. Chang Gung Med J 2000;23(10):584-9.
104. Tang C.C., Hsiao CJ., Chen, H., Wang C.H., Lin H.C., Yu C.T., and Kuo H.P. Value of Bronchoalveolar Lavage Combined With Transbronchial Lung Biopsy in the Diagnosis of Peripheral Lung Cancer. Chang Gung Med J 2000;23(11):695-700.
124
105. Gunen, H., Kizkin, O., Tahaoglu, C., and Aktas, O. Utility of Blind Forceps Biopsy of the Main Carina and Upper-Lobe Carina in Patients With Non-Small Cell Lung Cancer. Chest 2001;119(2):632-7.
106. Jones, A. M., Hanson, I. M., Armstrong, G. R., and O'Driscoll, B. R. Value and Accuracy of Cytology in Addition to Histology in the Diagnosis of Lung Cancer at Flexible Bronchoscopy. Respiratory Medicine 2001;95(5):374-8.
107. Karahalli, E., Yilmaz, A., Turker, H., and Ozvaran, K. Usefulness of Various Diagnostic Techniques During Fiberoptic Bronchoscopy for Endoscopically Visible Lung Cancer: Should Cytologic Examinations Be Performed Routinely? Respiration 2001;68(6):611-4.
108. Baba, M., Iyoda, A., Yasufuku, K., Haga, Y., Hoshino, H., Sekine, Y., Shibuya, K., Iizasa, T., Saitoh, Y., Hiroshima, K., and Fujisawa, T. Preoperative Cytodiagnosis of Very Small-Sized Peripheral-Type Primary Lung Cancer. Lung Cancer 2002;37(3):277-80.
109. Gaber, K. A., Goldman, J. M., and Farrell, D. J. Cytological Examination of the Whole Endobronchial Brush in Bronchoscopic Diagnosis of Lung Cancer. Respiratory Medicine 2002;96(4):259-61.
110. Bandoh, S., Fujita, J., Tojo, Y., Yokomise, H., Satoh, K., Kobayashi, S., and Ishida, T. Diagnostic Accuracy and Safety of Flexible Bronchoscopy With Multiplanar Reconstruction Images and Ultrafast Papanicolaou Stain - Evaluating Solitary Pulmonary Nodules. Chest 2003;124(5):1985-92.
111. Diaz, G., Jimenez, D., Dominguez-Reboiras, S., Carrillo, F., and Perez-Rodriguez, E. Yield of Bronchoscopy in the Diagnosis of Neoplasm Metastatic to Lung. Respiratory Medicine 2003;97(1):27-9.
112. Kawaraya, M., Gemba, K., Ueoka, H., Nishii, K., Kiura, K., Kodani, T., Tabata, M., Shibayama, T., Kitajima, T., and Tanimoto, M. Evaluation of Various Cytological Examinations by Bronchoscopy in the Diagnosis of Peripheral Lung Cancer. British Journal of Cancer 17-11-2003;89(10):1885-8.
113. Skaansar K. Fleksibel Bronkoskopi. Tidsskr Nor Lægeforen 2003;123(11):1529-30.
114. Trkanjec, J. T., Peros-Golubicic, T., Grozdek, D., Ivicevic, A., and Alilovic, M. The Role of Transbronchial Lung Biopsy in the Diagnosis of Solitary Pulmonary Nodule. Collegium Antropologicum 2003;27(2):669-75.
115. Estarriol, M. H., Goday, M. R., Sanchez, M. V., Padro, X. B., Sot, M. T. C., and Quetglas, F. S. Bronchoscopic Lung Biopsy With Fluoroscopy to Study 164 Localized Pulmonary Lesions. Archivos de Bronconeumologia 2004;40(11):483-8.
116. Kaçar, N., Tuksavul, F., Edipoglu, O., Ermete, S., and Guclu, S. Z. Effectiveness of Transbronchial Needle Aspiration in the Diagnosis of Exophytic Endobronchial Lesions and Submucosal/Peribronchial Diseases of the Lung. Lung Cancer 2005;50(2):221-6.
125
117. van der Drift, M. A., van der Wilt, G. J., Thunnissen, F. B. J. M., and Janssen, J. P. A Prospective Study of the Timing and Cost-Effectiveness of Bronchial Washing During Bronchoscopy for Pulmonary Malignant Tumors. Chest 2005;128(1):394-400.
118. Gildea, T. R., Mazzone, P. J., Karnak, D., Meziane, M., and Mehta, A. C. Electromagnetic Navigation Diagnostic Bronchoscopy - A Prospective Study. American Journal of Respiratory and Critical Care Medicine 1-11-2006;174(9):982-9.
119. Heyer, C. M., Kagel, T., Lemburg, S. P., Walter, J. W., de Zeeuw, J., Junker, K., Mueller, K. M., Nicolas, V., and Bauer, T. T. Transbronchial Biopsy Guided by Low-Dose MDCT: A New Approach for Assessment of Solitar Pulmonary Nodules. American Journal of Roentgenology 2006;187(4):933-9.
120. Joos, L., Patuto, N., Chhajed, P. N., and Tamm, M. Diagnostic Yield of Flexible Bronchoscopy in Current Clinical Practice. Swiss Medical Weekly 4-3-2006;136(9-10):155-9.
121. Schwarz, Y., Greif, J., Becker, H. D., Ernst, A., and Mehta, A. Real-Time Electromagnetic Navigation Bronchoscopy to Peripheral Lung Lesions Using Overlaid CT Images - The First Human Study. Chest 2006;129(4):988-94.
122. Uchida, J., Imamura, F., Takenaka, A., Yoshimura, M., Ueno, K., Oda, K., Nakayama, T., Tsukamoto, Y., Higashiyama, M., and Kusunoki, Y. Improved Diagnostic Efficacy by Rapid Cytology Test in Fluoroscopy-Guided Bronchoscopy. Journal of Thoracic Oncology 2006;1(4):314-8.
123. Eberhardt, R., Anantham, D., Herth, F., Feller-Kopman, D., and Ernst, A. Electromagnetic Navigation Diagnostic Bronchoscopy in Peripheral Lung Lesions. Chest 2007;131(6):1800-5.
124. Lee, H. S., Kwon, S. Y., Kim, D. K., Il Yoon, H., Lee, S. M., Lee, J. H., Lee, C. T., Chung, H. S., Han, S. K., Shim, Y. S., and Yim, J. J. Bronchial Washing Yield Before and After Forceps Biopsy in Patients With Endoscopically Visible Lung Cancers. Respirology 2007;12(2):277-82.
125. Liam C.K., Pang Y.K., and Poosparajah S. Diagnostic Yield of Flexible Bronchoscopic Procedures in Lung Cancer Patients According to Tumour Location. Singapore Med J 2007;48(7):625-31.
126. Makris, D., Scherpereel, A., Leroy, S., Bouchindhomme, B., Faivre, J. B., Remy, J., Ramon, P., and Marquette, C. H. Electromagnetic Navigation Diagnostic Bronchoscopy for Small Peripheral Lung Lesions. European Respiratory Journal 2007;29(6):1187-92.
127. Shinagawa, N., Yamazaki, K., Onodera, Y., Asano, F., Ishida, T., Moriye, H., and Nishimura, M. Virtual Bronchoscopic Navigation System Shortens the Examination Time - Feasibility Study of Virtual Bronchoscopic Navigation System. Lung Cancer 2007;56(2):201-6.
126
128. Tachihara, M., Ishida, T., Kanazawa, K., Sugawara, A., Watanabe, K., Uekita, K., Moriya, H., Yamazaki, K., Asano, F., and Munakata, M. A Virtual Bronchoscopic Navigation System Under X-Ray Fluoroscopy for Transbronchial Diagnosis of Small Peripheral Pulmonary Lesions. Lung Cancer 2007;57(3):322-7.
129. Tremblay, A., Michaud, G., and Urbanski, S. J. Hot Biopsy Forceps in the Diagnosis of Endobronchial Lesions. European Respiratory Journal 2007;29(1):108-11.
130. Danila, E., Zurauskas, E., Loskutoviene, G., Zablockis, R., Nargela, R., Birzietyte, V., and Valentinaviciene, G. Significance of Bronchoscopic Lung Biopsy in Clinical Practice. Advances in Medical Sciences 2008;53(1):11-6.
131. Kanemoto, K., Satoh, H., Ishikawa, H., Kagohashi, K., Kurishima, K., and Sekizawa, K. Diagnostic Procedures for Small Pulmonary Nodules Detected by Mass-Screening. Anticancer Research 2008;28(5B):3153-5.
132. Oki, M., Saka, H., Kitagawa, C., Tanaka, S., Shimokata, T., Mori, K., and Kajikawa, S. Novel Thin Bronchoscope With a 1.7-Mm Working Channel for Peripheral Pulmonary Lesions. European Respiratory Journal 2008;32(2):465-71.
133. Ost, D., Shah, R., Anasco, E., Lusardi, L., Doyle, J., Austin, C., and Fein, A. A Randomized Trial of CT Fluoroscopic-Guided Bronchoscopy Vs Conventional Bronchoscopy in Patients With Suspected Lung Cancer. Chest 2008;134(3):507-13.
134. Roth, K., Hardie, J. A., Andreassen, A. H., Leh, F., and Eagan, T. M. L. Predictors of Diagnostic Yield in Bronchoscopy: a Retrospective Cohort Study Comparing Different Combinations of Sampling Techniques. BMC Pulmonary medicine 2008;8(2).
135. Roth, K., Hardie, J. A., Andreassen, A. H., Leh, F., and Eagan, T. M. L. Cost Minimization Analysis for Combinations of Sampling Techniques in Bronchoscopy of Endobronchial Lesions. Respiratory Medicine 2009;103(6):888-94.
136. Dobler, C. C. and Crawford, A. B. H. Bronchoscopic Diagnosis of Endoscopically Visible Lung Malignancies: Should Cytological Examinations Be Carried Out Routinely? Internal Medicine Journal 2009;39(12):806-11.
137. Franke, K. J., Nilius, G., and Ruhle, K. H. Transbronchial Catheter Aspiration Compared to Forceps Biopsy in the Diagnosis of Peripheral Lung Cancer. European Journal of Medical Research 28-1-2009;14(1):13-7.
138. Iwano S., Imaizumi K., Okada T., Hasegawa Y., and Naganawa S. Virtual Bronchoscopy-Guided Transbronchial Biopsy for Aiding the Diagnosis of Peripheral Lung Cancer. Eur J Radiol 2009;(Article in press, available online).
139. Lamprecht, B., Porsch, P., Pirich, C., and Studnicka, M. Electromagnetic Navigation Bronchoscopy in Combination With PET-CT and Rapid On-Site
127
Cytopathologic Examination for Diagnosis of Peripheral Lung Lesions. Lung 2009;187(1):55-9.
140. Aktas, Z., Gunay, E., Hoca, N. T., Yilmaz, A., Demirag, F., Gunay, S., Sipit, T., and Kurt, E. B. Endobronchial Cryobiopsy or Forceps Biopsy for Lung Cancer Diagnosis. Annals of Thoracic Medicine 2010;5(4):242-6.
141. Boonsarngsuk, V., Raweelert, P., Sukprapruet, A., Chaiprasithikul, R., and Kiatboonsri, S. Factors Affecting the Diagnostic Yield of Flexible Bronchoscopy Without Guidance in Pulmonary Nodules or Masses. Singapore Medical Journal 2010;51(8):660-5.
142. Rial, M. B., Delgado, M. N., Sanmartin, A. P., Leiro-Fernandez, V., Duran, M. T., Represas, C. R., and Fernandez-Villar, A. Multivariate Study of Predictive Factors for Clearly Defined Lung Lesions Without Visible Endobronchial Lesions in Transbronchial Biopsy. Surgical Endoscopy and Other Interventional Techniques 2010;24(12):3031-6.
143. Hautmann, H., Henke, M. O., and Bitterling, H. High Diagnostic Yield From Transbronchial Biopsy of Solitary Pulmonary Nodules Using Low-Dose CT-Guidance. Respirology 2010;15(4):677-82.
144. Schumann, C., Hetzel, J., Babiak, A. J., Merk, T., Wibmer, T., Moller, P., Lepper, P. M., and Hetzel, M. Cryoprobe Biopsy Increases the Diagnostic Yield in Endobronchial Tumor Lesions. Journal of Thoracic and Cardiovascular Surgery 2010;140(2):417-21.
145. Seijo L.M., de Torres J.P., Lozano M.D., Bastarrika G., Alcaide A.B., Lacunza M.M., and Zulueta J.J. Diagnostic Yield of Electromagnetic Navigation Bronchoscopy Is Highly Dependent on the Presence of a Bronchus Sign on CT Imaging: Results From a Prospective Study. Chest 2010;138(6):1316-21.
146. Lam, W. K., So, S. Y., Hsu, C., and Yu, D. Y. C. Fiberoptic Bronchoscopy in the Diagnosis of Bronchial-Cancer - Comparison of Washings, Brushings and Biopsies in Central and Peripheral Tumors. Clinical Oncology 1983;9(1):35-42.
147. Degracia, J., Bravo, C., Miravitlles, M., Tallada, N., Orriols, R., Bellmunt, J., Vendrell, M., and Morell, F. Diagnostic-Value of Bronchoalveolar Lavage in Peripheral Lung-Cancer. American Review of Respiratory Disease 1993;147(3):649-52.
148. Honeybourne, D., Babb, J., Bowie, P., Brewin, A., Fraise, A., Garrard, C., Harvey, J., Lewis, R., Neumann, C., Wathen, C. G., and Williams, T. British Thoracic Society Guidelines on Diagnostic Flexible Bronchoscopy. Thorax 2001;56:I1-I21.
149. Rivera, M. P., Detterbeck, F., and Mehta, A. C. Diagnosis of Lung Cancer - The Guidelines. Chest 2003;123(1):129S-36S.

128
150. Steinfort, D. P., Khor, Y. H., Manser, R. L., and Irving, L. B. Radial Probe Endobronchial Ultrasound for the Diagnosis of Peripheral Lung Cancer: Systematic Review and Meta-Analysis. Eur Respir J 2010;[Epub ahead of print].
151. Anantham, D., Koh, M. S., and Ernst, A. Endobronchial Ultrasound. Respiratory Medicine 2009;103(10):1406-14.
152. Herth, F. J. F., Ernst, A., and Becker, H. D. Endobronchial Ultrasound-Guided Transbronchial Lung Biopsy in Solitary Pulmonary Nodules and Peripheral Lesions. European Respiratory Journal 2002;20(4):972-4.
153. Kikuchi, E., Yamazaki, K., Sukoh, N., Kikuchi, J., Asahina, H., Imura, M., Onodera, Y., Kurimoto, N., Kinoshita, I., and Nishimura, M. Endobronchial Ultrasonography With Guide-Sheath for Peripheral Pulmonary Lesions. European Respiratory Journal 2004;24(4):533-7.
154. Shirakawa, T., Imamura, F., Hamamoto, J., Honda, I., Fukushima, K., Sugimoto, M., and Shirkakusa, T. Usefulness of Endobronchial Ultrasonography for Transbronchial Lung Biopsies of Peripheral Lung Lesions. Respiration 2004;71(3):260-8.
155. Yang, M. C., Liu, W. T., Wang, C. H., Lin, H. C., Chen, H. C., Chou, C. L., Hsueh, S., and Kuo, H. P. Diagnostic Value of Endobronchial Ultrasound-Guided Transbronchial Lung Biopsy Peripheral Lung Cancers. Journal of the Formosan Medical Association 2004;103(2):124-9.
156. Asahina, H., Yamazaki, K., Onodera, Y., Kikuchi, E., Shinagawa, N., Asano, F., and Nishimura, M. Transbronchial Biopsy Using Endobronchial Ultrasonography With a Guide Sheath and Virtual Bronchoscopic Navigation. Chest 2005;128(3):1761-5.
157. Becker, H. D., Herth, F., Ernst, A., and Schwarz, Y. Bronchoscopic Biopsy of Peripheral Lung Lesions Under Electromagnetic Guidance. Journal of bronchology 2005;12(1):9-13.
158. Paone, G., Nicastri, E., Lucantoni, G., Iacono, R. D., Battistoni, P., D'Angeli, A. L., and Galluccio, G. Endobronchial Ultrasound-Driven Biopsy in the Diagnosis of Peripheral Lung Lesions. Chest 2005;128(5):3551-7.
159. Herth, F. J. F., Eberhardt, R., Becker, H. D., and Ernst, A. Endobronchial Ultrasound-Guided Transbronchial Lung Biopsy in Fluoroscopically Invisible Solitary Pulmonary Nodules - A Prospective Trial. Chest 2006;129(1):147-50.
160. Chung, Y. H., Lie, C. H., Chao, T. Y., Wang, Y. H., Lin, A. S., Wang, J. L., and Lin, M. C. Endobronchial Ultrasonography With Distance for Peripheral Pulmonary Lesions. Respiratory Medicine 2007;101(4):738-45.
161. Dooms, C. A., Verbeken, E. K., Becker, H. D., Demedts, M. G., and Vansteenkiste, J. F. Endobronchial Ultrasonography in Bronchoscopic Occult Pulmonary Lesions. Journal of Thoracic Oncology 2007;2(2):121-4.
129
162. Eberhardt, R., Anantham, D., Ernst, A., Feller-Kopman, D., and Herth, F. Multimodality Bronchoscopic Diagnosis of Peripheral Lung Lesions - A Randomized Controlled Trial. American Journal of Respiratory and Critical Care Medicine 1-7-2007;176(1):36-41.
163. Yamada, N., Yamazaki, K., Kurimoto, N., Asahina, H., Kikuchi, E., Shinagawa, N., Oizumi, S., and Nishimura, M. Factors Related to Diagnostic Yield of Transbronchial Biopsy Using Endobronchial Ultrasonography With a Guide Sheath in Small Peripheral Pulmonary Lesions. Chest 2007;132(2):603-8.
164. Yoshikawa, M., Sukoh, N., Yamazaki, K., Kanazawa, K., Fukumoto, S. I., Harada, M., Kikuchi, E., Munakata, M., Nishimura, M., and Isobe, H. Diagnostic Value of Endobronchial Ultrasonography With a Guide Sheath for Peripheral Pulmonary Lesions Without X-Ray Fluoroscopy. Chest 2007;131(6):1788-93.
165. Asano, F., Matsuno, Y., Tsuzuku, A., Anzai, M., Shinagawa, N., Yamazaki, K., Ishida, T., and Moriya, H. Diagnosis of Peripheral Pulmonary Lesions Using a Bronchoscope Insertion Guidance System Combined With Endobronchial Ultrasonography With a Guide Sheath. Lung Cancer 2008;60(3):366-73.
166. Fielding, D. I. K., Robinson, P. J., and Kurimoto, N. Biopsy Site Selection for Endobronchial Ultrasound Guide-Sheath Transbronchial Biopsy of Peripheral Lung Lesions. Internal Medicine Journal 2008;38(2):77-84.
167. Koh, M. S., Tee, A., Wong, P., Antippa, P., and Irving, L. B. Advances in Lung Cancer Diagnosis and Staging: Endobronchial Ultrasound. Internal Medicine Journal 2008;38(2):85-9.
168. Eberhardt, R., Ernst, A., and Herth, F. J. F. Ultrasound-Guided Transbronchial Biopsy of Solitary Pulmonary Nodules Less Than 20 Mm. European Respiratory Journal 2009;34(6):1284-7.
169. Chao, T. Y., Chien, M. T., Lie, C. H., Chung, Y. H., Wang, J. L., and Lin, M. C. Endobronchial Ultrasonography-Guided Transbronchial Needle Aspiration Increases the Diagnostic Yield of Peripheral Pulmonary Lesions A Randomized Trial. Chest 2009;136(1):229-36.
170. Huang, C. T., Ho, C. C., Tsai, Y. J., Yu, C. J., and Yang, P. C. Factors Influencing Visibility and Diagnostic Yield of Transbronchial Biopsy Using Endobronchial Ultrasound in Peripheral Pulmonary Lesions. Respirology 2009;14(6):859-64.
171. Oki, M., Saka, H., Kitagawa, C., Kogure, Y., Mori, K., and Kajikawa, S. Endobronchial Ultrasound-Guided Transbronchial Biopsy Using Novel Thin Bronchoscope for Diagnosis of Peripheral Pulmonary Lesions. Journal of Thoracic Oncology 2009;4(10):1274-7.
172. Disayabutr, S., Tscheikuna, J., and Nana, A. The Endobronchial Ultrasound-Guided Transbronchial Lung Biopsy in Peripheral Pulmonary Lesions. J Med Assoc Thai. 2010;93(Suppl 1):S94-S101.
130
173. Eberhardt, R., Morgan, R. K., Ernst, A., Beyer, T., and Herth, F. J. F. Comparison of Suction Catheter Versus Forceps Biopsy for Sampling of Solitary Pulmonary Nodules Guided by Electromagnetic Navigational Bronchoscopy. Respiration 2010;79(1):54-60.
174. Mizugaki, H., Shinagawa, N., Kanegae, K., Yamada, N., Asahina, H., Kikuchi, E., Oizumi, S., Tamaki, N., and Nishimura, M. Combining Transbronchial Biopsy Using Endobronchial Ultrasonography With a Guide Sheath and Positron Emission Tomography for the Diagnosis of Small Peripheral Pulmonary Lesions. Lung Cancer 2010;68(2):211-5.
175. Roth, K, Eagan, T. M, Andreassen, A. H, Leh, F, and Hardie, J. A. A Randomised Trial of Endobronchial Ultrasound Guided Sampling in Peripheral Lung Lesions. Lung Cancer 2011;74(2):219-25.
176. Bolliger, C. T. and Mathur, P. N. ERS/ATS Statement on Interventional Pulmonology. European Respiratory Journal 2002;19(2):356-73.
177. Robinson, R. Economic-Evaluation and Health-Care. What Does It Mean. British Medical Journal 11-9-1993;307(6905):670-3.
178. Robinson, R. Economic-Evaluation and Health-Care - Cost-Benefit-Analysis. British Medical Journal 9-10-1993;307(6909):924-6.
179. Robinson, R. Economic-Evaluation and Health-Care. Cost-Utility Analysis. British Medical Journal 2-10-1993;307(6908):859-62.
180. Robinson, R. Economic-Evaluation and Health-Care. Costs and Cost-Minimization Analysis. British Medical Journal 18-9-1993;307(6906):726-8.
181. Robinson, R. Economic-Evaluation and Health-Care - Cost-Effectiveness Analysis. British Medical Journal 25-9-1993;307(6907):793-5.
182. Gold, M, Siegel, J, Russel, L, and Weinstein, M. Cost-Effectiveness in Health and Medicine. Oxford university press 1996.
183. SPSS for Windows. Rel. 15.0.1.1 Chicago. SPSS Inc 2007.
184. TreeAgePro Healthcare 1.4.1. Williamstown. TreeAge Software Inc 2008.
185. SPSS Data Entry Station. Rel. 4.0.0 Chicago. SPSS Inc 1996.
186. Stata Statistical Software: Release 11. StataCorp. College Station, TX: StataCorp LP. 2009.
187. Buttner, J. Diagnostic Validity As a Theoretical Concept and As a Measurable Quantity. Clinica Chimica Acta 25-4-1997;260(2):131-43.
188. Kimberlin, C. L. and Winterstein, A. G. Validity and Reliability of Measurement Instruments Used in Research. American Journal of Health-System Pharmacy 1-12-2008;65(23):2276-84.
131
189. Klein-Geltink, J. E., Rochon, P. A., Dyer, S., Laxer, M., and Anderson, G. M. Readers Should Systematically Assess Methods Used to Identify, Measure and Analyze Confounding in Observational Cohort Studies. Journal of Clinical Epidemiology 2007;60(8):766-72.
190. Normand, S. L. T., Sykora, K., Li, P., Mamdani, M., Rochon, P. A., and Anderson, G. M. Readers Guide to Critical Appraisal of Cohort Studies: 3. Analytical Strategies to Reduce Confounding. British Medical Journal 30-4-2005;330(7498):1021-3.
191. Slack, M. K. and Draugalis, J. R. Establishing the Internal and External Validity of Experimental Studies. American Journal of Health-System Pharmacy 15-11-2001;58(22):2173-81.
192. Bossuyt, P. M., Reitsma, J. B., Bruns, D. E., Gatsonis, C. A., Glasziou, P. P., Irwig, L. M., Lijmer, J. G., Moher, D., Rennie, D., and De Vet, H. C. W. Towards Complete and Accurate Reporting of Studies of Diagnostic Accuracy: The STARD Initiative. Clinical Chemistry 2003;49(1):1-6.
193. Begg, C., Cho, M., Eastwood, S., Horton, R., Moher, D., Olkin, I., Pitkin, R., Rennie, D., Schulz, K. F., Simel, D., and Stroup, D. F. Improving the Quality of Reporting of Randomized Controlled Trials - The CONSORT Statement. Jama-Journal of the American Medical Association 28-8-1996;276(8):637-9.
194. Moher, D., Schulz, K. F., and Altman, D. G. The CONSORT Statement: Revised Recommendations for Improving the Quality of Reports of Parallel-Group Randomised Trials. Lancet 14-4-2001;357(9263):1191-4.
195. Chhajed, P. N. and Tamm, M. Bronchoscopy for Small Pulmonary Nodules and Mediastinal Staging of Lung Cancer - Just Do It! American Journal of Respiratory and Critical Care Medicine 1-11-2006;174(9):961-2.
196. Herth, F. J. F., Eberhardt, R., and Ernst, A. The Future of Bronchoscopy in Diagnosing, Staging and Treatment of Lung Cancer. Respiration 2006;73(4):399-409.
197. Annema, J. T. and Rabe, K. F. State of the Art Lecture: EUS and EBUS in Pulmonary Medicine. Endoscopy 2006;38:S118-S122.
198. Briggs, A. H. and O'Brien, B. J. The Death of Cost-Minimization Analysis? Health Economics 2001;10(2):179-84.
199. Eberhardt, R., Kahn, N., Gompelmann, D., Schumann, M., Heussel, CP., and Herth, F. J. F. LungPoint--a New Approach to Peripheral Lesions. Journal of Thoracic Oncology 2010;5(10):1559-63.