BROCHURE DISTRIBUTION RESEARCH SUMMER … Distribution Research, Summer 2014 2 | Page Brochure...
21
BROCHURE DISTRIBUTION RESEARCH SUMMER 2014 Summary Report Key Findings Prepared By: Professor Ian Cross Director of the Center for Marketing Technology Bentley University
-
Upload
truonghanh -
Category
Documents
-
view
213 -
download
0
Transcript of BROCHURE DISTRIBUTION RESEARCH SUMMER … Distribution Research, Summer 2014 2 | Page Brochure...

BROCHURE DISTRIBUTION RESEARCH
SUMMER 2014
Summary Report Key Findings
Prepared By: Professor Ian Cross
Director of the Center for Marketing Technology
Bentley University

Brochure Distribution Research, Summer 2014
2 | P a g e
Brochure Distribution Research for IAPBD
Summer 2014
A Summary of Key Findings
Professor Ian Cross, Director of the Center for Marketing Technology
Bentley University
Methodology
Bentley University, Center for Marketing Technology, created a survey in collaboration
with the IAPBD to understand the effectiveness of tourism brochures during June and
July 2014. 22 locations were selected in the USA, Canada, and Western Europe and
2,751 tourists responded to the survey, an increase of 1,114 interviews, leading to even
more reliable results in 2014. Professional marketers interviewed participants in situ
and their survey answers were collated and sent to the CMT for data entry and analysis.
Important Respondent Characteristics
The vast majority of visitors travelled as tourists and had stopped at a tourist location
for personal enjoyment and interest. In fact, 75% of tourists were visiting for leisure
(down from 79% 2 years ago) and an additional 14% were combining a leisure activity
with a business trip (this ‘combo-travel’ is up from 12% 2 years ago). Only 17% of people
were travelling on their own. Women are increasing number of visitors (53% compared
to 50% 2 years ago) of the visitors were women and nearly a quarter (23%) of visitors
lived nearby and enjoyed experiencing attractions near their doorstep. The most
frequent users of brochures are women age 25-54, typically women travelling with their
friends or significant other. We are seeing that the age group of female brochure users
is expanding from 35 to younger women aged in mid 20s. This is interesting because it
suggests that the ‘digital natives’ also like tangible brochures for information.
Now that you arrived at your destination, how
influential are the following information sources in
planning your current travel decisions? Please rate
EACH information source.-Brochure / Map
Influenced Somewhat
Influenced
Did Not
Influence Total
Are you male or female? Male 573 284 332 1189
Female 772 323 243 1338
Total 1345 607 575 2527
How old are you? Under 25 154 77 116 347
25-34 307 145 128 580
35-44 294 151 126 571

Brochure Distribution Research, Summer 2014
3 | P a g e
45-54 289 132 111 532
55-64 166 72 56 294
65+ 137 35 41 213
Total 1347 612 578 2537
Influence of Brochures Before a Trip is Holding Steady
The Internet continues to provide the primary source of information for tourists
planning a trip, but it is slightly decreasing in importance from 2 years ago (53% down
from 57% if we just focus on major influence scores). Personal recommendations from
family and friends (48%) are almost as influential. However, maps and brochures from
display stands continue to be almost as influential before a tourist arrives at their
destination (29% compared to 31% in 2012). Some locations, such as Berlin in Germany
and Orlando, Florida reported more than half of the visitors had used a travel brochure
before arriving in the cities, suggesting that major city destinations continue to benefit
from brochures. Traditional media has continued to decline in importance for television
(11%), newspapers (8%) and billboards (6%), when only considering major influence
scores. Newspapers are in major decline.
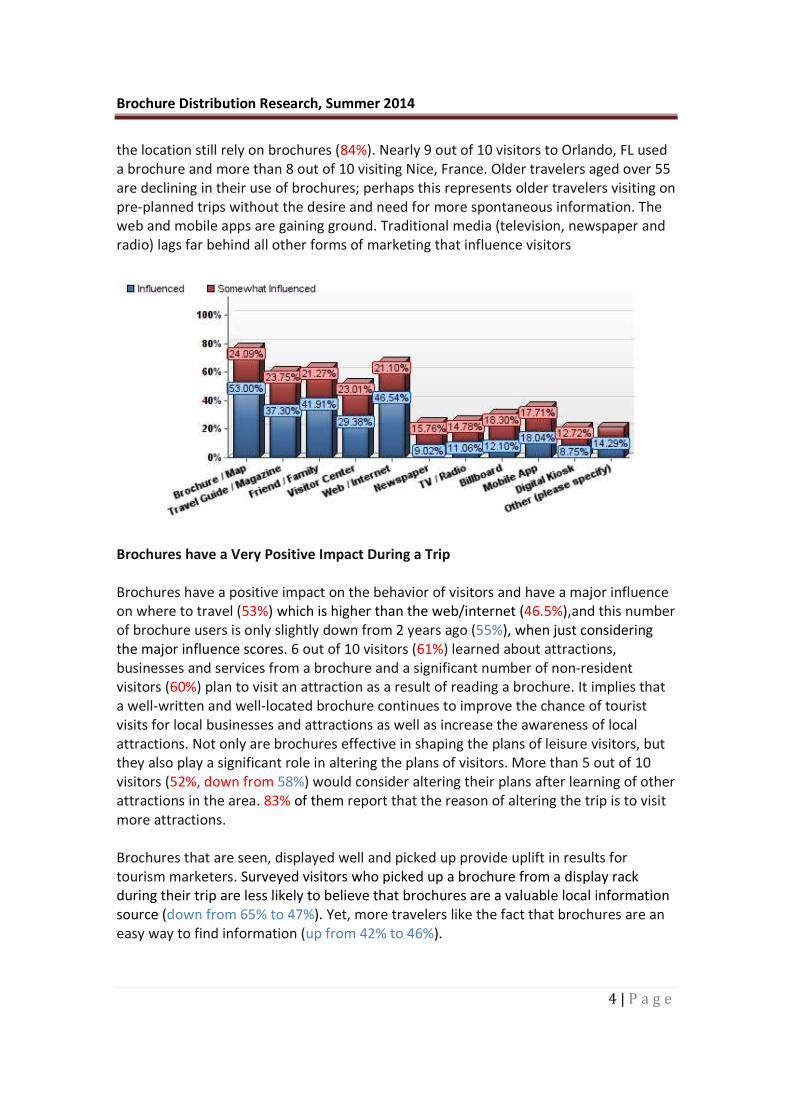
Brochures are the #1 Influencer During a Trip
The most important source of information for a visitor during their trip is a brochure
from a display stand. The influence of brochures from a display stand (53%) trumps web
sites (46.5%) when a tourist arrives at their destination. The web continues to grow in
importance but brochure racks are clearly holding their own. If we add the tourists who
are “somewhat influenced” the number jumps dramatically for brochures (77%) and still
outpaces websites (68%). Although the total number of visitors picking up a brochure at
their destination slightly declined (70% down to 64%), visitors who are unfamiliar with
Brochure Distribution Research, Summer 2014
4 | P a g e
the location still rely on brochures (84%). Nearly 9 out of 10 visitors to Orlando, FL used
a brochure and more than 8 out of 10 visiting Nice, France. Older travelers aged over 55
are declining in their use of brochures; perhaps this represents older travelers visiting on
pre-planned trips without the desire and need for more spontaneous information. The
web and mobile apps are gaining ground. Traditional media (television, newspaper and
radio) lags far behind all other forms of marketing that influence visitors
Brochures have a Very Positive Impact During a Trip
Brochures have a positive impact on the behavior of visitors and have a major influence
on where to travel (53%) which is higher than the web/internet (46.5%),and this number
of brochure users is only slightly down from 2 years ago (55%), when just considering
the major influence scores. 6 out of 10 visitors (61%) learned about attractions,
businesses and services from a brochure and a significant number of non-resident
visitors (60%) plan to visit an attraction as a result of reading a brochure. It implies that
a well-written and well-located brochure continues to improve the chance of tourist
visits for local businesses and attractions as well as increase the awareness of local
attractions. Not only are brochures effective in shaping the plans of leisure visitors, but
they also play a significant role in altering the plans of visitors. More than 5 out of 10
visitors (52%, down from 58%) would consider altering their plans after learning of other
attractions in the area. 83% of them report that the reason of altering the trip is to visit
more attractions.
Brochures that are seen, displayed well and picked up provide uplift in results for
tourism marketers. Surveyed visitors who picked up a brochure from a display rack
during their trip are less likely to believe that brochures are a valuable local information
source (down from 65% to 47%). Yet, more travelers like the fact that brochures are an
easy way to find information (up from 42% to 46%).
Brochure Distribution Research, Summer 2014
5 | P a g e
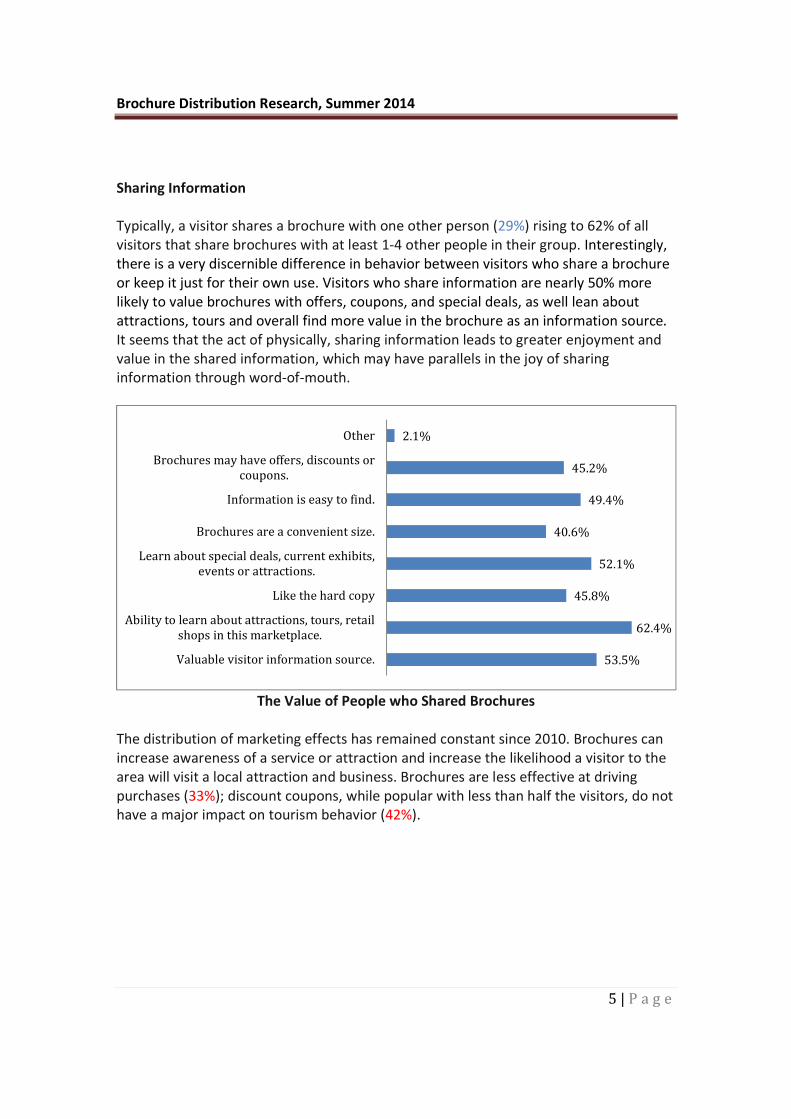
Sharing Information
Typically, a visitor shares a brochure with one other person (29%) rising to 62% of all
visitors that share brochures with at least 1-4 other people in their group. Interestingly,
there is a very discernible difference in behavior between visitors who share a brochure
or keep it just for their own use. Visitors who share information are nearly 50% more
likely to value brochures with offers, coupons, and special deals, as well lean about
attractions, tours and overall find more value in the brochure as an information source.
It seems that the act of physically, sharing information leads to greater enjoyment and
value in the shared information, which may have parallels in the joy of sharing
information through word-of-mouth.
The Value of People who Shared Brochures
The distribution of marketing effects has remained constant since 2010. Brochures can
increase awareness of a service or attraction and increase the likelihood a visitor to the
area will visit a local attraction and business. Brochures are less effective at driving
purchases (33%); discount coupons, while popular with less than half the visitors, do not
have a major impact on tourism behavior (42%).
53.5%
62.4%
45.8%
52.1%
40.6%
49.4%
45.2%
2.1%
Valuable visitor information source.
Ability to learn about attractions, tours, retail
shops in this marketplace.
Like the hard copy
Learn about special deals, current exhibits,
events or attractions.
Brochures are a convenient size.
Information is easy to find.
Brochures may have offers, discounts or
coupons.
Other

Brochure Distribution Research, Summer 2014
6 | P a g e
Use of Brochures
The data collected leads one to believe that tourists enjoy reading brochures about local
attractions, as well as products and services. More importantly, they expect to discover
new attractions from easy to use brochure display racks. More than 5 out of 10 visitors
(55%) agree that brochure information display stands give them the ability to learn
about many attractions, tours, and retail stores in the market place. Visitors appreciate
brochures are a valuable visitor information source (47%). Nearly half the visitors use
brochures to find timely information about current exhibitions and events as well as
special deals and time sensitive offers (47%). Nearly half of visitors also enjoy the
benefit that brochures may have offers, discounts or coupons (42%).
The survey data shows that brochures can positively impact visitors’ plans. A closer
analysis of this data reveals that 23% of visitors who alter their trip plans do so to stay
longer at a given destination. And 52% alter their plans because they were influenced to
want to do and see more from what they read in a local brochure. Even more significant
is the 83% of people who alter their plans do so specifically in order to spend time
enjoying local attractions they have learned about from brochure racks.
Technology
2014 has seen the importance of web and app-based customer review sites. 56% of
travelers claim that they are influenced by customers reviews, only a quarter of all
responders disregard online ratings. Trip Advisor receives the most votes amongst
visitors who rely on online reviews (73%) followed by Yelp.com (34%). Web sites,
primarily accessed from Smart phones and to a lesser extent iPads and Tablets, are
drastically increasing in importance (up from 62% to 82% and from 25% to 44%
0%
10%
20%
30%
40%
50%
60%
70%
80%
90%
Driving
Awareness
Driving
More Visits
for Business
Might Alter
their Plans
Want to
Visit More
Attractions
If Alter their
Plans
Plan to
Purchase
Something
Use a
Coupon
Offered
from a
Brochure
Share the
Brochure

Brochure Distribution Research, Summer 2014
7 | P a g e
respectively). Digital kiosks are catching on, yet with few visitors (up to 9% from 4%)
accessing content from a kiosk. Larger phone displays, lighter laptops and Tablets and
faster web connections and more digital hot spots guarantee that technology will
continue to offer more choices to connect with tourist information. With the growth of
smartphones and tablets, perhaps there is room for convergence with kiosks and
personal devices that can ‘tap’ the kiosk to download all relevant data to one’s own
device. Mobility and convenience are the key factors in searching and using travel and
sight-seeing information.
Conclusion
In 2014 it is easy to predict the continual influence of Internet and Mobile marketing
tools to impact the tourism industry. While we see the impact of the Internet and
electronic media hastening the decline of traditional mass media vehicles such as
television, newspapers and radio, the use of printed tourist brochures is holding its own.
However IAPBD members cannot afford to be complacent as the influence of printed
material continues to slowly decline, even though more than half of travelers that visit
locations with tourism display stands enjoy using the information to enhance their
knowledge of the local area. And the data suggests there are still a lot of tourists happily
using printed brochures. Out of town leisure travelers are using both digital and printed
information as long as it is easy to read and easy to find information about local
attractions located in hotels, tourist attractions and visitor centers. Print and digital
tools are the dominating marketing vehicles for tourism, as well as the great importance
of word of mouth recommendations.
Word of Mouth drives people to search out places and things to do; brochures remind
them of 2 things – the printed brochure reinforces a friend’s recommendation and
secondly it provides other options to enhance someone’s enjoyment of a new
destination or stop along the journey. Sometimes it's the unexpected pleasures that are
discovered by a chance encounter with information is a display rack that makes the
journey special.
The Internet provides an unmatched capability to search any information, anytime as
long as there is a good enough connection, but an easy to carry and easy to read printed
brochure is always at hand in the car or purse. Printed brochures in a convenient display
stand are as popular in small markets as big cities, In the US, Canada and Europe.
The data highlights a trend discovered in 2012 – the realization that it is women who
enjoy the convenience of the printed brochure, the unexpected find. A display rack is
like a curated Pinterest site and marketers should continue to focus on women who are
young and into middle age that appreciate printed brochures as much as their
smartphone, for themselves and their friends, not only their families.

Brochure Distribution Research, Summer 2014
8 | P a g e
More than 1 in every 2 travelers values the information and placement of travel
information provided by the IAPBD. The convergence of digital and print offers new
opportunities for IAPBD members in the future. The information provided enhances the
journey and adds value to the range of options at a destination. The tourism industry
continues to be well served by the IAPBD.
TRAVEL INFORMATION SURVEY RESULTS
1. What is the primary purpose of your trip?
Frequency Percent Valid Percent Cumulative
Percent
Valid
Leisure 2076 74.5 75.1 75.1
Business 307 11.0 11.1 86.2
Business & Leisure 383 13.8 13.8 100.0
Total 2766 99.3 100.0
Missing System 19 .7
Total 2785 100.0
2. Do you reside in this city or nearby area?
Frequency Percent Valid Percent Cumulative
Percent
Valid
Yes, I am a resident 636 22.8 23.0 23.0
No, I am a visitor to this area 2128 76.4 77.0 100.0
Total 2764 99.2 100.0
Missing System 21 .8
Total 2785 100.0
3. How many days will you be away from home on this trip?
Frequency Percent Valid Percent Cumulative
Percent
Valid
Less than 1 day 452 16.2 16.4 16.4
1-2 days 482 17.3 17.5 33.9
3-4 days 641 23.0 23.3 57.2
More than 4 days 1177 42.3 42.8 100.0
Total 2752 98.8 100.0
Missing System 33 1.2
Total 2785 100.0

Brochure Distribution Research, Summer 2014
9 | P a g e
4. BEFORE you arrived at your current destination, did you pick up a brochure from a
brochure display about this destination or activities you were planning to do on this trip?
Frequency Percent Valid Percent Cumulative
Percent
Valid
Yes 944 33.9 34.4 34.4
No 1800 64.6 65.6 100.0
Total 2744 98.5 100.0
Missing System 41 1.5
Total 2785 100.0
5. BEFORE you arrived at your current destination, how influential were the following sources in planning your trip? Please rate EACH information source.
Brochure / Map
Frequency Percent Valid Percent Cumulative
Percent
Valid
Influenced 809 29.0 31.3 31.3
Somewhat Influenced 570 20.5 22.1 53.4
Did Not Influence 1203 43.2 46.6 100.0
Total 2582 92.7 100.0
Missing System 203 7.3
Total 2785 100.0
Travel Guide / Magazine
Frequency Percent Valid Percent Cumulative
Percent
Valid
Influenced 749 26.9 29.4 29.4
Somewhat Influenced 584 21.0 23.0 52.4
Did Not Influence 1211 43.5 47.6 100.0
Total 2544 91.3 100.0
Missing System 241 8.7
Total 2785 100.0

Brochure Distribution Research, Summer 2014
10 | P a g e
Friend / Family
Frequency Percent Valid Percent Cumulative
Percent
Valid
Influenced 1265 45.4 48.6 48.6
Somewhat Influenced 594 21.3 22.8 71.5
Did Not Influence 742 26.6 28.5 100.0
Total 2601 93.4 100.0
Missing System 184 6.6
Total 2785 100.0
Visitor Center
Frequency Percent Valid Percent Cumulative
Percent
Valid
Influenced 399 14.3 15.9 15.9
Somewhat Influenced 448 16.1 17.9 33.8
Did Not Influence 1661 59.6 66.2 100.0
Total 2508 90.1 100.0
Missing System 277 9.9
Total 2785 100.0
Web / Internet
Frequency Percent Valid Percent Cumulative
Percent
Valid
Influenced 1410 50.6 53.7 53.7
Somewhat Influenced 563 20.2 21.4 75.2
Did Not Influence 652 23.4 24.8 100.0
Total 2625 94.3 100.0
Missing System 160 5.7
Total 2785 100.0

Brochure Distribution Research, Summer 2014
11 | P a g e
Newspaper
Frequency Percent Valid Percent Cumulative
Percent
Valid
Influenced 194 7.0 7.8 7.8
Somewhat Influenced 379 13.6 15.2 22.9
Did Not Influence 1924 69.1 77.1 100.0
Total 2497 89.7 100.0
Missing System 288 10.3
Total 2785 100.0
TV / Radio
Frequency Percent Valid Percent Cumulative
Percent
Valid
Influenced 298 10.7 11.9 11.9
Somewhat Influenced 410 14.7 16.3 28.2
Did Not Influence 1803 64.7 71.8 100.0
Total 2511 90.2 100.0
Missing System 274 9.8
Total 2785 100.0
Billboard
Frequency Percent Valid Percent Cumulative
Percent
Valid
Influenced 153 5.5 6.1 6.1
Somewhat Influenced 318 11.4 12.8 18.9
Did Not Influence 2018 72.5 81.1 100.0
Total 2489 89.4 100.0
Missing System 296 10.6
Total 2785 100.0

Brochure Distribution Research, Summer 2014
12 | P a g e
Mobile App
Frequency Percent Valid Percent Cumulative
Percent
Valid
Influenced 410 14.7 16.4 16.4
Somewhat Influenced 382 13.7 15.3 31.7
Did Not Influence 1707 61.3 68.3 100.0
Total 2499 89.7 100.0
Missing System 286 10.3
Total 2785 100.0
Digital Kiosk
Frequency Percent Valid Percent Cumulative
Percent
Valid
Influenced 140 5.0 5.7 5.7
Somewhat Influenced 219 7.9 8.9 14.5
Did Not Influence 2109 75.7 85.5 100.0
Total 2468 88.6 100.0
Missing System 317 11.4
Total 2785 100.0
Other (please specify)
Frequency Percent Valid Percent Cumulative
Percent
Valid
Influenced 116 4.2 19.7 19.7
Somewhat Influenced 44 1.6 7.5 27.2
Did Not Influence 429 15.4 72.8 100.0
Total 589 21.1 100.0
Missing System 2196 78.9
Total 2785 100.0

Brochure Distribution Research, Summer 2014
13 | P a g e
6. Now that you arrived at your destination, at any time during this trip have you picked up a
brochure from a brochure display rack?
Frequency Percent Valid Percent Cumulative
Percent
Valid
Yes 1718 61.7 63.9 63.9
No 971 34.9 36.1 100.0
Total 2689 96.6 100.0
Missing System 96 3.4
Total 2785 100.0
7. Now that you arrived at your destination, how influential are the following information sources in planning
your current travel decisions? Please rate EACH information source.
Brochure / Map
Frequency Percent Valid Percent Cumulative
Percent
Valid
Influenced 1362 48.9 53.0 53.0
Somewhat Influenced 619 22.2 24.1 77.1
Did Not Influence 589 21.1 22.9 100.0
Total 2570 92.3 100.0
Missing System 215 7.7
Total 2785 100.0
Travel Guide / Magazine
Frequency Percent Valid Percent Cumulative
Percent
Valid
Influenced 928 33.3 37.3 37.3
Somewhat Influenced 591 21.2 23.8 61.1
Did Not Influence 969 34.8 38.9 100.0
Total 2488 89.3 100.0
Missing System 297 10.7
Total 2785 100.0

Brochure Distribution Research, Summer 2014
14 | P a g e
Friend / Family
Frequency Percent Valid Percent Cumulative
Percent
Valid
Influenced 1052 37.8 41.9 41.9
Somewhat Influenced 534 19.2 21.3 63.2
Did Not Influence 924 33.2 36.8 100.0
Total 2510 90.1 100.0
Missing System 275 9.9
Total 2785 100.0
Visitor Center
Frequency Percent Valid Percent Cumulative
Percent
Valid
Influenced 719 25.8 29.4 29.4
Somewhat Influenced 563 20.2 23.0 52.4
Did Not Influence 1165 41.8 47.6 100.0
Total 2447 87.9 100.0
Missing System 338 12.1
Total 2785 100.0
Web / Internet
Frequency Percent Valid Percent Cumulative
Percent
Valid
Influenced 1182 42.4 46.5 46.5
Somewhat Influenced 536 19.2 21.1 67.6
Did Not Influence 822 29.5 32.4 100.0
Total 2540 91.2 100.0
Missing System 245 8.8
Total 2785 100.0
Newspaper
Frequency Percent Valid Percent Cumulative
Percent
Valid Influenced 218 7.8 9.0 9.0
Somewhat Influenced 381 13.7 15.8 24.8

Brochure Distribution Research, Summer 2014
15 | P a g e
Did Not Influence 1818 65.3 75.2 100.0
Total 2417 86.8 100.0
Missing System 368 13.2
Total 2785 100.0
TV / Radio
Frequency Percent Valid Percent Cumulative
Percent
Valid
Influenced 267 9.6 11.1 11.1
Somewhat Influenced 357 12.8 14.8 25.8
Did Not Influence 1791 64.3 74.2 100.0
Total 2415 86.7 100.0
Missing System 370 13.3
Total 2785 100.0
Billboard
Frequency Percent Valid Percent Cumulative
Percent
Valid
Influenced 293 10.5 12.1 12.1
Somewhat Influenced 443 15.9 18.3 30.4
Did Not Influence 1685 60.5 69.6 100.0
Total 2421 86.9 100.0
Missing System 364 13.1
Total 2785 100.0
Mobile App
Frequency Percent Valid Percent Cumulative
Percent
Valid
Influenced 439 15.8 18.0 18.0
Somewhat Influenced 431 15.5 17.7 35.7
Did Not Influence 1564 56.2 64.3 100.0
Total 2434 87.4 100.0
Missing System 351 12.6
Total 2785 100.0
Brochure Distribution Research, Summer 2014
16 | P a g e
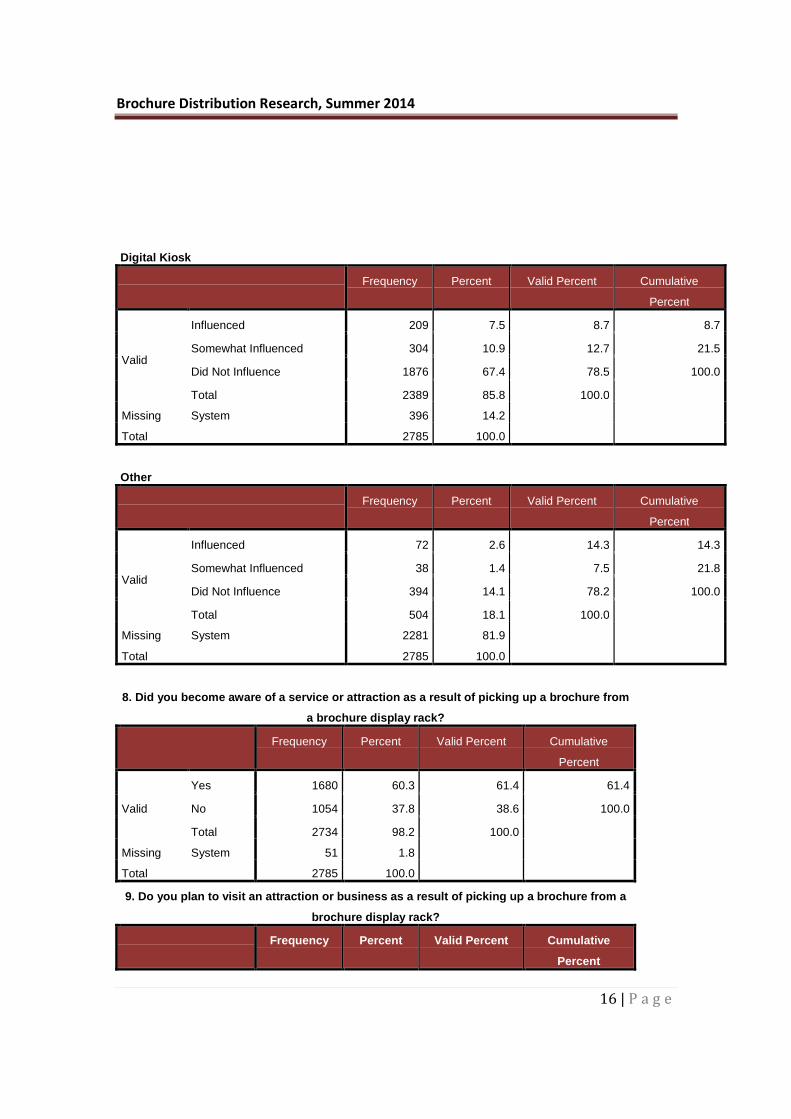
Digital Kiosk
Frequency Percent Valid Percent Cumulative
Percent
Valid
Influenced 209 7.5 8.7 8.7
Somewhat Influenced 304 10.9 12.7 21.5
Did Not Influence 1876 67.4 78.5 100.0
Total 2389 85.8 100.0
Missing System 396 14.2
Total 2785 100.0
Other
Frequency Percent Valid Percent Cumulative
Percent
Valid
Influenced 72 2.6 14.3 14.3
Somewhat Influenced 38 1.4 7.5 21.8
Did Not Influence 394 14.1 78.2 100.0
Total 504 18.1 100.0
Missing System 2281 81.9
Total 2785 100.0
8. Did you become aware of a service or attraction as a result of picking up a brochure from
a brochure display rack?
Frequency Percent Valid Percent Cumulative
Percent
Valid
Yes 1680 60.3 61.4 61.4
No 1054 37.8 38.6 100.0
Total 2734 98.2 100.0
Missing System 51 1.8
Total 2785 100.0
9. Do you plan to visit an attraction or business as a result of picking up a brochure from a
brochure display rack?
Frequency Percent Valid Percent Cumulative
Percent
Brochure Distribution Research, Summer 2014
17 | P a g e
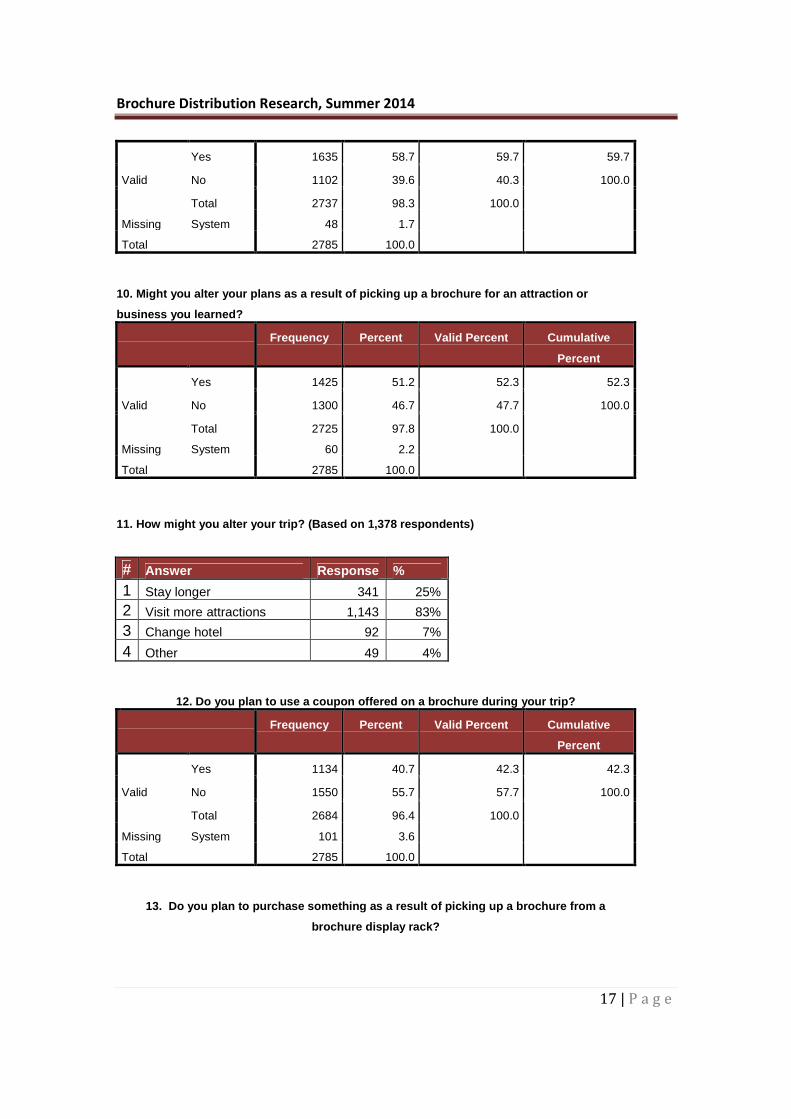
Valid
Yes 1635 58.7 59.7 59.7
No 1102 39.6 40.3 100.0
Total 2737 98.3 100.0
Missing System 48 1.7
Total 2785 100.0
10. Might you alter your plans as a result of picking up a brochure for an attraction or
business you learned?
Frequency Percent Valid Percent Cumulative
Percent
Valid
Yes 1425 51.2 52.3 52.3
No 1300 46.7 47.7 100.0
Total 2725 97.8 100.0
Missing System 60 2.2
Total 2785 100.0
11. How might you alter your trip? (Based on 1,378 respondents)
# Answer Response %
1 Stay longer 341 25%
2 Visit more attractions 1,143 83%
3 Change hotel 92 7%
4 Other 49 4%
12. Do you plan to use a coupon offered on a brochure during your trip?
Frequency Percent Valid Percent Cumulative
Percent
Valid
Yes 1134 40.7 42.3 42.3
No 1550 55.7 57.7 100.0
Total 2684 96.4 100.0
Missing System 101 3.6
Total 2785 100.0
13. Do you plan to purchase something as a result of picking up a brochure from a
brochure display rack?

Brochure Distribution Research, Summer 2014
18 | P a g e
Frequency Percent Valid Percent Cumulative
Percent
Valid
Yes 878 31.5 32.6 32.6
No 1817 65.2 67.4 100.0
Total 2695 96.8 100.0
Missing System 90 3.2
Total 2785 100.0
14. How many people did you share your brochure information with?
Frequency Percent Valid Percent Cumulative
Percent
Valid
None - I did not pick up brochures 604 21.7 22.3 22.3
Myself 421 15.1 15.5 37.8
Myself + 1 792 28.4 29.2 66.9
Myself + 2 413 14.8 15.2 82.2
Myself +3 268 9.6 9.9 92.0
Myself + 4 or more individuals 216 7.8 8.0 100.0
Total 2714 97.5 100.0
Missing System 71 2.5
Total 2785 100.0
15. What do you like about brochures from brochure display racks? Please check ALL that apply. (Based on 2,582 survey takers)
# Answer Response %
1 It’s a valuable visitor information source. 1,217 47%
2 The display gives me the ability to learn about attractions, tours, retail shops in this marketplace. 1,426 55%
3 I like the tangible hard copy information to aid in my decision making. 1,011 39%
4 I can learn about special deals, current exhibits, events or attractions. 1,208 47%
5 Brochures are a convenient size. 957 37%
6 Information is easy to find. 1,192 46%
7 Brochures may have offers, discounts or coupons. 1,079 42%
8 Other 127 5%
16. Which of the following devices do you use to find travel information DURING your trip? Please check ALL that apply. (Based on 2,533 survey takers)
# Answer Response %
1 Smart Phone / Mobile Phone 1,928 82%
2 iPad / Tablet 1,045 44%
3 Laptop Computer 880 37%

Brochure Distribution Research, Summer 2014
19 | P a g e
4 Digital Kiosk 201 9%
17. Are you male or female?
Frequency Percent Valid Percent Cumulative
Percent
Valid
Male 1276 45.8 47.1 47.1
Female 1436 51.6 52.9 100.0
Total 2712 97.4 100.0
Missing System 73 2.6
Total 2785 100.0
18. How old are you?
Frequency Percent Valid Percent Cumulative
Percent
Valid
Under 25 369 13.2 13.6 13.6
25-34 611 21.9 22.4 36.0
35-44 612 22.0 22.5 58.5
45-54 560 20.1 20.6 79.0
55-64 327 11.7 12.0 91.0
65+ 244 8.8 9.0 100.0
Total 2723 97.8 100.0
Missing System 62 2.2
Total 2785 100.0
19. Who are you traveling with? Please check ALL that apply. (Based on 2,689 respondents)
# Answer Response % 1 Alone 464 17% 2 With spouse / life partner 1,268 47% 3 With children 702 26% 4 With friend / colleague / relative 927 34%
20. Will you utilize customer reviews to influence your activity planning?

Brochure Distribution Research, Summer 2014
20 | P a g e
Frequency Percent Valid Percent Cumulative
Percent
Valid
Yes 1506 54.1 56.1 56.1
No 1178 42.3 43.9 100.0
Total 2684 96.4 100.0
Missing System 101 3.6
Total 2785 100.0
21. If yes, which review sites do you typically use? (Based on 1,437 respondents)
# Answer Response %
1 Trip Advisor 1,045 73%
2 Yelp 493 34%
3 FourSquare 140 10%
4 Other 185 13%
22. How important are online ratings to your activity or travel purchase?
Frequency Percent Valid Percent Cumulative
Percent
Valid
Very Important 725 26.0 28.0 28.0
Important 987 35.4 38.2 66.2
Not that Important 571 20.5 22.1 88.2
Not applicable 304 10.9 11.8 100.0
Total 2587 92.9 100.0
Missing System 198 7.1
Total 2785 100.0
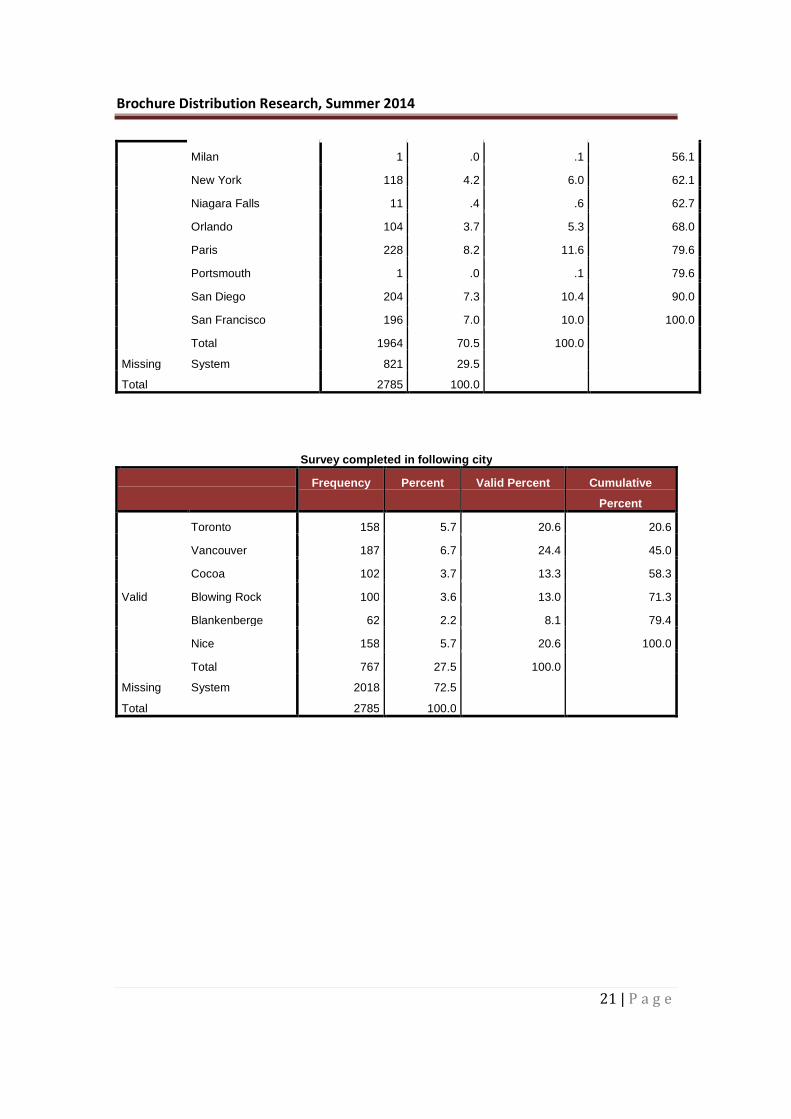
Survey completed in following city
Frequency Percent Valid Percent Cumulative
Percent
Valid
Asheville 2 .1 .1 .1
Berlin 160 5.7 8.1 8.2
Charlotte 70 2.5 3.6 11.8
Chicago 212 7.6 10.8 22.6
Colorado Springs 197 7.1 10.0 32.6
Dublin/Limerick 214 7.7 10.9 43.5
Kansas City 96 3.4 4.9 48.4
Mexico City 150 5.4 7.6 56.1
Brochure Distribution Research, Summer 2014
21 | P a g e
Milan 1 .0 .1 56.1
New York 118 4.2 6.0 62.1
Niagara Falls 11 .4 .6 62.7
Orlando 104 3.7 5.3 68.0
Paris 228 8.2 11.6 79.6
Portsmouth 1 .0 .1 79.6
San Diego 204 7.3 10.4 90.0
San Francisco 196 7.0 10.0 100.0
Total 1964 70.5 100.0
Missing System 821 29.5
Total 2785 100.0
Survey completed in following city
Frequency Percent Valid Percent Cumulative
Percent
Valid
Toronto 158 5.7 20.6 20.6
Vancouver 187 6.7 24.4 45.0
Cocoa 102 3.7 13.3 58.3
Blowing Rock 100 3.6 13.0 71.3
Blankenberge 62 2.2 8.1 79.4
Nice 158 5.7 20.6 100.0
Total 767 27.5 100.0
Missing System 2018 72.5
Total 2785 100.0