Broadcom Corporation 2013 Analyst Day -...
122
-
Upload
nguyenmien -
Category
Documents
-
view
213 -
download
0
Transcript of Broadcom Corporation 2013 Analyst Day -...


2 © 2013 Broadcom Corporation. All rights reserved.
This presentation may contain forward-looking statements within the meaning of the federal securities laws, including the Private Securities Litigation Reform Act of 1995. These forward-looking statements may include the potential growth of the markets in which we compete, and the development status and planned availability of new products, and guidance provided on future revenue, product gross margins and certain operating expenses. In fact, all statements that we make or incorporate by reference in the presentation, other than statements or characterizations of historical fact, are forward-looking statements. It should be clearly understood that these forward-looking statements, and our assumptions about the factors that influence them, are based on the limited information available to us at this date. Such information is subject to change, and we may not inform you when changes occur. We undertake no obligation to revise or update publicly any forward-looking statement to reflect future events or circumstances.
Forward-looking statements are not guarantees of future results and are subject to risks, uncertainties and assumptions that are difficult to predict. Therefore, our actual results could differ materially and adversely from those described in the statements you hear today as a result of various factors. We refer you to our Form 10-K for the year ended December 31, 2012, subsequent and forthcoming 10-Qs and other filings with the SEC, which discuss some of the important risk factors that could contribute to such differences or otherwise affect our business, results of operations and financial condition.
For additional financial and statistical information, including the information disclosed in accordance with SEC Regulation G, please see the Investors section of our website.
2
CAUTIONARY STATEMENT
Broadcom®, the pulse logo, Connecting everything®, the Connecting everything logo, the 5G WiFi logo, XLP®, NetXtreme II®, StrataXGS® and WICED™ are
among the trademarks of Broadcom Corporation and/or its affiliates in the United States, certain other countries and/or the EU. Any other trademarks or trade names
mentioned are the property of their respective owners.

3 © 2013 Broadcom Corporation. All rights reserved. © 2013 Broadcom Corporation. All rights reserved.
AGENDA
8:30 am Introduction
8:35 am Scott A. McGregor
9:00 am Henry Samueli
9:25 am Robert A. Rango
10:00 am Q&A
10:25 am Daniel A. Marotta
10:50 am Rajiv Ramaswami
11:15 am Q&A
11:35 am Eric K. Brandt
12:00 pm Q&A and Closing Remarks

A STRONG CORE AND MULTIPLE PATHS TO SUCCESS
Scott A. McGregor
President and Chief Executive Officer

© 2013 Broadcom Corporation. All rights reserved.
AGENDA
World-class Broadband and Infrastructure Businesses
Applying Formula for Success to Mobile and Wireless
Managing Tightly Through Investment Cycle
6 © 2013 Broadcom Corporation. All rights reserved.
WORLD-CLASS BROADBAND AND INFRASTRUCTURE BUSINESSES
© 2013 Broadcom Corporation. All rights reserved.
Leading Market
Position
Multiple Growth Drivers
6
Complete Platforms with Best-in-Class Technology
Solid Economics

7 © 2013 Broadcom Corporation. All rights reserved.
0 1 0 0 0 1 0 1 0 0 1 0 1 0 1 0 1 0 0 1 1 0 1 0011101010110111010
CLEAR LEADERSHIP IN BROADBAND
Strong End-to-End Solutions
Leading Across All Set-top Box and Last Mile Technologies
Consumer Premise
Central Office
CMTS
DSLAM
OLT
DOCSIS® 3.0 Gateway
ADSL2+
VDSL2
G/EPON
IP-STB
Media Server
OTT
MoCA® HD DVR
DTA
ODU
Small Cell

8 © 2013 Broadcom Corporation. All rights reserved.
99.98% of All Data Traffic Crosses a Broadcom Chip
CLEAR LEADERSHIP IN INFRASTRUCTURE
Coax
Microwave Backhaul
Fiber Optic
Wireless Infrastructure
Service Provider Network
Macro Base Station
Data Center Corporate Enterprise
Enterprise Wi-Fi
Access
Campus Ethernet
Ethernet
Home
Source: Broadcom internal estimate
Fiber
Strong End-to-End Solutions
Leading in Switch, PHY, Knowledge-based Processors

9 © 2013 Broadcom Corporation. All rights reserved.
LEADING CUSTOMERS IN BROADBAND AND INFRASTRUCTURE

10 © 2013 Broadcom Corporation. All rights reserved.
DIFFERENTIATION THROUGH COMPLETE PLATFORMS
Residential Gateway
Security
USB
GPU GPU
HDMI
Power Management
Wi-Fi
Transcoding Switch
PHY
Security
Traffic Manager
Optical
Fabric Bluetooth®
FCoE
PLC Packet Processor 1010
0110
EP 1 2
3 4
DPI
Energy Efficient Ethernet
KBP
Tuner 01010
MoCA
Software
Software

11 © 2013 Broadcom Corporation. All rights reserved.
DIFFERENTIATION THROUGH TECHNOLOGY LEADERSHIP
Trident II: World’s Best Data Center Switch
4B+ Transistors 1.8B+ Transistors
1.28 Tb/s
32 X 40G
Packet Processing
388 Mb Memory
Unmatched by Any Competitor
BCM7445: World’s Best Gateway
Ultra HD and HEVC
Dual VLIW DSP
Quad-core 1.5 GHz ARM Processor

12 © 2013 Broadcom Corporation. All rights reserved.
$0
$500
$1,000
$1,500
$2,000
$2,500
2011 2012 2013E
$0
$500
$1,000
$1,500
$2,000
$2,500
$3,000
$3,500
$4,000
$4,500
2011 2012 2013E
DELIVERING GROWTH AND LEVERAGE
Broadband and Infrastructure Reportable Segment Revenue
(In Millions)
Broadband and Infrastructure Reportable Segment Operating Income
(In Millions)
Note: Broadband and Infrastructure Reportable Segment Revenue and Reportable Segment Operating Income represents the aggregate revenue and operating income of those two reportable segments. Certain licensing revenue that we do not allocate to our reportable segments is excluded from reportable segment revenue but is included in our “All Other” category. Additionally, certain operating expenses that we do not allocate to our reportable segments are excluded from these metrics but are included in our “All Other” category. For a more detailed discussion of our reportable segments and “All Other” category, please see our Quarterly and Annual Reports filed with the SEC, as well as the appendix herein. 2013 data includes updated Q4’13 guidance released on Dec. 10, 2013.

13 © 2013 Broadcom Corporation. All rights reserved.
MULTIPLE FUTURE GROWTH DRIVERS FOR BROADBAND AND INFRASTRUCTURE
Ultra HD
HEVC
G.fast
DOCSIS 3.1
Small Cell
Regional Expansion
PON
Data Centers
Service Providers
Multi-core Processors
Wireless Infrastructure
Automotive

14 © 2013 Broadcom Corporation. All rights reserved.
APPLYING FORMULA FOR SUCCESS TO WIRELESS
14 © 2013 Broadcom Corporation. All rights reserved.
Clear Milestones to LTE Success
Technology Leadership &
Complete Platforms
Continued Secular
Connectivity Growth

15 © 2013 Broadcom Corporation. All rights reserved.
TECHNOLOGY LEADERSHIP ACROSS PLATFORM
Multimedia
Wi-Fi
Modem
GPS CPU CPU
PMU
RF
Complete LTE Platform Available Now
NFC Bluetooth
Mobile Device
Connectivity
Wi-Fi, BT, GPS, NFC
Multimedia and Application Processor
RF and Power Management
Cellular Modem
Cat-4/6 modem IP
Power and space efficient architecture
Carrier aggregation
Envelope tracking
eMBMS
VoLTE
Broadcom World-class IP

16 © 2013 Broadcom Corporation. All rights reserved.
COMPLETE PLATFORM LEADERSHIP CREATES VALUE
Connectivity ASP
BT/Wi-Fi/ GPS/NFC
$3 – $6
Platform ASP
Cellular SoC/ PMU/RF BT/Wi-Fi/ GPS/NFC
$10 – $30
Source: Broadcom internal estimates

17 © 2013 Broadcom Corporation. All rights reserved.
CLEAR MILESTONES TO LTE SUCCESS
2014 Milestones
Renesas Transaction Closed on October 1, 2013
CAT-4 LTE Modem Globally Certified
Multiple Customer Engagements Underway
2013 Milestones
Dual-core LTE SoC Revenue in Early 2014
Sample Quad-core LTE SoC in Mid 2014
Sample Leadership LTE-A Thin Modem in Q3 2014
Tapeout Next-generation SoCs
Strong Design Traction and Multiple Customer Launches
Meaningful LTE Revenue
Early Q1 2014
1H 2014
Mid 2014

18 © 2013 Broadcom Corporation. All rights reserved.
Performance Power
Consumption Footprint
Innovation and Features
CONNECTIVITY TECHNOLOGY LEADERSHIP
Up to 2x Faster Throughput
vs. Competition
Up to 35% Lower Power Consumption
vs. Competition
Up to 35% Smaller Die Size
vs. Competition
First to Market with New Features
and Standards

19 © 2013 Broadcom Corporation. All rights reserved.
Connectivity Pull Through
Complete Platform for Mid-tier and Low-cost Smartphones
CONNECTIVITY SMARTPHONE STRATEGY
Broadcom Leads in Connectivity for Wireless Devices
First to Market with New Features and Standards
Leading Performance
Low Power Consumption
Small Board Footprint
Technology Leadership for Hero and Mid-tier Smartphones

20 © 2013 Broadcom Corporation. All rights reserved.
SIGNIFICANT OPPORTUNITY OUTSIDE OF MOBILE
~30 Billion 2
1: 5.6B global smartphone subscriptions expected by 2019, as reported in the Ericsson Mobility Report, “On the Pulse of the Networked Society,” June 2013 2: 29.8B wirelessly connected devices expected by 2019, as reported by ABI Research, June 2013
5.6 Billion 1

21 © 2013 Broadcom Corporation. All rights reserved.
CONNECTIVITY POWERS THE INTERNET OF THINGS
Microcontroller
Lower Power
Lower Cost
Smaller Footprint
Unique Capabilities
Our Core Strengths
Connectivity

22 © 2013 Broadcom Corporation. All rights reserved.
MANAGING TIGHTLY THROUGH INVESTMENT CYCLE
22 © 2013 Broadcom Corporation. All rights reserved.
Operating Expenses
Gross Margin
Return of Capital
Stock-based Compensation

23 © 2013 Broadcom Corporation. All rights reserved.
MANAGING TIGHTLY THROUGH INVESTMENT CYCLE
Non-GAAP R&D and SG&A Expense Trend in 2014
Stable/down after Q1’14
Non-GAAP Product Gross Margin Expansion
>250 bps Q1’11 to Q3’13
Estimated Return of US Cash Flow
>100% since 2007 >100% in 2013
Stock-based Compensation per Employee
Down ~50% since 2007 Down ~10% in 2013

24 © 2013 Broadcom Corporation. All rights reserved.
CONCLUSIONS
Broadband and Infrastructure Businesses Vibrant and Growing
Cellular Success Drives Economic Value
Managing Tightly Through Investment Cycle

TECHNOLOGY LEADERSHIP IN AN EVOLVING INDUSTRY
Henry Samueli
Co-Founder, Chairman of the Board and Chief Technical Officer Broadcom Corporation

© 2013 Broadcom Corporation. All rights reserved.
AGENDA
Semiconductor Industry Dynamics
Broadcom Advantages

27 © 2013 Broadcom Corporation. All rights reserved. 27 © 2013 Broadcom Corporation. All rights reserved.
SEMICONDUCTOR INDUSTRY DYNAMICS
Rising Manufacturing
Costs
$
Increasing Design Costs
$
Slowing of Moore’s Law

28 © 2013 Broadcom Corporation. All rights reserved.
450mm Wafers
EUV
Immersion Litho + Strained Si
High-K Metal Gate (HKMG)
Double Patterning
3D-FinFETs
7nm 5nm? 40nm 10nm 28nm 20nm 16/14nm
ACCELERATING COMPLEXITY OF NEW PROCESS NODES
2008 2009 2010 2011 2012 2013 2014 2015 2016 2017 202X
Planar Transistor
High-k Dielectric
Oxide
Source
Drain
Silicon Substrate
Gate
Lens
Water Wafer
Is the End of Moore’s Law on the Horizon?

29 © 2013 Broadcom Corporation. All rights reserved.
0
1
2
3
4
5
6
7
90 65 40 28 20 16/14
28nm May Become the Optimal Cost Node
HISTORICAL FIRST: COST PER TRANSISTOR IS RISING
Source: Handel Jones - IBS, “Feature dimension reduction slowdown”, 3/20/2012
EE Times: http://www.eetimes.com/discussion/other/4238315/Feature-dimension-reduction-slowdown
Co
st
Per
Mil
lio
n G
ate
s (
Ce
nts
)
Technology Node (nm)

30 © 2013 Broadcom Corporation. All rights reserved.
DESIGN COSTS INCREASING DRAMATICALLY
Software
Prototype
Validation
Physical
Verification
Architecture
IP Qualification
Source: IBS, Factors for Success in System IC Business and Impact to Business Model
$350
$300
$250
$200
$150
$100
$50
$0 65nm 40nm 28nm 20nm 16/14nm
Process Node
4X
Design Cost (In Millions)
31 © 2013 Broadcom Corporation. All rights reserved.
IMPLICATIONS
Scale Enables the IP Breadth that is Essential for Complete Platform Solutions
Process Node Selection and Platform Integration Strategy Will Change as Moore’s Law Slows
Cost Reductions Will Result from Better Design Engineering Rather than Better Process Engineering

32 © 2013 Broadcom Corporation. All rights reserved.
BROADCOM ADVANTAGES
32 © 2013 Broadcom Corporation. All rights reserved.
Portfolio Breadth
Design Engineering Efficiency
Platform Solutions

33 © 2013 Broadcom Corporation. All rights reserved.
BROADCOM’S UNMATCHED IP PORTFOLIO BREADTH
Broadband Communications Group Mobile & Wireless Group
3G Baseband Processors
LTE Baseband Processors
Cellular RF
Mobile Video Processors
Mobile Graphics Processors
Application Processors
Image Signal Processing
802.11 Wi-Fi
GPS/GNSS
Bluetooth NFC Power
Management
Touch Controllers
Wireless Power
IoT/Wearable SoCs
Wireless Video
Location Based Services
MIMO
Cable STB Satellite STB IP STB
Terrestrial STB
DOCSIS
Cable Modem Cable Head-end
Processors
ADSL/VDSL (CO/CPE)
EPON/GPON (OLT/ONU)
MoCA Home Networking
Powerline Networking
Ultra HD/HEVC Processors
STB Graphics Processors
Digital Transport Adaptors
Video Transcoders
STB Security Processors
Small Cell Gateways
Satellite Outdoor Unit
Media Terminal Adapters
Video Over Wi-Fi
VoIP Full-Band Capture
Front-ends
Security Protocols
Enterprise Wi-Fi
Antennas
Central Engineering Core Technologies (Custom Cell Libraries, Custom Memories, Analog and RF Building Blocks, I/O Cells)
Data Center/ Enterprise Switching
Service Provider
Switching
Software Defined
Networking
Network Virtualization
Ethernet Copper PHYs
Ethernet Optical PHYs
Automotive PHYs
Optical Transport
Ethernet Controllers
Fiber Channel Over Ethernet
Multi-core Processors
Knowledge-based Processors
SMB Processors
Backplane SERDES
Power Over Ethernet
Energy Efficient Ethernet
Time Sensitive Networking
Microwave Backhaul
Baseband/RF
Encryption Coprocessors
Deep Packet Inspection
Security Processors
Infrastructure & Networking Group

34 © 2013 Broadcom Corporation. All rights reserved.
COMPLETE PLATFORM IN NETWORKING
BCM56640 Ethernet Switch
NL56647 Knowledge-based
Processor
BCM88650 Traffic Manager
Packet Processor
BCM56640 Ethernet Switch
NL56647 Knowledge-based
Processor
XLP308 Multi-core Processor
Core Network Switch

35 © 2013 Broadcom Corporation. All rights reserved.
World-class AP and Multimedia
LTE Reference Platform
ACCELERATING PLATFORM SOLUTIONS IN MOBILE
World-class Connectivity IP Cellular
SoC
Power Management
Cellular RF
Wi-Fi
BT
GPS
NFC
World-class RF and Power Management
World-class Cellular Modem IP
All Pieces Now in Place for Complete LTE Platform

36 © 2013 Broadcom Corporation. All rights reserved.
PLATFORM SOLUTIONS IN BROADBAND
QAM Receiver SoC
(BCM3128) On-chip Tuners
GbE Switch
(BCM53125) 7-port Ethernet Switch
STB SoC
(BCM7445) Ultra HD, HEVC Support
Quad-core CPU
Conditional Access
3D Graphics
Transcoding
MoCA Home Networking
Dual-band Wi-Fi
(BCM4360) 2.4 GHz 3x3 for Data
5 GHz 3x3 for Video
Bluetooth
(BCM20702) Remote Control
Cable Modem SoC
(BCM3384) DOCSIS 3.0
On-chip Tuners
24 Downstream Channels
8 Upstream Channels
Ultra HD Set-top Box Gateway

37 © 2013 Broadcom Corporation. All rights reserved.
WORLD-CLASS DESIGN EFFICIENCY
MWG
3D Graphics – Cambridge
BCG - Team D
Video Processing – San Jose and San Diego
Transport – Singapore
Video Encoder – San Jose
Video Decoder – Andover
DDR Controller – Andover
SATA3 – San Jose
Central Engineering
PLL/Oscillators – Irvine
SerDes – Irvine
Video/Audio DACs – Irvine
Memory – Tempe
USB – Singapore
ING
Gigabit Ethernet – Irvine
BCG - Team B
Memory Control – Bangalore
Audio DSP – Bangalore
Video Encoder – Bangalore
Audio I/O – Bangalore
BCG - Team C
RF Modulator – Irvine
BCG - Team A
MoCA – Israel
Quad-core CPU – San Jose
PCIe – Vancouver
HDMI – Irvine
28nm, 1.8 Billion Transistors
BCM7445 Ultra HD STB SoC

38 © 2013 Broadcom Corporation. All rights reserved.
IP SHARING ENHANCES DESIGN EFFICIENCY
BCG
ING
MWG
EXTERNAL CE
98
81
133
109
4109
166 69
37
452
3989 35 131
252
1577 77
3099
645
639
6
15,000+ INSTANCES OF IP SHARING LAST YEAR
Collaboration is Core to
Broadcom’s Cultural Fabric

39 © 2013 Broadcom Corporation. All rights reserved.
0.01
0.1
1
10
100
0.01
0.1
1
10
350nm 65nm 40nm 28nm
Power/Channel
Area/Channel
Cable TV Full-Band Capture
DESIGN INNOVATION KEY FOR COST REDUCTION
Po
wer
Co
nsu
mp
tio
n [
W]
Ch
ip A
rea [
mm
2]
Narrowband Heterodyne-based
RF Tuners
Full-Band Capture Digital Tuners
59% Average Power Reduction Per Process Node
65% Average Area Reduction Per Process Node

40 © 2013 Broadcom Corporation. All rights reserved.
PLATFORM PARTITIONING BECOMES IMPORTANT
28nm Low-cost
Ethernet PHY
SMB Processor/Switch
Touch Controller
RF Transceiver
Cellular Modem?
BT
Wi-Fi
GPS
NFC
Cable Modem
DSL/PON Gateway
Home Networking
STB Video Subsystem?
BROADBAND MOBILE & WIRELESS INFRASTRUCTURE
40-130nm High-voltage/
Specialty RF
Power Over Ethernet
uWave/mmWave RF Power Management
Front-end Module
Power Management
Line Driver
LNA/PA
16/14/10nm High-performance
High-end Switch
Multi-core Processor
KBP
Cellular Modem?
Application Processor
GPU
STB Video Subsystem?
Application Processor
GPU

41 © 2013 Broadcom Corporation. All rights reserved.
BROADCOM WELL POSITIONED
41 41
Increasing Complexity
Increasing Costs
Slowing of Moore’s Law
Semiconductor Industry Dynamics Evolving
Scale and Portfolio Breadth
Best-in-Class IP
Design Efficiency and IP Reuse
Broadcom Strengths

PLATFORM LEADERSHIP FOR SMART CONNECTED DEVICES
Robert A. Rango
Executive Vice President and General Manager Mobile & Wireless Group

© 2013 Broadcom Corporation. All rights reserved.
AGENDA
Favorable Market Dynamics
Continued Connectivity Leadership
Executing on LTE

44 © 2013 Broadcom Corporation. All rights reserved.
STRONG GROWTH IN SMART DEVICES
Source: Ericsson Mobility Report, “On the Pulse of the Networked Society,” Nov. 2013
10X Growth of Mobile Data Traffic Between 2013 and 2019
50% Of Mobile Traffic Will be Video in 2019
5.6B Smartphone Subscriptions by the End of 2019

45 © 2013 Broadcom Corporation. All rights reserved.
CONNECTIVITY EVERYWHERE
$1.2T In New Opportunities from the Internet of Things (IoT)1
10X Increase in the Number of Wearable Devices over the Next 3-4 Years2
Source: 1 Machina Research 2012 ; 2 Credit Suisse 2013

46 © 2013 Broadcom Corporation. All rights reserved.
Multiple Paths to Growth
CONNECTIVITY
Continued Technology Leadership
46 © 2013 Broadcom Corporation. All rights reserved.

47 © 2013 Broadcom Corporation. All rights reserved.
STRONG CONNECTIVITY ATTACH IN LTE
iPhone 5s iPhone 5c Droid DNA One Galaxy S IV Galaxy Note II Galaxy Note III Zeta G2 Nexus 5
“We Estimate that 75% of all LTE Phones Shipping in 2013 Contain a Broadcom Connectivity Combo.” Peter Cooney, Practice Director, ABI Research, Sept. 2013

48 © 2013 Broadcom Corporation. All rights reserved.
EXEMPLARY ROLLOUT AND PRODUCT LEADERSHIP
Tablets and PCs Routers Smartphones

49 © 2013 Broadcom Corporation. All rights reserved.
WHY WE CONTINUE TO WIN IN CONNECTIVITY
~35% Power Consumption
Extended Features
~35% Die Size
~25% Residual BoM
~2X Throughput Performance
Lower Power Consumption
Smaller Footprint
Advanced Features NFC
Ecosystem
Open Source
Source: Broadcom internal estimates
49 © 2013 Broadcom Corporation. All rights reserved.

50 © 2013 Broadcom Corporation. All rights reserved.
Transmit
~2X Higher Throughput Compared to the Competition
THROUGHPUT PERFORMANCE LEADERSHIP
Receive
Source: Broadcom internal testing
142 Mbps
97 Mbps
0
20
40
60
80
100
120
140
160
-79 -72 -68 -61 -55 -49 -43 -28 -19
Th
rou
gh
pu
t (M
bp
s)
Signal Strength (dBm)
Broadcom Tx
Competitor Tx
188 Mbps
75 Mbps
0
50
100
150
200
250
-79 -72 -68 -61 -55 -49 -43 -28 -19
Th
rou
gh
pu
t (M
bp
s)
Signal Strength (dBm)
Broadcom Rx
Competitor Rx

51 © 2013 Broadcom Corporation. All rights reserved.
WI-FI 2X2 MIMO – FASTER AND BETTER COVERAGE
2x2 MIMO Moving into Smaller Screen Devices
Amazon Kindle Fire HD
8.9”/7.0”
BCM43239
Nexus 10
10.1”
BCM43241
iPad Mini With Retina Display
7.9”
iPad Air
9.7”
BCM4324

52 © 2013 Broadcom Corporation. All rights reserved.
Connectivity
Body-borne Computing and Sensors
CONNECTIVITY POWERS INTERNET OF THINGS
Smart Devices Control and Analyze
Everything Connected to the Network

53 © 2013 Broadcom Corporation. All rights reserved.
Key to IoT and Wearable Success
A BUSINESS MODEL THAT SCALES
Buy | Design | Sell
Complete WICED SDK
Support – Instant and Direct
Online Tools and Support Forum
Every Lead Matters
Scalable Distribution Model
53 © 2013 Broadcom Corporation. All rights reserved.

54 © 2013 Broadcom Corporation. All rights reserved.
CELLULAR
Executing on LTE
Leading IP Complete Portfolio
54 © 2013 Broadcom Corporation. All rights reserved.

55 © 2013 Broadcom Corporation. All rights reserved.
4G LTE SoCs
3G SoCs
PORTFOLIO OF 3G AND 4G SOC PLATFORMS
Optimized 3G and 4G Platforms for the Largest Volume Segments
21654 21553 21663/4 28145/55 23550 M320 EOS2
M340 EOS2B

56 © 2013 Broadcom Corporation. All rights reserved.
BROADCOM POWERED COMPLETE 3G PLATFORMS
Galaxy Mega 5.8
5.8”
Galaxy Grand and Grand Duos
5.0”
Galaxy Fame and Fame Lite
3.5”
Galaxy Trend Plus and
Trend Duos
4.0”
Galaxy Pocket Neo
3.0”
Galaxy Ace 3
4.0” 4.3”
Galaxy Core Plus
Galaxy S II Plus
4.3”

57 © 2013 Broadcom Corporation. All rights reserved.
3G PLATFORM TRACTION
Tier One OEMs
BCM23550 BCM21553 BCM21664
BCM21654G BCM21552
China, India and Emerging
Markets
BCM23550 BCM28145 BCM21663
57 © 2013 Broadcom Corporation. All rights reserved.

58 © 2013 Broadcom Corporation. All rights reserved.
Power and Performance Optimized
DUAL-CORE LTE CAT-4 SOCs
M320
Available Now
FDD/TDD LTE Cat-4 (150 Mbps)
DC-HSPA+, EDGE
VoLTE
Dual-core A9 @ 1.2 GHz
28nm
M320+
Available Now
FDD/TDD LTE Cat-4 (150 Mbps)
DC-HSPA+, EDGE
VoLTE
Dual-core A9 @ 1.5 GHz
28nm
58 © 2013 Broadcom Corporation. All rights reserved.

59 © 2013 Broadcom Corporation. All rights reserved.
Third SoC in the LTE Family of Devices: Production in 2014
QUAD-CORE LTE CAT-4 SOC
On Track Customer Demand
M340
Sample: 1H 2014
FDD/TDD LTE Cat-4 (150 Mbps)
DC-HSPA+, EDGE
VoLTE
Quad-core A7
28nm
59 © 2013 Broadcom Corporation. All rights reserved.

60 © 2013 Broadcom Corporation. All rights reserved.
Available Now
BROADCOM’S 5TH GENERATION TURNKEY
M320 M320+ M340
Pin to Pin
OEM-1 SW OEM-2 SW OEM-n SW
Software Framework
Wireless Connectivity,
Location
Co
mp
lete
Re
us
e
Android KitKat
Production-ready Schematics
Production-yielded Parts
Bill of Materials
Key Component Supplier Diversity for China/EM
Cost Optimized
Baseband RF, PMU Baseband RF, PMU

61 © 2013 Broadcom Corporation. All rights reserved.
LTE SOC FEATURES OPTIMIZED TO CAPTURE MARKET GROWTH
25-30% Die Size 20-30%* Power Consumption
Today Carrier Qualified
Today FDD/TDD CAT-4 (150 Mbps) Today VoLTE
*As compared to key parameters of other commercially available LTE solutions
Complete Platform Today
Source: Broadcom internal estimates
61 © 2013 Broadcom Corporation. All rights reserved.

62 © 2013 Broadcom Corporation. All rights reserved.
Sample Mid 2014
LEADERSHIP LTE-A CAT-6 MODEM FEATURES
CAT-6 300 Mbps: FDD/TDD
Carrier Aggregation
VoLTE
TD-SCDMA for China
DC-HSPA+, GSM/EDGE
Flexible World Band RF
Advanced Transmit Technology
eMBMS
© 2013 Broadcom Corporation. All rights reserved.

63 © 2013 Broadcom Corporation. All rights reserved.
MULTIMEDIA PERFORMANCE LEAP IN 2014
Ultra HD (4K x 2K)
Frame Rates (to 120 fps)
More Efficient Codecs (H.265/HEVC)
Video
Higher Quality Images
Higher Speed Pixel Processing
Smart Imaging and Augmented Reality
Imaging
Mpix/s JPEG Encode
3X
3X
Video Capture Video Playback
2X
4X
Current 2014 (Next Generation)
Source: Broadcom internal estimates

64 © 2013 Broadcom Corporation. All rights reserved.
Enhanced ARM Core Implementations
ARM 64 bit V8 (A53/A57) Lead Licensee
Application Processors
Latest Graphics Libraries (OpenGL ES, GPGPU)
Higher Processing (GFLOPS, Frames/Second)
Smallest Size and Lowest Power
Graphics
fps
AP AND GRAPHICS PERFORMANCE LEAP IN 2014 Current 2014 (Next Generation)
GFLOPS Polygons/s
5X
10X
Core Number Performance
3X
4 >4
Source: Broadcom internal estimates

65 © 2013 Broadcom Corporation. All rights reserved.
LEADING IP FOR SMART DEVICES
AP Application Processor
GPU Image Signal
Processor Video
Modem
Multimode RF PMU
802.11ac
BT 4.0
NFC
GNSS
Touch
802.11ac
BT 4.0
NFC
GNSS
Touch
802.11ac
BT 4.0
NFC
LTE
Smartphone and Tablets IoT and Wearables Set-top Boxes
65 © 2013 Broadcom Corporation. All rights reserved.

66 © 2013 Broadcom Corporation. All rights reserved.
SUMMARY
First Broadcom LTE Smartphone
Leading IP and Complete Platform Solutions
Strong and Broadening Customer Relationships
66 © 2013 Broadcom Corporation. All rights reserved.

Daniel A. Marotta
Executive Vice President and General Manager Broadband Communications Group
LEADING IN BROADBAND

© 2013 Broadcom Corporation. All rights reserved.
AGENDA
Best-in-Class Broadband Business
Multiple Growth Drivers

69 © 2013 Broadcom Corporation. All rights reserved.
BEST-IN-CLASS BROADBAND BUSINESS
69 © 2013 Broadcom Corporation. All rights reserved.
Delivering Results
Market Leadership
Technology Leadership

70 © 2013 Broadcom Corporation. All rights reserved.
2013 HIGHLIGHTS
Ultra HD and HEVC
Set-top Box SoC
HomePlug AV2
High-Density DSL Vectoring
Leadership
Launched Key 28nm
Products
Sampled Numerous ARM-based Products
Launched 3G/LTE Small Cell
Innovation
Record Segment
Revenue and Profit
Strong Gross Margins
Accretive to Company Profitability
Financial*
Expected to Outgrow Peer Group by ~1,500 bps in 2013
* Based on metrics of our Broadband Communications reportable segment. 2013 financial highlights includes updated Q4’13 guidance released on Dec 10, 2013.
1st
1st
1st

71 © 2013 Broadcom Corporation. All rights reserved.
LEVERAGING IP ACROSS ALL END MARKETS
Leadership IP End Markets
Cable TV
Satellite TV
IP-TV
Fiber
Terrestrial
DSL
Cable Modem
Cellular
Retail
Powerline
Processors
Modem
Protocol Stacks
Middleware
Demod
Ethernet
Graphics
MPEG
RF Tuner
Security
Voice
Audio MoCA
Wi-Fi
Bluetooth
GPS
NFC

72 © 2013 Broadcom Corporation. All rights reserved.
POWERING GLOBAL BROADBAND INFRASTRUCTURE
N. America
EU
UK
S. America
S. Africa
India
China
Korea Japan
S.E. Asia
Oceania
M.E. and N. Africa
Turkey

73 © 2013 Broadcom Corporation. All rights reserved.
IP + INTEGRATION = PLATFORM ADVANTAGE
Two Broadcom Chips
vs. Five Chips from Five Competitors
Broadcom-based HD Set-top Box with DOCSIS 3.0 and MoCA 2.0
BCM3383 Cable Modem
DDR Memory
1
BCM7435 MPEG Server
DDR Memory
2
Flash 1
Competitor Set-top Box
MPEG SoC
DDR Memory
3
Cable Modem
Cable Front-end
Transcode 4x
DDR Memory
2
DDR Memory
1 MoCA 2.0
Flash 1
Flash 2
Broadcom = Lower Cost, Lower Power, Smaller Footprint

74 © 2013 Broadcom Corporation. All rights reserved.
MULTIPLE GROWTH DRIVERS
New Geographies
New Features
New Markets
74 © 2013 Broadcom Corporation. All rights reserved.

75 © 2013 Broadcom Corporation. All rights reserved.
DEVELOPING MARKETS: INDIA
0
4
8
12
16
SD HD & PVR
Mill
ion
s
2014 Satellite Set-top Box Forecast
Source: Broadcom internal estimates
India Cable Digitization Underway (100M unit TAM)
Broadcom Offering Optimized Solutions for Broad Customer Base in India
76 © 2013 Broadcom Corporation. All rights reserved.
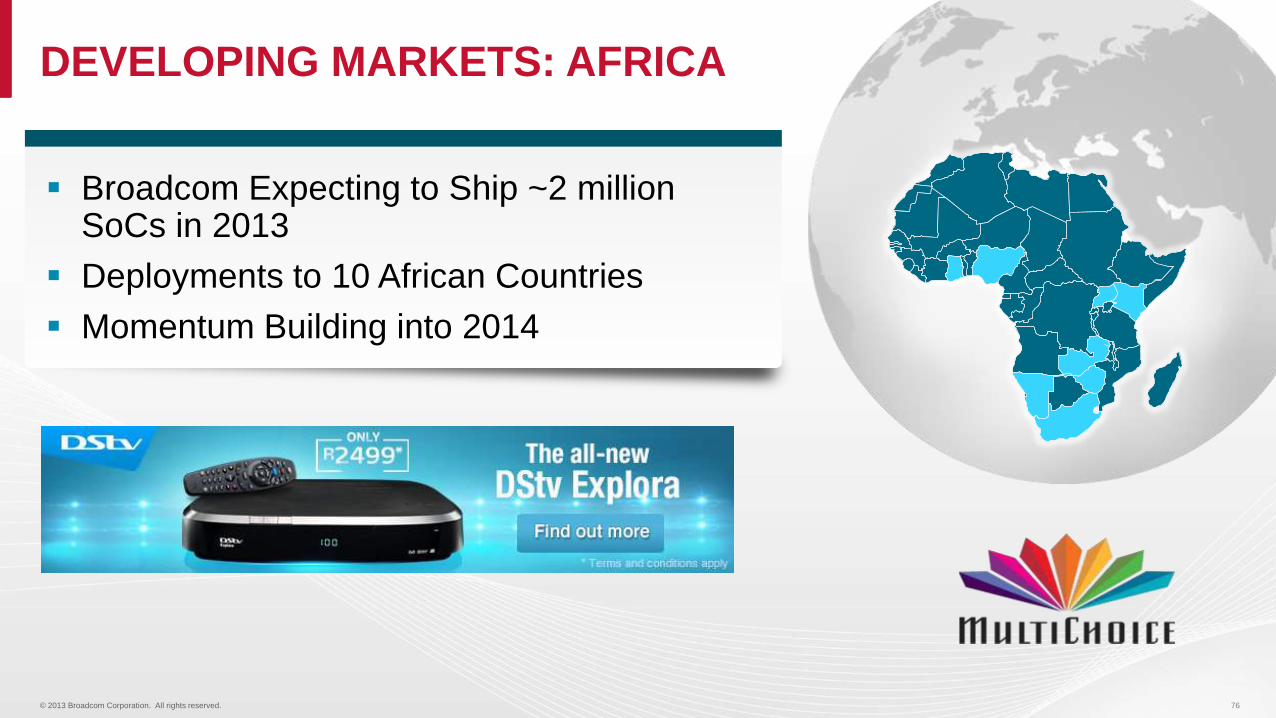
Broadcom Expecting to Ship ~2 million SoCs in 2013
Deployments to 10 African Countries
Momentum Building into 2014
DEVELOPING MARKETS: AFRICA

77 © 2013 Broadcom Corporation. All rights reserved.
DEVELOPING MARKETS: LATIN AMERICA
World Cup and Rio Olympics Expected to Drive Premium Pay-TV Subscriptions
Net Serviços de Comunicação Investing in Advanced Broadband Infrastructure

78 © 2013 Broadcom Corporation. All rights reserved.
Broadcom Innovation Improves Operational Performance
Self-install Gone Wrong, Detected Next Day Splitter installed backwards!
Creates Disruptive Capital and Operation Opportunities for Cable Operators
Scanning and Analyzing 1.4M End-point Daily
Old process would take an entire day
NEW FEATURES: FULL-BAND CAPTURE
Before
After
“Just the Beginning…Mind Boggling Opportunities…Cable will Never be the Same.” Comcast Management

79 © 2013 Broadcom Corporation. All rights reserved.
System-level Vectoring Chips Reduce Cost by 10x, Power by 3x and Support 192-line Noise Cancellation
NEW FEATURES: VDSL VECTORING
40% Increase in Broadcom Content Per VDSL Line
Doubles Down-stream Data Rates
Broadcom End-to-End Solution Displaces up to 3 FPGAs
FPGA FPGA FPGA

80 © 2013 Broadcom Corporation. All rights reserved.
NEW FEATURES: ULTRA HD
Broadcom Leading the Transition to Ultra HD and HEVC
2011 2012 2013
8,000
7,000
0
Ultra HD TV Shipment Forecast by Region
(In Thousands)
6,000
5,000
4,000
3,000
2,000
1,000
2014 2015 2016
Source: NPD Display Search Quarterly TV Design and Features Report
Middle East and Africa
Latin America
Asia Pacific
China
Eastern Europe
Western Europe
North America
Japan

81 © 2013 Broadcom Corporation. All rights reserved.
ROGERS NETBOX 3.0 DELIVERS ADVANCED FEATURES
Utilizes Three Broadcom Products 8 x 4 DOCSIS 3.0 Cable Modem
8-channel FBC Cable Demodulator
BCM7425 Set-top Box Server
Incorporates Leading Features
MoCA 2.0
Dual Transcoding
Fast-channel Change

82 © 2013 Broadcom Corporation. All rights reserved.
NEW FEATURES ENHANCE VALUE PROPOSITION
2010 2011 2012 2013
Average Semiconductor Pricing Trend (~-10-14%/yr)
Average Pricing in Broadband (~1-2% CAGR)
Source: Broadcom financials and internal estimates
Full-Band Capture
Multiple Transcoders
MoCA 2.0 and Wi-Fi
High-performance CPUs
HEVC
Ultra HD
New Features

83 © 2013 Broadcom Corporation. All rights reserved.
0
200
400
600
800
1,000
1,200
2010 2011 2012 2013 2014 2015 2016 2017 2018
OTT COMPLEMENTARY TO PAY-TV SERVICES
Over-the-Top Services Drive Demand for Broadband Service
Netflix consumers represent ~33% of peak Internet traffic in North America
Competition among Carriers Drives Innovation
Broadcom Supports a Range of OTT Products
Pay-TV Subs OTT Subs
Source: ABI Research 2013
(In Millions)

84 © 2013 Broadcom Corporation. All rights reserved.
BUILDING MOMENTUM IN SMALL CELLS
RESIDENTIAL ENTERPRISE
OUTDOOR
Macro Indoor Small Cells Outdoor Small Cells

85 © 2013 Broadcom Corporation. All rights reserved.
CONCLUSIONS
Broadband Business Best-in-Class
Multiple Growth Drivers

DRIVING INFRASTRUCTURE AND NETWORKING
Rajiv Ramaswami
Executive Vice President and General Manager Infrastructure & Networking Group

© 2013 Broadcom Corporation. All rights reserved.
AGENDA
Best-in-Class Infrastructure Business
Multiple Growth Opportunities
88 © 2013 Broadcom Corporation. All rights reserved.
BEST-IN-CLASS INFRASTRUCTURE BUSINESS
Market Leadership
Delivering Results
Technology Leadership
88 © 2013 Broadcom Corporation. All rights reserved.

89 © 2013 Broadcom Corporation. All rights reserved.
XLP®
88650 FE1600
Scalable Data Center Solutions Support SDN, Virtualization and Service Delivery
WORLD-CLASS DATA CENTER PORTFOLIO
Trident II
Aggregation and Core
StrataXGS® XLP®
StrataXGS®
Microserver Connectivity
Rack-level BCM Management
XLP® Trident II
NetXtreme®
10GBASE-T
Highest Port Density 10 GbE
NetXtreme II®
40G SerDes
Top-of-Rack

90 © 2013 Broadcom Corporation. All rights reserved.
Aggregation Network
Access Network
Core Network
Fiber
DSL
PON
2G GSM: T1/E1
µWave
BTS
Cell Site Gateway/
Router/Node
eNodeB
Microwave IDU/ODU
NID/Demarc
MTU/MDU
ONU
Microwave Aggregation
Hub Site Router
DSLAM
OLT
Pre-Aggregation Packet
(Optical) Transport
Carrier Ethernet
Aggregation
Services Edge Router
Cloud Data
Centers
BSC/RNC
Mobile Packet Core
Core Routing
3G/4G: Ethernet
WORLD-CLASS SERVICE PROVIDER PORTFOLIO
End-to-End Packet Solutions for Cost-effective Carrier Networks

91 © 2013 Broadcom Corporation. All rights reserved.
Aggregation Network
Access Network
Core Network
Fiber
DSL
PON
2G GSM: T1/E1
µWave
BTS
Cell Site Gateway/
Router/Node
eNodeB
Microwave IDU/ODU
NID/Demarc
MTU/MDU
ONU
Microwave Aggregation
Hub Site Router
DSLAM
OLT
Pre-Aggregation Packet
(Optical) Transport
Carrier Ethernet
Aggregation
Services Edge Router
Cloud Data
Centers
BSC/RNC
Mobile Packet Core
Core Routing
3G/4G: Ethernet
Knowledge- based
Processor
XLP® II Multi-core Processor
Knowledge- based
Processor
XLP® II Multi-core Processor
XLP® II Multi-core Processor
XLP® II Multi-core Processor
Knowledge- based
Processor
88030 56640
56300
56240
56240
56150
84540
88650
88650 FE1600
84540
Trident II
56450
WORLD-CLASS SERVICE PROVIDER PORTFOLIO
End-to-End Packet Solutions for Cost-effective Carrier Networks
85620 85620

92 © 2013 Broadcom Corporation. All rights reserved.
3+ GHz Server-class CPU
High-performance Networking
16nm
Custom ARMv8 64b
Coming Soon
MIPS 64b
Coming Soon
Coming Soon
ARMv8 64b
Rich Networking IP
Embedded Security
Optimized Solutions
BROAD PORTFOLIO OF MULTI-CORE PROCESSORS XLP II
MIPS 64b
80 nxCPUs
160 Gbps Networking
100 Gbps Security
Hardware Virtualization
5B+ Transistors
Optimized for NFV
StrataGX
ARM 32b
Dual-core
Rich Networking IP
Embedded Security

93 © 2013 Broadcom Corporation. All rights reserved.
PROVIDER OF CHOICE FOR NETWORK INFRASTRUCTURE

94 © 2013 Broadcom Corporation. All rights reserved.
POWERING GLOBAL CARRIERS AND DATA CENTERS
CARRIERS
DATA CENTERS

95 © 2013 Broadcom Corporation. All rights reserved.
$0
$500
$1,000
$1,500
$2,000
$2,500
2009 2010 2011 2012 2013E*
Infrastructure and Networking Reportable Segment Revenue (In Millions)
DELIVERING STRONG GROWTH
*2013 ING revenue based on guidance released on Dec. 10, 2013

96 © 2013 Broadcom Corporation. All rights reserved.
MATERIALLY OUTPERFORMING PEER GROUP IN 2013
*2013 ING revenue based on guidance released on Dec. 10, 2013. Peers include Marvell (networking), Mellanox (chips and boards), FSL (networking), ELX, QLGC, LSI (networking), CAVM, AMCC, PMCS (2/3 optical and mobile), VTSS, EZCH.
>10%
~-1%
Infrastructure and Networking Reportable Segment Revenue*
Peer Group
Revenue Growth Estimates

97 © 2013 Broadcom Corporation. All rights reserved.
MULTIPLE GROWTH DRIVERS
Multi-core Processors
Data Center
Automotive Ethernet
Service Provider
Wireless Infrastructure
97 © 2013 Broadcom Corporation. All rights reserved.

98 © 2013 Broadcom Corporation. All rights reserved.
CLOUD SPENDING POWERS DATA CENTER GROWTH
Source: Goldman Sachs 2013
$25
$20
$15
$10
$5
$0
2010 2011 2012 2013E 2014E
Web 2.0 Capital Spending (In Billions)

99 © 2013 Broadcom Corporation. All rights reserved.
RAPID TECHNOLOGY TRANSITIONS DRIVE GROWTH
24x10 GbE
64x10 GbE 16x40 GbE
104x10 GbE 32x40 GbE
Enabling Higher SDN Capabilities
More Network Virtualization Scale
More OpenFlow Scale
Highly Configurable
2008 2009 2010 2011 2012 2013
BCM56820
Trident+
Trident II
Next Gen
Driving 10/40/100G
Adoption

100 © 2013 Broadcom Corporation. All rights reserved.
Source: Infonetics 2013; Broadcom internal estimates
Carrier Ethernet
IP Routers
3G and 4G Wireless
Packet Optical
SONET SDH
Wireline Voice
$271 $299
2009 2013E
(In Billions)
Service Provider Capital Spending
2009 2013E
Infrastructure and Networking
Service Provider Revenue
Fastest Growing Elements of Service Provider CAPEX
GAINING GROUND IN SERVICE PROVIDER MARKET

101 © 2013 Broadcom Corporation. All rights reserved.
Wireless
POS Terminals
System Optimization
Best-in-Class Performance
~$3B SAM in 2016
Scalable CPUs
Multi-core Processors
Retail Router SoC
Networking/ Control Plane
Security
MULTI-CORE PROCESSORS ADDRESS GROWING SAM
Storage/ NAS
Source: Infonetics, Q4 2012; IDC, Q4 2012; ABI Research, 2012; Dell’Oro Jan. 2013; Nilson Q4 2012; Broadcom internal estimates

102 © 2013 Broadcom Corporation. All rights reserved.
~$1B SAM for Wireless
Infrastructure Leader in Backhaul
Custom Solutions for Base Stations and Radio Heads
Ramping Processors
in LTE Base Stations
EXPANDING FOOTPRINT IN WIRELESS INFRASTRUCTURE
Source: Mobile Experts, Nov. 2012; Dell’Oro, Jan. 2013

103 © 2013 Broadcom Corporation. All rights reserved.
BUILDING MOMENTUM IN AUTOMOTIVE
BMW X5 Currently in Production
200+ OPEN Members High Performance 100 Mbps Ethernet Connectivity
On-board Diagnostics
Infotainment
360° Camera System

104 © 2013 Broadcom Corporation. All rights reserved.
POSITIONED FOR CONTINUED SUCCESS
104 104
Data Centers
Service Providers
Embedded Processors
Wireless Infrastructure
Automotive
Multiple Growth Drivers
Technology Leadership
Market Leadership
Strong Financials
Outperforming Peers
Best-in-Class Infrastructure Business

INVESTING FOR GROWTH WHILE MANAGING TIGHTLY
Eric K. Brandt
Executive Vice President and CFO Broadcom Corporation

© 2013 Broadcom Corporation. All rights reserved.
AGENDA
Powerful Economics Funding Investment
Managing Tightly Through Investment Window

107 © 2013 Broadcom Corporation. All rights reserved.
POWERFUL ECONOMICS FUNDING INVESTMENT
107 © 2013 Broadcom Corporation. All rights reserved.
Corporate Financials
LTE Investment
Cellular
Powerful Economics
Core Businesses

108 © 2013 Broadcom Corporation. All rights reserved.
$0
$2,000
$4,000
$6,000
$8,000
$10,000
2008 2013E
$0
$500
$1,000
$1,500
$2,000
$2,500
2008 2013E
SOLID ECONOMICS
25%
30%
35%
40%
45%
50%
55%
2008 YTD Q3 2013
Non-GAAP Product Gross Margin** vs. Mobile and Wireless Mix***
** For a presentation showing GAAP Product Gross Margin and a GAAP to Non-GAAP reconciliation, please see the appendix herein and the Investors section of our website.
*“Total Reportable Segment Revenue” represents the aggregate revenue of our three reportable segments. Certain licensing revenue that we do not allocate to our reportable segments is excluded from reportable segment revenue but is included in our “All Other” category. For a more detailed discussion of our reportable segments and “All Other” category, please see our Quarterly and Annual Reports filed with the SEC, as well as the appendix herein. 2013 data includes updated Q4’13 guidance released on Dec 10, 2013.
*** “Mobile and Wireless Revenue Mix” is the Mobile & Wireless Segment Revenue as a percent of Total Reportable Segment Revenue.
Total Reportable Segment Revenue* (In Millions)
Operating Cash Flow (In Millions)

109 © 2013 Broadcom Corporation. All rights reserved.
Baseband Investment Accelerates
0%
5%
10%
15%
20%
25%
2008 2013E
ECONOMIC STRENGTH FUELS GROWTH INVESTMENT
Total Reportable Segment Operating Margin*
* “Total Reportable Segment Operating Margin” represents the aggregate operating margin of our three reportable segments. “Broadband and Infrastructure Operating Margin” represents the aggregate operating margin of these two reportable segments. “Mobile and Wireless Operating Margin” represents the operating margin of this reportable segment. Certain operating expenses that we do not allocate to our reportable segments are excluded from these metrics but are included in our “All Other” category. For a more detailed discussion of our reportable segments and our “All Other” category, please see our Quarterly and Annual Reports filed with the SEC, as well as the appendix herein. 2013 data includes updated Q4’13 guidance released on Dec. 10, 2013.
0%
5%
10%
15%
20%
25%
30%
2008 2013E
Broadband and Infrastructure Operating Margin*
0%
5%
10%
15%
20%
2008 2013E
Mobile and Wireless Operating Margin*
= +

110 © 2013 Broadcom Corporation. All rights reserved.
2010 2011 2012 2013E
INVESTING FOR GROWTH IN LTE
Mobile and Wireless Operating Margin*
* “Mobile and Wireless Reportable Operating Margin” represents the operating margin of our Mobile & Wireless reportable segment. Certain operating expenses that we do not allocate to our reportable segments are excluded from our reportable segment operating margins but are included in our “All Other” category. For a more detailed discussion of our reportable segments and the “All Other” category, please see our Quarterly and Annual Reports filed with the SEC, as well as the appendix herein. 2013 data includes updated Q4’13 guidance released on Dec. 10, 2013.
Cellular Baseband Operating Margin Impact: ~8-17 Percentage Points on Mobile and Wireless Reportable Segment ~3-8 Percentage Points on Broadcom Total Reportable Segment
Cellular Baseband Investment
0%
5%
10%
15%
20%
2010 2011 2012 2013E

111 © 2013 Broadcom Corporation. All rights reserved.
2005 2006 2007 2008 2009 2010 2011
…Improved Gross Margins …and Strengthened Profitability WLAN Supplier Consolidation…
Description 2006 2011
# of Suppliers* 8 4
Top 3 Share ~50% ~95%
WLAN: A MODEL FOR SUCCESS DRIVING LEVERAGE?
Source: Broadcom internal estimates
2005 2006 2007 2008 2009 2010 2011
Revenue Operating Margin**
** Excludes certain operating expenses that we do not allocate to our reportable segments but that are included in our “All Other” category. For a more detailed discussion of our reportable segments and the “All Other” category, please see our Quarterly and Annual Reports filed with the SEC, as well as the appendix herein.
* Leading-edge suppliers.

112 © 2013 Broadcom Corporation. All rights reserved.
MANAGING TIGHTLY THROUGH INVESTMENT WINDOW
© 2013 Broadcom Corporation. All rights reserved.
Portfolio Management
Operating Expenses
Stock-based Compensation
112
Return of Capital

113 © 2013 Broadcom Corporation. All rights reserved.
OPTIMIZING INVESTMENT
2013 LOB Rev CAGR GP Rank RD Rank OI Turns Value Rank
1 3 9 2 1 4
2 12 1 1 5 1
3 5 3 4 8 3
4 11 2 3 7 2
5 6 8 5 2 6
6 9 5 6 4 5
7 4 7 10 10 8
7 7 10 7 6 9
9 10 6 9 9 7
10 2 4 13 13 13
10 13 11 8 3 10
12 1 13 11 12 12
13 8 12 12 11 11
Reduced
Investment
Portfolio Management Grid

114 © 2013 Broadcom Corporation. All rights reserved.
INVESTMENT GROWTH EXPECTED TO SLOW IN 2014
$0
$100
$200
$300
$400
$500
$600
$700
$800
$900
Q4'12 Q1'13 Q2'13 Q3'13 Q4'13E Q1'14E
*For a presentation showing historical quarterly GAAP R&D and SG&A expenses and a GAAP to Non-GAAP reconciliation, please see appendix herein and the Investors section of our website. The Non-GAAP guidance above is consistent with the presentation in our quarterly earnings releases.
**Does not contemplate acquisitions or other corporate actions.
Quarterly Non-GAAP R&D + SG&A* (In Millions)

115 © 2013 Broadcom Corporation. All rights reserved.
REDUCING STOCK-BASED COMPENSATION
0%
2%
4%
6%
8%
10%
12%
14%
16%
2007 2008 2009 2010 2011 2012 2013E 2007 2008 2009 2010 2011 2012 2013E
SBC Percent of Revenue SBC Per Employee (In Thousands)

116 © 2013 Broadcom Corporation. All rights reserved.
2007 2008 2009 2010 2011 2012 2013E
RETURN OF CAPITAL TO SHAREHOLDERS
Returned Cumulative >100% of US Cash Flow* Over Seven Years
Stock Repurchases and Dividends
US Cash Flow from Operations*
~$5.3 Billion Cumulative Stock Repurchase and Dividends
*”US Cash Flow from Operations” is an estimate of the annual change in US cash balances, after adjusting for acquisition costs, repatriations, proceeds from debt issuances, intra-company transfers, and other items.

117 © 2013 Broadcom Corporation. All rights reserved.
CLOSING THOUGHTS
Powerful Economics in Core Businesses
LTE Success Drives Leverage
Managing Tightly Through Investment Window

118 © 2013 Broadcom Corporation. All rights reserved.
Accelerate Connectivity
Innovation
Material LTE Revenues and New Product Rollouts
Continued Growth in
Emerging Markets
Ramp New Technologies – Ultra HD, HEVC, Small Cell, Vectoring
SIGN POSTS FOR 2014
Hand Home
Drive Innovation in the
Data Center
Accelerate New Market Opportunities
Infrastructure

APPENDIX

120 © 2013 Broadcom Corporation. All rights reserved.
Reportable Segments Total
Broadband
Communications
Mobile &
Wireless
Infrastructure
& Networking
Reportable
Segments
All
Other Consolidated
Nine Months Ended September 30, 2013
Net Revenue $ 1,672 $ 2,979 $ 1,504 $ 6,155 $ 86 $ 6,241
Operating Income (loss) 409 333 454 1,196 (910) 286
Operating Margin 24.5% 11.2% 30.2% 19.4% 4.6%
Year Ended December 31, 2012
Net Revenue $ 2,156 $ 3,809 $ 1,855 $ 7,820 $ 186 $ 8,006
Operating Income (Loss) 504 561 484 1,549 (873) 676
Operating Margin 23.4% 14.7% 26.1% 19.8% 8.4%
Year Ended December 31, 2011
Net Revenue $ 2,039 $ 3,484 $ 1,659 $ 7,182 $ 207 $ 7,389
Operating Income (loss) 391 572 545 1,508 (555) 953
Operating Margin 19.2% 16.4% 32.9% 21.0% 12.9%
Year Ended December 31, 2010
Net Revenue $ 2,134 $ 2,890 $ 1,588 $ 6,612 $ 206 $ 6,818
Operating Income (loss) 446 526 579 1,551 (469) 1,082
Operating Margin 20.9% 18.2% 36.5% 23.5% 15.9%
Year Ended December 31, 2009
Net Revenue $ 1,525 $ 1,720 $ 1,055 $ 4,300 $ 190 $ 4,490
Operating Income (loss) 181 116 289 586 (531) 55
Operating Margin 11.9% 6.7% 27.4% 13.6% 1.2%
Year Ended December 31, 2008
Net Revenue $ 1,723 $ 1,528 $ 1,258 $ 4,509 $ 149 $ 4,658
Operating Income (loss) 384 35 390 809 (637) 172
Operating Margin 22.3% 2.3% 31.0% 17.9% 3.7%
BROADCOM CORPORATION UNAUDITED SEGMENT REPORTING
2008 2009 2010 2011 2012 YTD Q3
2013
Include in the “All Other” Category
Net Revenue $ 149 $ 190 $ 206 $ 207 $ 186 $ 86
Stock-based Compensation $ 509 $ 497 $ 484 $ 513 $ 543 $ 401
Amortization of Purchased Intangible Assets 19 31 59 84 311 172
Amortization of Acquired Inventory Valuation Step-up 2 9 10 24 72 1
Impairment of Goodwill and Long-lived Assets 172 19 19 92 90 511
Settlement Costs (Gains) 16 118 53 (18) 79 (75)
Restructuring Costs (reversals) (1) 8 - 16 7 12
In-process Research and Development 42 - - - - -
Charitable Contribution - 50 - 25 - 25
Change in Contingent Earn-out Liability - -
- (1)
-
-
Non-recurring Legal Fees - 12 - 25 - -
Payroll Tax on Certain Equity Awards 5 4 10 8 10 4
Miscellaneous Corporate Allocation Variances 22 (27) 40 (6) (53) (55)
Total Other Operating Costs and Expenses 786 721 675 762 1,059 996
Total Operating Loss for the "All Other" Category $ (637) $ (531) $ (469) $ (555) $ (873) $ (910)
(In Millions) (In Millions)

121 © 2013 Broadcom Corporation. All rights reserved.
BROADCOM CORPORATION UNAUDITED SCHEDULE OF SELECTED GAAP TO NON-GAAP ADJUSTMENTS
2008 2009 2010 2011 2012 YTD 2013
GAAP Product Gross Margin 50.6% 48.3% 50.3% 49.5% 48.5% 50.3%
Stock-based Compensation and Payroll Taxes 0.6 0.6 0.3 0.3 0.3 0.3
Amortization of Purchased Intangible Assets
and Step-up of Acquired Inventory 0.4 0.5 0.7 1.1 3.5 2.1
Non-GAAP Product Gross Margin 51.6% 49.4% 51.3% 50.9% 52.3% 52.7%
Q4 ‘12 Q1 ‘13 Q2 ‘13 Q3 ‘13 YTD 2013
GAAP Research and Development and
Selling, General and Administrative Expense $ 762 $ 794 $ 793 $ 790 $ 2,377
Stock-based Compensation and Related Payroll Taxes (124) (135) (131) (120) (386)
Non-GAAP Research and Development and
Selling, General and Administrative Expense $ 638 $ 659 $ 662 $ 670 $ 1,991
(In Millions, Except Percentage)
Q1 ‘11 Q2 ‘11 Q3 ‘11 Q4 ‘11 Q1 ‘12 Q2 ’12 Q3 ‘12 Q4 ‘12 Q1 ‘13 Q2 ‘13 Q3 ’13
GAAP Product Gross Margin 49.3% 49.7% 49.6% 49.4% 48.3% 46.9% 49.0% 49.7% 49.6% 49.7% 51.4%
Stock-based Compensation and Payroll Taxes
0.4
0.4
0.2
0.3
0.5
0.3
0.3
0.3
0.4
0.3
0.3
Amortization of Purchased Intangible Assets
and Step-up of Acquired Inventory
1.2
1.0
1.2
1.0
3.3
5.2
3.0
2.4
2.2
2.1
1.9
Non-GAAP Product Gross Margin 50.9% 51.1% 51.0% 50.7% 52.1% 52.4% 52.3% 52.4% 52.2% 52.1% 53.6%

Thank You