Broadcast Yourself: Understanding YouTube...
10
Broadcast Yourself: Understanding YouTube Uploaders Yuan Ding † , Yuan Du † , Yingkai Hu † , Zhengye Liu ‡ , Luqin Wang † , Keith W. Ross † , Anindya Ghose † Computer Science and Engineering, Polytechnic Institute of NYU ‡ AT&T Labs, San Ramon Stern School of Business, New York University {dingyuan1987, duyuanvvv, yingkaihu, zhengyeliu, lukelwang}@gmail.com [email protected], [email protected] ABSTRACT YouTube uploaders are the central agents in the YouTube phenomenon. We conduct extensive measurement and analysis of YouTube up- loaders. We estimate YouTube scale and examine the uploading behavior of YouTube users. We demonstrate the positive reinforce- ment between on-line social behavior and uploading behavior. Fur- thermore, we examine whether YouTube users are truly broadcast- ing themselves, via characterizing and classifying videos as either user generated or user copied. Categories and Subject Descriptors C.4 [[Performance of Systems]: General—measurement techniques; C.2.3 [Computer-Communication Networks]: Network Opera- tions—network monitoring, public networks General Terms Measurement, Performance Keywords YouTube, system scale, social network, content classification 1. INTRODUCTION YouTube is a major Internet phenomenon. Driving YouTube’s success are its uploaders – the millions of users who upload content to the YouTube site. YouTube uses the slogan “Broadcast Yourself” to highlight its unique feature of allowing ordinary Internet users to freely distribute videos. By encouraging users to upload content and broadcast themselves, YouTube has transformed Internet users from video consumers to video producers. Due to its remarkable success, there have been several recent studies about YouTube [13, 4, 6, 10, 12, 1, 2, 3, 7, 19, 17, 14, 16, 18], providing important insights into YouTube videos, viewers, so- cial behavior, video traffic, and recommendation system. However, Permission to make digital or hard copies of all or part of this work for personal or classroom use is granted without fee provided that copies are not made or distributed for profit or commercial advantage and that copies bear this notice and the full citation on the first page. To copy otherwise, to republish, to post on servers or to redistribute to lists, requires prior specific permission and/or a fee. IMC’11, November 2–4, 2011, Berlin, Germany. Copyright 2011 ACM 978-1-4503-1013-0/11/11 ...$10.00. the YouTube uploaders – who are at the core of the YouTube phe- nomenon – have yet to be studied carefully. In this paper, we pro- vide a large-scale, comprehensive measurement study of YouTube uploaders. Such a study is important, as a big-picture understand- ing of YouTube must take into account its uploaders. Our contribu- tions are as follows: • Analysis of YouTube uploaders: All the videos in YouTube are uploaded by users. The most fundamental question is who are the uploaders and what are their characteristics. To this end, we carefully design crawling, sampling and analy- sis methodologies. Estimating the scale of YouTube, we find that there are approximately 47.3 million uploaders, having uploaded 448 million of videos (with an aggregated length of 2,649 years), and having attracted more than 1.5 trillion of views. To our knowledge, this represents the only modern (and systematic) estimate of YouTube scale currently avail- able. We find that the top 20% of the uploaders (in terms of number of uploaded videos) contribute 72.5% of videos, while the top 20% of most popular uploaders attract approx- imately 97% of views. We find that uploaders belonging to the social network are more active than those not belonging, and upload on average more than twice as many videos. We study the uploading behavior of users with different gender, age, and geographic locations. • UGC vs. UCC: YouTube is designed for sharing user gener- ated content. However, many videos in YouTube are sim- ply copied from other places – such as from movies, TV shows, and other professional video websites – rather than being originally generated by ordinary Internet users. We classify videos as UGC and UCC and investigate the proper- ties of UGC and UCC videos from three different groups of representative uploaders. We make the critical observation that most uploaders consistently upload either UGC or UCC videos. 2. YOUTUBE UPLOADERS In the jargon of YouTube, each subscribed user has its own chan- nel. Throughout this paper we use the term user and channel inter- changeably. Each channel has a channel profile that includes the channel name and (optionally) personal information about the user, such as the user’s name, gender, age, interests and homepage (out- side of YouTube). A user is said to be an uploader if it has up- loaded at least one video. Each channel also includes links to all of the user’s uploaded videos, links to users favorite videos, links to the users friends, and links to its subscribers and subscriptions. 361
Transcript of Broadcast Yourself: Understanding YouTube...
Broadcast Yourself: Understanding YouTube Uploaders
Yuan Ding†, Yuan Du†, Yingkai Hu†, Zhengye Liu‡, Luqin Wang†,Keith W. Ross†, Anindya Ghose�
†Computer Science and Engineering, Polytechnic Institute of NYU‡AT&T Labs, San Ramon
�Stern School of Business, New York University
{dingyuan1987, duyuanvvv, yingkaihu, zhengyeliu, lukelwang}@[email protected], [email protected]
ABSTRACTYouTube uploaders are the central agents in the YouTube phenomenon.We conduct extensive measurement and analysis of YouTube up-loaders. We estimate YouTube scale and examine the uploadingbehavior of YouTube users. We demonstrate the positive reinforce-ment between on-line social behavior and uploading behavior. Fur-thermore, we examine whether YouTube users are truly broadcast-ing themselves, via characterizing and classifying videos as eitheruser generated or user copied.
Categories and Subject DescriptorsC.4 [[Performance of Systems]: General—measurement techniques;C.2.3 [Computer-Communication Networks]: Network Opera-tions—network monitoring, public networks
General TermsMeasurement, Performance
KeywordsYouTube, system scale, social network, content classification
1. INTRODUCTIONYouTube is a major Internet phenomenon. Driving YouTube’s
success are its uploaders – the millions of users who upload contentto the YouTube site. YouTube uses the slogan “Broadcast Yourself”to highlight its unique feature of allowing ordinary Internet usersto freely distribute videos. By encouraging users to upload contentand broadcast themselves, YouTube has transformed Internet usersfrom video consumers to video producers.
Due to its remarkable success, there have been several recentstudies about YouTube [13, 4, 6, 10, 12, 1, 2, 3, 7, 19, 17, 14, 16,18], providing important insights into YouTube videos, viewers, so-cial behavior, video traffic, and recommendation system. However,
Permission to make digital or hard copies of all or part of this work forpersonal or classroom use is granted without fee provided that copies arenot made or distributed for profit or commercial advantage and that copiesbear this notice and the full citation on the first page. To copy otherwise, torepublish, to post on servers or to redistribute to lists, requires prior specificpermission and/or a fee.IMC’11, November 2–4, 2011, Berlin, Germany.Copyright 2011 ACM 978-1-4503-1013-0/11/11 ...$10.00.
the YouTube uploaders – who are at the core of the YouTube phe-nomenon – have yet to be studied carefully. In this paper, we pro-vide a large-scale, comprehensive measurement study of YouTubeuploaders. Such a study is important, as a big-picture understand-ing of YouTube must take into account its uploaders. Our contribu-tions are as follows:
• Analysis of YouTube uploaders: All the videos in YouTubeare uploaded by users. The most fundamental question iswho are the uploaders and what are their characteristics. Tothis end, we carefully design crawling, sampling and analy-sis methodologies. Estimating the scale of YouTube, we findthat there are approximately 47.3 million uploaders, havinguploaded 448 million of videos (with an aggregated lengthof 2,649 years), and having attracted more than 1.5 trillionof views. To our knowledge, this represents the only modern(and systematic) estimate of YouTube scale currently avail-able. We find that the top 20% of the uploaders (in termsof number of uploaded videos) contribute 72.5% of videos,while the top 20% of most popular uploaders attract approx-imately 97% of views. We find that uploaders belonging tothe social network are more active than those not belonging,and upload on average more than twice as many videos. Westudy the uploading behavior of users with different gender,age, and geographic locations.
• UGC vs. UCC: YouTube is designed for sharing user gener-ated content. However, many videos in YouTube are sim-ply copied from other places – such as from movies, TVshows, and other professional video websites – rather thanbeing originally generated by ordinary Internet users. Weclassify videos as UGC and UCC and investigate the proper-ties of UGC and UCC videos from three different groups ofrepresentative uploaders. We make the critical observationthat most uploaders consistently upload either UGC or UCCvideos.
2. YOUTUBE UPLOADERSIn the jargon of YouTube, each subscribed user has its own chan-
nel. Throughout this paper we use the term user and channel inter-changeably. Each channel has a channel profile that includes thechannel name and (optionally) personal information about the user,such as the user’s name, gender, age, interests and homepage (out-side of YouTube). A user is said to be an uploader if it has up-loaded at least one video. Each channel also includes links to all ofthe user’s uploaded videos, links to users favorite videos, links tothe users friends, and links to its subscribers and subscriptions.
361
2.1 Methodologies and DatasetsIn this paper we use the related video graph to crawl the upload-
ers. Specifically, for a given uploader, we first obtain the list ofuploaded videos. For each of its uploaded videos, we crawl the re-lated videos and determine all the corresponding uploaders, whichwe refer to as the related uploaders. We then repeat the process.Unlike most other social network measurement studies, where typ-ically a small part of the social graph is crawled, and the resultsare highly dependent on the sampling methodologies, we attemptto crawl the entire related video graph to avoid any assumptions un-derlying the sampling methodologies that may not be held for therelated video graph. After crawling the entire related video graph,we then randomly select a subset of uploaders and conduct deeperinvestigation.
Using a depth-first-search (DFS) of the related uploader graph,we crawled approximately 44.8 million unique uploader IDs overa 90-day period (from 9/22/2010 to 12/22/2010). In order to crawlsuch a large number IDs in a 90-day period, we did not downloadthe channel page for each ID; instead we simply collected the IDfor each uploader. In the last weeks, our crawler, based on re-lated videos, continued to see a large number of uploaders everyhour; but, the number of new IDs per hour dropped off dramat-ically. To verify that the 44.8 million uploader IDs nearly fullycover the YouTube uploaders, we conducted another independentcrawl via the YouTube friend social network. The related videonetwork and the social network are two separate networks. The so-cial network is created by the YouTube users, and the related videonetwork is created by YouTube. Using DFS of the friend socialnetwork, we crawled 100,000 YouTube social uploaders. We foundthat 94,737 of the social uploaders (94.7%) were found in our setof 44.8 million uploaders. Given that crawling rate dramaticallydropped in the last weeks of our crawl, and that the resulting setcontained 94.7% of the uploaders from an independent crawl, webelieve that the crawl is representative and nearly complete over allYouTube uploaders. From the 44.8 million IDs, we randomly se-lected 100,000 uploaders and then fully crawled all their channelinformation. We call this dataset UploadSam.
2.2 Scale of YouTubeIn this subsection, by measuring and analyzing the YouTube up-
loaders, we estimate the scale of YouTube, including the total num-ber of uploaders, the total number of videos, the aggregate lengthof YouTube videos, the total number of views. YouTube currentlydoes not make this information public. To our knowledge, there hasnot been any systematic attempt to estimate the scale of YouTubein the past several years.
First, we estimate the total number of uploaders in YouTube.Since we claim that most uploaders in YouTube have been crawled,the number of uploaders can be simply estimated as 44.8/0.947=47.3million. We then define a scale factor for 473 by comparing the to-tal number of uploaders and the number of uploaders in UploadSam.We now estimate the total number of videos and aggregate lengthin YouTube. We find that there are 947,960 videos uploaded by theuploaders in UploadSam and the aggregate length of these videosis 5.6 years. Using the same scaling factor of 473, we thereforeestimate that, up to December 2010, the total number of videospublished to be 448 million and the aggregate video length to be2,649 years.
We can also estimate the total number of views and the totalviewing time in YouTube. The total number of views of the videosin UploadSam is approximately 3.1 billion. Because we alsoknow the length of individual videos and their view times for thevideos in UploadSam, we can calculate the total viewing time on
Table 1: Estimated YouTube ScaleNumber of uploaders 47.3 millionNumber of videos 448 millionAggregate video length 2,649 yearsNumber of views 1.5 trillionAggregate view time 9.9 million years
100
101
102
103
104
105
100
101
102
103
104
Rank
Num
ber
of v
ideo
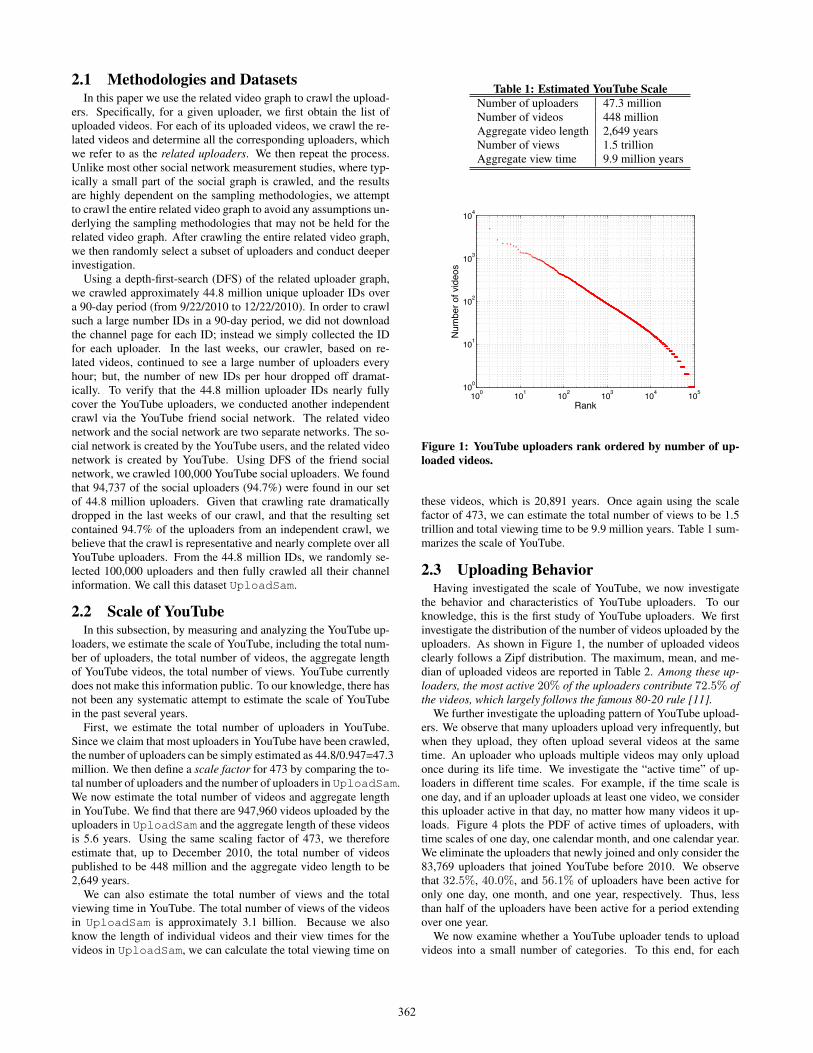
sFigure 1: YouTube uploaders rank ordered by number of up-loaded videos.
these videos, which is 20,891 years. Once again using the scalefactor of 473, we can estimate the total number of views to be 1.5trillion and total viewing time to be 9.9 million years. Table 1 sum-marizes the scale of YouTube.
2.3 Uploading BehaviorHaving investigated the scale of YouTube, we now investigate
the behavior and characteristics of YouTube uploaders. To ourknowledge, this is the first study of YouTube uploaders. We firstinvestigate the distribution of the number of videos uploaded by theuploaders. As shown in Figure 1, the number of uploaded videosclearly follows a Zipf distribution. The maximum, mean, and me-dian of uploaded videos are reported in Table 2. Among these up-loaders, the most active 20% of the uploaders contribute 72.5% ofthe videos, which largely follows the famous 80-20 rule [11].
We further investigate the uploading pattern of YouTube upload-ers. We observe that many uploaders upload very infrequently, butwhen they upload, they often upload several videos at the sametime. An uploader who uploads multiple videos may only uploadonce during its life time. We investigate the “active time” of up-loaders in different time scales. For example, if the time scale isone day, and if an uploader uploads at least one video, we considerthis uploader active in that day, no matter how many videos it up-loads. Figure 4 plots the PDF of active times of uploaders, withtime scales of one day, one calendar month, and one calendar year.We eliminate the uploaders that newly joined and only consider the83,769 uploaders that joined YouTube before 2010. We observethat 32.5%, 40.0%, and 56.1% of uploaders have been active foronly one day, one month, and one year, respectively. Thus, lessthan half of the uploaders have been active for a period extendingover one year.
We now examine whether a YouTube uploader tends to uploadvideos into a small number of categories. To this end, for each
362

100
101
102
103
104
105
100
102
104
106
108
Rank
Num
ber
of u
ploa
der
view
s
Figure 2: YouTube uploaders rank ordered by popularity.
100
101
102
103
104
105
100
101
102
103
104
105
106
Rank
Num
ber
of s
ubsc
riber
s
Figure 3: Distribution of number of subscribers.
uploader, we rank the categories based on the number of videosuploaded to each category, and calculate the fraction of its videosin the top category. We refer to this measure as the top-categoryratio. If all the videos of an uploader belong to a single category,then its top-category ratio is 1. Similarly, we define the top-three-category ratio, which is the fraction of videos belonging to the topthree categories of the uploader. To have a yet more comprehensivemeasure of upload category diversity, we introduce the categoryentropy for uploader i, which is expressed mathematically as:
ei =−∑K
k=1uikui
ln uikui
lnK, (1)
where K is the number of categories, uik is the number of uploadedvideos from user i to category k, and ui =
∑nk=1 uik is the total
number of uploaded videos of user i. If an uploader uploads allvideos to a single category, then its category entropy will be 0;while if an uploader uploads uniformly to all 15 categories, thenits category entropy will be 1. Note that category entropy takesinto account the videos uploaded to all categories for individualuploaders, unlike the ratio of the top category (and the top threecategories) which only takes into account the top categories.
Figure 5 illustrates the category uploading behavior. We considerthree groups of uploaders, namely, the uploaders that upload morethan one, 10, and 100 videos respectively. Figure 5 (a) shows the
0 500
0.5
1
1.5
2
2.5
3 x 10⁴
Days
Num
ber o
f upl
oade
rs
(a)
0 10 200
0.5
1
1.5
2
2.5
3
3.5 x 10⁴
Months
Num
ber o
f upl
oade
rs
(b)
1 2 3 4 5 60
1
2
3
4
5 x 10⁴
Years
Num
ber o
f upl
oade
rs
(c)
Figure 4: Distribution of active times with different time scales.(a) one day; (b) one month; (c) one year.
Table 2: Basic statistics of uploadersMaximum Mean Median
Number of videos 11,323 9.5 3Number of views 61,130,983 31,143 847Number of subscribers 138,583 19.6 1
CDF of the top-category ratio. Focusing on the uploaders who up-load more than 100 videos, we see that about 20% of the uploadersonly upload to a single category, and more than 85% of uploadersupload more than 50% of their videos to their top category. Byconsidering the relatively large number of videos uploaded by thisgroup of uploaders, we see there is a strong tendency to concen-trate videos in a small number of categories. These can be furtherdemonstrated in Figure 5 (b) and (c). As shown in Figure 5 (b),more than 70% of uploaders upload more than 80% of their videosto the top three categories. As shown in Figure 5 (c), more than80% of uploaders have a category entropy less than 0.5. Interest-ingly, the category concentration trend appears to be independentof how active the uploader is. All three groups present similar be-havior no matter how many videos the uploaders upload.
2.4 Uploader Views and SubscribersIn YouTube, some uploaders are more popular than others, with
more users viewing their uploaded videos. YouTube incentivizesthe very popular uploaders by sharing its ad revenue with them.To some extent, the number of views of an uploader influences itsmotivation to upload. We investigate the number of views on indi-vidual uploaders in the dataset UploadSam.
Figure 2 plots the uploader rank ordered by the number of up-loader views in the dataset UploadSam. Surprisingly, the num-ber of views does not follow a Zipf distribution. Our conjecture isthat uploader popularity has been tuned by YouTube intentionallyby YouTube’s recommendation system (that is, the related videos).On one hand, there are fewer unpopular uploaders than there wouldbe in a Zipf distribution. Specifically, more than 47% of upload-ers attract more than 1,000 uploader views, implying that YouTubeuploaders enjoy good visibility, even for those who upload a verysmall number of videos. Thus, YouTube’s recommendation system(that is, related videos) seems to be somewhat biased towards lesspopular uploaders. On the other hand, among all uploaders, themost popular 20% of the uploaders attract 97.0% of views, whichdoes not follow the 80-20 rule. Thus YouTube’s recommendation
363

0 0.5 10
20
40
60
80
100P
erce
ntile
Top category ratio
>1>10>100
(a)
0 0.5 10
20
40
60
80
100
Per
cent
ile
Top−three−category ratio
>1>10>100
(b)
0 0.5 10
20
40
60
80
100
Per
cent
ile
Category entropy
>1>10>100
(c)
Figure 5: Category-concentrated uploading. (a) uploadedvideo ratio of the top category; (b) uploaded video ratio of thetop-three categories; (c) uniformed category entropy.
US BR GB DE FR ES CA MX IT NL0
0.5
1
1.5
2
2.5
3x 10⁴
Top ten countries
Num
ber o
f upl
oade
rs
Figure 6: Distribution of geographic location .
system seems to be also biased to the very popular uploaders. Themaximum, mean, and median of uploaded videos are reported inTable 2. We briefly remark that there are also many very unpopularuploaders in our random sample: 13.5% of the 100,000 uploadershave less than 100 views (aggregated across all of the uploader’svideos).
Figure 3 plots the uploader rank ordered by the number of sub-scribers in dataset UploadSam. We observe that the number ofsubscribers follows a Zipf distribution. Therefore, although a rec-ommendation system may be able to shape uploader views, it isharder to change Internet users preference when it comes to sub-scriptions, which is a more active action than having a “quickview” upon a recommendation. The maximum, mean, and medianof number of subscribers are reported in Table 2.
2.5 Gender, Age and LocationYouTube uploaders may provide gender information in their pro-
files. In UploadSam, 97.9% of uploaders specify their gender in-formation, 91.2% specify their ages, and 90.0% specify both. Wefind that there are more than three times the number of male up-loaders than female uploaders. Consistent with the number of up-loaders, male uploaders contribute more than three times the num-ber of videos and attract more than three times the number of viewsthan female uploaders. We also observe that the uploaders withages from 20 to 30 are the most active uploaders, contributing ap-proximately 40.0% of YouTube videos.
YouTube is a US-based Internet application, but it is widely usedall over the world. We investigate the geographic location of theYouTube uploaders. The YouTube API provides the uploaders’country information. We carefully examine the geographic location
information for the uploaders in dataset UploadSam and eliminate4,137 uploaders whose location information is noisy.
Figure 6 shows the number of uploaders from the top ten coun-tries. As expected, the US is the top country in terms of number ofuploaders, accounting for 31.1% of the total YouTube uploaders.The other top nine countries account for more than 43.7%, whilethe remaining countries account for 25.2%. In addition to the US,YouTube is very popular in Europe and South America. However,it is less popular in Japan and Korea, which is surprising since thesetwo countries have high Internet usage. YouTube is not accessiblefrom Mainland China.
2.6 Social UploadersSome YouTube users join this social network (who we call so-
cial users), while others are not (who we call non-social users). Wenow study how the YouTube social network influences uploader be-havior. We first ask, what fraction of the social users are uploaders,and what fraction of YouTube users on the whole are uploaders?To this end, using breath-first search, we crawl a large numberof YouTube users (10,000,000) in the YouTube friend social net-work. We then randomly select a subset of 100,000 users (namedSocUsr) to investigate whether these social users are uploaders.We find that 43% of the 100,000 social users in SocUsr have up-loaded at least one video. To estimate the fraction of YouTubeusers on the whole who are uploaders, we assume that there aretotally 135 million U.S. YouTube users. Note that this is a veryconservative estimate, since it has been reported that 135 millionunique U.S. viewers viewed YouTube videos in December 2009[8]. Recall that approximately 31.1% of the uploaders are from theU.S. and that there are around 47.3 million uploaders in YouTube.By considering both social and non-social YouTube users, we esti-mate the fraction of YouTube users who are uploaders to be at most47.3135
∗ 0.311 = 0.109. In summary, whereas at most 10.9% of theYouTube users are uploaders, 43% of the social users are upload-ers. Thus, social users are much more inclined (at least four timesmore!) to be uploaders than the average YouTube users.
To compare the behavior of the social uploaders and non-socialuploaders, we re-visit the dataset UploadSam and group the up-loaders into social uploaders and non-social uploaders, based onwhether an uploader belongs to the social network. Figure 7 (a)plots the rank of uploaders ordered by the number of uploadedvideos. Figure 7 (b) plots the rank of uploaders ordered by thenumber of uploader views. These figures clearly show that socialuploaders upload more videos and receive more views – on averagetwice as many – than their non-social counterparts.
There are two possible reasons why social uploaders upload sig-nificantly more than non-social uploaders. On one hand, there isa feedback loop: when a social uploader publishes a new video,it will likely be viewed by many of the uploader’s friends; thispositive feedback incentivizes the social user to upload even more.On the other hand, users who upload a lot are more likely to jointhe social network, since they are already very active in YouTube.Without actually interviewing the uploaders, it is difficult to saywhich of these two reasons weighs more heavily in user behavior.However, it is reasonable to believe that these two reasons togetherexplain why social uploaders are more driven to contribute.
3. USER GENERATED OR USER COPIED?With its slogan “Broadcast Yourself”, YouTube has been de-
signed for sharing user generated content. However, a significantfraction of videos are not originally from YouTube, but are insteadsimply copied from other places, such as movies, TV shows, andother professional video websites. Thus, content on YouTube can
364

100 101 102 103 104100
101
102
103
Rank
Num
ber o
f vid
eos
socialnon−social
5.8
11.8
(a)
100 101 102 103 104100
102
104
106
108
Rank
Num
ber o
f vie
ws
socialnon−social
58,764
102,510
(b)
Figure 7: Social uploaders vs. non-social uploaders.(a)Number of uploaded videos; (b) number of uploader views.
be classified as User Generated Content (UGC) or User CopiedContent (UCC). In this section, we seek to classify each uploaderas a UGC uploader, a UCC uploader, or a combined UGC/UCCuploader. As a consequence of the classification, we will be able toestimate the importance of UCC content in YouTube.
The classification of a video as either UGC or UCC is not alwaysblack and white. We begin this analysis by defining UGC and UCCvideos:
• UCC: A contiguous snippet of a video that was originallydistributed outside of YouTube. For example, a snippet of amovie, of a TV show, or of anything originally broadcastedover TV. This also includes videos created by professionalvideo producers, such as NBC. These professional upload-ers publish these videos on their own websites, and then onYouTube to broaden their visibility.
• UGC: A video that is originally generated for YouTube-likevideo sharing websites. This not only includes videos cap-tured with user’s digital cameras and webcams, but also mash-ups of copied video snippets.
We now manually classify uploaders and videos as either UGCor UCC. We first create a dataset for three groups of uploaders:
• Popular uploaders: This group contains the 100 most popu-lar uploaders, as explicitly presented in the YouTube website.Although it is unclear to us exactly how YouTube decideswhich uploaders to include in this list of 100 uploaders, ingeneral, each of these uploaders attracts a large number ofuploader views.
• Social uploaders: This group contains 100 randomly chosenuploaders from the YouTube social network. As shown in
100
101
102
100
102
104
Rank
Num
ber
of v
ideo
s
UCCUGC
3506
847
(a)
100
101
102
100
101
102
103
Rank
Num
ber
of v
ideo
s
UCCUGC
79
25
(b)
100
101
102
100
101
102
103
Rank
Num
ber
of v
ideo
s
UCCUGC
46
18
(c)
Figure 8: UCC uploaders vs. UGC uploaders in terms of num-ber of uploaded videos. (a) Popular uploaders; (b) Social up-loaders; (c) Random uploaders.
Table 3: Manual classification on uploadersUCC UGC non-dominate
Popular: 63 36 1Social: 34 61 5Random: 20 77 3
Section 2.6, the uploaders in the YouTube social network arein general more active than those not in the social network.
• Random uploaders: This group contains 100 randomly se-lected uploaders from UploadSam. This group representsthe typical behavior of YouTube uploaders.
3.0.1 UGC or UCC Uploader?We first examine whether YouTube uploaders upload mostly UGC
content or mostly UCC content, but not both types of content. Wesay an uploader is a UCC (respectively, UGC) uploader if morethan 90% of its videos are UCC (respectively, UGC).
As shown in Table 3, for each of the three groups, more than 95%of the uploaders are either UGC uploaders or UCC uploaders.This is a critical observation. One immediate application of thisfinding is, for automatically classifying videos as UGC or UCC, inaddition to the features of individual videos (e.g., number of videoviews, video title, video category, etc.), one can indirectly classifythe video by classifying its uploader. Thus, the uploader informa-tion provides useful features for automatic video classification.
Although the fraction of non-dominant uploaders is small for thethree groups, the relative fractions of UCC/UGC uploaders is strik-ingly different among the three groups. Observe that 77% of therandom uploaders are UGC uploaders. Thus most of the users inYouTube are indeed publishing user generated content. However,in the popular group, 63% of uploaders are UCC uploaders, im-plying that the majority of the most popular uploaders are not up-loading user generated content! We mention that many (but notall) of the uploaders in the popular group are professional videoproducers, such as NBC.
3.0.2 Number of uploaded videosWe now investigate the detailed properties of UCC/UGC upload-
ers. For both UGC and UCC uploaders, and for each of the threegroups, Figure 8 plots the uploader rank ordered by number of up-
365
100
101
102
105
106
107
108
109
Rank
Num
ber
of v
iew
s
UCCUGC
8.59e+007
1.96e+008
(a)
100
101
102
102
104
106
108
Rank
Num
ber
of v
iew
s
UCCUGC
8.64e+005
1.42e+006
(b)
100
101
102
102
104
106
Rank
Num
ber
of v
iew
s
UCCUGC
3.43e+005
1.10e+005
(c)
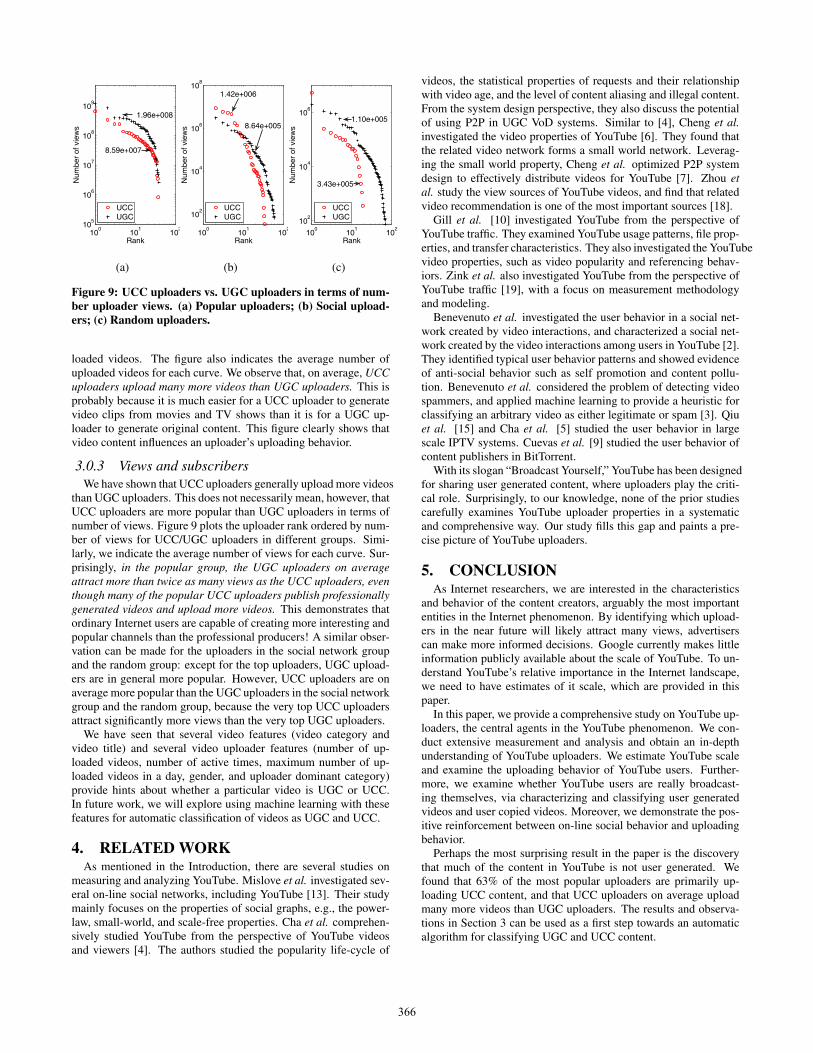
Figure 9: UCC uploaders vs. UGC uploaders in terms of num-ber uploader views. (a) Popular uploaders; (b) Social upload-ers; (c) Random uploaders.
loaded videos. The figure also indicates the average number ofuploaded videos for each curve. We observe that, on average, UCCuploaders upload many more videos than UGC uploaders. This isprobably because it is much easier for a UCC uploader to generatevideo clips from movies and TV shows than it is for a UGC up-loader to generate original content. This figure clearly shows thatvideo content influences an uploader’s uploading behavior.
3.0.3 Views and subscribersWe have shown that UCC uploaders generally upload more videos
than UGC uploaders. This does not necessarily mean, however, thatUCC uploaders are more popular than UGC uploaders in terms ofnumber of views. Figure 9 plots the uploader rank ordered by num-ber of views for UCC/UGC uploaders in different groups. Simi-larly, we indicate the average number of views for each curve. Sur-prisingly, in the popular group, the UGC uploaders on averageattract more than twice as many views as the UCC uploaders, eventhough many of the popular UCC uploaders publish professionallygenerated videos and upload more videos. This demonstrates thatordinary Internet users are capable of creating more interesting andpopular channels than the professional producers! A similar obser-vation can be made for the uploaders in the social network groupand the random group: except for the top uploaders, UGC upload-ers are in general more popular. However, UCC uploaders are onaverage more popular than the UGC uploaders in the social networkgroup and the random group, because the very top UCC uploadersattract significantly more views than the very top UGC uploaders.
We have seen that several video features (video category andvideo title) and several video uploader features (number of up-loaded videos, number of active times, maximum number of up-loaded videos in a day, gender, and uploader dominant category)provide hints about whether a particular video is UGC or UCC.In future work, we will explore using machine learning with thesefeatures for automatic classification of videos as UGC and UCC.
4. RELATED WORKAs mentioned in the Introduction, there are several studies on
measuring and analyzing YouTube. Mislove et al. investigated sev-eral on-line social networks, including YouTube [13]. Their studymainly focuses on the properties of social graphs, e.g., the power-law, small-world, and scale-free properties. Cha et al. comprehen-sively studied YouTube from the perspective of YouTube videosand viewers [4]. The authors studied the popularity life-cycle of
videos, the statistical properties of requests and their relationshipwith video age, and the level of content aliasing and illegal content.From the system design perspective, they also discuss the potentialof using P2P in UGC VoD systems. Similar to [4], Cheng et al.investigated the video properties of YouTube [6]. They found thatthe related video network forms a small world network. Leverag-ing the small world property, Cheng et al. optimized P2P systemdesign to effectively distribute videos for YouTube [7]. Zhou etal. study the view sources of YouTube videos, and find that relatedvideo recommendation is one of the most important sources [18].
Gill et al. [10] investigated YouTube from the perspective ofYouTube traffic. They examined YouTube usage patterns, file prop-erties, and transfer characteristics. They also investigated the YouTubevideo properties, such as video popularity and referencing behav-iors. Zink et al. also investigated YouTube from the perspective ofYouTube traffic [19], with a focus on measurement methodologyand modeling.
Benevenuto et al. investigated the user behavior in a social net-work created by video interactions, and characterized a social net-work created by the video interactions among users in YouTube [2].They identified typical user behavior patterns and showed evidenceof anti-social behavior such as self promotion and content pollu-tion. Benevenuto et al. considered the problem of detecting videospammers, and applied machine learning to provide a heuristic forclassifying an arbitrary video as either legitimate or spam [3]. Qiuet al. [15] and Cha et al. [5] studied the user behavior in largescale IPTV systems. Cuevas et al. [9] studied the user behavior ofcontent publishers in BitTorrent.
With its slogan “Broadcast Yourself,” YouTube has been designedfor sharing user generated content, where uploaders play the criti-cal role. Surprisingly, to our knowledge, none of the prior studiescarefully examines YouTube uploader properties in a systematicand comprehensive way. Our study fills this gap and paints a pre-cise picture of YouTube uploaders.
5. CONCLUSIONAs Internet researchers, we are interested in the characteristics
and behavior of the content creators, arguably the most importantentities in the Internet phenomenon. By identifying which upload-ers in the near future will likely attract many views, advertiserscan make more informed decisions. Google currently makes littleinformation publicly available about the scale of YouTube. To un-derstand YouTube’s relative importance in the Internet landscape,we need to have estimates of it scale, which are provided in thispaper.
In this paper, we provide a comprehensive study on YouTube up-loaders, the central agents in the YouTube phenomenon. We con-duct extensive measurement and analysis and obtain an in-depthunderstanding of YouTube uploaders. We estimate YouTube scaleand examine the uploading behavior of YouTube users. Further-more, we examine whether YouTube users are really broadcast-ing themselves, via characterizing and classifying user generatedvideos and user copied videos. Moreover, we demonstrate the pos-itive reinforcement between on-line social behavior and uploadingbehavior.
Perhaps the most surprising result in the paper is the discoverythat much of the content in YouTube is not user generated. Wefound that 63% of the most popular uploaders are primarily up-loading UCC content, and that UCC uploaders on average uploadmany more videos than UGC uploaders. The results and observa-tions in Section 3 can be used as a first step towards an automaticalgorithm for classifying UGC and UCC content.
366

6. REFERENCES[1] BALUJA, S., SETH, R., SIVAKUMAR, D., JING, Y.,
YAGNIK, J., KUMAR, S., RAVICHANDRAN, D., AND ALY,M. Video suggestion and discovery for youtube: Takingrandom walks through the view graph. In WWW (2008).
[2] BENEVENUTO, F., DUARTE, F., RODRIGUES, T.,ALMEIDA, V., ALMEIDA, J., AND ROSS, K. Understandingvideo interactions in youtube. In ACM Multimedia (2008).
[3] BENEVENUTO, F., RODRIGUES, T., ALMEIDA, V.,ALMEIDA, J., ZHANG, C., AND ROSS, K. W. Identifyingvideo spammers in online social networks. In FourthInternational Workshop on Adversarial InformationRetrieval on the Web (2008).
[4] CHA, M., KWAK, H., RODRIGUEZ, P., AHN, Y., AND
MOON, S. I tube, you tube, everybody tubes: Analyzing theworld’s largest user generated content video system. In IMC(2007).
[5] CHA, M., RODRIGUEZ, P., CROWCROFT, J., MOON, S.,AND AMATRIAIN, X. Watching television over an ipnetwork. In IMC (2008).
[6] CHENG, X., DALE, C., AND LIU, J. Statistics and socialnetworking of youtube videos. In IEEE IWQoS (2008).
[7] CHENG, X., AND LIU, J. Nettube: Exploring socialnetworks for peer-to-peer short video sharing. In INFOCOM(2009).
[8] COMSCORE. http://comscore.com/.
[9] CUEVAS, R., M.KRYCZKA, CUEVAS, A., KAUNE, S.,GUERRERO, C., AND REJAIE, R. Is content publishing inBitTorrent altruistic or profit-driven? In ACM CoNext (2010).
[10] GILL, P., ARLITTZ, M., LI, Z., AND MAHANTIX, A.Youtube traffic characterization: a view from the edge. InIMC (2007).
[11] KOCH, R. The 80/20 Principle: The Secret to Success byAchieving More with Less. Broadway Business, 1999.
[12] LANGE, P. G. Publicly private and privately public: Socialnetworking on youtube. Journal of Computer-MediatedCommunication 13, 1-2 (2007).
[13] MISLOVE, A., MARCON, M., GUMMADI, K. P.,DRUSCHEL, P., AND BHATTACHARJEE, B. Measurementand analysis of online social networks. In IMC (2007).
[14] PAOLILLO, J. C. Structure and network in the youtube core.In HICSS (2008).
[15] QIU, T., GE, Z., LEE, S., WANG, J., XU, J., AND ZHAO,Q. Modeling user activities in a large IPTV system. In IMC(2009).
[16] SAXENA, M., SHARAN, U., AND FAHMY, S. Analyzingvideo services in web 2.0: A global perspective. InNOSSDAV (2008).
[17] SIERSDORFER, S., PEDRO, J. S., CHELARU, S., AND
NEJDL, W. How useful are your comments?- analyzing andpredicting youtube comments and comment ratings. InWWW (2009).
[18] ZHOU, R., KHEMMARAT, S., AND GAO, L. The impact ofyoutube recommendation system on video views. In ACMIMC (2010).
[19] ZINK, M., SUH, K., GU, Y., AND KUROSE, J.Characteristics of youtube network traffic at a campusnetwork - measurements, models, and implications. Journalof Computer-Mediated Communication 53, 4 (2009).
367
Summary Review Documentation for
“Broadcast Yourself: Understanding YouTube Uploaders”
Authors: Y. Ding, Y. Du, Y. Hu, Z. Liu, L. Wang, K. Ross, A. Ghose
Reviewer #1 Strengths: Amazing result on the ability of user generated content to compete directly with professionally produced content. Very nice results on the (estimated) size of the YouTube universe. I particularly liked the methodology for doing that (high level scalable crawl of IDs, detailed profiling of a subset, and then final extrapolation from the combination of the two). Excellent insight on the impact of recommendation on number of views and its relatively less strong impact on number of subscribers. The fact that uploaders tend to be highly concentrated (specializing) in very few categories is also new and gives interesting insights into the behavior of uploaders of YouTube.
Weaknesses: The paper fails to cite a highly related reference: R.Cuevas, M.Kryczka, A. Cuevas, S. Kaune, C. Guerrero and R. Rejaie, “Is Content Publishing in BitTorrent Altruistic or Profit-Driven?”, Proc. ACM CoNext 2010.
Comments to Authors: Not much to add. I greatly enjoyed reading this paper. My sincere compliments to the authors.
The only glitch that I see (more of a wish probably) is that the authors do not put Youtube uploaders in context by comparing them with the uploaders of other systems eg BitTorrent or 1-click hosting sites (rapidshare). For BitTorrent there exists a recently published paper (Is Content Publishing in BitTorrent Altruistic or Profit-Driven?) and I believe that there have also been some studies of 1-click hosting.
In Section 2.1: during the last weeks of the crawler when you saw a drop on new ID’s returned per hour did you also see a drop in the overall number of ID’s that you saw per hour. If yes then this might mean that YouTube was rate limiting your crawler, leaving open the possibility that you have not seen all the uploaders.
Reviewer #3 Strengths: While significant studies have been done on YouTube, the paper finds a new angle. Weaknesses: The paper focuses on the data analysis and falls short on the implication of the analysis results. Most of the findings are expected. Comments to Authors: The paper is well written and has solid analysis of the interesting youtube data. Most of the findings are expected, such as socially active users tend to upload more, males
tend to upload more than female, and significant user generated content being uploaded. The paper studies the content based on the videos uploaded by 100 users selected in three different ways. How representative are the data given it’s still very small percentage of the users? Perhaps increasing the number of users to be studied or having some sensitivity analysis by using a different number of users and see if the same conclusions hold. It’d be great to see some more applications about the findings.
Reviewer #3 Strengths: Reasonably well executed measurement study, rather useful results, well written paper.
Weaknesses: Measurement methodology has some problems and do not seem to capture proper datasets which affects accuracy of presented results.
Comments to Authors: This paper presents a measurement study for characterizing youtube uploaders. The presented analysis is sound and the results are somewhat interesting. However, authors do not in general describe implications of their findings (with a couple of exceptions).
The main concern with this paper is the soundness of its measurement methodology that affects the accuracy of its datasets (samples) and thus the correctness of the presented results. Here are more details on this problem with the methodology:
Authors select a seed user, collect her uploaded video, crawl all the related videos and then identify their uploaders. They repeat this process by selecting a new seed user. The key question is how these seed users are selected? If these seeds are randomly selected, then the authors are likely to have a reasonably complete set of uploaders. Otherwise, the captured uploaders are likely to be a (possibly small) fraction of uploaders. Authors do not describe their strategy for seed selection and it does not seem trivial to select a random user since user IDs do not have numerical forms. It appears that authors selected known users as seed. Therefore, this approach is likely to capture only the uploaders in the largest connected component, and is going to miss uploaders in other components and singleton ones. The conducted test for completeness via comparison with DFS crawl of social network is not reliable because the seeds were selected in the same region of the graph and do not reveal other components of the graph. Youtube does not seem to have a strong social network (like facebook or other social networks). Therefore it is very likely that this approach misses a large number of
368
uploders. This could significantly affect the presented results that are the main contributions of this paper.
It would be useful that authors provide some information about the speed of crawling and key factors that may affect this. The crawling rate seems to be around 21K users/hour, which is modest.
Using BFS approach to crawl YouTube friendship network also reveals only high degree users in SocUser dataset. It is not clear why authors use just 100K samples from SocUsers. Since there is not need for further data collection for SocUSers, it seems useful to consider all of them for related analysis.
It is odd to see that there are no uploaders with a small (<100) number of views in Fig 2, this suggests that data mostly has captured bigger (and more visible) uploaders, which relates to the problem with data collection mentioned earlier.
In section 3, clearly determining whether a video is UCC or UGC is difficult and requires a manual approach. But it is not clear that this can be done reliably even in a manual fashion, For example how do you know whether a mash-up video is created for Youtube or it already used in a tv program. Authors do not elaborate on difficulties related to classification of videos into these two classes including the reasons for their inability to classify a few videos in each dataset.
The provided reasons for various findings in the paper are mostly intuitive guesses without any evidence to back them up.
Reviewer #4 Strengths: This is a new take on a well-mined problem -- looking at uploaders instead of videos etc.
Weaknesses: I find the motivation for this work rather weak -- I dont see a good reason why understanding uploaders is interesting other than a simple curiosity-driven study (and the authors don’t really point out any either). Also, many parts of the paper seem to be rehashing well known or well-expected results.
Comments to Authors: This is a reasonably nice and in-depth study of the uploader behaviors as a self-contained topic. My biggest problem with the paper as is I am not sure why we should care about this uploader behavior beyond a "curiosity" result! I would really like to see more implications or motivation for these results - how would your findings change the behavior dynamics of Youtube, viewing patterns, content caching, etc?
Section 2.1: How do you bootstrap the initial uploader list before you do the crawl?
Maybe I don’t understand what is happening here, but I found the "sampling" towards the end rather puzzling. Arguably, you have down the hard work of collecting the entire graph, why do you need to down sample it; 43 million users should be pretty easy to analyze using a beefy machine? Put another way, if you were
going to do this sampling anyway, why go through the trouble of collecting the full user list?
Section 2.2: For the numbers you report in Sec 2.2 - I remember seeing a bunch of nice Youtube stats at this URL earlier: http://www.youtube.com/t/fact_sheet; but Google seems to have removed this content now.
Also, given this "heavy-tail" behavior is the "linear scaling" justified?
Section 2.3: I was also mildly annoyed by your references to the 80-20 rule; that to me is just a "heuristic" observation not a golden rule for every human-driven system. So the references to “X follows this but Y does not” seem to be out of place. All of them are skewed distributions and the data shows that; whether its 80-20 or 90-20 or 70-20 to me seems somewhat secondary.
How do you identify the "Categories" - I am particularly worried that the "concentration" in category you observe is merely an artifact of incorrect categorization or Youtube tagging it automatically into some default category.
Section 2.4: I find your claim that "Youtube’s related video recommendation seems to be biased toward unpopular" pretty darn speculative. I can imagine a whole slew of other causes for this; e.g., most of these uploaders are video spammers, many of the views are from click bots, Youtube also posts a bunch of recent most videos on the home page (maybe many views come from that?)
The italicized conclusion at the end of this section too seems a bit doubtful in this light.
Section 2.5: What is SamRanUpl -- a new/different dataset? Why does age/gender matter?
Section 2.6: Maybe this reflects my ignorance, but what exactly do you mean by "the social network" or "join" here? Is it someone explicitly invoking a friend relation to another user?
Also, this could just be a wording issue, but some of your conclusions at the end of Sections 2.6 and 3.0.2 seem to suggest an implicit "causal" relationship, when there could be hidden variables or the causality could in fact be reverse, e.g., social users are more inclined - it could be that "active" users tend to be social and upload more. That’s the hidden causality!
Section 3: Two high-level comments about this section. First, I dont really understand how you classify UGC vs UCC; the text is vague about this. Second, I am not sure I agree with what you call UCC; NBC uploading trailers or snippets are not "copying" anything - I got the feeling you wanted to distinguish content that the user "authored" herself vs. content that the user "borrowed" from others and reposted? Your definition of copying (which is vague, btw) seems the muddle these two.
369

Section 4: do you apply the techniques for detecting spammers/video spam to filter your dataset. I wonder if the results will change if you do that.
Reviewer #5 Strengths: - Interesting analysis of the uploaders’ profile (to the best of my knowledge, it is the one of the first studies at this level on Youtube uploaders)- The paper reads pretty well. Weaknesses: - The analysis is somewhat superficial, should be more careful before drawing conclusions. Assessing that the number of views/subscribers does not/does follow a Zipf distribution needs some more rigorous justification than a graphical plot. - There may be a bias in the sampling process to construct the dataset, and the paper does not present compelling sanity checks on this point. Comments to Authors: The paper presents an interesting set of observations, but suffers from two main problems in my view:
1. The claims about distributions are made by visual inspection of cdf plots, which is not rigorous (e.g, that Figure 2 shows that the number of views does not follow a Zipf distribution but that Figure 3 shows that the number of subscribers does follow a Zipf distribution). QQ plots, and even better, hypothesis testing, should be conducted to have a more quantitative validation. Given the emphasis given to these observations in the paper, this more rigorous validation is needed.
2. The sampling process may be biased and corrupt the analysis, for example in the way you "randomly (that is, uniformly over the set of all users?) select a subset of uploaders and conduct deeper investigation". In addition DFS adds a bias favoring high degree nodes of the graph (but which fades away if the coverage is large, see Kurant et al’s paper on unbiased sampling, IEEE JSAC, 2011). The paper does not convince the reader that the proper sanity checks have been made in order to be sure that these measurement biases do not invalidate the results.
Response from the Authors We would like to thank the reviewers for their insightful comments. We included the suggested reference but otherwise did not make any significant changes to the paper. As Internet researchers, we are interested in the characteristics and behavior of the content creators, arguably the most important entities in the Internet phenomenon. By identifying which uploaders in the near future will likely attract many views, advertisers can make more informed decisions. As mentioned by one of the reviewers, Google currently makes little information publicly available about the scale of YouTube. To understand YouTube’s relative importance in the Internet landscape, we need to have estimates of it scale, which are provided in this paper. We are confident that we crawled the majority of the Youtube uploaders. In the last weeks, our crawler, based on related videos, continued to see a large number of uploaders every hour; but, as indicated in the paper, the number of previously un-observed uploaders dropped off dramatically in the final weeks. Most importantly, we validated our claim by examining the overlap with YouTube’s social network. The related video network and the social network are two separate networks. The social network is created by the YouTube users, and the related video network is created by YouTube. We acknowledge that there may be some singleton uploaders who are not included. We also did some small studies (not reported in paper) with some low-view uploaders (the authors and their friends) and found that they were all included in our crawl. Also, 13.5% of the 100,000 uploaders have less than 100 views in our data set. Perhaps the most surprising result in the paper is the discovery that much of the content in YouTube is not user generated. We defined UCC content in the submitted paper as: A contiguous snippet of a video that was originally distributed outside of YouTube. We believe this definition is quite clear. We manually examined all of the videos from 300 uploaders (100 from each of the three categories), a very laborious and painstaking process. Of course, we would prefer to use a larger sample size. We found that 63% of the most popular uploaders are primarily uploading UCC content, and that UCC uploaders on average upload many more videos than UGC uploaders. The results and observations in Section 3 can be used as a first step towards an automatic algorithm for classifying UGC and UCC content.
370