Broadband - se-import.com
8
For the very latest specifications visit www.aeroflex.com Other analyzers tell you what happened. The BSA shows you why. Broadband Scout CS1104 Broadband Signal Analyzer The portable Scout CS1104 Broadband Signal Analyzer (BSA) instrument is designed to find and to solve the toughest RF issues. It combines live and off-line signal analysis capabilities to address multiple test applications, including: • Communications • Radar • Satellite • Electronic Warfare (EW) • Electromagnetic Environment (EME) • Drive (mobile collections) The Aeroflex BSA is used to record, process and analyze RF signals. The system consists of: Tunable RF downconverter: Convert RF signals from RF to baseband IF A/D converter: Digitize baseband signal Digital tuner: Focus on signal of interest and reduce unnecessary data Processing: Process raw digitized samples with various algorithms such as advanced triggering, filtering, scaling, statistics Signal storage: Store digitized signal for analysis or archiving Controller: Computer used to control the system, perform analysis, display results and write data from RAM to archival storage (disk, RAID, USB device) The CS1104 BSA supports collecting contiguous record- ings up to a 40 MHz instantaneous bandwidth (IBW). It also supports scanning across wider bandwidths using sequential recordings. As it is capable of simultaneously processing and coherently displaying time, spectral, and modulation domain data, the CS1104 BSA is ideal for R&D, Validation & Verification (V&V), and general RF testing. The rich set of analysis tools and features below are included with the CS1104. • Tunable frequency coverage from 30 MHz to 6 GHz • Live signal monitoring (display and processing) • Contiguous signal recording and archiving into 32 GB RAM (160 sec @ 40 MHz BW) • Scanned sequential mode for monitoring ranges wider than the IBW • Digital tuners from 40 MHz to 41 kHz bandwidth • Interactive spectrum/spectrogram/time plots • Results strip charting • Signal notepad for recording plots and data • Channel Power and Adjacent Channel Power Ratio (ACPR) analysis functions • Modulation domain analysis function with simple modulation classification (AM, FM, CW, pulse, other)
Transcript of Broadband - se-import.com
For the very latest specifications visit www.aeroflex.com
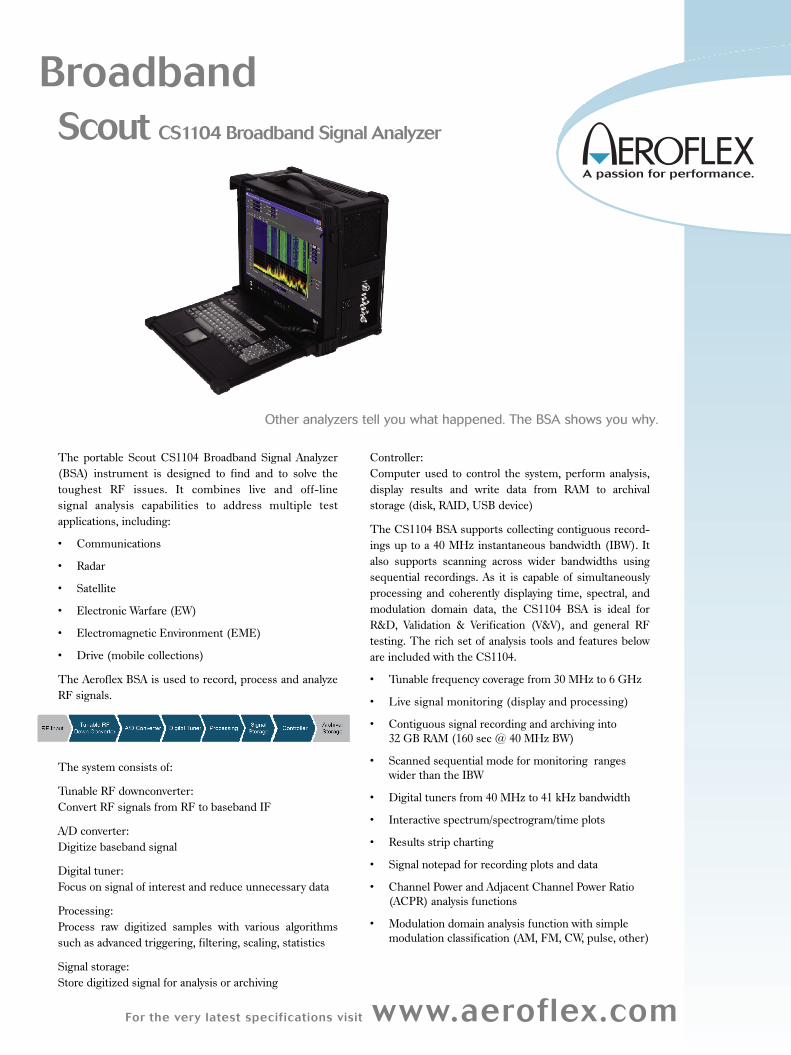
Other analyzers tell you what happened. The BSA shows you why.
BroadbandScout CS1104 Broadband Signal Analyzer
The portable Scout CS1104 Broadband Signal Analyzer
(BSA) instrument is designed to find and to solve the
toughest RF issues. It combines live and off-line
signal analysis capabilities to address multiple test
applications, including:
• Communications
• Radar
• Satellite
• Electronic Warfare (EW)
• Electromagnetic Environment (EME)
• Drive (mobile collections)
The Aeroflex BSA is used to record, process and analyze
RF signals.
The system consists of:
Tunable RF downconverter:
Convert RF signals from RF to baseband IF
A/D converter:
Digitize baseband signal
Digital tuner:
Focus on signal of interest and reduce unnecessary data
Processing:
Process raw digitized samples with various algorithms
such as advanced triggering, filtering, scaling, statistics
Signal storage:
Store digitized signal for analysis or archiving
Controller:
Computer used to control the system, perform analysis,
display results and write data from RAM to archival
storage (disk, RAID, USB device)
The CS1104 BSA supports collecting contiguous record-
ings up to a 40 MHz instantaneous bandwidth (IBW). It
also supports scanning across wider bandwidths using
sequential recordings. As it is capable of simultaneously
processing and coherently displaying time, spectral, and
modulation domain data, the CS1104 BSA is ideal for
R&D, Validation & Verification (V&V), and general RF
testing. The rich set of analysis tools and features below
are included with the CS1104.
• Tunable frequency coverage from 30 MHz to 6 GHz
• Live signal monitoring (display and processing)
• Contiguous signal recording and archiving into
32 GB RAM (160 sec @ 40 MHz BW)
• Scanned sequential mode for monitoring ranges
wider than the IBW
• Digital tuners from 40 MHz to 41 kHz bandwidth
• Interactive spectrum/spectrogram/time plots
• Results strip charting
• Signal notepad for recording plots and data
• Channel Power and Adjacent Channel Power Ratio
(ACPR) analysis functions
• Modulation domain analysis function with simple
modulation classification (AM, FM, CW, pulse, other)

Optional features* available for the CS1104 include:
• GPS
• Additional input or output channel
• Scanned sequential mode for recording and archiving
• Spectrum Allocation Table (SAT)
• AM/FM/PM analysis functions
• ASK/FSK/PSK/QAM analysis functions
• ASK Burst/FSK Burst/PSK Burst analysis functions
• Pulse/Radar analysis function
• Environmental Signal Parameterization identifies and measures
parameters for signals in the environment
• Remote control
• Sequenced recording control (FACS and SW Sequencer)
* All features subject to export restriction
Contact Aeroflex to investigate additional custom capabilities. All
Aeroflex products come with the support of highly-experienced and
solution-oriented technical staff.
Application Matrix
How BSA features and functions apply to typical BSA applications.
• Useful standard software for applications
⊕ Useful software option for applications
BSA Features and Functions
This section briefly presents some of the BSA features and functions.
Standard BSA software allows the operator to record signals to RAM
and then to archive them to internal and external disk drives. These
recorded signals can be post-processed by the BSA software suite.
Applications and Descriptions
BSA Functions and Features
Communications TestThis includes testing radios and radio subsystems. The BSA has had the most impact in engineering design, verification and test (DVT) in the lab and in the field. Both commercial andmilitary radio manufacturers should be targeted along with organizations that specialize in testing radios. The BSA is an excellent fit to emerging standards or proprietary radio waveformswhere there is no test equipment yet.
• • • • • ⊕ ⊕
Radar TestThe BSA has been valuable in a number of radar applications, including DVT, field tests,ECM/ECCM tests, stability measurements and radar cross section measurements. Radar manufacturers, test labs and test ranges have been our best customer for these applications.
• • • • • ⊕
Satellite TestThe BSA has been used in a variety of satellite payload, ground station and operational monitoring. The system has been used to test communications satellites, XM and Sirius Radiosatellites, radar satellites, photo satellites and others.
• • • • • ⊕ ⊕
Electromagnetic Environment (EME) TestBSAs have been used to characterize the EME in many places around the world for a widevariety of missions. We have additional software aimed at this application, please contact usfor details.
• • • • • ⊕ ⊕ ⊕ ⊕ ⊕
EW TestThe BSA has been used for a number of EW tests, including radar, ECM/ECCM and CREW.
• • • • • ⊕ ⊕ ⊕ ⊕
Drive TestBSAs have been used to measure signal characteristics (such as RF power) from a moving vehicle for both civilian and military applications.
• • • • • ⊕ ⊕ ⊕ ⊕
General test and debug • • • • •
Spe
ctru
m/S
pect
rogr
am/T
ime
plot
Str
ipC
hart
Sig
nalN
otep
ad
Cha
nnel
Pow
er&
ACPR
Mod
ulat
ion
Dom
ain
Puls
eAn
alys
is
Dig
italM
odul
atio
ns(P
SK/
QAM
/FS
K/AS
K)
Bur
st/A
gile
Sig
nal
Anal
ysis
(PS
K/Q
AM)
Envi
ronm
ent
Sig
nal
Para
met
eriz
atio
n
Spe
ctru
mAl
loca
tion
Tabl
e(S
AT)

For the very latest specifications visit www.aeroflex.com
Spectrum/Spectrogram/Time Plot
Interactive display of the spectrum, spectrogram (waterfall plot) and
the time domain waveform. This analysis tool provides a
multi-dimensional tool for viewing data that is valuable for every BSA
application.
Strip Chart
Various analysis functions calculate numeric values (carrier frequency,
power, etc.). Any value from any analysis function can be sent to the
strip chart to display the value over time. This display tool provides a
multi-dimensional view into data that is valuable for every BSA
application.
Signal Notepad
Any spectrum trace can be stored and viewed with the signal notepad.
This allows different traces to be overlaid for easy comparison. The
traces can be stored to disk in ASCII format.
Channel Power and ACPR
Channel Power measures the power in a user defined frequency band.
This function is useful in many applications.
The Adjacent Channel Power Ratio (BSA‐ACPR) analysis function
measures the power and ratio of the powers in a main frequency band
and bands on either side of this band. This can also be used to estimate
the Signal-to‐Noise‐Ratio (SNR) of signals for many applications.
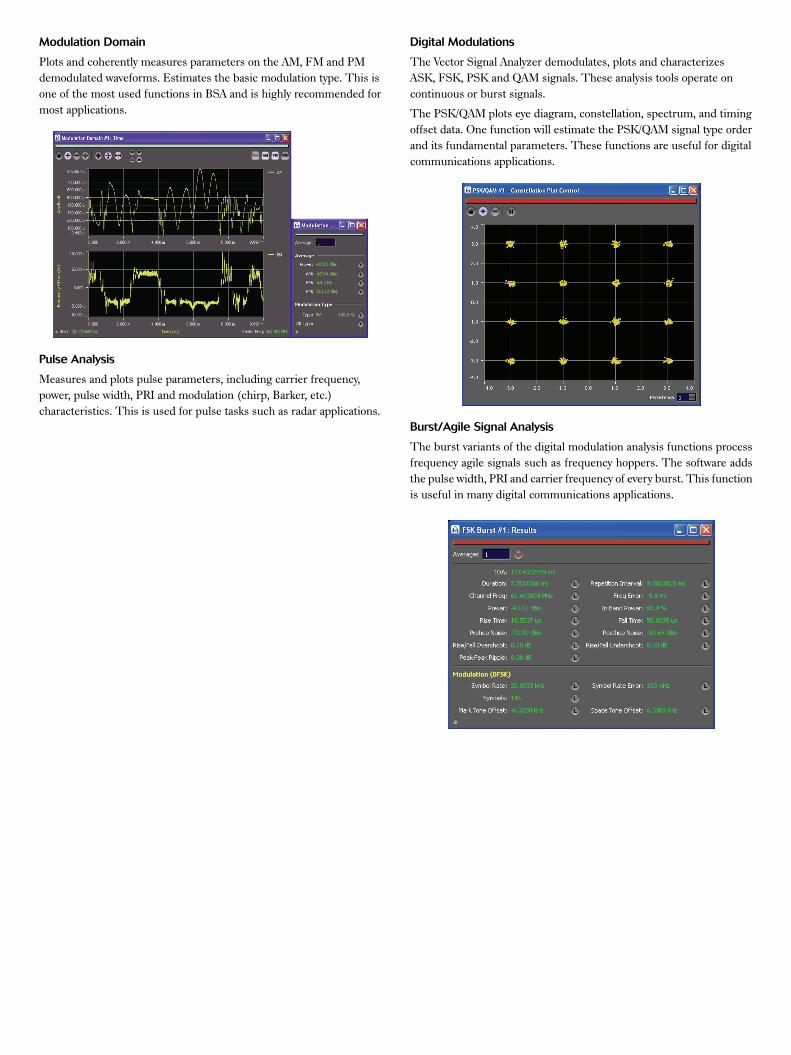
Modulation Domain
Plots and coherently measures parameters on the AM, FM and PM
demodulated waveforms. Estimates the basic modulation type. This is
one of the most used functions in BSA and is highly recommended for
most applications.
Pulse Analysis
Measures and plots pulse parameters, including carrier frequency,
power, pulse width, PRI and modulation (chirp, Barker, etc.)
characteristics. This is used for pulse tasks such as radar applications.
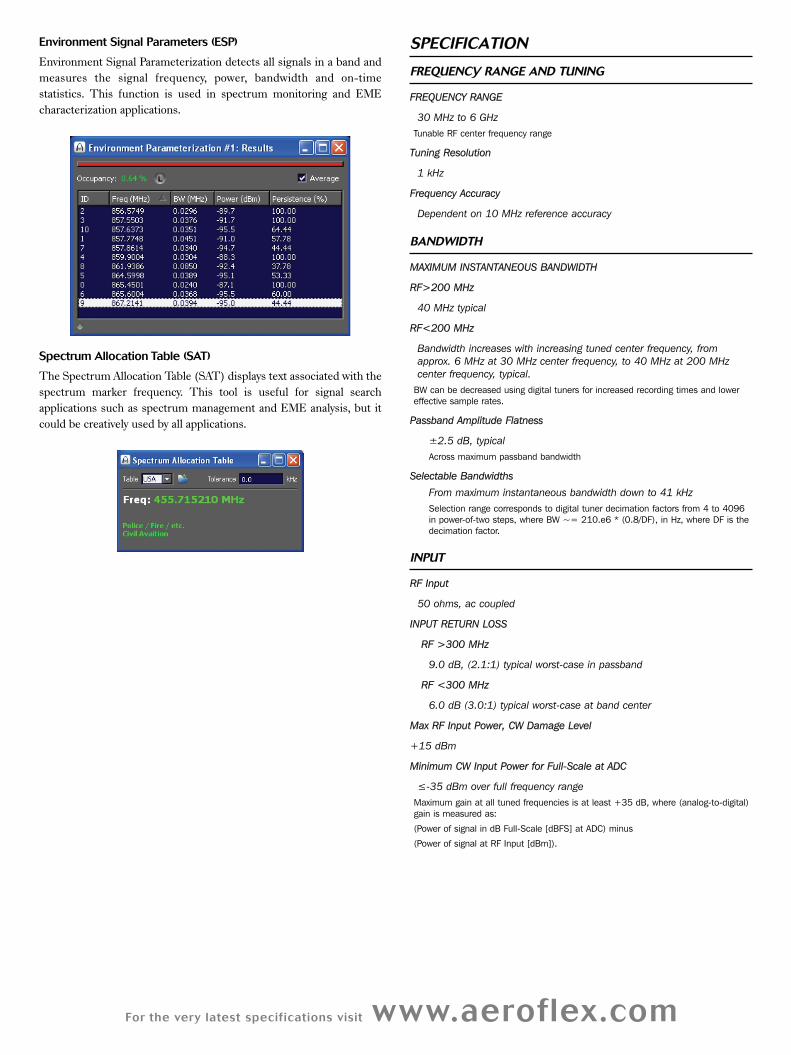
Digital Modulations
The Vector Signal Analyzer demodulates, plots and characterizes
ASK, FSK, PSK and QAM signals. These analysis tools operate on
continuous or burst signals.
The PSK/QAM plots eye diagram, constellation, spectrum, and timing
offset data. One function will estimate the PSK/QAM signal type order
and its fundamental parameters. These functions are useful for digital
communications applications.
Burst/Agile Signal Analysis
The burst variants of the digital modulation analysis functions process
frequency agile signals such as frequency hoppers. The software adds
the pulse width, PRI and carrier frequency of every burst. This function
is useful in many digital communications applications.
For the very latest specifications visit www.aeroflex.com
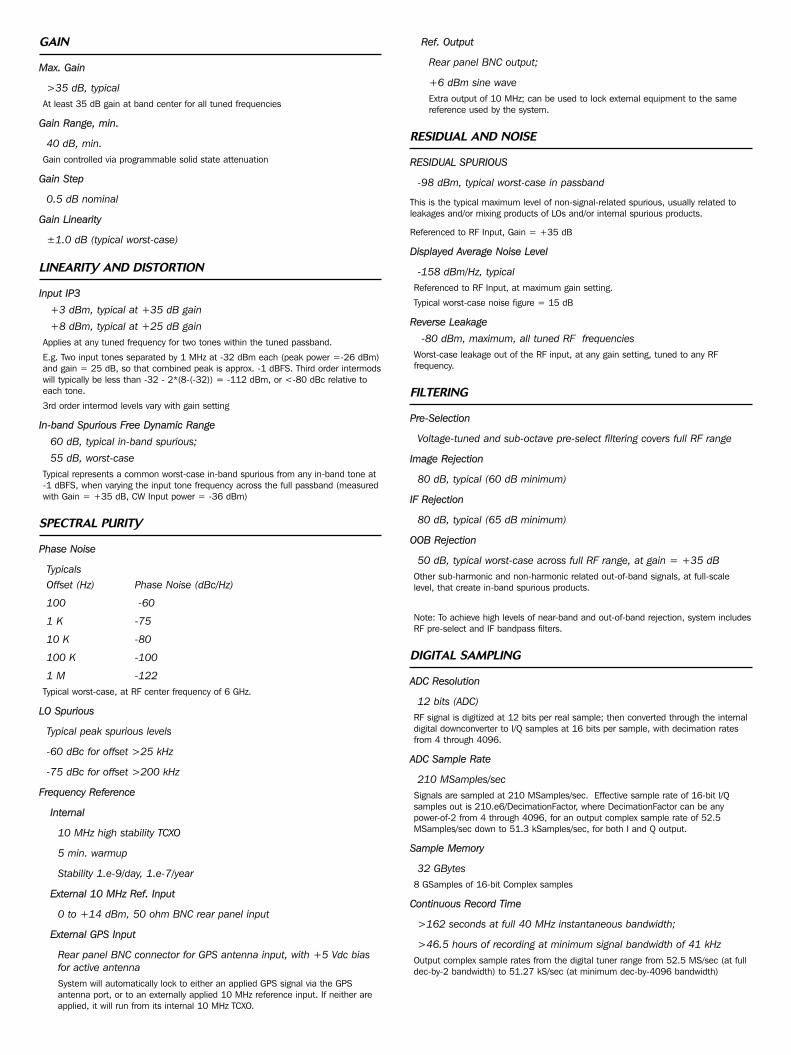
Environment Signal Parameters (ESP)
Environment Signal Parameterization detects all signals in a band and
measures the signal frequency, power, bandwidth and on-time
statistics. This function is used in spectrum monitoring and EME
characterization applications.
Spectrum Allocation Table (SAT)
The Spectrum Allocation Table (SAT) displays text associated with the
spectrum marker frequency. This tool is useful for signal search
applications such as spectrum management and EME analysis, but it
could be creatively used by all applications.
SPECIFICATION
FREQUENCY RANGE AND TUNING
FREQUENCY RANGE
30 MHz to 6 GHz
Tunable RF center frequency range
Tuning Resolution
1 kHz
Frequency Accuracy
Dependent on 10 MHz reference accuracy
BANDWIDTH
MAXIMUM INSTANTANEOUS BANDWIDTH
RF>200 MHz
40 MHz typical
RF<200 MHz
Bandwidth increases with increasing tuned center frequency, from
approx. 6 MHz at 30 MHz center frequency, to 40 MHz at 200 MHz
center frequency, typical.
BW can be decreased using digital tuners for increased recording times and lowereffective sample rates.
Passband Amplitude Flatness
±2.5 dB, typical
Across maximum passband bandwidth
Selectable Bandwidths
From maximum instantaneous bandwidth down to 41 kHz
Selection range corresponds to digital tuner decimation factors from 4 to 4096in power-of-two steps, where BW ~= 210.e6 * (0.8/DF), in Hz, where DF is thedecimation factor.
INPUT
RF Input
50 ohms, ac coupled
INPUT RETURN LOSS
RF >300 MHz
9.0 dB, (2.1:1) typical worst-case in passband
RF <300 MHz
6.0 dB (3.0:1) typical worst-case at band center
Max RF Input Power, CW Damage Level
+15 dBm
Minimum CW Input Power for Full-Scale at ADC
≤-35 dBm over full frequency range
Maximum gain at all tuned frequencies is at least +35 dB, where (analog-to-digital)gain is measured as:
(Power of signal in dB Full-Scale [dBFS] at ADC) minus
(Power of signal at RF Input [dBm]).
GAIN
Max. Gain
>35 dB, typical
At least 35 dB gain at band center for all tuned frequencies
Gain Range, min.
40 dB, min.
Gain controlled via programmable solid state attenuation
Gain Step
0.5 dB nominal
Gain Linearity
±1.0 dB (typical worst-case)
LINEARITY AND DISTORTION
Input IP3
+3 dBm, typical at +35 dB gain
+8 dBm, typical at +25 dB gain
Applies at any tuned frequency for two tones within the tuned passband.
E.g. Two input tones separated by 1 MHz at -32 dBm each (peak power =-26 dBm)and gain = 25 dB, so that combined peak is approx. -1 dBFS. Third order intermodswill typically be less than -32 - 2*(8-(-32)) = -112 dBm, or <-80 dBc relative toeach tone.
3rd order intermod levels vary with gain setting
In-band Spurious Free Dynamic Range
60 dB, typical in-band spurious;
55 dB, worst-case
Typical represents a common worst-case in-band spurious from any in-band tone at-1 dBFS, when varying the input tone frequency across the full passband (measuredwith Gain = +35 dB, CW Input power = -36 dBm)
SPECTRAL PURITY
Phase Noise
Typicals
Offset (Hz) Phase Noise (dBc/Hz)
100 -60
1 K -75
10 K -80
100 K -100
1 M -122
Typical worst-case, at RF center frequency of 6 GHz.
LO Spurious
Typical peak spurious levels
-60 dBc for offset >25 kHz
-75 dBc for offset >200 kHz
Frequency Reference
Internal
10 MHz high stability TCXO
5 min. warmup
Stability 1.e-9/day, 1.e-7/year
External 10 MHz Ref. Input
0 to +14 dBm, 50 ohm BNC rear panel input
External GPS Input
Rear panel BNC connector for GPS antenna input, with +5 Vdc bias
for active antenna
System will automatically lock to either an applied GPS signal via the GPS antenna port, or to an externally applied 10 MHz reference input. If neither areapplied, it will run from its internal 10 MHz TCXO.
Ref. Output
Rear panel BNC output;
+6 dBm sine wave
Extra output of 10 MHz; can be used to lock external equipment to the samereference used by the system.
RESIDUAL AND NOISE
RESIDUAL SPURIOUS
-98 dBm, typical worst-case in passband
This is the typical maximum level of non-signal-related spurious, usually related toleakages and/or mixing products of LOs and/or internal spurious products.
Referenced to RF Input, Gain = +35 dB
Displayed Average Noise Level
-158 dBm/Hz, typical
Referenced to RF Input, at maximum gain setting.
Typical worst-case noise figure = 15 dB
Reverse Leakage
-80 dBm, maximum, all tuned RF frequencies
Worst-case leakage out of the RF input, at any gain setting, tuned to any RF frequency.
FILTERING
Pre-Selection
Voltage-tuned and sub-octave pre-select filtering covers full RF range
Image Rejection
80 dB, typical (60 dB minimum)
IF Rejection
80 dB, typical (65 dB minimum)
OOB Rejection
50 dB, typical worst-case across full RF range, at gain = +35 dB
Other sub-harmonic and non-harmonic related out-of-band signals, at full-scalelevel, that create in-band spurious products.
Note: To achieve high levels of near-band and out-of-band rejection, system includesRF pre-select and IF bandpass filters.
DIGITAL SAMPLING
ADC Resolution
12 bits (ADC)
RF signal is digitized at 12 bits per real sample; then converted through the internaldigital downconverter to I/Q samples at 16 bits per sample, with decimation ratesfrom 4 through 4096.
ADC Sample Rate
210 MSamples/sec
Signals are sampled at 210 MSamples/sec. Effective sample rate of 16-bit I/Q samples out is 210.e6/DecimationFactor, where DecimationFactor can be anypower-of-2 from 4 through 4096, for an output complex sample rate of 52.5MSamples/sec down to 51.3 kSamples/sec, for both I and Q output.
Sample Memory
32 GBytes
8 GSamples of 16-bit Complex samples
Continuous Record Time
>162 seconds at full 40 MHz instantaneous bandwidth;
>46.5 hours of recording at minimum signal bandwidth of 41 kHz
Output complex sample rates from the digital tuner range from 52.5 MS/sec (at fulldec-by-2 bandwidth) to 51.27 kS/sec (at minimum dec-by-4096 bandwidth)
For the very latest specifications visit www.aeroflex.com
TRIGGERING
Sources
Internal (software or user-generated) and external (trigger input on
side panel)
Type
Rising edge, falling edge
Functions
Pre-trigger, snapshot
Uncertainty
±1 sample from digital tuner (e.g ±19 nS at 40 MHz bandwidth)
GPS
Receiver Functions
Time, position and frequency reference
In addition to time and position information, the internal 10 MHz reference can alsolock to an input L1 C/A signal from an external GPS antenna.
Signal I/F
L1 C/A 1575.42 MHz
Acquisition Level
-142 dBm
Tracking Level
-158 dBm
Start Times
Cold: <45 seconds
Warm: 1 second
Hot: 1 second
SPECTRUM ANALYZER FUNCTION
Frequency Span
Defaults to current selected bandwidth (40 MHz to 41 kHz), can be set
from 4 Hz to Nyquist (52.5 MHz)
Resolution Bandwidth
0.4 Hz to 10.0 MHz
Plots
Power vs frequency spectrum, time vs frequency spectrogram, amplitude
vs time, interactive signal notepad
Spectral Plot Controls
Center frequency, span, ref level, res BW, gain, power range, # of
averages, absolute or relative frequency display
Traces
Live data with selectable persistence, max hold, average N, reference
trace
Markers
Current cursor position, delta cursor positions, >20 auxiliary markers,
channel markers, event trigger threshold and mask
Marker Functions
Peak search, next peak left/right, cursor readout, nudge left/right, lock
GUI Control
Mouse-enabled multi-level zoom out, pan, markers, custom color
controls
SCANNING SPECTRUM ANALYZER (SSA) FUNCTION
Frequency Range
Variable from 40 MHz to 6 GHz. Save/recall band limits
Resolution Bandwidth
Auto or manual
Gain Control
AGC and manual
Plots
Power vs frequency spectrum
Traces
Live data
Max hold
Average N
Min hold
Trace save
SYSTEM HARDWARE
COMPONENTS
Single system chassis containing CPUs, 8 GB RAM standard (OS &
signal memory), system drive, system I/O, 30 MHz to 6 GHz RF down-
converter, video monitor, keyboard and trackpad, USB, video, ethernet
connectors, GPS receiver
Monitor
17” included
Peripherals
Fold-down keyboard, trackpad included
System Drives
1 TB removable (standard) or 120 GB removable SSD
Used for both Data and OS
RAM
8 GB system, 32 GB signal memory
RF Downconverter
30 MHz to 6 GHz, 40 MHz bandwidth, low power, fast tuning,
miniature receiver
GPS Receiver
For time, position and frequency reference
CONNECTORS
USB
USB 2.0 (x2) front panel, USB 2.0 (x4) side panel, USB 3.0 (eSATA)
(x2) side panel
Video
VGA/DVI/HDMI
Ethernet
1 GBit (x2)
RF In
Side panel precision type-N
Ext Reference In
Side panel BNC, 50 ohm, -2 to +14 dBm
Locks internal 10 MHz to this external 10 MHz input

Part No. 46891/494, Issue 1, 06/12
External GPS Input
Rear panel BNC connector for GPS antenna input, with +5 Vdc output
bias for active antenna
GPS L1 used to discipline internal 10 MHz reference, and for GPS time, locationdata.
Additional Reference Out
Rear panel BNC, 50 ohm, +6 ±3 dBm
Can be used to lock additional chassis or external equipment to the same reference used by the system.
Trigger In
Rear panel BNC, LVCMOS, >100 nS pulse width
Start Record Sync Out
Rear panel BNC, 50 ohm, LVCMOS
PHYSICAL
Power Consumption
160 VA @ 110 VAC or 220 VAC
1.35 A rms at 110 Vac measured while operating
Dimensions
13.60" H x 17.01" W x 9.57" D (345 x 432 x 243 mm)
Weight
40 lbs (18 kg)
ENVIRONMENTAL
Operating Temperature
-10 to +55°C
Operating Humidity
10% to 90%, non-condensing
Storage Temperature
-40 to +65°C
Storage Humidity
5% to 95%, non-condensing
SOFTWARE
Included Functions
Spectrum
Spectrogram
Time waveform plot
Analysis
Scanning spectrum analyzer
Strip chart plot and analysis
Signal notepad
Channel power
ACPR
Modulation domain plot and analysis
Optional Functions
Spectrum allocation table
Digital modulations (PSK/QAM/ASK/FSK)
Demodulation and analysis
Environment signal parameterization
Burst/agile signal analysis (ASK/FSK/PSK)
High resolution spectrum plot and analysis
Pulse parameterization and analysis
RECOMMENDED CALIBRATION CYCLE
24 months
ORDERING AND CONTACT INFORMATION
www.aeroflex.com/BSA
+1.408.873.1001
CHINA BeijingTel: [+86] (10) 6539 1166Fax: [+86] (10) 6539 1778
CHINA ShanghaiTel: [+86] 21 2028 3588Fax: [+86] 21 2028 3558
CHINA ShenzhenTel: [+86] (755) 3301 9358 Fax: [+86] (755) 3301 9356
FINLANDTel: [+358] (9) 2709 5541Fax: [+358] (9) 804 2441
FRANCETel: [+33] 1 60 79 96 00 Fax: [+33] 1 60 77 69 22
GERMANYTel: [+49] 89 99641 0 Fax: [+49] 89 99641 160
HONG KONGTel: [+852] 2832 7988Fax: [+852] 2834 5364
INDIATel: [+91] 80 [4] 115 4501Fax: [+91] 80 [4] 115 4502
JAPANTel: [+81] (3) 3500 5591 Fax: [+81] (3) 3500 5592
KOREA Tel: [+82] (2) 3424 2719Fax: [+82] (2) 3424 8620
SCANDINAVIATel: [+45] 9614 0045 Fax: [+45] 9614 0047
SINGAPORETel: [+65] 6873 0991 Fax: [+65] 6873 0992
TAIWAN Tel: [+886] 2 2698 8058Fax: [+886] 2 2698 8050
UK StevenageTel: [+44] (0) 1438 742200Fax: [+44] (0) 1438 727601Freephone: 0800 282388
USATel: [+1] (316) 522 4981 Fax: [+1] (316) 522 1360Toll Free: 800 835 2352
w w w . a e r o f l e x . c o m
i n f o - t e s t @ a e r o f l e x . c o m
As we are always seeking to improve our products,the information in this document gives only a generalindication of the product capacity, performance andsuitability, none of which shall form part of any con-tract. We reserve the right to make design changeswithout notice. All trademarks are acknowledged. Parent company Aeroflex, Inc. ©Aeroflex 2011.