Tectonic and magmatic processes along the transform margin of southern Africa

Tectonophysics xxx (2011) xxx–xxx
TECTO-125257; No of Pages 22
Contents lists available at SciVerse ScienceDirect
Tectonophysics
j ourna l homepage: www.e lsev ie r .com/ locate / tecto
Brittle tectonic evolution along the western margin of South Africa: More than500 Myr of continued reactivation
G. Viola a,b,⁎, A. Kounov c, M.A.G. Andreoli d,e, J. Mattila f
a Geological Survey of Norway, NGU, Leiv Eirikssons vei 39, 7491, Trondheim, Norwayb Department of Geology and Mineral Resources Engineering, Norwegian University of Science and Technology, 7491 Trondheim, Norwayc Institute of Geology and Paleontology, Basel University, 4056 Basel, Switzerlandd South African Nuclear Energy Corporation, Necsa, PO Box 582 Pretoria 0001, South Africae School of Geosciences, University of the Witwatersrand, Private Bag 3, 2050 Wits, South Africaf Geological Survey of Finland, GTK, P.O. Box 96, FI-02151, Espoo, Finland
⁎ Corresponding author at: Geological Survey of NoNorway. Tel.: +47 73 90 42 36; fax: +47 73 92 16 20.
E-mail address: [email protected] (G. Viola).
0040-1951/$ – see front matter © 2011 Elsevier B.V. Alldoi:10.1016/j.tecto.2011.10.009
Please cite this article as: Viola, G., et al., Brireactivation, Tectonophysics (2011), doi:10
a b s t r a c t
a r t i c l e i n f oArticle history:Received 23 June 2011Received in revised form 6 October 2011Accepted 8 October 2011Available online xxxx
Keywords:Brittle deformationPaleostress tensor inversionPassive margin evolutionSouth Atlantic
The brittle structural history of western South Africa has been investigated by remote sensing and fieldstudies to build a conceptual scheme for its >500 Ma long evolution. Paleostress tensors were computedfrom a significant fault-slip dataset and a relative geochronological succession of brittle deformation eventswas established. This was aided by separating in time faulting events through the usage of Cretaceous weath-ering horizons, silicified fluvial deposits, paleosols and 77–54 Ma olivine melilitite plugs as time markers. Theoldest features recognized formed during four compressional episodes assigned to the Neoproterozoic PanAfrican evolution. This history is expressed by sub-vertical conjugate fracture sets and fits well the inferencesderived from remote sensing. The greatest compressive direction rotated from NW-SE to NNE-SSW and final-ly to almost E–W. A subsequent ENE-WSW-oriented extensional episode is associated with the local effects ofthe opening of the Atlantic Ocean and was followed by a second, ca. E–W extensional episode, linked to thewell-acknowledged Mid-Cretaceous (115–90 Ma) event of margin uplift. A late Santonian (85–83 Ma) NW-SE compressive paleostress deformed the Late Cretaceous sequences and was in turn followed firstly by arenewed episode of NE-SW extension and later by ca. NNE-SSW Late Maastrichtian (69–65 Ma) shortening.The latter is broadly coeval with the emplacement of the Gamoep magmatic suite. A phase of WNW-ESE Ce-nozoic extension is assigned to the extensional phase recorded in the Okawango delta, interpreted as reflect-ing propagation of the East African Rift System into southern Africa. No stress tensor was computed for thepresent day “Wegener anomaly” stress field, oriented NW-SE. However, in situ stress measurements wereused to perform slip tendency analysis, which indicates that, under the currently existing stress conditions,WNW-ESE- and NNW-SSE-striking faults are critically stressed and are the most likely reactivated, in agree-ment with the present seismicity.
© 2011 Elsevier B.V. All rights reserved.
1. Introduction
Old cratonic crystalline basements usually present compellingevidence of complex brittle deformation histories. Unfortunately,their typically long geological evolution and the repeated structuralreactivation of inherited structures can obliterate fully or partiallymuch of the information that is necessary to unravel these histories.
Munier and Talbot (1993), for example, showed that the Precam-brian basement of southeast Sweden is fully saturated of fracturesand they derived a statement of general validity wherein the ratiobetween fragmentation (i.e. generation of new fractures) to jostling(i.e. reactivation of old fractures) in old terranes decreases with
rway, NGU, 7491 Trondheim,
rights reserved.
ttle tectonic evolution along t.1016/j.tecto.2011.10.009
time in response to the partial (if not total) accommodation ofevery new deformational episode by preexisting structures. Despitethe structural complexities resulting from this, Viola et al. (2009)and Saintot et al. (2011) showed that it is actually possible to unravelthe extremely long and complex brittle history of the FennoscandianShield by an integrated structural approach consisting of a detailedgeometric and kinematic study of striated fault planes and brittlefault rocks analysis. They proposed a paleostress vs. time chart fortwo different areas in southwest Sweden that covers more than 1.5and 1.7 Ga of brittle structural history, respectively.
Inspired by a similar approach, and aiming at the same time at a bet-ter understanding of strain localization and structural reactivation inold metamorphic terranes, we present here the results of a study thatfocuses on the brittle deformational history of part of Namaqualand,western South Africa (Fig. 1). At Vaalputs, in the heart of Namaqualand(Figs. 1 and 2), the South African Nuclear Energy Corporation (Necsa)
he western margin of South Africa: More than 500 Myr of continued

22°S
34°S
26°S
30°S
14°E 34°E18°E 22°E 26°E 30°E
Karoo Basin
Late Paleozoic- Early Mesozoic
Late Proterozoic
Early-Middle Proterozoic
Early Proterozoic
Archean
Kalahari Basin
Cape Town
Kimberly
Johannesburg
SOUTH AFRICA
NAMIBIA
BOTSWANA
MOZAMBIQUE
Namaqua-Natal Mobile Belt
Gariep Belt
Kaapvaal Craton
ZimbabweCraton
Limpopo Belt
Khe
is B
elt
Okwa Terrane
Rehoboth Craton
Moz
ambi
que
Mob
ile B
elt
Saldania Belt
Springbok
Windhoek
Maputo
Cape Fold Belt
ZIMBABWE
Vaalputs
Fig. 2
Damara Mobile Belt
Fig. 1. Main constitutive tectonic elements of southern Africa. The study area is framed by a rectangle and zoomed into in Fig. 2.
2 G. Viola et al. / Tectonophysics xxx (2011) xxx–xxx
operates a site licensed for the disposal of low- and intermediate-levelradioactive waste in ca. 7 m deep trenches (e.g. Brandt et al., 2005).Although the geology of the region has been the subject of numerousin depth studies (see Cornell et al., 2006 for a recent review), thestructural framework of the area and its brittle component in particularremain poorly explored andunderstood. In this studywepropose a newconceptual structural scheme for Namaqualand's long brittle structuralevolution, based primarily on the analysis of selected brittle structures.Key components of this analysis included both remote sensing andfieldwork to gather sufficient fault-slip data to generate a statisticallyrobust reconstruction of the paleostress evolution of the region. Indirecttime constraints were obtained through the analysis and comparison ofthe deformation episodes that affected lithologies of known age and bythe unraveling of crosscutting relationships among different sets ofstructures. This approach also made it possible to add constraints tothe brittle evolution of the region during the geologically fundamentalprocess of the opening and the evolution of the South Atlantic Ocean.Finally, we have also computed fault-slip tendency analysis to betterunderstand the behavior and the role of inherited brittle structureswithin the present-day stress field, and thus the control they mayexert on the current seismicity of western southern Africa.
2. Regional geologic setting
2.1. Geological background
The western coast of South Africa is characterized by the occurrenceof diverse lithologies, from Proterozoic metamorphic rocks to Neopro-terozoic and Mesozoic sedimentary and igneous sequences (Fig. 1).The Mesoproterozoic Namaqualand Metamorphic Province (NMP),part of the Namaqua-Natal Mobile Belt (Fig. 1), comprises intensely de-formed supracrustal sequences intruded by numerous pre-, syn- andpost-tectonic granitoids (Fig. 2; e.g. Johnson et al., 2006). Exhumationof the NMP rocks during the Early Neoproterozoic (between 1000 and800 Ma) was followed by deposition of the Gariep Supergroup in apull-apart basin (Gresse, 1995). The sediments of the Neoproterozoic–
Please cite this article as: Viola, G., et al., Brittle tectonic evolution along treactivation, Tectonophysics (2011), doi:10.1016/j.tecto.2011.10.009
Cambrian Vanrhynsdorp Group unconformably overlie the GariepSupergroup (Johnson et al., 2006; Fig. 2). The Vanrhynsdorp and GariepGroup rocks were deformed and metamorphosed during the Pan-African orogeny between 650 and ca. 500 Ma at relatively lowtemperatures. Based on 40Ar-39Ar cooling ages (Frimmel and Frank,1998; Gresse et al., 1988; Reid et al., 1991), it can be argued that mostof the region studied here entered the brittle realm by ca. 500 Ma.However, lateral/local differences in the cooling pattern might haveoccurred depending on the distance from the Pan African orogenicfront and the presence of discrete, fluid-permeable shear zones (e.g.Frimmel and Frank, 1998).
The Meso- and Neoproterozoic rocks are unconformably overlainby the Ordovician–Devonian thick siliciclastic sequences of the CapeSupergroup (Fig. 2; Johnson et al., 2006). From the late Carboniferousto the Early Jurassic, the Karoo Supergroup, which consists of severalkilometers of clastic sediments, was deposited in the Karoo Basin(Fig. 1). This is considered as a foreland basin, possibly formedin response to orogenic loading of the Cape Fold Belt to the south(Johnson et al., 2006). The Cape Fold Belt, a component of theGondwanides chain, formed during mostly Triassic crustal shorteningrelated to the subduction and accretion of the paleo-Pacific plate be-neath Gondwana (de Wit and Ransome, 1992). The break-up ofGondwana (ca. 170–150 Ma; Hawkesworth et al., 1999) started withthe separation of west Gondwana (Africa and South America) fromeast Gondwana (Australia, Antarctica, India and New Zealand), follow-ing the extrusion of the voluminous and extensive continental floodbasalts of the Drakensberg Group (184–174 Ma; Jourdan et al., 2007)and, close to the study area, the emplacement of numerous doleritesills (Karoo magmatic event). The subsequent break-up of westGondwana between 144 and 125 Ma started with rifting accompanied,along the margin, by the intrusion of syenite and granite plutons,as well as dolerite dykes (e.g. Eales et al., 1984; Reid and Rex, 1994;Trumbull et al., 2007). In the southern Atlantic, the rift–drift transitionwas marked by the northward propagation of the spreading centerover a period of around 40 Myr, with sea-floor spreading beginningat about 134 Ma (Eagles, 2007; Rabinovich and LaBrecque, 1979).
he western margin of South Africa: More than 500 Myr of continued

Orange river
Garies
Kliprand
Springbok
Port Nolloth
Groenriviermond
Vaalputs
Kamieskroon
29 °S
17 °E
31 °S
17 °E
SouthAfrica
Nam
ibia Botswana
Atlantic O
cean
50 km2424 2323
19-2219-22Richtersveld areaRichtersveld area
2525
16-1716-17
1515
1414
NorthNorth
PofadderPofadder
5151
55555656
5757
Kamieskroon Mt.
4949
26-31
KookoppeKookoppe
48483636Volcanic plugVolcanic plug
5353 DwykaDwyka
BorrowpitBorrowpit
Garing KoppieBoesman caveGaring KoppieBoesman caveGaring plugGaring plugGaring plug32-5032-50
StofklooffaultStofklooffault
Bushmanland PlateauBushmanland PlateauBushmanland Plateau
26-31
Kamieskroon Mt.
Nam
aqualand Metam
orphic Province
Nam
aqualandM
etamorphic
Province
Nam
aqualand Metam
orphic Province
Bitterfontein
19 °E
locations of theinvestigated sites and their
numbers from Figures 7 and 8
5353 DwykaDwyka
Namaqua MetamorphicProvince
Pr
thrusts
normal andstrike slip faults
Gannakouriep dykes****
Gamoep* and Bitterfontein**alkaline plug swarms
DoleritesJ
QuaternaryQ
Karoo Supergroup(Dwyka Group andPrince Albert Fm)
C-J
Cape SupergroupO-C
Gariep, Nama andVanrhynsdorp Group
NPr
Garies and Knersvlakte dyke swarms***
Fig. 2. Geological map of the Namaqualand area draped on the local digital elevation model. The outline of the farm Vaalputs is shown. Observation localities are indicated by anumerical code or a label that refers to Fig. 9. Asterisks refer to the available ages of volcanic alkaline plugs and doleritic dykes. *: plug age between ~77 and ~54 Ma (Phillips etal., 2000); **: plug age between 56 and 38 Ma (Phillips et al., 2000); ***: dyke age of 134±3 Ma (Reid and Rex, 1994); ****: dyke age of 717±11 Ma (Reid et al., 1991).
3G. Viola et al. / Tectonophysics xxx (2011) xxx–xxx
Concomitant with the early drift phase, numerous mafic alkaline intru-sions, including kimberlites and related rocks, intruded across southernAfrica. Two distinct intrusion peaks have been reported at 145–115 and95–80 Ma, corresponding to kimberlite Group II and I, respectively (e.g.Basson and Viola, 2004; Smith et al., 1985). Two further clusters ofkimberlitic plugs were later emplaced in our study area, the older(~77–~54 Ma) near Vaalputs (Gamoep cluster) and the younger(56–38 Ma) ca. 50 km to the SSW, near Garies (Bitterfontein cluster;Fig. 2; Phillips et al., 2000).
In the study area only small patches of Cretaceous sediments areobserved (Dasdap Formation, see below), whereas a wide range of
Please cite this article as: Viola, G., et al., Brittle tectonic evolution along treactivation, Tectonophysics (2011), doi:10.1016/j.tecto.2011.10.009
Cenozoic sedimentary deposits cover the low coastal plain (Fig. 2).Raised marine terraces, often rich in placer diamonds and occurringat various elevations along the coast, have been linked to Miocene,Pliocene and Quaternary transgressions (Pether et al., 2000).
2.2. Geomorphic evolution
In the Namaqualand area, the coastal plain is separated by a broadand deeply incised highland region (the Namaqualand Escarpment)from the predominantly featureless, rolling plain that extends inlandat an altitude of ~1000 m a.s.l. (Fig. 2). The latter was named the
he western margin of South Africa: More than 500 Myr of continued

4 G. Viola et al. / Tectonophysics xxx (2011) xxx–xxx
Bushmanland Plateau by Mabbutt (1955), and later attributed to theLate Cretaceous–Early Cenozoic “African” planation surface (e.g.King and King, 1959; McCarthy et al., 1985; Partridge and Maud,1987). Semiarid, and home to a sparse population, the BushmanlandPlateau conforms to the requirements for the safe disposal at Vaalputsof low- and intermediate-level radioactive waste (e.g. Brynard, 1988;Brynard et al., 1996; Levin, 1988). The plateau represents the west-ernmost sector of the elevated margin of African subcontinent. It cur-rently attracts considerable scientific interest because it is part ofthe broad region of elevated topography that overlies the low-velocity zone mapped at the lower mantle-core boundary, calledthe African Superswell (Lithgow-Bertelloni and Silver, 1998;Nyblade and Robinson, 1994).
The Namaqualand Escarpment is dominated by a rugged andmountainous landscape of granitic rocks rising in places to morethan 700 m above the plateau. In this area, sandy pediments withmore gentle slopes merge into valley floors that are deeply incisedand largely controlled by geological structure, following faults andother lineaments (Fig. 2). The origin of this deeply-incised geomorphicfeature is contentious, and may represent the relic of the Late Jurassicelevated shoulders that framed the proto-Atlantic rift (Partridge andMaud, 1987). Alternatively, the highlands have been interpreted asremnants of a post-rift, easterly-migrating bulge arising from theisostatic adjustment of the continental margin to the retreat ofthe escarpment (Brandt et al., 2005; Gilchrist et al., 1994; Kooi andBeaumont, 1994). Recently, low-temperature thermochronologicalstudies have indicated a component of tectonically induced late Creta-ceous uplift in the area of the Namaqualand Escarpment (Brown, 1992;Kounov et al., 2009).
3. Stratigraphy of the study area
Belowwe describe inmore detail the tectonostratigraphic units thatcrop out in the study area and which were pivotal to the establishmentof the time sequence of brittle deformational events proposed in ourmodel. The section of Fig. 3 illustrates a schematic view of the mostsignificant stratigraphic relationships observed.
3.1. Namaqua Metamorphic Province
The investigated Namaqua Metamorphic Province is part of a gran-ulite, granite and charnockite belt exceptionally enriched in U and Th(Andreoli et al., 2006). These rocks experienced high temperature, in-termediate pressure granulite-facies metamorphism (T: 800–860 °Cand P: ~5–6 kbar) during the Grenvillian orogeny ca. 1030 Ma ago(Waters, 1989). To the west, along the Atlantic coast, the Namaquagneisses bear lower grade (staurolite zone) mineral assemblagesindicating a tectonic-metamorphic overprint during the ~550–500 MaPan African orogeny (e.g. Frimmel, 2000). The escarpment area to thewest of the Bushmanland Plateau is dissected by a swarm of generallyNNW-striking, brittle–ductile to brittle faults clearly discernible in
Zone of intense weathering
Dwyka Formation
Dasdap Formation
FaNa
Po
Late Cretaceous-Palaeocenealkaline volcanic plugs
Crater sedimentary in-fills
Unweathered Namaqualand gneisses
Fig. 3. Representative section showing the stratigraphic relationships observed within the sscale.
Please cite this article as: Viola, G., et al., Brittle tectonic evolution along treactivation, Tectonophysics (2011), doi:10.1016/j.tecto.2011.10.009
Landsat satellite imagery as deeply incised valleys, which are one ofthe targets of our study (see below).
3.2. Karoo Supergroup sediments
Late Carboniferous to the Early Jurassic Karoo sediments coverpresently almost one third of South Africa (Fig. 1) and in the studyarea they are represented mainly by Late Carboniferous–EarlyPermian tillites of the Dwyka Group (Fig. 2). These are only seldomexposed on the Bushmanland Plateau around the Vaalputs site, butbecome increasingly exposed eastward (Fig. 2). An important featureof all Karoo rocks exposed in the region is their highly induratednature, which in turn allows the preservation of joints and fractures.Sets of NNW-trending reactivated and often conjugate faults dissectboth the Permian Dwyka Group and the overlying Triassic PrinceAlbert Formation over a broad area NE of Vaalputs. No Jurassicdolerites are reported from the Vaalputs area.
3.3. Cretaceous-Palaeocene lithological sequences
Scattered outcrops of lithological sequences from this time inter-val are exposed only along a narrow belt at the transition betweenthe Bushmanland Plateau and the Namaqua escarpment. Their impor-tance cannot be overlooked because, in addition to testifying toevents for which the record has been largely lost over most of SouthAfrica, these rocks are also extremely useful in our study in thatthey provide key time markers. They are typically found on or closeto silicified mesas, and include the alluvial fan sequence of the DasdapFormation (Figs. 3 and 4a; Brandt et al., 2003), scattered outcrops oftropical regoliths, and a swarm of ultramafic alkaline pipes and theircraters often recognizable by the sedimentary or breccia in-fills. TheDasdap Formation is a relic of a high energy, erosional-depositionalcycle laid on the retreating, rifted continental margin under thetropical, humid conditions of the Late Cretaceous (Brandt et al., 2003;Kounov et al., 2009; Partridge andMaud, 1989, and references therein).Likewise, the regoliths comprise a variety of different facies such ashillside scree deposits, nodular ferricretes (palaeosoils), and silcrete-kaolinite profiles typical of tropical, humid conditions (Fig. 4; Brandtet al., 2005; McCarthy et al., 1985; Partridge and Maud, 1989, 2000).
By the end of the Cretaceous to the beginning of the Paleogene, theregion was intruded by a great number of kimberlite/and olivine-melilitite basalt pipes of the so-called Gamoep cluster (Fig. 2;Cornelissen and Verwoerd, 1975). Scarce dating of these volcanicrocks gives ages between 77 and 54 Ma (cf. Moore and Verwoerd,1985; Phillips et al., 2000). Haughton (1931) proposed an age betweenthe Late Cretaceous and the Early Tertiary based on fossil frogs found inthe infill of one of the pipes. Later studies focussing on the palynologyof these infill sediments, proposed the Early Paleocene as the age of theinfill (64–54 Ma). We have analyzed some pipe occurrences of LateCretaceous age in the Vaalputs area that can be assigned withconfidence to the Gamoep suite. The volcanic pipes are found as actual
Faults within fresh Namaqualand gneiss
Faults segments obliterated by deep weatheringults cutting weathered maqualand gneiss
st-Cretaceous faults
tudy area. Faults belonging to different generations are indicated. Section not drawn to
he western margin of South Africa: More than 500 Myr of continued

Fig. 4. Examples of Cretaceous–Paleocene rocks and morphotectonic features from eastern Namaqualand. a): Basal unconformity separating the highly weathered Namaqua base-ment from the basal conglomerate-coarse immature sandstones of the Late Cretaceous Dasdap Formation (Brandt et al., 2003; coordinates: 30° 20.360′, 18° 27.062′). b): View to thenorth of the mesa of Kookoppe (Fig. 2 for its location), formed by the weathered metamorphic basement and sandstones of the Dasdap formation. c) and d): Evidence of tectonismaffecting Late Cretaceous rocks and morphological features: c): Discrete, ca. top-to-the-NW thrust plane (42/138, dip and dip direction) that deforms Dasdap formation sandstones(30° 20.147′, 18° 27.002′). d): Highly weathered metamorphic basement dissected by discrete fractures and a sharp thrust plane. e): Hillock of metamorphic basement showing thedepth extent of the yellow-looking weathering front affecting its top. f): Example of fracture-controlled weathering (conceptually shown also in Fig. 3). Corestones with onion-typeexfoliation patterns are formed within rock volumes bound by discrete fracture planes that act as conduits for the weathering fluids.
5G. Viola et al. / Tectonophysics xxx (2011) xxx–xxx
basaltic plugs, as breccia pipes and as often oval to elongated patches ofarenaceous pipe-fill sediments surrounded by basement (Cornelissenand Verwoerd, 1975; Scholtz, 1985).
4. Structural analysis
4.1. Remote sensing analysis
A basic remote sensing study was used to carry out a preliminarystructural analysis of the area, with a particular focus on the easilyrecognizable fractures that deform the NMP. Observations from re-mote sensing were subsequently ground-truthed during fieldwork(the main component of our study) and the results are presented inthe next section.
Our simple remote sensing analysis is based on the study of a seriesof Landsat images (Fig. 5, RGB 742 spectral band composite, pan-sharpened to 14.25 m spatial resolution) and Google Earth imagery.Lineaments were mapped onscreen using the human eye withoutapplying any minimum length rule. On the Landsat images one singleillumination source is fixed to the NE, which can lead to interpretationbias wherein lineaments at high angle to the azimuth of the illumina-tion source could be overemphasized (e.g. Smith and Wise, 2007).
Please cite this article as: Viola, G., et al., Brittle tectonic evolution along treactivation, Tectonophysics (2011), doi:10.1016/j.tecto.2011.10.009
However, the complete lack of vegetation, the excellent exposure con-ditions and the very high resolution of the Google Earth imagesmade itpossible to double check and improve the Landsat-based interpretationand generate a reliable lineament strike rose diagram.
Numerous laterally extensive and continuous linear features/lineaments, developed as a result of preferential erosion along steepto sub-vertical faults and fractures, can be mapped (Fig. 5; subsequentfield work confirmed this interpretation). Indeed the NMP displaysvery prominent fractures and fracture sets characterized by systematictrends and consistent geometric relationships. The compilation of thestrike orientation of several hundreds of lineaments (Fig. 5) revealsthe relative narrow angular sector populated by the mapped strikedirections and a stark predominance of NNW-SSE trends. TheNamaqualand ductile grain, including lithological boundaries and theregional foliation, trends ca. E–W. There are numerous apparent E–Wlineaments that follow this trend and that were not considered in ouranalysis as they represent lithological contacts or landforms entirelycontrolled by the foliation.
Based on their spatial arrangement, on their persistency and onthe kinematic evidence that could be derived from the unambiguousdisplacement of visual markers, these structural features weregrouped in four different systematic families of conjugate fractures.
he western margin of South Africa: More than 500 Myr of continued

Fig. 5. Landsat image of the study area, focussed on the exhumed NMP. The latter is saturated of faults and fractures, which correspond to prominent sets of lineaments. The strike ofmore than 400 lineaments (red lines) is plotted in the rose diagram. (For interpretation of the references to color in this figure legend, the reader is referred to the web version ofthis article.)
6 G. Viola et al. / Tectonophysics xxx (2011) xxx–xxx
A number of chosen examples are shown in Fig. 6. They are namedhere “a” to “d” and are sorted and characterized below according tothe relative geochronological order that is described in detail in thediscussion section of the paper. The rose diagram of Fig. 5 is moreoverinterpreted in Fig. 6 in terms of the strike angular dispersion of thefaults of the four sets.
Set “a” This group is characterized by sub vertical conjugate fracturesoriented from WNW-ESE to WSW_ENE and NW-SE, with si-nistral and dextral kinematics, respectively. Their intersection
Please cite this article as: Viola, G., et al., Brittle tectonic evolution along treactivation, Tectonophysics (2011), doi:10.1016/j.tecto.2011.10.009
defines an acute angle bisected by a W/WNW-E/ESE-orientedgreatest compressive horizontal stress direction - σ1 (Fig. 6aand b). Fractures and faults are observed with variable length,from a few hundreds of meters to several kilometers.Although rarely seen at the mesoscopic scale in the field, set“a” includes some of the most impressive large lineamentsof the region. One of them crosses the whole of the Namaquahighlands (it is easily visible in Fig. 5), strikes NW-SE and isalmost 55 km long. It is interpreted as an originally sinistralfault belonging to a “giant” fault/fracture conjugate set.
he western margin of South Africa: More than 500 Myr of continued

Fig. 6. Study of the high-resolution Google Earth images allowed the identification of 4 different systematic sets of conjugate faults/fractures (set “a” to set “d”). North up for all images.
7G. Viola et al. / Tectonophysics xxx (2011) xxx–xxx
Set “b” Faults and fractures that can be ascribed to this set are amongthe most common brittle structures of the entire NMP (Fig. 6cand d). They strike ca. NW-SE and N–S and their intersectiondefines an acute angle bisected by a greatest horizontalcompressive stress oriented NNW-SSE. Fig. 6d confirms theunambiguous kinematics of this conjugate set, wherein a con-tinuous, EW-trending dark lithological band is displaced byboth NW-SE dextral and ca. N–S trending sinistral faults ofset “b”.
Set “c” Conjugate sets of subverical strike-slip fractures belonging toset “c” are only slightly misaligned with respect to faults ofgroup “b” through a 20–30° clockwise rotation. Sinistralfractures strike approximately N–S, dextral ca. NE-SW. Thegreatest horizontal compressive stress derived from this setis thus oriented NNE-SSW (Fig. 6e). The geometric relation-ships between structural features of set “b” and “c” requiresignificant reactivation of the ca. N–S-striking faults.
Set “d” Conjugate fracture sets belonging to group “d” are relativelysmall structures and are only rarely observed in the field.They define a W/WSW-E/ENE-oriented greatest compressivehorizontal stress and their orientation, in places, is not farfrom that of faults and fractures assigned to set “a”, thusimplying their possible reactivation (Fig. 6f). It cannot be
Please cite this article as: Viola, G., et al., Brittle tectonic evolution along treactivation, Tectonophysics (2011), doi:10.1016/j.tecto.2011.10.009
excluded, based on this simple analysis, that fractures of set“d” are actually slightly misoriented fractures of set “a”.
4.2. Field study results
Field structural investigations, including fault-slip data collectionand analysis, were carried out on a number of conventional outcrops,polished pavements and trenches with the aim of establishing a ro-bust and field-constrained model for the local brittle structural evolu-tion. Fig. 7 shows examples of typical structures analyzed during ourstudy. These are localized and discrete faults and their associated faultrocks, shear and hybrid fractures, tension gashes and slickensidedfault planes.
Specific attention was paid to direct crosscutting relationshipsamong several generations of faults because this helped add con-straints to the relative time sequence of events. Crosscutting relation-ships observed within the highly weathered silicified and kaolinitizedmesas that cap the Namaqualand metamorphic rocks are, for example,shown in Fig. 8a; steep normal faults accommodating NE-SW extensionconsistently cut across and offset low-angle, top-to-the-NW andSE-dipping thrusts.
The analysis and characterization of fractures affecting lithologiesof known age was used to bracket the age of deformation of specific
he western margin of South Africa: More than 500 Myr of continued

Fig. 7. Examples of brittle structural features investigated during this study. a): Discrete brittle transtensional fault (Loc. 20, Fig. 2; 29° 13.292′, 17° 39.223′). b): Cataclasite formedat the expense of granite-gneiss of the Namaqua metamorphic complex (Loc. 55, Fig. 2; 30° 21.325′, 18° 17.736′). The fault rock is associated with a sinistral brittle fault oriented N–S. c): Sinistral offset of a mafic schlieren within granite gneiss along a brittle deformation zone oriented 83/288 (same locality as b). d): Thin fracture oriented 88/066 causing cen-timetric sinistral offset of a quartz vein (Augrabies waterfalls; 28° 35.596′, 20° 20.424′). e): Unoriented hand specimen of striated fault plane. f): Slightly curved striations along faultplane (Loc. 37, Fig. 2; 30° 07.316′, 18° 27.244).
8 G. Viola et al. / Tectonophysics xxx (2011) xxx–xxx
events. Fig. 8b, for example, shows the orientation of conjugate frac-tures mapped within Dwyka tillites, whereas Fig. 8c of sinistral faultscut by dextral faults and predating the emplacement of a volcanicplug of the Gamoep suite.
The implications of these geometric relationships used to generatethe model and draw the conclusions of our paper are discussed belowin detail.
4.2.1. Inversion of fault-slip data and fault-slip tendency analysis
4.2.1.1. Methodology. More than 300 fault-slip data were collected,processed and interpreted during this study to ground truth thestructural observations derived through remote sensing, to placethem in a consistent kinematic/geometric framework and to derivea robust model of the evolution of the stress field through time.
Collection of a fault-slip datum includes the fault plane orientation,the slip direction as determined by striations, and the sense of slip. Thelatter was established by conventional kinematic analysis of brittlestructural features (e.g. Hancock, 1985; Petit, 1987). Inversion of faultslip data sets in terms of stress tensor relies on the Wallace–Botthypothesis (Bott, 1959; Wallace, 1951) that states that the maximumresolved shear stress on a fault plane is parallel to the observed slipdirection. A newly formed fault plane has an orientation that allowsthe relative magnitudes of shear stress τ and normal stress σ on thisplane to meet with the Mohr-Coulomb yield criterion, τ=c+μσ,where c is the shear strength and μ is the coefficient of friction.
Please cite this article as: Viola, G., et al., Brittle tectonic evolution along treactivation, Tectonophysics (2011), doi:10.1016/j.tecto.2011.10.009
According to these two mechanical laws, stress inversion techniquessearch for the state of stress that best accounts for a given fault-slipdataset by iteratively adjusting the theoretical slip pattern associatedwith a known stress state until it fits the slip pattern observed atthe outcrop (e.g. Angelier, 1979; Angelier et al., 1982; Etchecopar etal., 1981). To this purpose, the orientation of the principal stress axesσ1, σ2 and σ3, with σ1≥σ2≥σ3 (compression positive) and the stressratio R=(σ2-σ3)/(σ1-σ3), which reflects the shape of the stress ellip-soid (oblate for R>0.5; prolate for Rb0.5), are varied systematicallyso as to minimize the sum of all misfit angles with the misfit angle α,which represents the angle between the calculated maximum shearstress and the actual measured slip direction for an individual faultplane.
This approach derives kinematic (or strain) axes for each individualfault plane assuming that, during brittle deformation in upper crustalconditions, axes of strain coincide with axes of stress (e.g. Anderson,1951). In this study, we used the numerical program ‘TENSOR’(Delvaux and Sperner, 2003) to perform the stress inversion. The soft-ware computes the best fitting stress tensor for a given fault slip dataset by an iterative procedure called “rotational optimization”, bywhich the best solution is identified by rotating incrementally the com-puted stress tensor until optimization is attained with respect to thefault slip data set analyzed. A misfit function tends to (1) minimizethe normal stress, (2) maximize the shear stress and (3) reduce themisfit angle α between the resolved shear stress and the real slip foreach striated fault plane and thus controls the optimization procedure.
he western margin of South Africa: More than 500 Myr of continued

Fig. 8. a): Example of structural investigations at an outcrop of weathered metamorphic basement (Loc. 37, Fig. 2; 30° 07.316′, 18° 27.244′). Systematic, mutual crosscutting rela-tionships were documented, allowing the establishment of a relative time sequence of the faulting episodes. Deformation phase labels D7 and D8 refer to the scheme of Fig. 17. b):Conjugate fracture sets mapped within Permian Dwyka tillites (Loc. 53; Fig. 2; 30° 13.884′, 18° 41.730′). c): Selected examples of dextral faults cutting across older sinistral faults. Inthe case of the Volcanic plug, sinistral and dextral faults are both cut by the intrusion. Green great circles plot conjugate fractures. d): Example of detailed outcrop fracture mappingat Garing (Fig. 2; 30° 06.128′, 18° 29.941′). Conjugate sets are plotted by colored great circles. (For interpretation of the references to color in this figure legend, the reader is re-ferred to the web version of this article.)
9G. Viola et al. / Tectonophysics xxx (2011) xxx–xxx
The quality of the final computed stress tensor reflects the number ofdata, their quality and the value of the misfit angle α (acceptablewhenb30°). It is important to stress that no assumption is made onthe attitude of fault planes relative to stress axes. Whether a faultplane is newly created or is instead a reactivated preexisting disconti-nuity has no consequence for the reconstruction of the reducedpaleostress tensor. This is important in old basements because manyfault movements have occurred along older fractures and inheritedplanar anisotropies.
Our methodological workflow relied on a preliminary manualsorting of the total data set. Inversion was then computed on the in-dividual sub-sets, and the quality of the results was checked throughthe misfit criteria mentioned above. Fault slip data incompatible witha given stress tensor (for example because of misfit angle α>30°)
Please cite this article as: Viola, G., et al., Brittle tectonic evolution along treactivation, Tectonophysics (2011), doi:10.1016/j.tecto.2011.10.009
were assigned to another sub-set or moved to the waste. The processwas repeated until a unique and stable stress tensor was derived froma given, homogeneous sub-set.
In addition to the inversion of fault-slip data, in order to establishwhether inherited faults within the NMP are critically stressed in thepresent-day stress field, we have carried out an assessment of faultslip tendency. The tendency of a specific fault to slip in a given stateof stress can be estimated by the slip tendency parameter (TS), de-fined as the ratio between shear (τ) and normal traction (σn) on asurface (Morris et al., 1996):
TS ¼τσn
ð1Þ
he western margin of South Africa: More than 500 Myr of continued

10 G. Viola et al. / Tectonophysics xxx (2011) xxx–xxx
Slip tendency is a useful expression of the frictional reactivationtheory, which states that slip on a pre-existing and cohesionless sur-face takes place when the resolved shear traction exceeds friction.The calculated values can be normalized by the friction coefficientconsidered to represent failure conditions in a given setting. 0.6 isthe value adopted in our analysis (Byerlee, 1978). For criticallystressed fractures, normalized slip tendency values are equal orabove unity whereas they are less than one for non-critically stressedfractures. The normal (σn) and shear (τ) tractions on any plane can becalculated by
σn ¼ σ1l2 þ σ2m
2 þ σ3n2 ð2Þ
and
τ ¼ σ1−σ2ð Þ2l2m2 þ σ2−σ3ð Þ2m2n2 þ σ3−σ1ð Þ2l2n2 ð3Þ
Location 19Datasets: 3
Richters
Garing Koppie
The Boesman cave
VolcaniMarco’s volcano
BushmanNorth
Kookoppe
Pofadder
Location 20Datasets: 5
Location 21Datasets: 4
LocDa
Location 14Datasets: 6
Location 30Datasets: 2
Location 15Datasets: 3
Location 16Datasets: 3
LocDat
Kaolinitised basement
Kaolinitised basement
Location 31Datasets: 5
Location 33Datasets: 21
Location 37Datasets: 36
Location 41Datasets: 14
Location 42Datasets: 1
LD
Location 45Datasets: 1
Location 46Datasets: 11
Location 48Datasets: 16
Fig. 9. Raw fault-slip data for the outcrops inve
Please cite this article as: Viola, G., et al., Brittle tectonic evolution along treactivation, Tectonophysics (2011), doi:10.1016/j.tecto.2011.10.009
where l, m and n are the direction cosines of the plane normal in theprincipal coordinate system.
Slip tendency values can be calculated for all possible orientationsby solving Eqs. (2) and (3) and substituting the results in Eq. (1). Finalresults can be then plotted in stereoplots, providing a quick and ro-bust tool for assessing whether a specific orientation is criticallystressed and has a high slip potential, both under dry and hydrostaticconditions.
4.2.1.2. Stress inversion resultsField data used in this study are presented in Figs. 9 and 10, with
Fig. 9 showing individual outcrop raw data (see Fig. 2 for the localities).The dataset is complex and outcrops studied contain brittle featuresthat are obviously the results of multiple faulting. Some of the sitesinvestigated contain sufficient fault planes to allow the computationof individual, site-specific states of stress, but other sites contain statis-tically insufficient data (Fig. 9).
veld area
Borrow pitc plug
Kaolinitised basement Stofkloof fault
land area Kookoppe
ation 22tasets: 3
Location 23Datasets: 5
Location 24Datasets: 2
ation 17asets: 8
Location 25Datasets: 13
Kaolinitised basement
Location 28Datasets: 12
Location 34Datasets: 4
Location 35Datasets: 11
Location 36Datasets: 4
ocation 38atasets: 2
Location 39Datasets: 1
Location 40Datasets: 20
Location 49Datasets: 3
Location 51Datasets: 3
stigated in our study and located in Fig. 2.
he western margin of South Africa: More than 500 Myr of continued

dextralHigher temperature faults with no kinematics normal
1 5 2
7
3
reverse
row
1ro
w 2
normalsinistraldextralreverseTotal weathered
reverseTotal Post-Cretaceous normal
with no kinematics
normalsinistraldextralreverseTotal unweathered with no kinematics
1
1
263
46 6
66
81
0
110
2 1
1 11
with no kinematics
row
3ro
w 4
ep-qtz.corDatasets: 17
ep-qtz no kinematics.corDatasets: 3
ep-qtz reverse.corDatasets: 6
ep-qtz dextral.corDatasets: 3
ep-qtz sinistral.corDatasets: 1
ep-qtz normal.corDatasets: 4
Total_unweathered.corDatasets: 60
Total_unweathered no kinematics.corDatasets: 7
Total_unweathered_reverse.corDatasets: 14
Total_unweathered_dextral.corDatasets: 22
Total_unweathered_sinistral.corDatasets: 6
Total_unweathered_normal.corDatasets: 11
Total_weathered.corDatasets: 124
Total_unweathered no kinematics.corDatasets: 35
Total_unweathered_reverse.corDatasets: 54
Total_unweathered_dextral.corDatasets: 4
Total_unweathered_sinistrall.corDatasets: 3
Total_unweathered_normal.corDatasets: 28
Total post cretaceous.corDatasets: 23
Total post cretaceous no kinematics.corDatasets: 11
Total post cretaceous reverse.corDatasets: 8
Total post cretaceous normal.corDatasets: 4
sinistral
Fig. 10. Same data as in Fig. 9, but sorted according to the following four criteria, each of which corresponds to one row in the table: row 1: fault planes that are coated by relativelyhigh-temperature mineral phases, such as quartz and epidote; row 2: fault-slip data derived exclusively from the fresh, unweathered Namaqua basement; row 3: fault-slip dataderived from weathered sections of the Namaqua basement topping the mesas; row 4: fault-slip data derived from outcrops of post-(Late?) Cretaceous age. In detail, fault planesplotted in row 4 refer to volcanic breccias of the Gamoep suite.
11G. Viola et al. / Tectonophysics xxx (2011) xxx–xxx
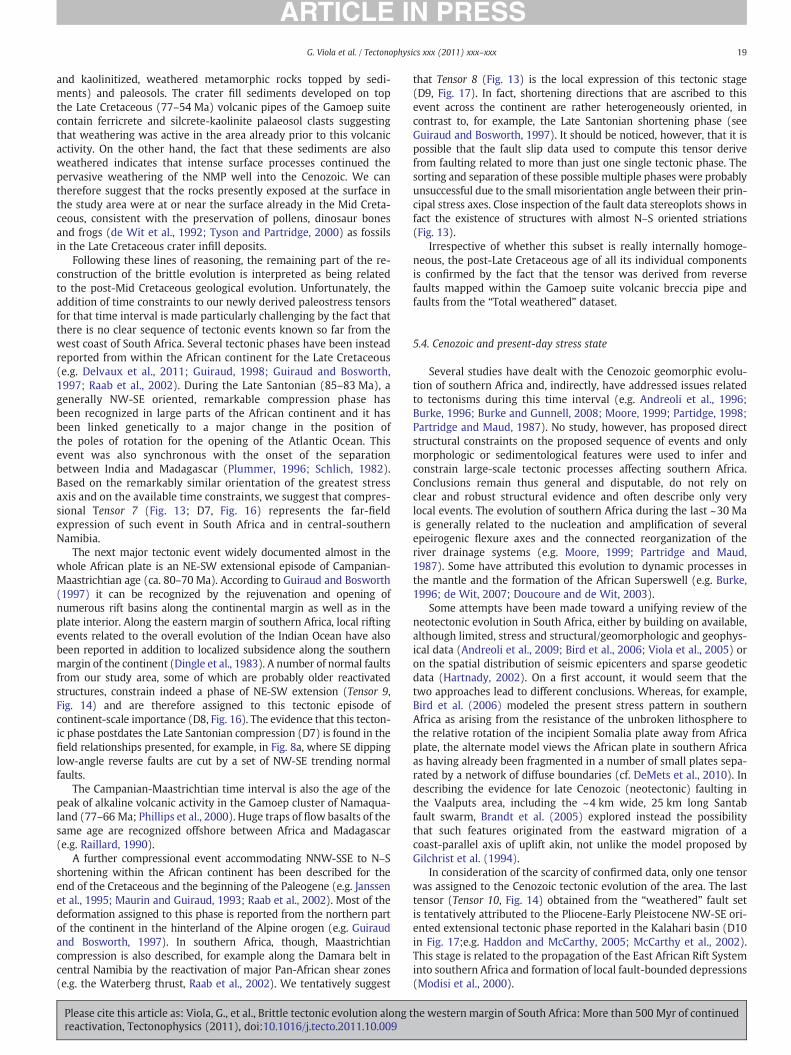
Before meaningful inversion could be computed, it was necessaryto separate the heterogeneous data sets into homogeneous sub-setsby using field criteria (for example age relationships or type of miner-alization on the fault plane) and visual and mathematical compatibil-ity criteria (e.g. grouping of calculated individual axes and maximumangular deviation of axes from calculated sub-set means). Fig. 10shows the result of a preliminary conceptual sorting of the datawherein, given the common presence of the Late Cretaceous silicifiedand kaolinitized paleosols, of weathering profiles and alluvial fansequence sediments of the Dasdap Formation that cap the Namaquametamorphic rocks in the study area (Brandt et al., 2003), we havesplit the total fault-slip data into a batch derived from fresh NMProcks (“Total unweathered”, row 2 in Fig. 10) from a second batchderived from the weathered sections, the paleosols and the fluvialsediments (“Total weathered”, row 3 in Fig. 10; see Fig. 3 for a sche-matic presentation of these relationships). In addition we used theGamoep melilite suite as a second time marker during the sorting ofour dataset. This approach is exemplified by the structural analysisof a ~20 m high, silicified, breccia pipe standing pillar-like above thebasement granites SW of Vaalputs (Volcanic plug in Fig. 2). This explo-sive vent contains numerous striated fault planes (Location 48 in
Please cite this article as: Viola, G., et al., Brittle tectonic evolution along treactivation, Tectonophysics (2011), doi:10.1016/j.tecto.2011.10.009
Fig. 9) and was used to compute well-defined post-Late Cretaceoustensors.
The subset “Higher temperature faults” (row 1 in Fig. 10) refers in-stead to striated fault planes decorated predominantly by relativelyhigh-temperature mineral phases such as quartz and epidote (e.g.Drake et al., 2009). These were used to make inferences about theearlier part of the brittle deformational history of the area, assumingthat this took place at deeper crustal conditions than the youngerevents.
Based on the assumption that faults that deform the unweatheredNMP but not the paleosols result from a history predating the LateCretaceous development of the latter, we processed initially fault-slip data merged from the “Higher temperature faults” and “Totalunweathered” subsets (data from row 1 and 2 in Fig. 10), implyingthat these are the oldest brittle features documentable by our study.Most of these striated fault planes are steep to vertical strike-slipfaults and bear subhorizontal striations. The corresponding totaldataset is complex and heterogeneous and it contains faults thatformed in response to more than just one single deformation phase.Four distinct and relatively robust compressive paleostress tensorswere derived and are labeled 1 to 4 in Fig. 11. In addition, there are
he western margin of South Africa: More than 500 Myr of continued

Waste
21
43
Fig. 11. Compressional paleostress tensors derived from the fault-slip data of rows 1 and 2 in Fig. 10. Stress tensors are labeled 1 to 4 for ease of reference. See text for more details.
12 G. Viola et al. / Tectonophysics xxx (2011) xxx–xxx
a number of normal and strike-slip faults (Fig. 10), which were usedto constrain two additional states of stress (Fig. 12).
Tensors 1 to 4 are all based on the inversion of sets of conjugate,steep shear fractures, which show variable degrees of preservation(Fig. 11). Paleostress Tensor 1 is characterized by broadly overlappingsinistral and dextral strike-slip sub-vertical fault planes trendingNW-SE. These do not define a clear conjugate set, but a reliablestrike-slip stress tensor was computed with a sub-horizontal σ1 ori-ented 01/315 and σ3 at 05/224. Caution is necessary when interpret-ing this tensor and a few more of those discussed below (e.g. Tensor4), as the acute angle defined by the faults of the suggested conjugateset is extremely tight and some of the faults are subparallel to σ1
(mechanically unlikely). Similar results were however obtained alsoby Viola et al. (2009), Saintot et al. (2011) and Viola et al. (2011) instudies dealing with the Precambrian basement of SW Scandinavia,which is fully saturated with fractures and which, similarly to the Na-maqualand basement, underwent a long and complex brittle history.
Please cite this article as: Viola, G., et al., Brittle tectonic evolution along treactivation, Tectonophysics (2011), doi:10.1016/j.tecto.2011.10.009
Under these conditions it is common to observe rather “closed”conjugate sets, which likely reflect low friction coefficients and severereactivation. These factors can indeed promote slip along highlymisoriented fault planes.
Stress Tensor 2 is defined by a statistically robust set ofNNW-striking dextral and a few N-S sinistral strike-slip faults. A tightacute angle constrains σ1 at 10/352 and a sub-vertical σ3 at 70/230.
Stress Tensor 3 suggests a minor clockwise rotation of the greatestcompressive stress σ1 with respect to Tensor 2, with σ1 oriented 06/016. A well-defined family of N–S-trending sub-vertical dextral faultsand a set of ca. NE-SW sinistral faults characterize it. We interpretthese two tensors as truly representative of two separate and distinctshortening episodes with an only slightly different σ1 (and not as justresulting from data scatter and possible interchange of σ2 and σ3)because several outcrops presented compelling evidence of initiallysinistral c. N–S trending faults that were reactivated dextrally, consis-tent with a progressive clockwise reorientation of σ1.
he western margin of South Africa: More than 500 Myr of continued

65
Fig. 12. Extensional paleostress tensors computed from the fault-slip data of rows 1 and 2 in Fig. 10.
13G. Viola et al. / Tectonophysics xxx (2011) xxx–xxx
The last compressive tensor derived from these faults, Tensor 4,constrains a ca. E–W σ1 at 05/269 and a sub-vertical σ3 at 82/046.
The “waste” of this analysis consists of 13 faults that do not fit theabove tensors, because of either geometric or kinematic incompatibility(Fig. 11).
Several normal faults were also found (Fig. 10) and have beenused to compute two different tensional stress tensors (Fig. 12).
Tensor 5 was computed by inverting steep (probably reactivatedolder strike-slip fault planes) transtensional faults and is defined bya sub-horizontal extension direction toward 054 (Fig. 12). The secondtensional tensor (Tensor 6) yields a ca. E–W horizontal extensiondirection (Fig. 12).
Processing of fault-slip data from the weathered silicified andkaolinitized mesas and from the Dasdap Formation yielded 2compressive (Fig. 13) and 2 tensional (Fig. 14) paleostress tensors, allof which are taken to postdate those described hitherto. In order totest the possibility of partial reactivation of preexisting faults, whichare those that in our work-flow predate the Late Cretaceous, thedeposition of the Dasdap Formation and the development of thepaleosols, we have tested the compatibility of the “waste” from theprevious analysis (that is, from the computation of Tensors 1 to 6)with the tensors derived from the “Total weathered” dataset. Resultswere positive, given that all but one of the 13 rejected faults could beimplemented successfully within the sub-sets inverted to Tensors 7 to10.
A first tensor (Tensor 7, Fig. 13) was generated through the inver-sion of a set of ca. NW- and SE-moderately dipping thrusts. σ1 trendsNW-SE and is horizontal (00/307), with a sub vertical σ3 oriented 86/211. The stress ratio of 0.4 indicates thrusting under almost purecompression conditions.
A second, shortening tensor (Tensor 8, Fig. 13) was derivedthrough the inversion of a set of NW-SE to E–W striking and moder-ately dipping thrusts and several sub vertical strike-slip faults takenfrom the waste of the “Total unweathered” subset. A horizontal σ1
striking 00/207 was obtained, together with a sub vertical σ3 at 84/111. The corresponding stress ratio of 0.75 indicates radialcompression.
In addition, two clear and statistically robust extensional stresstensors were constrained by a number of normal faults (Tensor 9
Please cite this article as: Viola, G., et al., Brittle tectonic evolution along treactivation, Tectonophysics (2011), doi:10.1016/j.tecto.2011.10.009
and 10, Fig. 14). Tensor 9 constraints extension along the direction08/048, and is characterized by a stress ratio of 0.25. Tensor 10, onthe other hand, defines an almost orthogonal stretching direction,wherein σ3 is now oriented 02/292 and the stress ratio is 0.31.
In the analysis of the post-Late Cretaceous stress tensors, datashown in row 4 of Fig. 10 deserve special attention. Those striatedfault planes are derived predominantly from a volcanic breccia pipethat belongs to the Gamoep suite (Volcanic plug in Fig. 2). Apartfrom a few extensional faults that do not allow any statisticallyreliable inversion, striated planes derived from this “well-dated”time marker confirm a robust compressional stress tensor with a σ1
oriented 09/230 (Fig. 15). This is similar to the shortening direction00/207 mentioned above (Tensor 8 of Fig. 13), which, in the absenceof more compelling and geochronologically-constrained evidence,justifies the merging of the data derived from the silicified andkaolinitized paleosols and from the Dasdap Formation with the datafrom the volcanic plug.
4.2.1.3. Slip tendency analysis resultsOvercoring data from Namaqualandmines indicate that the region
is presently in a state of strike-slip faulting regime, with an overallNW-SE oriented compression (Nieuwoudt and Rozendaal, 1990). σ1
values range from 56 MPa at 720 m depth to 83 MPa at 1572 mdepth, and σ3 values from 17 MPa to 36 MPa, respectively. σ2 is in-variably subvertical. Stress ratios R=(σ2-σ3)/(σ1-σ3) vary generallybetween 0.1 and 0.2 (Fig. 16a). The stress state evolution withdepth is shown in a differential stress vs. mean stress diagram(Fig. 16a for dry conditions and Fig. 16b for the case of presence ofwater under hydrostatic conditions), together with Mohr-Coulombfailure curves for friction coefficient values (μ) of 0.2, 0.4, 0.6 and1.0. The data from various depths indicate that the stress state israther close to the failure curve with friction coefficient 0.6, whichis typically considered as the limit for frictional reactivation (Byerlee,1978).
5. Discussion
The goal of our study is to propose a scheme for the regional brittleevolution, wherein each computed paleostress tensors is placed in
he western margin of South Africa: More than 500 Myr of continued

Waste
7 8
No kinematics
Fig. 13. Compressive paleostress tensors obtained from the inversion of fault-slip data from the weathered silicified and kaolinitized mesas and from the Dasdap Formation (row 3in Fig. 10).
14 G. Viola et al. / Tectonophysics xxx (2011) xxx–xxx
time and assigned to one of the orogenic events that have affected theregion. It is important to stress that studies of this kind rely on a num-ber of assumptions and that the complex and long geological evolu-tion of the region makes any analysis of the brittle historyextremely challenging. As a consequence, it should be born in mindthat there are several sources of uncertainty involved in our studyand that the results and the model presented below should be evalu-ated critically and cross-checked against other types of independentobservations.
Fig. 17 is a “paleostress tensor vs. time” chart, with which we sug-gest a conceptual model for the evolution of the region. The paucity ofwell-dated time markers and the lack of geochronological data to bet-ter constrain the time dimension of our stress tensors unfortunatelycompromise the establishment of an absolute time-sequence of de-formational events. Nonetheless, the time line is punctuated by afew, broadly defined “episodes”, which can be used to frame thestates of stress into narrower time windows. In addition to the LateCretaceous paleosols, the Dasdap Formation (Brandt et al., 2003) andthe Gamoep melilite suite, we can also rely on one important andwell constrainedMid Cretaceous tectonic event related tomargin upliftand a pulse of accelerated denudation along the Southern Africa mar-gin (e.g., Brown et al., 2000; Kounov et al., 2009; Tinker et al., 2008).To refine our reconstruction, we have also reviewed a significantamount of literature that deals with the state of stress of the Africanplate during its evolution. Fig. 18 presents a comprehensive compila-tion of the relevant literature; the figure allows a synthetic overview
Please cite this article as: Viola, G., et al., Brittle tectonic evolution along treactivation, Tectonophysics (2011), doi:10.1016/j.tecto.2011.10.009
of the main compressive and extensional episodes recognized or sug-gested hitherto for various parts of the African plate (e.g. Basson andviola, 2003, 2004; Davies and Coward, 1982; Frimmel, 2000; Gresse,1995; Guiraud and Bosworth, 1997; Haddon and McCarthy, 2005;Johnston, 2000; Kounov et al., 2009; Nürnberg and Müller, 1991;Raab et al., 2002; Rabinovich and LaBrecque, 1979; von Veh, 1993).
In synthesis, our model is derived through the comparative analy-sis of our own results against the available time markers and theknown episodes of crustal compression and extension. We discussthis model below in detail, from old to young.
5.1. Pan African history
The brittle deformational history we have investigated began prob-ably already by ca. 0.95 Ga in response to the exhumation and progres-sive cooling of the rocks of the Namaqua Belt (Cornell et al., 2006;Eglington, 2006; Frimmel and Frank, 1998). The Pan African orogeniccycle, which resulted in the amalgamation of the supercontinentGondwana (e.g. Unrug, 1997), was expressed in southwest Africa bythe development of the Gariep Belt (Fig. 1) and its subsequent accre-tion onto the Namaqua foreland (e.g. Frimmel, 2000). Docking causedan important brittle structural overprint of the Namaqua foreland,whereas only minor thermal resetting is instead reported, mostly con-fined to the most proximal part of Namaqualand foreland and todiscrete zones (Frimmel and Frank, 1998). Existing models for thebuildup of the Gariep Belt (e.g. Frimmel, 2000; Gresse, 1994, 1995)
he western margin of South Africa: More than 500 Myr of continued
9 10
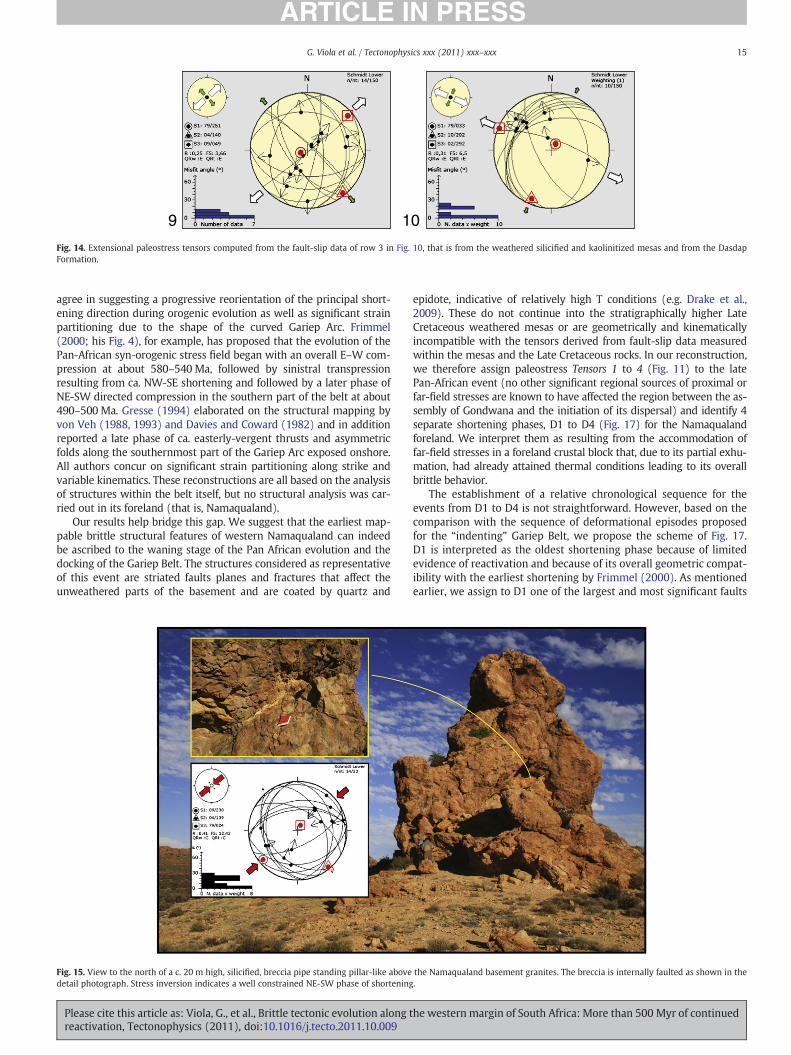
Fig. 14. Extensional paleostress tensors computed from the fault-slip data of row 3 in Fig. 10, that is from the weathered silicified and kaolinitized mesas and from the DasdapFormation.
15G. Viola et al. / Tectonophysics xxx (2011) xxx–xxx
agree in suggesting a progressive reorientation of the principal short-ening direction during orogenic evolution as well as significant strainpartitioning due to the shape of the curved Gariep Arc. Frimmel(2000; his Fig. 4), for example, has proposed that the evolution of thePan-African syn-orogenic stress field began with an overall E–W com-pression at about 580–540 Ma, followed by sinistral transpressionresulting from ca. NW-SE shortening and followed by a later phase ofNE-SW directed compression in the southern part of the belt at about490–500 Ma. Gresse (1994) elaborated on the structural mapping byvon Veh (1988, 1993) and Davies and Coward (1982) and in additionreported a late phase of ca. easterly-vergent thrusts and asymmetricfolds along the southernmost part of the Gariep Arc exposed onshore.All authors concur on significant strain partitioning along strike andvariable kinematics. These reconstructions are all based on the analysisof structures within the belt itself, but no structural analysis was car-ried out in its foreland (that is, Namaqualand).
Our results help bridge this gap. We suggest that the earliest map-pable brittle structural features of western Namaqualand can indeedbe ascribed to the waning stage of the Pan African evolution and thedocking of the Gariep Belt. The structures considered as representativeof this event are striated faults planes and fractures that affect theunweathered parts of the basement and are coated by quartz and
Fig. 15. View to the north of a c. 20 m high, silicified, breccia pipe standing pillar-like abovedetail photograph. Stress inversion indicates a well constrained NE-SW phase of shortening
Please cite this article as: Viola, G., et al., Brittle tectonic evolution along treactivation, Tectonophysics (2011), doi:10.1016/j.tecto.2011.10.009
epidote, indicative of relatively high T conditions (e.g. Drake et al.,2009). These do not continue into the stratigraphically higher LateCretaceous weathered mesas or are geometrically and kinematicallyincompatible with the tensors derived from fault-slip data measuredwithin the mesas and the Late Cretaceous rocks. In our reconstruction,we therefore assign paleostress Tensors 1 to 4 (Fig. 11) to the latePan-African event (no other significant regional sources of proximal orfar-field stresses are known to have affected the region between the as-sembly of Gondwana and the initiation of its dispersal) and identify 4separate shortening phases, D1 to D4 (Fig. 17) for the Namaqualandforeland. We interpret them as resulting from the accommodation offar-field stresses in a foreland crustal block that, due to its partial exhu-mation, had already attained thermal conditions leading to its overallbrittle behavior.
The establishment of a relative chronological sequence for theevents from D1 to D4 is not straightforward. However, based on thecomparison with the sequence of deformational episodes proposedfor the “indenting” Gariep Belt, we propose the scheme of Fig. 17.D1 is interpreted as the oldest shortening phase because of limitedevidence of reactivation and because of its overall geometric compat-ibility with the earliest shortening by Frimmel (2000). As mentionedearlier, we assign to D1 one of the largest and most significant faults
the Namaqualand basement granites. The breccia is internally faulted as shown in the.
he western margin of South Africa: More than 500 Myr of continued

720mR=0.10
914mR=0.17
1372 mR=0.21
1572 mR=0.10
0.0
0.5
1.0Slip tendencyc
ba
Fig. 16. a): Differential stress vs. mean stress diagram of the stress measurements from various depths at Namaqualand for a dry system. b): Results for the case of water underhydrostatic conditions. In both cases, Mohr-Coulomb failure curves are shown for friction coefficient values (μ) of 0.2, 0.4, 0.6 and 1.0. Stress ratio values at various depths arealso shown. c): Slip tendency plots calculated for the present day stress state in Namaqualand, for different depths. Slip tendency values of 1 indicate that the specific orientationis close to failure at the given stress state. Lower hemisphere, equal area projections.
16 G. Viola et al. / Tectonophysics xxx (2011) xxx–xxx
that dissect the Namaqua basement of the region studied (Fig. 4). Thecommon observation in the field of convincing evidence of faultreactivation consistent with a progressive clockwise rotation of thegreatest compressive stress from its initial ca. NW-SE trend is inagreement with our reconstruction and D2 and D3. For example,several cases of dextral reactivation of ca. N–S trending and originallysinistral faults have been documented (Fig. 7c), consistent with thetransition from D2 to D3 (Fig. 17). Structures formed during D2 andD3 are the most common and form a dense fault network that affectsthe entire Namaqualand (Fig. 4). It is not clear at this stage whetherthese are two separated events, or instead the expression of aprogressive rotation of the greatest compressive stress. Structuresthat can be assigned to D4 are not so numerous and are found predom-inantly within the northernmost part of the study area.
Results of the fault-slip data inversion procedure find support inthe remote sensing analysis. Shortening directions almost identicalto those constrained by the paleostress tensors characteristic of defor-mation phases D1-D4 were in fact inferred through the analysis of theimagery of the region (Fig. 6), which has led to the identification offour systematic sets of conjugate strike-slip faults (set “a” to set “d”of Fig. 6). We propose that fault sets “a”, “b”, “c” and “d” are the resultof deformation phases D1, D2, D3 and D4, respectively. The subverticalplanar attitude of the faults that we assign to sets “a” to “d” explainswhy they were picked selectively by the remote sensing analysis.Most of the faults and fractures of the later tectonic events are eitherthe result of reactivation of these Pan African precursors or are simplynot seen as straight (and easily recognizable) lineaments on the re-mote sensing imagery due to their low dip (see below).
5.2. Early to Mid Cretaceous evolution
The first extensional paleostress tensor derived from the “Totalunweathered” dataset (data of row 2 in Fig. 10 and Tensor 5 in Fig. 12)is tentatively assigned to the Late Jurassic–Early Cretaceous stage ofthe opening of the South Atlantic Ocean (D5 in Fig. 16; Rabinovich andLaBrecque, 1979; Nürnberg and Müller, 1991). Striated fault planesinverted to compute it were mapped mostly along a cross-section fromSpringbok to the coast, thus at high angle to the present coastline.
Please cite this article as: Viola, G., et al., Brittle tectonic evolution along treactivation, Tectonophysics (2011), doi:10.1016/j.tecto.2011.10.009
Numerous brittle faults occur (e.g. Fig. 7a) but many do not show clearkinematic evidence. Only a few fault planes could therefore be used toconstrain these directions; nonetheless, we believe that the computedtensor is geologically meaningful. For example, the NE-SW extension di-rection we propose is mechanically compatible with the general NW-SEto WNW-ESE strike direction of Early Cretaceous doleritic dikes, such asthe Cape, the Mehlberg and the Garies-Knersvlakte dyke swarms, datedat about ca. 134–132 Ma (Reid and Rex, 1994; Fig. 2) and widely ac-knowledged as reliable strain gouges of the initial crustal stretchinglinked with the opening of the South Atlantic.
It is intriguing, however, that one of the most important tectonicevents to have affected the western margin of the African continentduring the Mesozoic is expressed in our study by only a handful of stri-ated fault planes (only 5 faults were inverted to constrain thisextensional event; Fig. 16). It should be kept in mind, though, thatthe study area formed a domain of the passive margin that remainedrather distal from the actively rifting area. Most of the more intensivelyfaulted and stretched margin is presently part of the submergedAfrican shelf, not the target of our study. Moreover, the paucity of ex-tensional structures in the study area that can be ascribed to thisstage of the opening of the Atlantic Ocean is consistent with the ab-sence of faults causing offset across obvious lithological/strain markerssuch as the Neoproterozoic Gannakouriep dyke swarm (Fig. 2).
In fact, far-field, Early Cretaceous NNE-SSW extensional stresseswere proposed by Basson and Viola (2003, 2004) for the core of theKaapval craton of South Africa (thus far away from the activelydeforming Atlantic passive margin) based on studies dealing withthe emplacement mechanisms of Early Cretaceous kimberlitic dykes(Fig. 18). They proposed a tectonic scenario wherein tensional stres-ses generated by the incipient break-up and heralded by the transcur-rent Agulhas-Falkland fracture zone, led to localized crustal extensionwithin the continental interior in the brittle (seismic) carapace of theupper crust triggering the formation of kimberlite dyke–fracturearrays.
The second, ca. E–W oriented extensional stress tensor (D6 inFig. 17) is interpreted as being connected with the significant, tecton-ically induced Mid Cretaceous (115–90 Ma) denudation episode thathas been inferred to be responsible for the removal of up to 2.5–
he western margin of South Africa: More than 500 Myr of continued

post-90 Ma Dasdap depositionand weathering
ca. 77-54 Ma magmatism
D1
D2
D3
D4 > 500 Ma
tMid Cretaceous tectonic episode(115-90 Ma)
Present-day in situ stress,referred to as“Wegener stress anomaly”
Late Maasstrichtian 69-65 Marenewed regional compressionalevent
Renewed Atlantic extensional episode,corresponding to major margin upliftca. 80-70 Ma ago (Campanian-Maastrichtian)
Late Santonian 85-83 Maregional compressional event
Mid Cretaceous (115-90 Ma)major offshore unconformityand margin uplift
Opening of the South Atlantic.Cape, Mehlberg and Garies-Knersvlakte dykes134 - 132 Ma
Renewed extension-Okawango delta?
D5
D6
Pan-African
D7
D8
D9
D10
Fig. 17. Conceptual model of the brittle evolution of Namaqualand from the late stages of the Pan-African orogenic cycle to present-day. The time line is punctuated by geological events that are known to have affected the region and that areused to constrain the sequence of the states of paleostress derived in our study.
17G.V
iolaet
al./Tectonophysics
xxx(2011)
xxx–xxx
Pleasecite
thisarticle
as:Viola,G
.,etal.,Brittletectonic
evolutionalong
thewestern
margin
ofSouthAfrica:M
orethan
500Myr
ofcontinuedreactivation,Tectonophysics
(2011),doi:10.1016/j.tecto.2011.10.009

Mes
ozo
icP
aleo
zoic
Pre
cam
bri
anC
reta
ceo
us
Early
Late
Jura
ssic
Middle
Early
Late
Tri
assi
cP
erm
ian
Middle
Early
Neo-
Meso-
Paleo-
Late
Pal
eog
ene
Qu
ater
nar
y
Cen
ozo
icC
amb
rian
Pro
tero
zoic
Era
Per
iod
Epo
ch
Horizontal paleostress orientation
Late Santonian compression86 - 84 Ma (1)(North and Central Africa)
Campanian - Maastrichtian rifting84 - 65 Ma (1)(North, Central and South Africa)
Latest Maastrichtian -Earliest Paleocene compression67 - 60 Ma (1, 3)(North Africa and Damara belt)
Present-dayin situ stressin Namaqualand
Okawango delta depression (2)
opening of theAdamastor ocean (4-7)
Gariep orogeny (4-7)
Opening of the South Atlantic150 - 134 Ma
Cape Orogeny280 - 215 Ma (10)
Mid Cretaceous margin uplift 115 - 90 Ma (11)(South Africa)
N
(1) Guiraud and Bosworth, 1997(2) Haddon and McCarthy, 2005(3) Raab et al., 2002(4) Davies and Coward, 1982(5) von Veh, 1993(6) Gresse, 1995(7) Frimmel, 2000(8) Rabinovich and LaBrecque, 1979(9) Nurnberg and Muller, 1991(10) Johnston, 2000(11) Kounov et al., 2009(12) Basson and Viola, 2003
sigma 1 horizontal sigma 3 horizontal
West coast (8, 9) Continent interior (12)
Neo
gen
e
Fig. 18. Compilation of the known tectonic events that have affected Africa. Sources used to generate the compilation are listed in the figure.
18 G. Viola et al. / Tectonophysics xxx (2011) xxx–xxx
3 km of crust across the western coastal zone in front of the escarp-ment in South Africa (e.g. Brown et al., 2002; Kounov et al., 2008,2009; Tinker et al., 2008). Fission track analysis has helped constraina distinct period of accelerated cooling in the coastal domain duringthis time interval, which is reasonably associated with enhanced ex-humation and erosion. Onshore denudation was coupled with sub-stantial uplift offshore Namaqualand, where seismic profiles andboreholes show significant erosional horizons marking the Aptianregression (121–112 Ma; e.g. Brown et al., 1995; Gerrard and Smith,1983). Several lines of evidence indicate the tectonic character of
Please cite this article as: Viola, G., et al., Brittle tectonic evolution along treactivation, Tectonophysics (2011), doi:10.1016/j.tecto.2011.10.009
this episode and its regional significance (see Kounov et al., 2009 fora review). We propose that this denudation episode caused theexhumation of the NMP in the study area. The formation of the fluvialDasdap Formation described by Brandt et al. (2003) is probably asso-ciated with this episode.
5.3. Late Cretaceous evolution
As the area was exhumed to the surface, it underwent significantweathering leading to the development of thick saprolites (silicified
he western margin of South Africa: More than 500 Myr of continued
19G. Viola et al. / Tectonophysics xxx (2011) xxx–xxx
and kaolinitized, weathered metamorphic rocks topped by sedi-ments) and paleosols. The crater fill sediments developed on topthe Late Cretaceous (77–54 Ma) volcanic pipes of the Gamoep suitecontain ferricrete and silcrete-kaolinite palaeosol clasts suggestingthat weathering was active in the area already prior to this volcanicactivity. On the other hand, the fact that these sediments are alsoweathered indicates that intense surface processes continued thepervasive weathering of the NMP well into the Cenozoic. We cantherefore suggest that the rocks presently exposed at the surface inthe study area were at or near the surface already in the Mid Creta-ceous, consistent with the preservation of pollens, dinosaur bonesand frogs (de Wit et al., 1992; Tyson and Partridge, 2000) as fossilsin the Late Cretaceous crater infill deposits.
Following these lines of reasoning, the remaining part of the re-construction of the brittle evolution is interpreted as being relatedto the post-Mid Cretaceous geological evolution. Unfortunately, theaddition of time constraints to our newly derived paleostress tensorsfor that time interval is made particularly challenging by the fact thatthere is no clear sequence of tectonic events known so far from thewest coast of South Africa. Several tectonic phases have been insteadreported from within the African continent for the Late Cretaceous(e.g. Delvaux et al., 2011; Guiraud, 1998; Guiraud and Bosworth,1997; Raab et al., 2002). During the Late Santonian (85–83 Ma), agenerally NW-SE oriented, remarkable compression phase hasbeen recognized in large parts of the African continent and it hasbeen linked genetically to a major change in the position ofthe poles of rotation for the opening of the Atlantic Ocean. Thisevent was also synchronous with the onset of the separationbetween India and Madagascar (Plummer, 1996; Schlich, 1982).Based on the remarkably similar orientation of the greatest stressaxis and on the available time constraints, we suggest that compres-sional Tensor 7 (Fig. 13; D7, Fig. 16) represents the far-fieldexpression of such event in South Africa and in central-southernNamibia.
The next major tectonic event widely documented almost in thewhole African plate is an NE-SW extensional episode of Campanian-Maastrichtian age (ca. 80–70 Ma). According to Guiraud and Bosworth(1997) it can be recognized by the rejuvenation and opening ofnumerous rift basins along the continental margin as well as in theplate interior. Along the eastern margin of southern Africa, local riftingevents related to the overall evolution of the Indian Ocean have alsobeen reported in addition to localized subsidence along the southernmargin of the continent (Dingle et al., 1983). A number of normal faultsfrom our study area, some of which are probably older reactivatedstructures, constrain indeed a phase of NE-SW extension (Tensor 9,Fig. 14) and are therefore assigned to this tectonic episode ofcontinent-scale importance (D8, Fig. 16). The evidence that this tecton-ic phase postdates the Late Santonian compression (D7) is found in thefield relationships presented, for example, in Fig. 8a, where SE dippinglow-angle reverse faults are cut by a set of NW-SE trending normalfaults.
The Campanian-Maastrichtian time interval is also the age of thepeak of alkaline volcanic activity in the Gamoep cluster of Namaqua-land (77–66 Ma; Phillips et al., 2000). Huge traps of flow basalts of thesame age are recognized offshore between Africa and Madagascar(e.g. Raillard, 1990).
A further compressional event accommodating NNW-SSE to N–Sshortening within the African continent has been described for theend of the Cretaceous and the beginning of the Paleogene (e.g. Janssenet al., 1995; Maurin and Guiraud, 1993; Raab et al., 2002). Most of thedeformation assigned to this phase is reported from the northern partof the continent in the hinterland of the Alpine orogen (e.g. Guiraudand Bosworth, 1997). In southern Africa, though, Maastrichtiancompression is also described, for example along the Damara belt incentral Namibia by the reactivation of major Pan-African shear zones(e.g. the Waterberg thrust, Raab et al., 2002). We tentatively suggest
Please cite this article as: Viola, G., et al., Brittle tectonic evolution along treactivation, Tectonophysics (2011), doi:10.1016/j.tecto.2011.10.009
that Tensor 8 (Fig. 13) is the local expression of this tectonic stage(D9, Fig. 17). In fact, shortening directions that are ascribed to thisevent across the continent are rather heterogeneously oriented, incontrast to, for example, the Late Santonian shortening phase (seeGuiraud and Bosworth, 1997). It should be noticed, however, that it ispossible that the fault slip data used to compute this tensor derivefrom faulting related to more than just one single tectonic phase. Thesorting and separation of these possible multiple phases were probablyunsuccessful due to the small misorientation angle between their prin-cipal stress axes. Close inspection of the fault data stereoplots shows infact the existence of structures with almost N–S oriented striations(Fig. 13).
Irrespective of whether this subset is really internally homoge-neous, the post-Late Cretaceous age of all its individual componentsis confirmed by the fact that the tensor was derived from reversefaults mapped within the Gamoep suite volcanic breccia pipe andfaults from the “Total weathered” dataset.
5.4. Cenozoic and present-day stress state
Several studies have dealt with the Cenozoic geomorphic evolu-tion of southern Africa and, indirectly, have addressed issues relatedto tectonisms during this time interval (e.g. Andreoli et al., 1996;Burke, 1996; Burke and Gunnell, 2008; Moore, 1999; Partidge, 1998;Partridge and Maud, 1987). No study, however, has proposed directstructural constraints on the proposed sequence of events and onlymorphologic or sedimentological features were used to infer andconstrain large-scale tectonic processes affecting southern Africa.Conclusions remain thus general and disputable, do not rely onclear and robust structural evidence and often describe only verylocal events. The evolution of southern Africa during the last ~30 Mais generally related to the nucleation and amplification of severalepeirogenic flexure axes and the connected reorganization of theriver drainage systems (e.g. Moore, 1999; Partridge and Maud,1987). Some have attributed this evolution to dynamic processes inthe mantle and the formation of the African Superswell (e.g. Burke,1996; de Wit, 2007; Doucoure and de Wit, 2003).
Some attempts have been made toward a unifying review of theneotectonic evolution in South Africa, either by building on available,although limited, stress and structural/geomorphologic and geophys-ical data (Andreoli et al., 2009; Bird et al., 2006; Viola et al., 2005) oron the spatial distribution of seismic epicenters and sparse geodeticdata (Hartnady, 2002). On a first account, it would seem that thetwo approaches lead to different conclusions. Whereas, for example,Bird et al. (2006) modeled the present stress pattern in southernAfrica as arising from the resistance of the unbroken lithosphere tothe relative rotation of the incipient Somalia plate away from Africaplate, the alternate model views the African plate in southern Africaas having already been fragmented in a number of small plates sepa-rated by a network of diffuse boundaries (cf. DeMets et al., 2010). Indescribing the evidence for late Cenozoic (neotectonic) faulting inthe Vaalputs area, including the ~4 km wide, 25 km long Santabfault swarm, Brandt et al. (2005) explored instead the possibilitythat such features originated from the eastward migration of acoast-parallel axis of uplift akin, not unlike the model proposed byGilchrist et al. (1994).
In consideration of the scarcity of confirmed data, only one tensorwas assigned to the Cenozoic tectonic evolution of the area. The lasttensor (Tensor 10, Fig. 14) obtained from the “weathered” fault setis tentatively attributed to the Pliocene-Early Pleistocene NW-SE ori-ented extensional tectonic phase reported in the Kalahari basin (D10in Fig. 17;e.g. Haddon and McCarthy, 2005; McCarthy et al., 2002).This stage is related to the propagation of the East African Rift Systeminto southern Africa and formation of local fault-bounded depressions(Modisi et al., 2000).
he western margin of South Africa: More than 500 Myr of continued

Vaalputs<12>M>13>M>210km
30.05 °S
18.15 °E
30.45 °S
18.75 °E
Fig. 19. Distribution of seismic epicenters located in Namaqualand and in the Bush-manland Plateau from 1989 to 31 December 2010, as recorded by two trial TELS Sta-tions sited within the Vaalputs radioactive waste disposal facility (Necsa catalog;Scheepers and Andreoli, 2004; Scheepers, 2011, personal communication).
20 G. Viola et al. / Tectonophysics xxx (2011) xxx–xxx
6. Continued fault reactivation and faulting style
Our reconstruction suggests up to ten distinct deformationepisodes, all of which are constrained by the inversion of statisticallyrobust outcrop fault slip datasets (Fig. 17). So many events were inpart accommodated by important structural reactivation during the>500 Myr long brittle evolution of this region. Evidence of reactivationis documented by, for example, the rose diagram of Fig. 6, which indi-cates very limited dispersion of the orientations of the steep brittlefaults inherited from the Pan African history, which controlled theoverall subsequent development of the large-scale brittle grain ofNamaqualand. The paleostress state evolution summarized in Fig. 17also demonstrates important reactivation through the presence ofsimilarly oriented faults in different deformation episodes bearingstriations with significantly different trends caused by renewed fault-ing along the preexisting planes.
This in turn confirms the idea that, once formed, a fault-fracturerepresents a zone of intrinsical mechanical weakness, which is repeat-edly exploited during subsequent deformation phases to accommodatefurther increments of strain. The fracture saturation state of the NMPand the progressively decreasing ratio between fragmentation and jos-tling with time (sensu Munier and Talbot, 1993; Viola et al., 2009)inhibited therefore the nucleation and development of new brittlestructures with orientations other than the overall NNW-SSE grain(inherited from the early Pan African evolution) that characterizesthe NMP.
Viola et al. (2005) presented evidence of significant fault reactiva-tion also from the offshore domain in the Orange basin, where thealignment of mud volcanoes and the interpretation of seismic linesshot at high angle to the alignment trend were used to suggest thepresence of strike-slip faulting along NNW-SSE steep faults. In addition,they also proposed that strike-slip faults root down into- andreactivated older listric normal faults genetically linked to the localopening of the Atlantic Ocean. Viola et al. (2005) interpretedNNW-SSE-oriented wrench faulting as a neotectonic phenomenon,expression of the so-called “Wegener anomaly” (Fig. 17; Andreoli etal., 1996; Bird et al., 2006).
The results of our fault slip tendency analysis, calculated from thepresent-day stress as constrained by the in situ stress determinationsof Nieuwoudt and Rozendaal (1990) (Fig. 17), are in agreement withthese observations and allow to better define the concept of faultreactivation and to link it to the present-day seismicity of the area(Andreoli et al., 2009). At all depths considered, slip tendency valuesare highest for conjugate faults striking WNW-ESE and NNW-SSE and
Please cite this article as: Viola, G., et al., Brittle tectonic evolution along treactivation, Tectonophysics (2011), doi:10.1016/j.tecto.2011.10.009
dipping between 50° and 90°. The highest computed slip tendencyvalues are above or close to 1, suggesting that faults with such orien-tations are prone to failure in the present stress field. This orientationprediction strengthens the suggestions of Viola et al. (2005) with re-gard to neotectonic strike-slip faulting along steep to sub-verticalNNW-SSE and conjugate direction trends. Moreover, it is also inagreement with the location of a cluster of seismic events recordedand located immediately to the west of Vaalputs (Fig. 19; Andreoliet al., 2009; J. Scheepers, pers. comm.), where numerous earthquakesup to magnitude 4 are aligned along a ca. 25 km long NNW-SSE seis-mogenic weak fault zone with a remarkable morphologic signature.
Finally, we notice how the faulting style in the weathered profilesis remarkably different from that observed and documented withinthe fresh NMP basement. Fault-slip data derived from the latter areinvariably associated with steep to sub vertical strike-slip faults,often arranged in conjugate sets with very tight acute angles. Onthe other hand, faults and fractures from the weathered horizonsare predominantly low-angle thrusts and normal faults. The sub-horizontal fossil weathered horizons may have acted as a weakmechanical boundary such that post-weathering deformation waspreferentially localized along faults and fractures subparallel toweathering front in the kaolinite-enriched weathered mesas (e.g.Angerer et al., 2011).
7. Conclusions
This study has gathered and compiled for the first time a significantdata set of brittle structures in Namaqualand, western South Africa.Remote sensing, field work and stress tensor inversion have beenused to propose a robust conceptual model that accounts for morethan 500 Myr of brittle deformational history along thewesternmarginof South Africa. This long-lasting, complex brittle evolution stems fromthe generation of steep strike-slip fractures and faults in the NMP dur-ing the Neoproterozoic Pan African orogeny, when the Gariep MobileBelt docked against the rigid Namaqualand foreland as part of theprocess that formed super continent Gondwana. The subsequent andcontinued reactivation of these pre-existing, inherited structures (upto the present time, as documented by the local present-day seismicactivity) has controlled vehemently the accommodation of younger in-crements of strain, both compressional and extensional, that resultedpredominantly from the Mesozoic evolution of the plate and the open-ing of the Atlantic Ocean. The paleostress tensors summarized in Fig. 17describe these multiple episodes of fragmentation and reactivation,and, furthermore, tie in reasonably well with the known geologicalevolution of the region. Comparison of our results with other episodesof deformation known to have affected the African plate (Fig. 18)allows the better characterization of a number of important tectonicevents at the continental scale and yields useful insights into themechanisms that controlled the opening of the South Atlantic Ocean.
Acknowledgments
Research described in this report was funded by NGU and Statoilthrough ‘The African Plate’ project. The authors are also grateful toNecsa, the South African National Research Foundation (grant FUNNRF 70728) and the Inkaba ye Africa research initiative (sub-project:Post Gondwana tectonics from Namaqualand to the Kalahari) for pro-viding financial and traveling assistance. This paper is the publicationnr. 65 of the Inkaba ye Africa project. Ingrid Stengel and AndrewLogue are thanked for their great support in the field, stimulatingdiscussions and friendship. As always, special thanks go to the staffof Necsa and of the Vaalputs Radioactive Waste Disposal Facility fortheir hospitality and logistical support. The reviewers Donald Wiseand Francesco Mazzarini provided constructive and inspiring com-ments. Fabrizio Storti handled very efficiently the review process.
he western margin of South Africa: More than 500 Myr of continued

21G. Viola et al. / Tectonophysics xxx (2011) xxx–xxx
References
Anderson, E.M., 1951. The Dynamics of Faulting and Dyke Formation with Applicationsto Britain. Oliver & Boyd, Edinburgh, p. 191.
Andreoli, M.A.G., Doucoure, M., Van Bever Donker, J., Brandt, D., Andersen, N.J.B., 1996.Neotectonics of southern Africa: a review. Africa Geosciences Review 3 (1), 1–16.
Andreoli, M.A.G., Hart, R.J., Ashwal, L.D., Coetzee, H., 2006. Correlation between U, Thcontent and metamorphic grade in the Western Namaqualand belt, South Africa,with implications for radioactive heating of the crust. Journal of Petrology 47,1095–1118.
Andreoli, M.A.G., Viola, G., Kounov, A., Scheepers, J., Heidbach, O., Stengel, I., 2009.History of stress at Vaalputs, Namaqualand, South Africa: evidence for aMid-Cretaceous “Wegener-type Orogeny” in western southern Africa. 6 pp. 11thSAGA Biennial Technical Meeting and Exibition, Mbabane, Swaziland.
Angelier, J., 1979. Determination of the mean principal direction of stresses for a givenfault population. Tectonophysics 56, 17–26.
Angelier, J., Tarantola, A., Valette, B., Manoussis, S., 1982. Inversion of field data infault tectonics to obtain the regional stress; I, single phase fault populations: anew method of computing the stress tensor. Geophysical Journal of the RoyalAstronomical Society 69, 607–621.
Angerer, T., Greiling, R.O., Avigad, D., 2011. Fabric development in a weathering profileat a basement-cover interface, the sub-Cambrian peneplain, Israel: implications fordecollement tectonics. Journal of Structural Geology 33, 819–832.
Basson, I.J., Viola, G., 2003. Structural overview of selected Group II kimberlite dykearrays in South Africa: implications for kimberlite emplacement mechanisms.South African Journal of Geology 106, 375–394.
Basson, I.J., Viola, G., 2004. Passive kimberlite intrusion into actively dilating dyke-fracture arrays: evidence from fibrous calcite veins and extensional fracture cleavage.Lithos 76, 283–297.
Bird, P., Ben Avraham, Z., Schubert, G., Andreoli, M., Viola, G., 2006. Patterns of stressand strain rate in southern Africa. Journal of Geophysical Research 111, B08402.doi:10.1029/2005JB003882.
Bott, M.H.P., 1959. The mechanics of oblique slip faulting. Geological Magazine 96,109–117.
Brandt, D., Andreoli, M.A.G., McCarthy, T.S., 2003. Mesozoic fluvial deposits on a riftedcontinental margin near Vaalputs, Namaqualand, South Africa. South AfricanJournal of Geology 106, 1–16.
Brandt, D., Andreoli, M., McCarthy, T.S., 2005. The Late Mesozoic paleosols andCenozoic fluvial deposits at Vaalputs, Namaqualand, South Africa. Possible deposi-tional mechanism and their bearing on the evolution of the continental margin.South African Journal of Geology 108, 267–280.
Brown, R.W., 1992. A fission track thermochronology study of the tectonic andgeomorphic development of the sub-aerial continental margins of southern Africa.PhD thesis, La Trobe University, Melbourne, Australia.
Brown, L.F., Benson, J.M., Brink, G.J., et al., 1995. Sequence stratigraphy in offshore SouthAfrican Divergent Basins. An Atlas on Exploration for Cretaceous Low-stand Traps bySOEKOR (Pty) Ltd. AAPG Studies in Geology, 41. 184 pp.
Brown, R.W., Gallagher, K., Gleadow, A.J.W., Summerfield, M.A., 2000. Morphotectonic evo-lution of the South Atlanticmargins of Africa and South America. In: Summerfield, M.A.(Ed.), Geomorphology and Global Tectonics. John Wiley and Sons Ltd., pp. 255–284.
Brown, R.W., Summerfield, M.A., Gleadow, A.J.W., 2002. Denudation history along atransect across the Drakensberg Escarpment of southern Africa derived from apa-tite fission track thermochronology. Journal of Geophysical Research 107 (B12),2350. doi:10.1029/2001JB000745.
Brynard, H.J., 1988. A petrological and geochemical study regarding the suitability ofthe Vaalputs Radioactive Waste Disposal Facility. Ph.D. thesis, University ofPretoria, Pretoria. South Africa.
Brynard, H.L., Levin,M., Botha, J., 1996. Importance of natural attenuation of contaminantsas parameter in site selection. African Geoscience Review 3, 17–30.
Burke, K., 1996. The African Plate. South African Journal of Geology 99, 341–409.Burke, K., Gunnell, Y., 2008. The African Erosion Surface: a continental-sacle synthesis
of geomorphology, tectonics, and environmental change over the past 180 mil-lion years. Geological Society of America, Memoir 201, 66.
Byerlee, J.D., 1978. Friction of rocks. Pure and Applied Geophysics 116, 615–629.Cornelissen, A.K., Verwoerd, W.J., 1975. The Bushmanland kimberlites and related
rocks. In: Ahrens, L.H., Dawson, J.B., Duncan, A.R., Erlank, A.J. (Eds.), Physics andChemistry of the Earth, Vol. 9. Pergamon Press, Oxford, pp. 71–80.
Cornell, D.H., Thomas, R.J., Moen, H.F.G., Reid, D.L., Moore, J.M., Gibson, R.L., 2006. TheNamaqua-Natal Province. In: Johnson, M.R., Anhaeusser, C.R., Tomas, R.J. (Eds.),The Geology of South Africa. : Geological Society of South Africa. Johannesburg/Council for Geoscience, Pretoria, pp. 325–379.
Davies, C.J., Coward, M.P., 1982. The structural evolution of the Gariep Arc in southernNamibia. Precambrian Research 17, 173–198.
de Wit, M.J., 2007. The Kalahari Epeirogeny and climate change: differentiating causeand effect from core to space. South African Journal of Geology 110, 367–392.
de Wit, M.J., Ransome, I.G.D., 1992. Regional inversion tectonics along the southernmargin of Gondwana. In: de Wit, M.J., Ransome, I.G.D. (Eds.), Inversion Tectonicsof the Cape Fold Belt, Karoo and Cretaceous Basins of Southern Africa. Balkema,Rotterdam, pp. 15–21.
de Wit, M.C.J., Ward, J.D., Spaggiari, R., 1992. A reappraisal of the Kangnas dinosaur site,Bushmanland, South Africa. South African Journal of Science 88, 504–507.
Delvaux, D., Sperner, B., 2003. New aspects of tectonic stress inversion with referenceto the TENSOR program. In: Nieuwland, D.A. (Ed.), New Insights into Structural In-terpretation and Modelling: Geological Society of London Special Publication, 212,pp. 75–100.
Please cite this article as: Viola, G., et al., Brittle tectonic evolution along treactivation, Tectonophysics (2011), doi:10.1016/j.tecto.2011.10.009
Delvaux, D., Kadima, E., Litke, R., Sachse, V., Glasmacher, U., Bauer, F., Sebagenzi, S.,2011. Late Cretaceous subsidence and tectonic inversion in the congo Basin frompaleostress, organic matter maturation and thermocronometric studies of archivedcore and outcrop samples. EUG 2011. Vienna.
DeMets, C., Gordon, R.G., Argus, D.F., 2010. Geologically current plate motions. GeophysicalJournal International 181, 1–80.
Dingle, R.V., Siesser, W.G., Newton, A.R., 1983. Mesozoic and Tertiary Geology of SouthernAfrica. Balkema, Rotterdam. 375 pp.
Doucoure, C.A., de Wit, M.J., 2003. Old inherited origin for the present near bimodal to-pography of Africa. Journal of African Earth Sciences 36, 371–388.
Drake, H., Tullborg, E.-L., Page, L., 2009. Distinguish multiple events of fracture miner-alization related to far-field orogenic effects in Paleoproterozoic crystalline rocks,Simpevarp area, SE Sweden. Lithos 110, 37–49.
Eagles, G., 2007. New angles on South Atlantic opening. Geophysical Journal Interna-tional 166, 353–361.
Eales, H.V., March, J.S., Cox, K.G., 1984. The Karoo igneous province: an introduction. In:Erlank, A.J. (Ed.), Petrogenesis of the Volcanic Rocks of the Karoo Province:Geological Society of South Africa Special Publication, 13, pp. 1–26.
Eglington, B.M., 2006. Evolution of the Namaqua-Natal Belt, southern Africa — ageochronological and isotope geochemical review. Journal of African Earth Sci-ences 46, 93–111.
Etchecopar, A., Vassuer, G., Daignieres, M., 1981. An inverse problem in microtectonicsfor the determination of stress tensors from fault striations analysis. Journal ofStructural Geology 3, 51–65.
Frimmel, H.E., 2000. The Pan-African Gariep Belt in Southwestern Namibia and WesternSouth Africa. Communications of the Geological Survey of Namibia 12, 197–209.
Frimmel, H.E., Frank, W., 1998. Neoproterozoic tectono-thermal evolution of the GariepBelt and its basement, Namibia and South Africa. Precambrian Research 90, 1–28.
Gerrard, I., Smith, G.C., 1983. Post-Paleozoic succession and structure of the southwesternAfrican continental margin. In: Watkins, J.S., Drake, C.L. (Eds.), Studies in ContinentalMargin Geology: AAPG, Memoir, 34, pp. 49–74.
Gilchrist, A.R., Henk, K., Beaumont, C., 1994. Post-Gondwana geomorphic evolution ofsouthwestern Africa: implications for the controls on landscape developmentfrom observations and numerical experiments. Journal of Geophysical Research99, 12211–12228.
Gresse, P.G., 1994. Strain partitioning in the southern Gariep Arc as reflected by sheathfolds and stretching directions. South African Journal of Geology 97, 52–61.
Gresse, P.G., 1995. Transpression and transection in the late Pan-African Vanrhynsdorpforeland thrust-fold belt, South Africa. Journal of African Earth Sciences 21, 91–105.
Gresse, P.G., Fitch, F.J., Miller, J.A., 1988. 40Ar/39Ar dating of the Cambro–OrdovicianVanrhynsdorp tectonite in southern Namaqualand. South African Journal of Geology91, 257–263.
Guiraud, R., 1998. Mesozoic rifting and basin inversion along the northern African-Arabian Tethyan margin: an overview. Hydrocarbon Geology of North Africa:Geol. Soc. London, Spec. Publ., Vol. 132, pp. 217–229.
Guiraud, R., Bosworth, W., 1997. Phanerozoic geodynamic evolution of northeasternAfrica and the northwestern Arabian platform. Tectonophysics 315, 73–108.
Haddon, I.G., McCarthy, T.S., 2005. The Mesozoic–Cenozoic interior sag basins ofCentral Africa: the Late-Cretaceous-Cenozoic Kalahari and Okavango basins.Journal of African Earth Sciences 43, 316–333.
Hancock, P.L., 1985. Brittle microtectonics: principles and practice. Journal of StructuralGeology 7, 437–457.
Hartnady, C.J.H., 2002. Earthquake hazard in Africa: perspectives on the Nubia-Somaliaboundary. South African Journal of Science 98, 425–428.
Haughton, S.H., 1931. On a collection of fossil frogs from the clay at Banke. Transactionsof the Royal Society South Africa 19, 233–249.
Hawkesworth, C., Kelley, S., Turner, S., le Roex, A., Storey, B., 1999. Mantle processesduring Gondwana break-up and dispersal. Journal of African Earth Sciences 28,239–261.
Janssen, M.E., Stephenson, R.A., Cloethingh, S., 1995. Temporal and spatial correlationsbetween changes in plate motions and the evolution of rifted basins in Africa.Geological Society of America Bullettin 107 (11), 1317–1332.
Johnson, M.R., Anheausser, C.R., Thomas, R.J., 2006. The geology of South Africa.Geological Society of South Africa. Johannesburg, Council of Geoscience, Pretoria.691 pp.
Johnston, S.T., 2000. The Cape Fold Belt and Syntaxis and the rotated Falkland Islands:dextral transpressional tectonics along the southwest margin of Gondwana.Journal of African Earth Sciences 31, 51–63.
Jourdan, F., Féraud, G., Bertrand, H., Watkeys, M.K., 2007. From flood basalts to the incep-tion of oceanization: example from the 40Ar/39Ar high resolution picture of theKaroo large igneous province. Geochemistry, Geophysics, Geosystem 8, Q02002.doi:10.1029/2006GC001392.
King, L.C., King, L.A., 1959. A reappraisal of the Natal monocline. South African Geo-graphical Journal 41, 15–30.
Kooi, H., Beaumont, C., 1994. Escarpment evolution on high-elevation rifted margins;insights derived from a surface-processes model that combines diffusion, advec-tion and reaction. Journal of Geophysical Research 99, 12,191–12,209.
Kounov, A., Viola, G., de Wit, M.J., Andreoli, M., 2008. A Mid Cretaceous paleo-KarooRiver valley across the Knersvlakte plain (northwestern coast of South Africa):evidence from apatite fission-track analysis. South African Journal of Geology111, 409–420.
Kounov, A., Viola, G., de Wit, M.J., Andreoli, M., 2009. Tectonic evolution and denudationof the Atlantic passive margin: new insights from apatite fission-track analysis on theWestern coast of South Africa. In: Lisker, F., Ventura, B., Glasmacher, U. (Eds.),Thermochronological Methods: from Paleotemperature Constraints to LandscapeEvolution Models. Geological Society, London. Special Publications.
he western margin of South Africa: More than 500 Myr of continued

22 G. Viola et al. / Tectonophysics xxx (2011) xxx–xxx
Levin, M., 1988. A geohydrological appraisal of the Vaalputs radioactive waste disposalfacility in Namaqualand, South Africa. Ph.D. thesis, University of the Free State,Bloemfontein, South Africa.
Lithgow-Bertelloni, C., Silver, P., 1998. Dynamic topography, plate driving forces andthe African superswell. Nature 395, 269–272.
Mabbutt, J.A., 1955. Pediment land forms in little Namaqualand. South AfricaGeographical Journal 121, 77–83.
Maurin, J.-C., Guiraud, R., 1993. Basement control in the development of the EarlyCretaceous West and Central African Rift System. Tectonophysics 228, 81–95.
McCarthy, T.S., Moon, B.P., Levin, M., 1985. Geomorphology of the western Bushmanlandplateau, Namaqualand, South Africa. South African Geographical Journal 67, 160–178.
McCarthy, T.S., Smith, N.D., Ellery, W.N., Gumbricht, T., 2002. The Okavango Delta-semiarid alluvial-fan sedimentation related to incipient rifting. In: Renaut, S., Ashley,G.M. (Eds.), Sedimentation in Continental Rifts. Society of Economic Palaeontologistsand Mineralogists (SEPM): Special Publication, No. 73, pp. 170–193.
Modisi, M.P., Atekwana, E.A., Kampunzu, A.B., 2000. Rift kinematics during the incipientstages of continental extension: evidence from nascent Okavango rift basin,northwest Botswana. Geology 28, 939–942.
Moore, A.E., 1999. A reappraisal of epeirogenic flexure axes in southern Africa. SouthAfrican Journal of Geology 102, 363–376.
Moore, A.E., Verwoerd, W.J., 1985. The olivine melilitite-kimberlite- carbonatite suiteof Namaqualand and Bushmanland, South Africa. South African Journal of Geology88, 281–294.
Morris, A.P., Ferrill, D.A., Henderson, D.B., 1996. Slip tendency analysis and fault reacti-vation. Geology 24, 275–278.
Munier, R., Talbot, C.J., 1993. Segmentation, fragmentation and jostling of cratonicbasement in and near Äspö, southeast Sweden. Tectonics 12, 713–727.
Nieuwoudt, A.P.C., Rozendaal, A., 1990. In situ stress determinations in mines located intwo major structural domains in South Africa. Static and Dynamic Considerationsin Rock Engineering. Balkema, Rotterdam, pp. 213–222.
Nürnberg, D., Müller, R.D., 1991. The tectonic evolution of the South Atlantic from lateJurassic to present. Tectonophysics 191, 27–53.
Nyblade, A., Robinson, S., 1994. The African superswell. Geophysical Research Letters21, 765–768.
Partidge, T.C., 1998. Of diamonds, dinosaurs and diastrophism: 150 million years oflandscape evolution in southern Africa. South African Journal of Geology 101,167–184.
Partridge, T.C., Maud, R.R., 1987. Geomorphic evolution of southern Africa since theMesozoic. South African Journal of Geology 90, 179–208.
Partridge, T.C., Maud, R.R., 1989. The end-Cretaceous event: new evidence from thesouthern hemisphere. South African Journal Science 85, 428–430.
Partridge, T.C., Maud, R.R., 2000. The Cenozoic of Southern Africa. Oxford UniversityPress, New York, pp. 3–18.
Pether, J., Roberts, D.L., Ward, J.D., 2000. Deposits of the West Coast. In: Partridge, T.C.,Maud, R.R. (Eds.), The Cenozoic of Southern Africa, pp. 33–54.
Petit, J.P., 1987. Criteria for the sense of movement on fault surfaces in brittle rocks.Journal of Structural Geology 9, 597–608.
Phillips, D., Kiviets, G.B., Biddulph, M.G., Madav, M.K., 2000. Cenozoic volcanism. In: Par-tridge, T.C., Maud, R.R. (Eds.), The Cenozoic of Southern Africa. Oxford UniversityPress, pp. 182–197.
Plummer, Ph.S., 1996. The Amirante ridge/trough complex: response to rotationaltransform rift/drift between Seychelles and Madagascar. Terra Nova 8, 34–47.
Raab, M.J., Brown, R.W., Gallagher, K., Carter, A., Weber, K., 2002. Late Cretaceous reac-tivation of major crustal shear zones in northern Namibia: constraints from apatitefission track analysis. Tectonophysics 349, 75–92.
Rabinovich, P.D., LaBrecque, J., 1979. The Mesozoic South Atlantic Ocean and evolutionof its continental margin. Journal of Geophysical Research 84, 5973–6002.
Raillard, S., 1990. Le marges de l'Afrique de l'Est et les zones de fracture associ6es: Chane de Davie et Ride du Mozambique. Campagne MD-60fMACAMO-II. Ph.D. Thesis,Univ. Pierre et Marie Curie, Paris, 272 pp.
Please cite this article as: Viola, G., et al., Brittle tectonic evolution along treactivation, Tectonophysics (2011), doi:10.1016/j.tecto.2011.10.009
Reid, D.L., Rex, D.C., 1994. Cretaceous dikes associated with the opening of the SouthAtlantic: the Mehlberg dike, northern Richtersveld. South African Journal of Geol-ogy 97, 135–145.
Reid, D.L., Ransome, I.G.D., Onstott, T.C., Adams, C.J., 1991. Time of emplacement andmetamorphism of Late Precambrian mafic dykes associated with the Pan-AfricanGariep orogeny, Southern Africa: implications for the age of the Nama Group. Jour-nal of African Earth Science 13, 531–541.
Saintot, A., Stephens, M., Viola, G., Nordgulen, Ø., 2011. Fault slip data and paleostressfield reconstruction of brittle deformation in the south-western FennoscandianShield, Forsmark, Sweden. Tectonics 30, TC4002. doi:10.1029/2010TC002781.
Scheepers, J., Andreoli, M.A.G., 2004. The Seismological record of Vaalputs up to 31stDecember 2003. Necsa Open File Report, GEA-1650, Pretoria. 99 pp.
Schlich, R., 1982. The Indian Ocean: aseismic ridges, spreading centres and basins. In:Nairn, A.E., Stehli, E.G. (Eds.), The Ocean Basins and Margins. : The Indian Ocean,Vol. 6. Plenum.
Scholtz, A., 1985. The palynology of the upper lacustrine sediments of the Arnot pipe,Banke, Namaqualand. Annales of the South African Museum 95, 1–109.
Smith, M.J., WISE, S.M., 2007. Problems of bias in mapping linear landforms from satelliteimagery. International Journal of Applied Earth Observation and Geoinformation 9,65–78. doi:10.1016/j.jag.2006.07.002.
Smith, C.B., Allsopp, H.L., Kramers, J.D., Hutchinson, G., Roderick, J.C., 1985. Emplacementages of Jurassic-Cretaceous South African kimberlites by the Rb–Sr method onphlogopite and whole rock samples. Transactions of the Geological Society of SouthAfrica 88, 249–266.
Tinker, J., de Wit, M., Brown, R., 2008. Mesozoic exhumation of the southern Cape,South Africa, quantified using apatite fission track thermochronology. Tectonophy-sics. doi:10.1016/j.tecto.2007.10.009.
Trumbull, R.B., Reid, D.L., de Beer, C., van Acken, D., Romer, R.L., 2007. Magmatism andcontinental breakup at the west margin of southern Africa: a geochemicalcomparison of dolerite dikes from northwestern Namibia and the Western Cape.South African Journal of Geology 110, 477–502.
Tyson, P.D., Partridge, T.C., 2000. The evolution of Cenozoic climates. In: Partridge, T.C.,Maud, R.R. (Eds.), The Cenozoic of Southern Africa, Oxford University Press: NewYork; 406 pp.
Unrug, R., 1997. Rodinia toGondwana: the geodynamicmapofGondwana Supercontinentassembly. GSA Today 7, 1–6.
Viola, G., Andreoli, M., Ben-Avraham, Z., Stengel, I., Reshef, M., 2005. Offshore mudvolcanoes and onland faulting in southwestern Africa: neotectonic implicationsand constraints on the regional stress field. Earth and Planetary Science Letters231, 147–160.
Viola, G., Venvik Ganerød, G., Wahlgren, C.-H., 2009. Unravelling 1.5 Gyr of brittle de-formation history in the Laxemar-Simpevarp area, SE Sweden: a contribution tothe Swedish site investigation study for the disposal of highly radioactive nuclearwaste. Tectonics 28, TC5007. doi:10.1029/2009TC002461.
Viola, G., Mattila, J., Zwingmann, H., Todd, A., Raven, M., 2011. Structural and K/Ar illitegeochronological constraints on the brittle deformational history of the Olkiluotoregion, SW Finland. Working Report 2011–37. Posiva OY, Finland.
Von Veh, M.W., 1988. The stratigraphy and structural evolution of the Late ProterozoicGariep belt in the Sendelingsdrif - Annisfontein area, northwestern Cape Province.M.Sc. thesis 174p. University Cape Town, South Africa.
von Veh, M.W., 1993. The stratigraphy and structural evolution of the Late ProterozoicGariep Belt in the Sendelingsdrif-Annisfontein area, Northwestern Cape Province.Precambrian Research Unit, University of Cape Town Bulletin, p. 38. 174 p.
Wallace, R.E., 1951. Geometry of shearing stress and relation to faulting. Journal of Ge-ology 59, 118–130.
Waters, D.J., 1989. Metamorphic evidence for the heating and cooling path of Nama-qualand granulites. In: Daly, J.S., Cliff, R.A., Yardley, B.W.D. (Eds.), Evolution ofMetamorphic Belts: London: The Geological Society Special Publication, 43, pp.357–363.
he western margin of South Africa: More than 500 Myr of continued


![Tectonic evolution of the European margin and …...[7], Sava-Vardar zone [5] or Sava zone [1]. Long lasting and complex tectonic and depositional evolution of the suture so far has](https://static.fdocuments.in/doc/165x107/5e90133fb4fc555e894b5540/tectonic-evolution-of-the-european-margin-and-7-sava-vardar-zone-5-or-sava.jpg)