Starbucks (HK) Limited and another (Appellants) v British Sky ...
Upload
avik-naskarCategory
view
220download
0
8/12/2019 British Sky (financial analysis )
http://slidepdf.com/reader/full/british-sky-financial-analysis- 1/20
[Year]
_x0004__x0004_
personal
[Pick the date]
[Type the document title]

8/12/2019 British Sky (financial analysis )
http://slidepdf.com/reader/full/british-sky-financial-analysis- 2/20
2
Table of Contents1. Company Information: .......................................................................................................................... 3
2 Present Situations: ..................................................................................................................................... 5
2.1 Acquisition of O2: ............................................................................................................................ 5
2.2 Share Buyback: ................................................................................................................................ 5
2.3 Financial Results: ............................................................................................................................. 6
2.4 Revenue Growth Model: ................................................................................................................. 6
2.5 Balance Sheet: ................................................................................................................................. 8
2.6 Income Statement Analysis ........................................................................................................... 10
2.7Cash Flow Statement: .................................................................................................................... 12
2.8 Free Cash Flow Models: ................................................................................................................ 13
2.9 Key Performance Metric: .............................................................................................................. 14
3 Recommendation & Conclusion: ............................................................................................................. 15
3.1 Current Valuation .......................................................................................................................... 15
3.2 Technical Charts: ........................................................................................................................... 16
3.3 Conclusion: .................................................................................................................................... 17
4 Appendix .................................................................................................................................................. 18
4.1 Balance sheet estimation factors: ................................................................................................. 18
4.2 Income Statement estimation factors: ......................................................................................... 18
5. References: ............................................................................................................................................. 19
8/12/2019 British Sky (financial analysis )
http://slidepdf.com/reader/full/british-sky-financial-analysis- 3/20
3
1. Company Information:
British Sky group Plc is an integrated play in the media and entertainment space with operations
in the whole of United Kingdom and Ireland. The firm came into existence in 1990 when Sky
Television and British Satellite Broadcasting merged into a single entity. Today the company has
slowly transformed itself into a leader in the space of television and satellite entertainment and
pay services providing its services to more than 10 million homes in Ireland and United
Kingdom.
The firm provides television and broadcasting services through its bouquet of channel namely
Sky Sports, DTH, Sky Player and Sky Mobile TV.
The company has had a pretty significant 2013.From being just an entertainment and broad
casting play the company has beautifully scaled its way as a second largest broadband service
provider only second to British Telecom . The recent strategic acquisition of O2’s telephonic and
broadband services has provided enough room to diversify itself into the internet and broadband
market. Today British Sky group has 4.9 million subscribers in the telephony and broadband
services.
The financial KPIs also see a fresh impetus with ARPUs seeing a steady rise to 577 pounds. This
year the company has seen a rise of 547,000 new household customers and currently holds 40%
of the total share of household in UK.
Sports had continued to be its major earning generator. It has renewed its relationship with 6
major movie studios from Hollywood. The recent surveys showed the emergence of Sky Living
and Sky Atlantic as the top 5 pay TV channel. The emergence of its mobile telephony andspecial download features through Sky Go has become an instant success. The features can be
used to access various value added services in mobiles as the company has aggressively tied up
and forged partnership with various telecom service providers. The users of value added services
are also seeing a rising trend and we expect the company to add a significant tally to its already
3.33 million existing customer base

8/12/2019 British Sky (financial analysis )
http://slidepdf.com/reader/full/british-sky-financial-analysis- 4/20
4
Unique 3 tier business model: The Company has a unique three tier business model that is very
robust and has ability to safeguard the portfolio from all possible strains.
Revenue sources through its various paid entertainment services. The major sources of earning in
this segment come from fees from subscription and advertisements. The company has a portfolioof some of the most popular channels which have high TRP ratings and are good source of
advertisement revenue generator for the company.
They are:
Sky 1: It is the most popular family entertainment channel in UK which airs some of the most
popular shows like Simpsons, Got to Dance and so on.
Sky Living caters to female audience with tailor made shows like soap operas and dramas likeElementary and Hannibal.
Sky Movies is a movie channel which airs Hollywood classics and all newly released movies.
The channel has a tie up with HBO, through which airs many of the shows of HBO.
Sky Sports is the most watched and viewed channel for sports lovers across United Kingdom.
The channel is an official partner of British Premier League and English Cricket and Football
team. This ensures a very high viewership and advertisement revenues for the group.
Revenue sources Retail subscription, data services, value added services and mobile services as
well as broadband services.

8/12/2019 British Sky (financial analysis )
http://slidepdf.com/reader/full/british-sky-financial-analysis- 5/20
5
2 Present Situations:
British Sky group Plc has been a stellar performer over the last few years and has been one of the
handful companies which had not been impacted much from the Subprime crisis of 2008.
2.1 Acquisition of O2:
The company has recently acquired a big chunk of O2’s data services which have dented their
financial position to a considerable extent. But we are very bullish regarding this acquisition.
This enables the group to further diversify its portfolio from being just a provider of regular
entertainment channels to step into the next generation data, telephony services, and broadband
and entertainment business for mobiles, tables and apps.
This will enable the company to add to the already existing 4.9 million subscribers in it
telephony, data and broadband services. The acquisition has been an all cash deal of 200 million
pounds and will definitely add a 5% rise in revenue with effect from 2014. We view this very
strategic move for the company as it opens up a new dimension to the next generation services
that Sky promotes through its flagship Sky Go and Now TV.
2013 has also seen the group investing more into its connected boxes which facilitates further
enhancement to the various value added services it wants to provide to its client.
2.2 Share Buyback:
Recently the group had announced its intent to buy 500 million pound worth of equity which is
another positive for the company. This clearly sends a message that the company is looking to
increase its promoter holding stake and that means management is confident about the upcoming
business environment in the media, entertainment and data communication space. This buys back
of shares Is EPS accretive in the overall Earning per Share calculation. The share buyback is
expected to get completed somewhere in 2014.

8/12/2019 British Sky (financial analysis )
http://slidepdf.com/reader/full/british-sky-financial-analysis- 6/20
6
2.3 Financial Results:
The company has posted a robust financial performance for 2013. The financial KPIs have seen a
fair uptick.
The Average Revenue per Unit has seen a 3% rise in 2013 from the last year and we view this as
a strong show from the company.
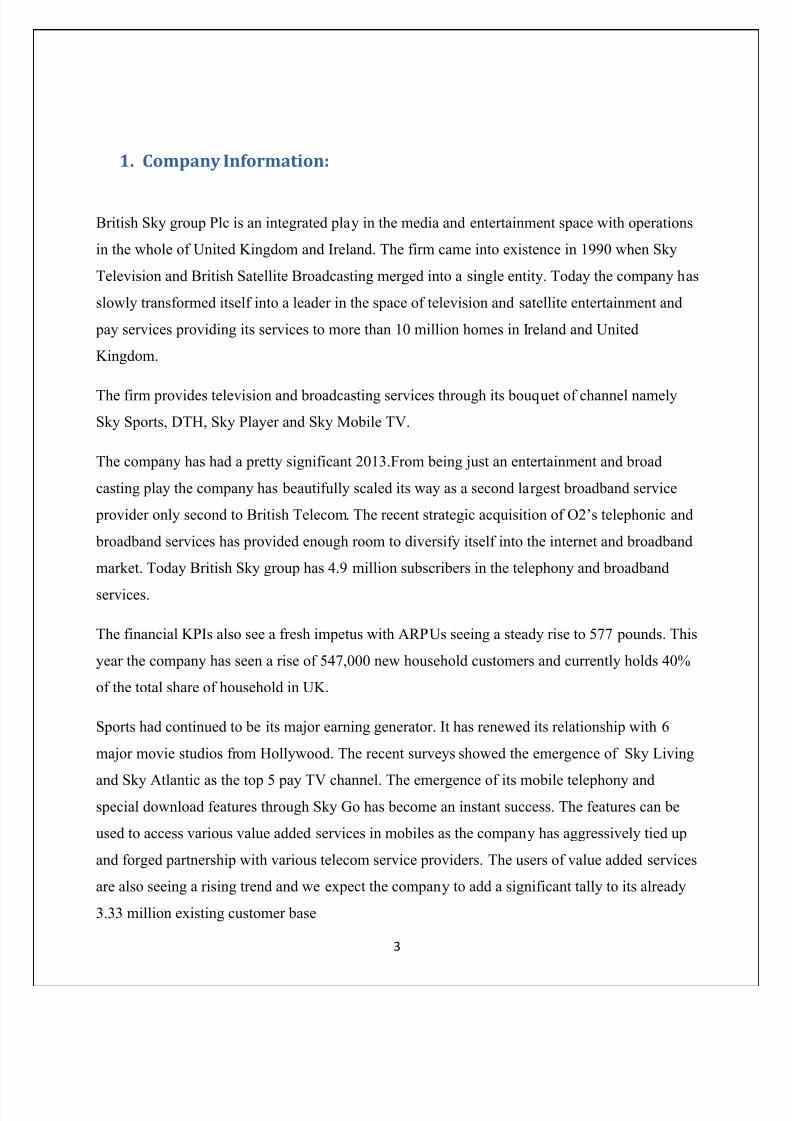
2.4 Revenue Growth Model:
As per our complex valuation metric we have a varied future projection growth for the period
2014 to 2007.
8/12/2019 British Sky (financial analysis )
http://slidepdf.com/reader/full/british-sky-financial-analysis- 7/20

8/12/2019 British Sky (financial analysis )
http://slidepdf.com/reader/full/british-sky-financial-analysis- 8/20
8
2.5 Balance Sheet:
In millions of GBP (except for per share items)
Fiscal data as of Jun 30 2013 2011 2012 2013 2014E 2015E 2016E 2017E
Cash And Short Term
Investments1351.0 1174.0 1410.0 1503.1 1602.3 1708.0 1820.7
Total Receivables, Net 353.0 327.0 282.0 300.6 320.5 341.6 364.1
Total Inventory 375.0 456.0 548.0 584.2 622.7 663.8 707.6Prepaid expenses 239.0 294.0 309.0 329.4 351.1 374.3 399.0
Other current assets, total 11.0 24.0 20.0 21.3 22.7 24.2 25.8
Total current assets 2329.0 2275.0 2569.0 2738.6 2919.3 3112.0 3317.4
Property, plant & equipment,
net896.0 948.0 1041.0 1109.7 1182.9 1261.0 1344.2
Goodwill, net 944.0 956.0 999.0 1064.9 1135.2 1210.1 1290.0
Intangibles, net 462.0 523.0 718.0 765.4 815.9 869.8 927.2Long term investments 366.0 384.0 603.0 642.8 685.2 730.4 778.7
Note receivable - long term 0.0 0.0 0.0 0.0 0.0 0.0 0.0
Other long term assets 288.0 407.0 377.0 401.9 428.4 456.7 486.8
Total assets 5354.0 5509.0 6345.0 6723.3 7167.0 7640.0 8144.3
LIABILITIES 0.0 0.0 0.0 0.0
Accounts payable 503.0 729.0 823.0 877.3 935.2 996.9 1062.7
Accrued expenses 799.0 760.0 828.0 882.6 940.9 1003.0 1069.2
Notes payable/short-term
debt0.0 0.0 0.0 0.0 0.0 0.0 0.0
Current portion long-term
debt/capital leases8.0 8.0 11.0 11.7 12.5 13.3 14.2

8/12/2019 British Sky (financial analysis )
http://slidepdf.com/reader/full/british-sky-financial-analysis- 9/20
9
(The explanations of our assumptions are pasted below in the appendix)
Other current liabilities, total 602.0 601.0 655.0 698.2 744.3 793.4 845.8
Total current liabilities 1912.0 2098.0 2317.0 2469.9 2632.9 2806.7 2992.0
Total long term debt 2325.0 2398.0 2909.0 3101.0 3305.7 3523.8 3756.4
Total debt 2333.0 2406.0 2920.0 3112.7 3318.2 3537.2 3770.6
Deferred income tax 0.0 1.0 1.0 1.0 1.0 1.0 1.0
Minority interest -- -- --
Other liabilities, total 82.0 68.0 106.0 113.0 120.5 128.4 136.9
Total liabilities 4319.0 4565.0 5333.0 5684.9 6060.1 6459.9 6886.2
SHAREHOLDERS
EQUITY0.0
Common stock 876.0 837.0 797.0 797.0 797.0 797.0 797.0
Additional paid-in capital 1437.0 1437.0 1437.0 1437.0 1437.0 1437.0 1437.0
Retained earnings
(accumulated deficit)-1185.0 -1286.0 -1086.0 -1157.7
-
1234.1
-
1315.5
-
1315.5
Treasury stock - common -- -- --
Unrealized gain (loss) -- -- --
Other equity, total 14.0 68.0 11.0 11.0 11.0 11.0 11.0
Total equity 1035.0 944.0 1012.0 1038.4 1106.9 1180.1 1258.0
Total liabilities &shareholders' equity
5354.0 5509.0 6345.0 6723.3 7167.0 7167.0 7167.0
Total common shares
outstanding1753.0 1674.0 1594.0 1699.2 1699.2 1699.2 1699.2
Treasury shares - common
primary issue-- 0.0 0.0 0.0 0.0 0.0

8/12/2019 British Sky (financial analysis )
http://slidepdf.com/reader/full/british-sky-financial-analysis- 10/20
10
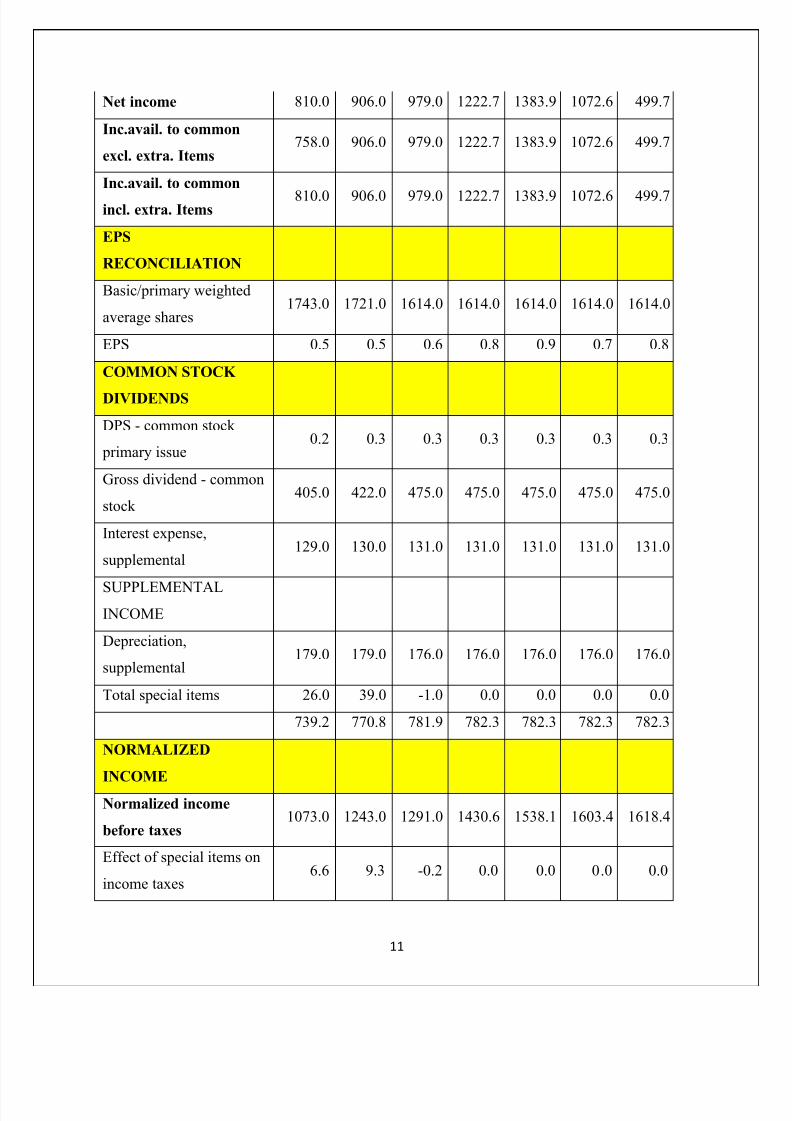
2.6 Income Statement Analysis
Fiscal data as of Jun 30
2013 2011 2012 2013 2014 2015 2016 2017
REVENUE AND
GROSS PROFIT
Total revenue 6597.0 6791.0 7235.0 8017.1 8620.0 8985.5 9069.9
OPERATING
EXPENSES
Cost of revenue total 3167.0 3369.0 3578.0 3964.8 4262.9 4443.7 4485.5
Selling, general and
admin. expenses, total2331.0 2137.0 2366.0 2621.8 2818.9 2938.4 2966.1
Depreciation/amortization -- -- -- 0.0 0.0 0.0
Unusual expense(income) 26.0 42.0 -- 0.0 0.0 0.0
Other operating expenses,
total-- -- -- 0.0 0.0 0.0
Total operating expense 5524.0 5548.0 5944.0 6586.5 7081.9 7382.1 7451.5Operating income 1073.0 1243.0 1291.0 1430.6 1538.1 1603.4 1618.4
Other, net -- -- --
INCOME TAXES,
MINORITY INTEREST
AND EXTRA ITEMS
Net income before taxes 1014.0 1189.0 1257.0 1287.5 1384.3 1443.0 1456.6
Provision for income
taxes256.0 283.0 278.0 290.0 295.0 278.0 240.0
Net income after taxes 758.0 906.0 979.0 997.5 1089.3 1165.0 1216.6
Minority interest -- -- --
Total extraordinary items 52.0 0.0 --
8/12/2019 British Sky (financial analysis )
http://slidepdf.com/reader/full/british-sky-financial-analysis- 11/20
11
Net income 810.0 906.0 979.0 1222.7 1383.9 1072.6 499.7
Inc.avail. to common
excl. extra. Items758.0 906.0 979.0 1222.7 1383.9 1072.6 499.7
Inc.avail. to common
incl. extra. Items 810.0 906.0 979.0 1222.7 1383.9 1072.6 499.7
EPS
RECONCILIATION
Basic/primary weighted
average shares1743.0 1721.0 1614.0 1614.0 1614.0 1614.0 1614.0
EPS 0.5 0.5 0.6 0.8 0.9 0.7 0.8
COMMON STOCK
DIVIDENDS
DPS - common stock
primary issue0.2 0.3 0.3 0.3 0.3 0.3 0.3
Gross dividend - common
stock405.0 422.0 475.0 475.0 475.0 475.0 475.0
Interest expense,
supplemental129.0 130.0 131.0 131.0 131.0 131.0 131.0
SUPPLEMENTALINCOME
Depreciation,
supplemental179.0 179.0 176.0 176.0 176.0 176.0 176.0
Total special items 26.0 39.0 -1.0 0.0 0.0 0.0 0.0
739.2 770.8 781.9 782.3 782.3 782.3 782.3
NORMALIZED
INCOME
Normalized income
before taxes1073.0 1243.0 1291.0 1430.6 1538.1 1603.4 1618.4
Effect of special items on
income taxes6.6 9.3 -0.2 0.0 0.0 0.0 0.0

8/12/2019 British Sky (financial analysis )
http://slidepdf.com/reader/full/british-sky-financial-analysis- 12/20
12
Income tax excluding
impact of special items263.0 292.0 278.0 290.0 295.0 278.0 240.0
Normalized income after
tax777.0 936.0 978.0 1140.6 1243.1 1325.4 1378.4
PAT 777.0 936.0 978.0 1140.6 1243.1 1325.4 1378.4
Basic normalized EPS 0.4 0.5 0.6 0.7 0.8 0.8 0.9
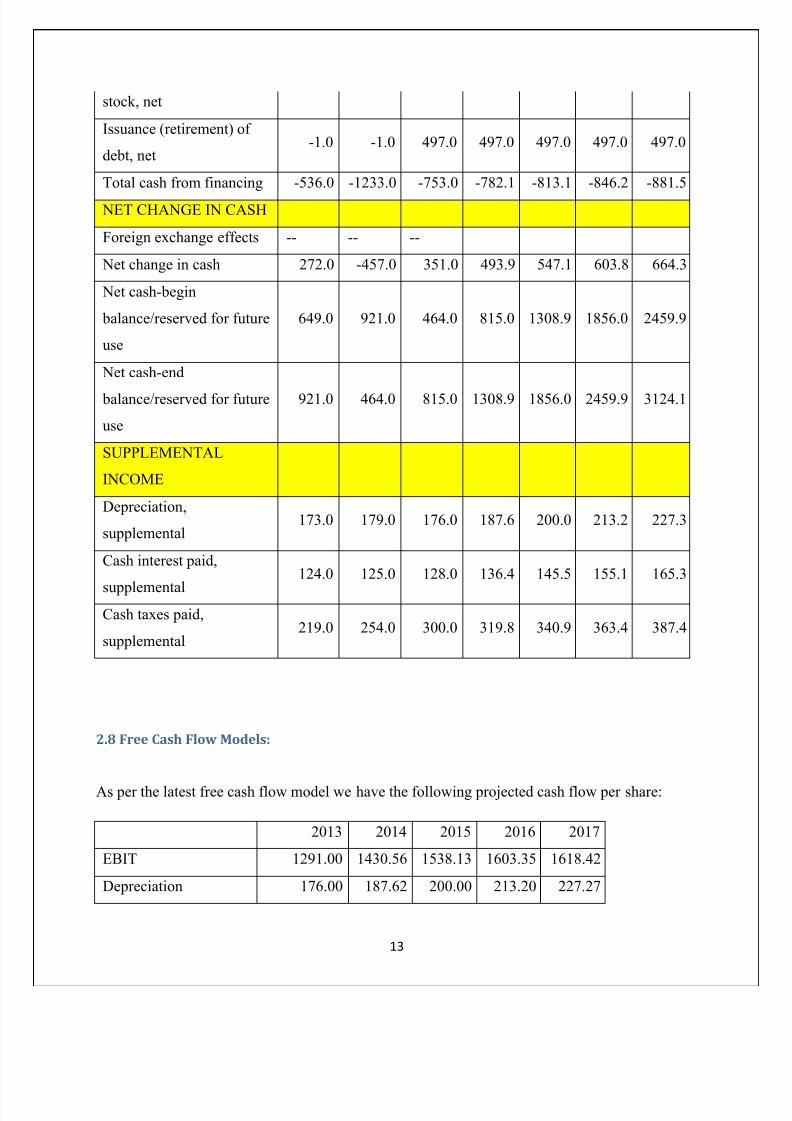
2.7Cash Flow Statement:
OPERATIONS 2011 2012 2013 2014E 2015 2016 2017 Net income 1014.0 1189.0 1257.0 1340.0 1428.4 1522.7 1623.2
Depreciation/depletion 173.0 179.0 176.0 187.6 200.0 213.2 227.3
Non-Cash items 197.0 120.0 114.0 121.5 129.5 138.1 147.2
Cash taxes paid,
supplemental219.0 254.0 300.0 319.8 340.9 363.4 387.4
Cash interest paid,
supplemental124.0 125.0 128.0 136.4 145.5 155.1 165.3
Changes in working
capital-117.0 -153.0 -143.0 -152.4 -162.5 -173.2 -184.7
Total cash from operations 1426.0 1500.0 1606.0 1712.0 1825.0 1945.4 2073.8
INVESTING
Capital expenditures -423.0 -457.0 -454.0 -484.0 -515.9 -550.0 -586.3
Other investing and cash
flow items, total-195.0 -267.0 -48.0 48.0 51.2 54.5 58.1
Total cash from investing -618.0 -724.0 -502.0 -436.0 -464.7 -495.4 -528.1
FINANCING
Financing cash flow items -124.0 -125.0 -128.0 -128.0 -128.0 -128.0 -128.0
Total cash dividends paid -353.0 -410.0 -441.0 -470.1 -501.1 -534.2 -569.5
Issuance (retirement) of -58.0 -697.0 -681.0 -681.0 -681.0 -681.0 -681.0
8/12/2019 British Sky (financial analysis )
http://slidepdf.com/reader/full/british-sky-financial-analysis- 13/20
13
stock, net
Issuance (retirement) of
debt, net-1.0 -1.0 497.0 497.0 497.0 497.0 497.0
Total cash from financing -536.0 -1233.0 -753.0 -782.1 -813.1 -846.2 -881.5
NET CHANGE IN CASH
Foreign exchange effects -- -- --
Net change in cash 272.0 -457.0 351.0 493.9 547.1 603.8 664.3
Net cash-begin
balance/reserved for future
use
649.0 921.0 464.0 815.0 1308.9 1856.0 2459.9
Net cash-end
balance/reserved for future
use
921.0 464.0 815.0 1308.9 1856.0 2459.9 3124.1
SUPPLEMENTAL
INCOME
Depreciation,
supplemental173.0 179.0 176.0 187.6 200.0 213.2 227.3
Cash interest paid,
supplemental124.0 125.0 128.0 136.4 145.5 155.1 165.3
Cash taxes paid,
supplemental219.0 254.0 300.0 319.8 340.9 363.4 387.4
2.8 Free Cash Flow Models:
As per the latest free cash flow model we have the following projected cash flow per share:
2013 2014 2015 2016 2017
EBIT 1291.00 1430.56 1538.13 1603.35 1618.42
Depreciation 176.00 187.62 200.00 213.20 227.27

8/12/2019 British Sky (financial analysis )
http://slidepdf.com/reader/full/british-sky-financial-analysis- 14/20
14
Cap Ex -454.00 -483.96 -515.91 -549.96 -586.25
Current Asset 2569.00 3148.21 3237.23 3282.60 3276.44
Current Liability 2317.00 2469.92 2632.94 2806.71 2991.95
WC 252.00 678.29 604.29 475.88 284.49
FCFE 373.70 26.75 156.50 309.71 489.43
Equity base 1614.00 1614.00 1614.00 1614.00 1614.00
Free Cash flow per
share 0.23 0.02 0.10 0.19 0.30
2.9 Key Performance Metric:
2013 2014 2015 2016 2017
Company Book Value 1012.00 1038.35 1106.95 1180.07 1258.02
EBIDTA 1291.00 1430.56 1538.13 1603.35 1618.42
Sales 7235.00 8017.10 8619.99 8985.48 9069.94
BV/EBITA 0.78 0.73 0.72 0.74 0.78
BV/SALES 0.14 0.13 0.13 0.13 0.14

8/12/2019 British Sky (financial analysis )
http://slidepdf.com/reader/full/british-sky-financial-analysis- 15/20
15
3 Recommendation & Conclusion:
From all the financials above we see the company has a few things going for it:
A) Diversification of business into data services, broadband and telephony
B) No major capital expenditure plans in the next few years.
C) The company has a steady operating model and its core business area is fairly secured in
terms of consistent realizations.
D) 2014 is going to be a bumper year for Sky Sports as lot of big time sporting activities like
World Cup are lined up. This will definitely lead to a 15% upside in advertisement
revenue which will translate into a 3% uptick in revenue.
So if we extend the idea forward we can say that the EPS estimate of 80 for 2014 will jump to
104 in 2014. (We have not added this into our estimated projection model).
3.1 Current Valuation
Currently the stock trades at 940 Pounds which is nearly 12 time trailing FY 14 earnings
estimates and 10 times FY 15 estimates.
So in terms of valuation the stock is neither cheap nor too expensive.
Historically the stock trades at 13 times, 1 year forward earning. So going by that consensus the
stock has an upside potential of 1170.
8/12/2019 British Sky (financial analysis )
http://slidepdf.com/reader/full/british-sky-financial-analysis- 16/20
16
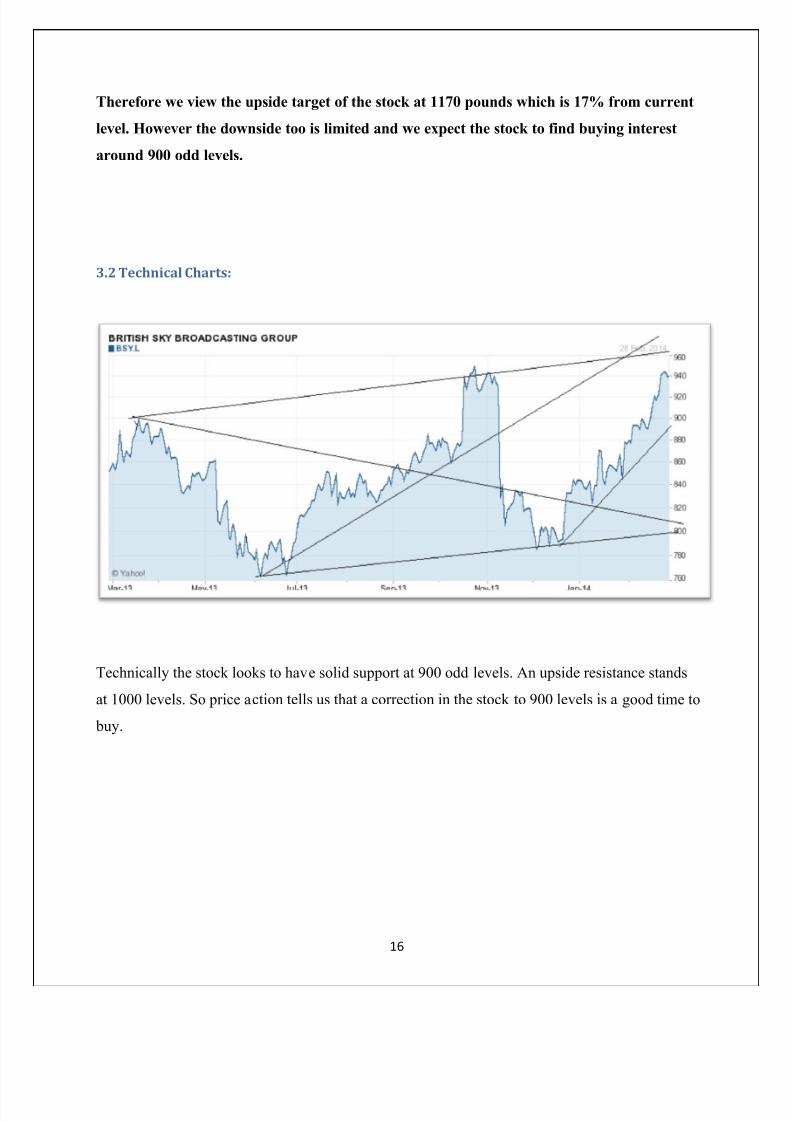
Therefore we view the upside target of the stock at 1170 pounds which is 17% from current
level. However the downside too is limited and we expect the stock to find buying interest
around 900 odd levels.
3.2 Technical Charts:
Technically the stock looks to have solid support at 900 odd levels. An upside resistance stands
at 1000 levels. So price action tells us that a correction in the stock to 900 levels is a good time to
buy.

8/12/2019 British Sky (financial analysis )
http://slidepdf.com/reader/full/british-sky-financial-analysis- 17/20

8/12/2019 British Sky (financial analysis )
http://slidepdf.com/reader/full/british-sky-financial-analysis- 18/20
18
4 Appendix
Financials.xlsx
4.1 Balance sheet estimation factors:
While preparing the balance sheet for future years we have made few assumptions:
We have considered the fact that most of the capital expansion for the company is done in 2013
and we expect the company to consolidate its position going forward.
Applying our future projection model which is in sheet 2 we have obtained the yearly growth
rate for the company by applying the geometric mean method. We are taking the yearly growth
rate at 6.6%
Applying linear growth model we see the projections coming out on the higher side so we reject
it and take a standard growth of 6.6%.
4.2 Income Statement estimation factors:
The growth model applied for income statement goes like this: We have taken the growth for
each year based on a logarithmic equation from our calculation sheet.
We have taken the growth for 2014, 2015, 2016 and 2017 as 10.81%, 7.52%, 4.24%, and 0.94%

8/12/2019 British Sky (financial analysis )
http://slidepdf.com/reader/full/british-sky-financial-analysis- 19/20

8/12/2019 British Sky (financial analysis )
http://slidepdf.com/reader/full/british-sky-financial-analysis- 20/20
20