British Election Study - 2005 Harold Clarke, David Sanders, Marianne Stewart, Paul Whiteley.
23
British Election Study - 2005 Harold Clarke, David Sanders, Marianne Stewart, Paul Whiteley
-
Upload
joseph-collins -
Category
Documents
-
view
217 -
download
2
Transcript of British Election Study - 2005 Harold Clarke, David Sanders, Marianne Stewart, Paul Whiteley.

British Election Study - 2005Harold Clarke, David Sanders, Marianne Stewart, Paul Whiteley
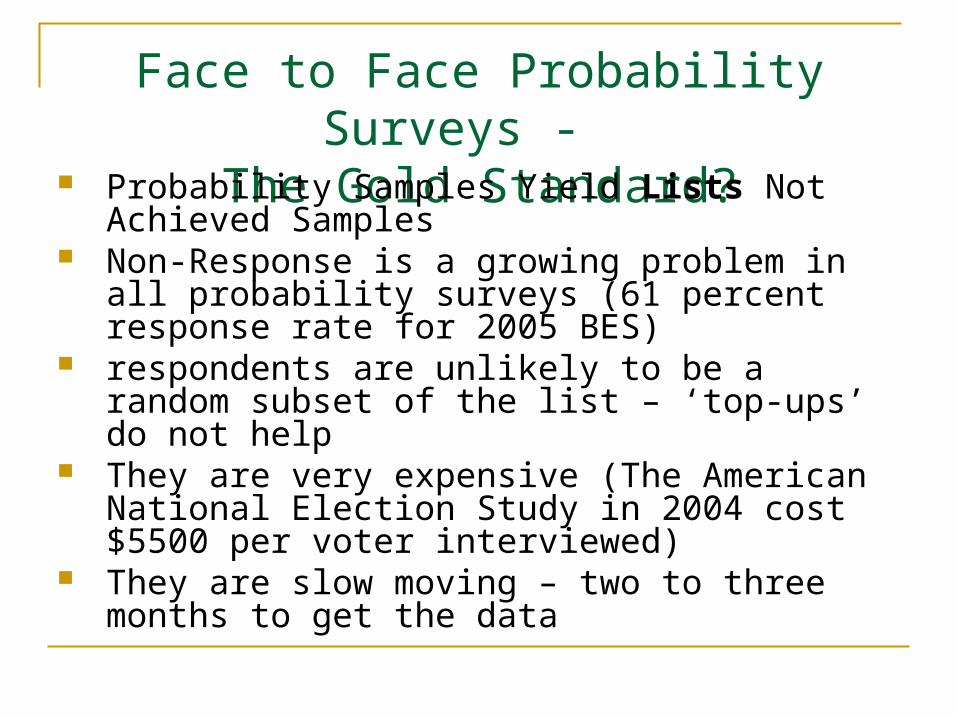
Face to Face Probability Surveys -
The Gold Standard? Probability Samples Yield Lists Not Achieved Samples
Non-Response is a growing problem in all probability surveys (61 percent response rate for 2005 BES)
respondents are unlikely to be a random subset of the list – ‘top-ups’ do not help
They are very expensive (The American National Election Study in 2004 cost $5500 per voter interviewed)
They are slow moving – two to three months to get the data
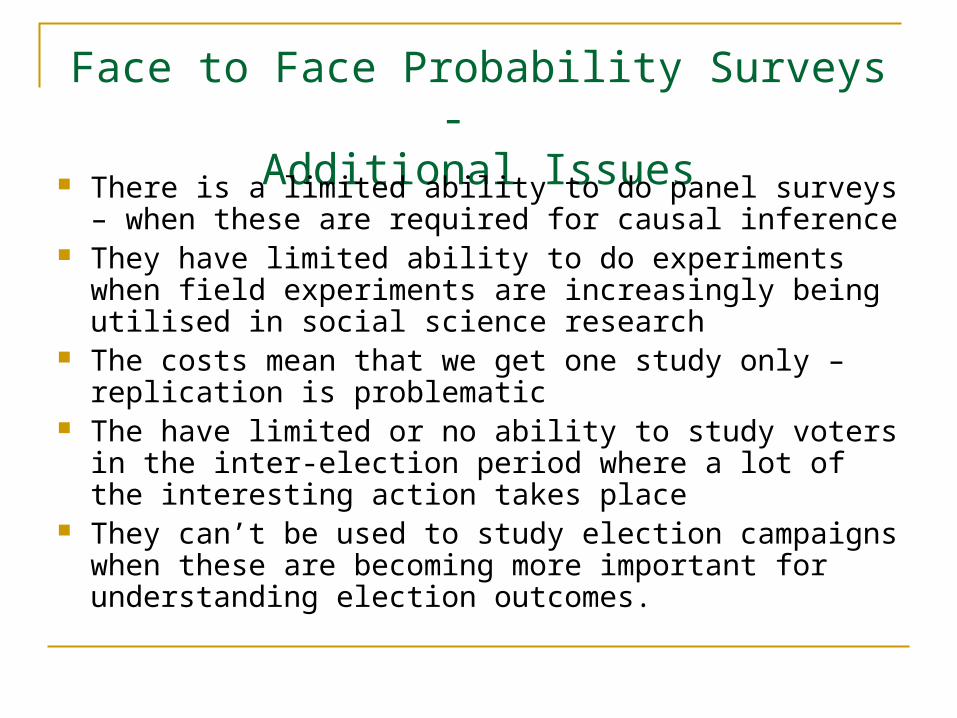
Face to Face Probability Surveys - Additional Issues
There is a limited ability to do panel surveys – when these are required for causal inference
They have limited ability to do experiments when field experiments are increasingly being utilised in social science research
The costs mean that we get one study only – replication is problematic
The have limited or no ability to study voters in the inter-election period where a lot of the interesting action takes place
They can’t be used to study election campaigns when these are becoming more important for understanding election outcomes.
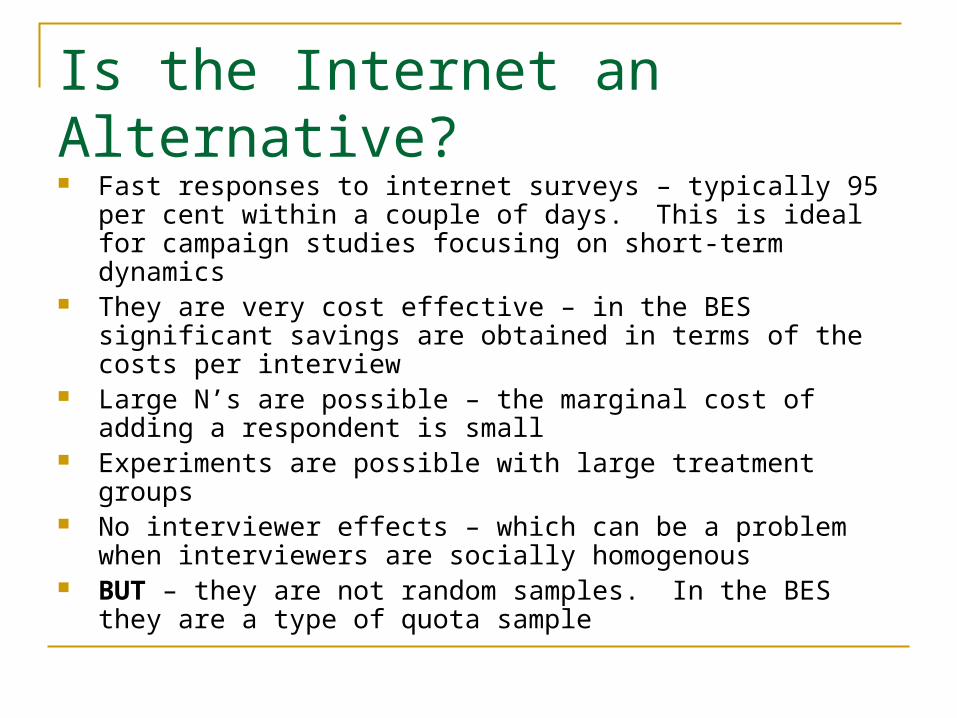
Is the Internet an Alternative? Fast responses to internet surveys – typically 95 per
cent within a couple of days. This is ideal for campaign studies focusing on short-term dynamics
They are very cost effective – in the BES significant savings are obtained in terms of the costs per interview
Large N’s are possible – the marginal cost of adding a respondent is small
Experiments are possible with large treatment groups No interviewer effects – which can be a problem when
interviewers are socially homogenous BUT – they are not random samples. In the BES they
are a type of quota sample
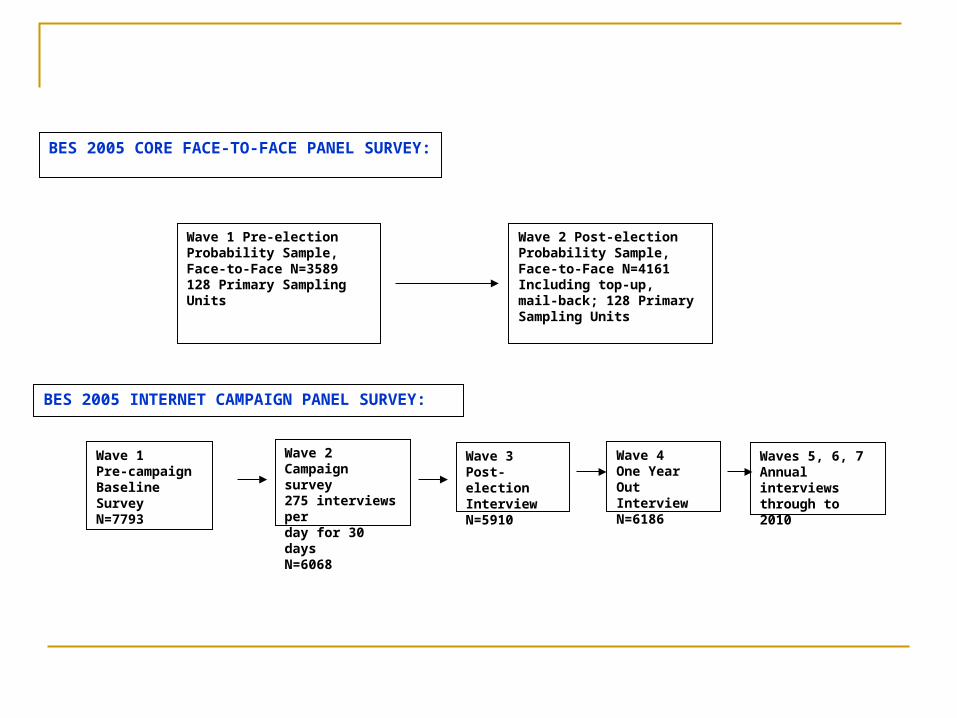
BES 2005 CORE FACE-TO-FACE PANEL SURVEY:
Wave 1 Pre-electionProbability Sample,Face-to-Face N=3589128 Primary Sampling Units
Wave 2 Post-electionProbability Sample,Face-to-Face N=4161Including top-up, mail-back; 128 Primary Sampling Units
Wave 1 Pre-campaignBaseline SurveyN=7793
BES 2005 INTERNET CAMPAIGN PANEL SURVEY:
Wave 2Campaign survey275 interviews perday for 30 daysN=6068
Wave 3Post-electionInterviewN=5910
Wave 4One Year OutInterviewN=6186
Waves 5, 6, 7Annual interviews through to 2010
Comparisons of Survey Modes Election Studies are unique in allowing us to
compare survey data with actual votes. Two objective measures are highly visible –
turnout and vote choice If we compare in-person probability surveys
with internet surveys what do we see?
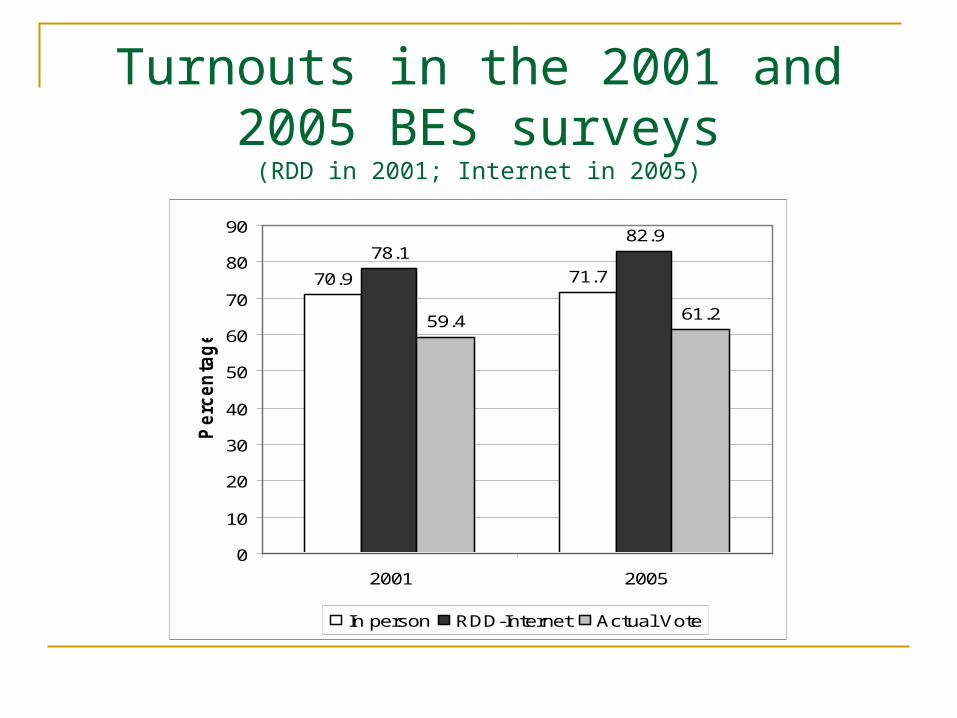
Turnouts in the 2001 and 2005 BES surveys
(RDD in 2001; Internet in 2005)
70.9 71.7
78.182.9
59.4 61.2
0
10
20
30
40
50
60
70
80
90
2001 2005
Perc
en
tag
es
In person RDD-Internet Actual Vote
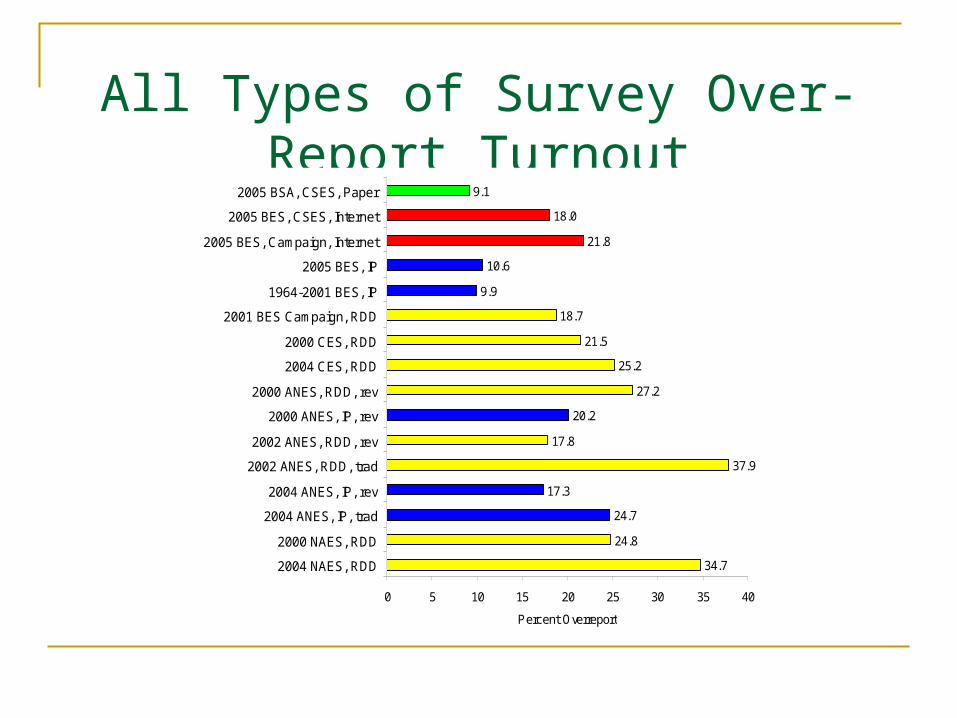
All Types of Survey Over-Report Turnout
34.7
24.8
24.7
17.3
37.9
17.8
20.2
27.2
25.2
21.5
18.7
9.9
10.6
21.8
18.0
9.1
0 5 10 15 20 25 30 35 40
2004 NAES, RDD
2000 NAES, RDD
2004 ANES, IP, trad
2004 ANES, IP, rev
2002 ANES, RDD, trad
2002 ANES, RDD, rev
2000 ANES, IP, rev
2000 ANES, RDD, rev
2004 CES, RDD
2000 CES, RDD
2001 BES Campaign, RDD
1964-2001 BES, IP
2005 BES, IP
2005 BES, Campaign, Internet
2005 BES, CSES, Internet
2005 BSA, CSES, Paper
Percent Overreport
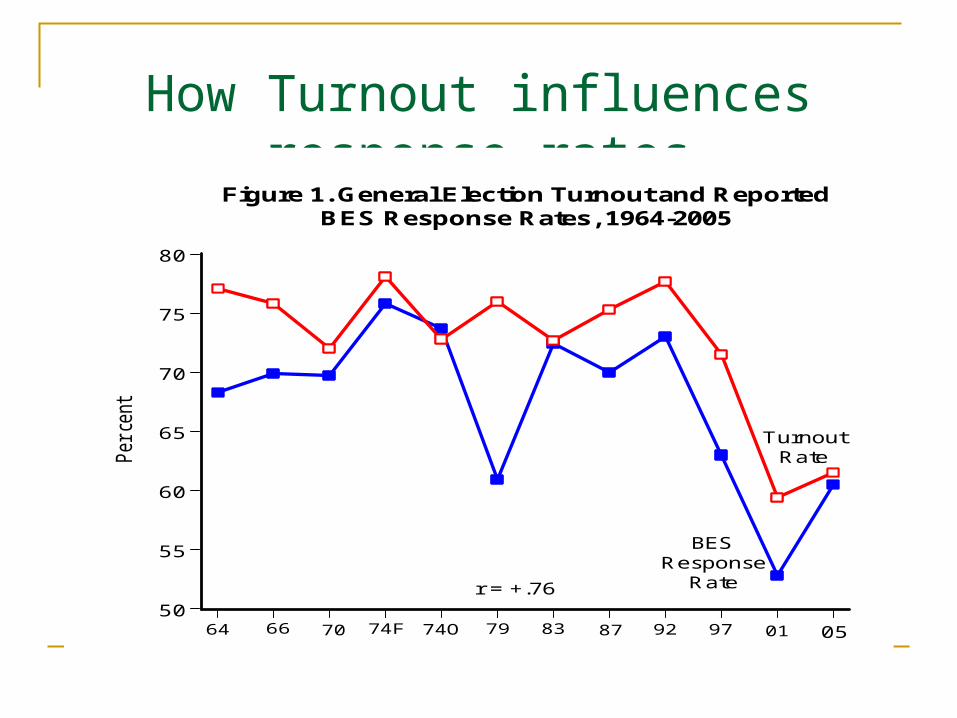
How Turnout influences response rates
50
55
60
65
70
75
80
TurnoutRate
BESResponse
Rate
Per ce
nt
Figure 1. General Election Turnout and ReportedBES Response Rates, 1964-2005
64 66 70 74F 74O 79 83 87 92 97 01
r = +.76
05
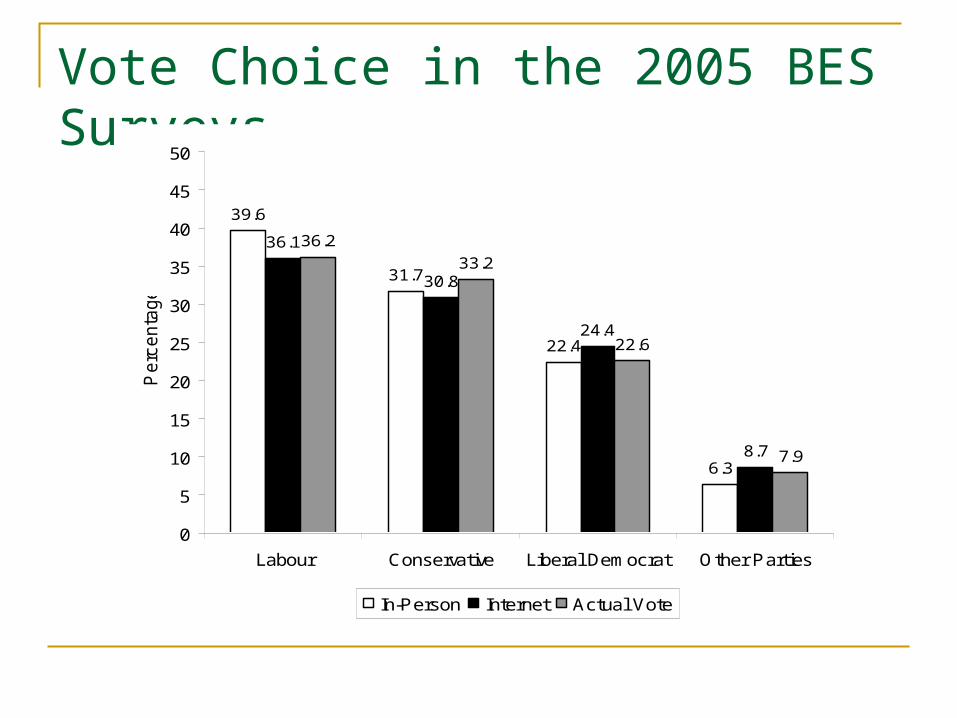
Vote Choice in the 2005 BES Surveys
39.6
31.7
22.4
6.3
36.1
30.8
24.4
8.7
36.2
33.2
22.6
7.9
0
5
10
15
20
25
30
35
40
45
50
Labour Conservative Liberal Democrat Other Parties
Perc
enta
ge
In-Person Internet Actual Vote
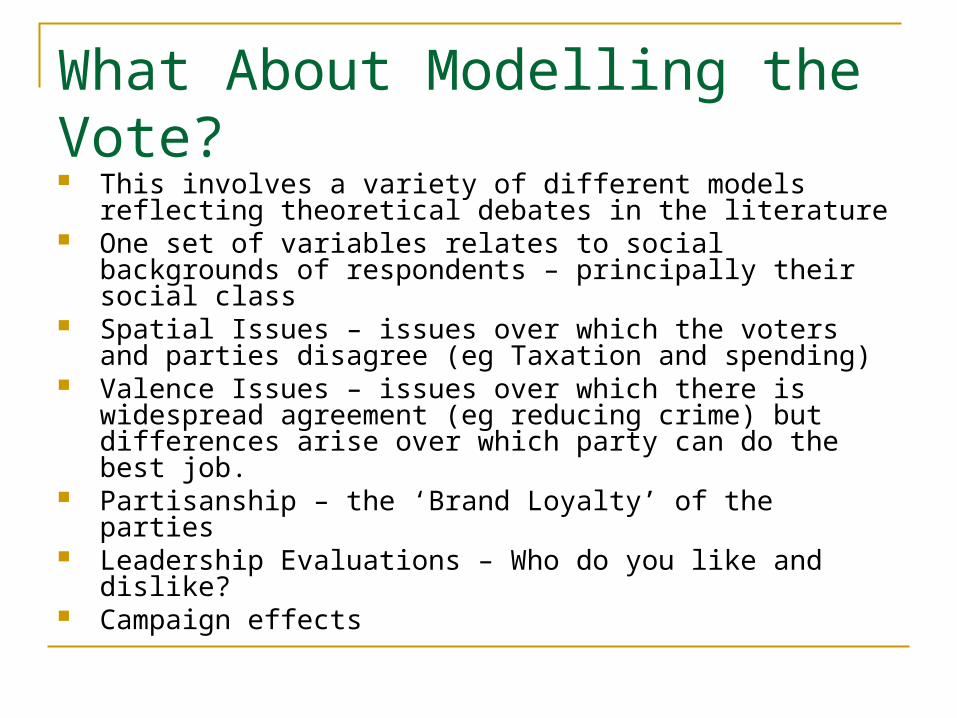
What About Modelling the Vote? This involves a variety of different models reflecting
theoretical debates in the literature One set of variables relates to social backgrounds of
respondents – principally their social class Spatial Issues – issues over which the voters and
parties disagree (eg Taxation and spending) Valence Issues – issues over which there is widespread
agreement (eg reducing crime) but differences arise over which party can do the best job.
Partisanship – the ‘Brand Loyalty’ of the parties Leadership Evaluations – Who do you like and dislike? Campaign effects
Logistic Regressions Panel A Panel B Liberal OtherPredictor Variables Labour Conservative Democrat PartyAge -.01** .02** .01* .02*Ethnicity -.97*** .43 1.02** 2.89**Gender -.26 -.18 .27 .77**Social Class -.38* .85*** .25 .06Party Identification: Conservative -1.09*** 1.56*** .14 .52 Labour .91*** -1.72*** -.88*** -.33 Liberal Democrat -1.51*** .25 1.69*** .89* Other Party -.98** .51 .40 2.77***Party Leader Affect: Blair .41*** -.50*** -.41*** -.38*** Howard -.13*** .58*** -.00 .14* Kennedy -.31*** .04 .49*** -.01Party Best on Most Important Issue: Conservative -.91*** 1.42*** .08 .79* Labour .80*** -.84** -.72*** -.80* Liberal Democrat -.66* -1.21* .84** -.89 Other Party -.10 -.84 -.32 1.00*Party-Issue Proximities: Conservative -.09*** .20*** .07** .15*** Labour .15*** -.14*** -.12*** -.19*** Liberal Democrat -.12** -.03 .17*** .10 Economic Evaluations .09 -.55*** -.05 .17Party Best on Economy .94*** -1.28*** -.67*** -.42 Iraq Evaluations .02 .05 -.06 -.09Emotional Reactions: Economy -.04 .15 .08 -.16 Iraq -.06 .22* .05 .09 NHS .13* -.24** -.07 -.30**Tactical Voting -.34x -.13 .43* .50 Constant 2.53* -2.95 -4.80*** -5.73**McFadden R2 = .59 .60McKelvey R2 = .78 --- % Correctly Classified = 87.5 81.6 Lambda = .68 .70
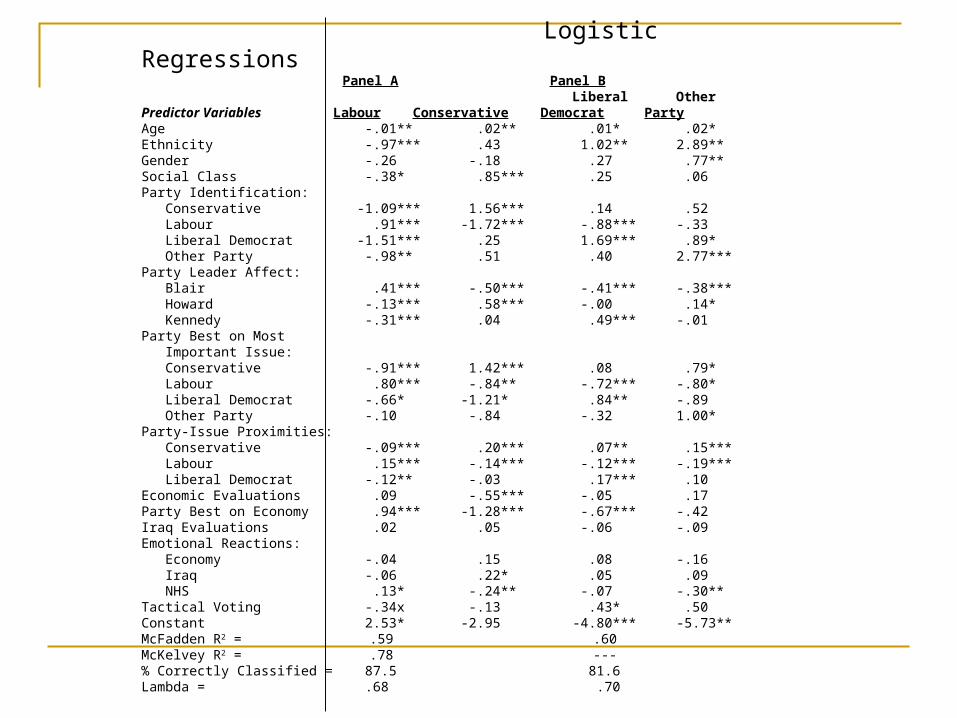
Factors Affecting the Probability of Voting Labour in the 2005 Election
Blair .67
Howard -.22
Kennedy -.54
NHS Emotions .18
Labour Best Economy .16
Labour Id .21
Conservative Id -.16
Lib Dem Id -.20
Other Party Id -.15
Age -.20
Gender -.04
Social Class -.07
Ethnicity -.20
Labour Issue Proxmity .39
Conservative Issue Proximity -.54
Lib Dem Issue Proximity -.45
Labour Best Most Impt Issue .17
Conservatives Best Most Impt Issue -.12
Lib Dems Best Most Impt Issue -.09
Tactical Voting -.06
-1 -0.8 -0.6 -0.4 -0.2 0 0.2 0.4 0.6 0.8 1
Change in Probability Voting Labour
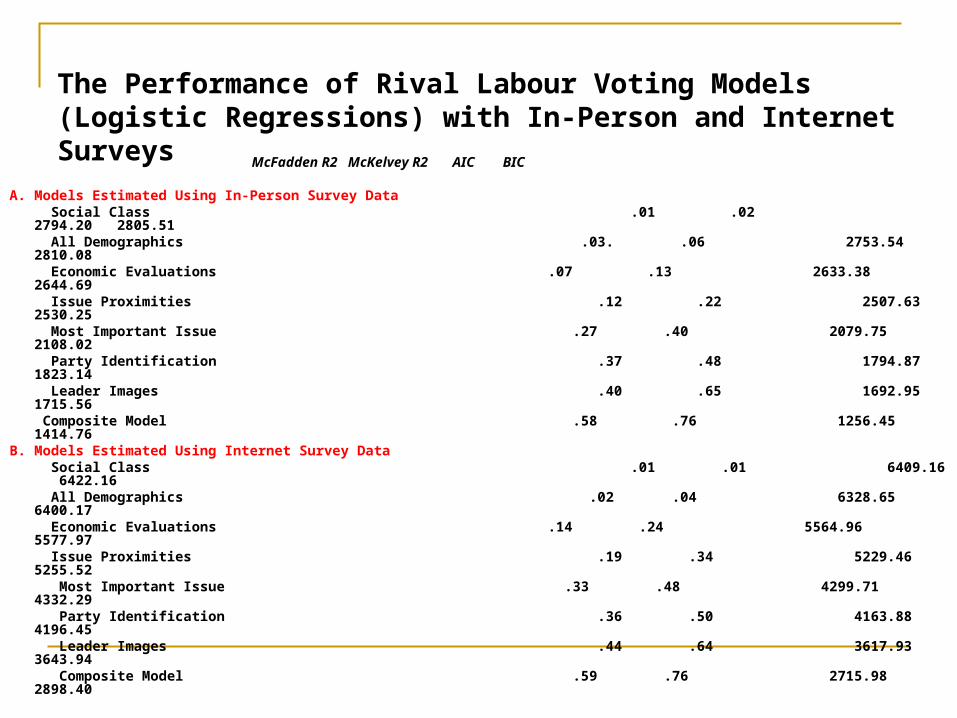
The Performance of Rival Labour Voting Models (Logistic Regressions) with In-Person and Internet Surveys
McFadden R2 McKelvey R2 AIC BIC
A. Models Estimated Using In-Person Survey Data Social Class .01 .02 2794.20 2805.51 All Demographics .03. .06 2753.54 2810.08 Economic Evaluations .07 .13 2633.38 2644.69 Issue Proximities .12 .22 2507.63 2530.25 Most Important Issue .27 .40 2079.75 2108.02 Party Identification .37 .48 1794.87 1823.14 Leader Images .40 .65 1692.95 1715.56 Composite Model .58 .76 1256.45 1414.76B. Models Estimated Using Internet Survey Data Social Class .01 .01 6409.16 6422.16 All Demographics .02 .04 6328.65 6400.17 Economic Evaluations .14 .24 5564.96 5577.97 Issue Proximities .19 .34 5229.46 5255.52 Most Important Issue .33 .48 4299.71 4332.29 Party Identification .36 .50 4163.88 4196.45 Leader Images .44 .64 3617.93 3643.94 Composite Model .59 .76 2715.98 2898.40
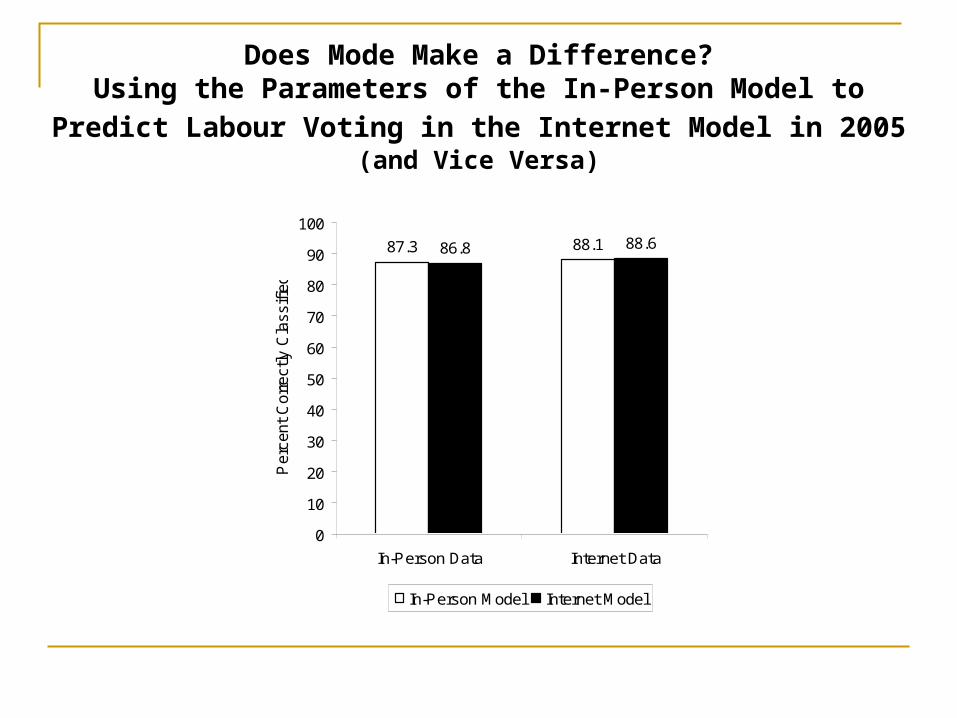
Does Mode Make a Difference?Using the Parameters of the In-Person Model to Predict Labour Voting in the Internet Model in 2005 (and Vice
Versa)
87.3 88.186.8 88.6
0
10
20
30
40
50
60
70
80
90
100
In-Person Data Internet Data
Per
cent
Cor
rect
ly C
lass
ified
In-Person Model Internet Model
Conclusions
There are differences in frequency distributions of variables measured with in-person and internet surveys
Sometimes the in-person version is more accurate (eg turnout) sometimes not (eg Labour vote choice)
The coefficients of models of turnout and party choice are indistinguishable from each other when models are estimated with in-person and internet surveys
Internet Experiment – ‘Feedback to Respondents’
Key Issue – Are Voter Preferences Exogenous?
If they are then survey respondents should not change their preferences simply because others differ eg. Parties and leaders
If they are not then voters are likely to change their preferences if they discover that others differ
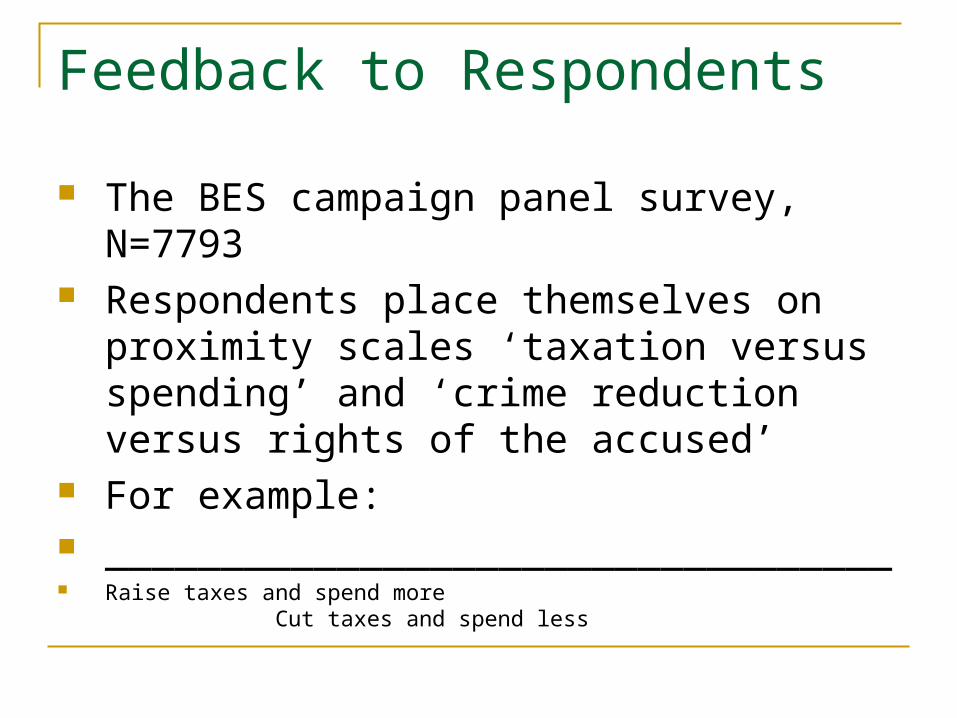
Feedback to Respondents
The BES campaign panel survey, N=7793 Respondents place themselves on proximity
scales ‘taxation versus spending’ and ‘crime reduction versus rights of the accused’
For example: __________________________________ Raise taxes and spend more Cut taxes and
spend less
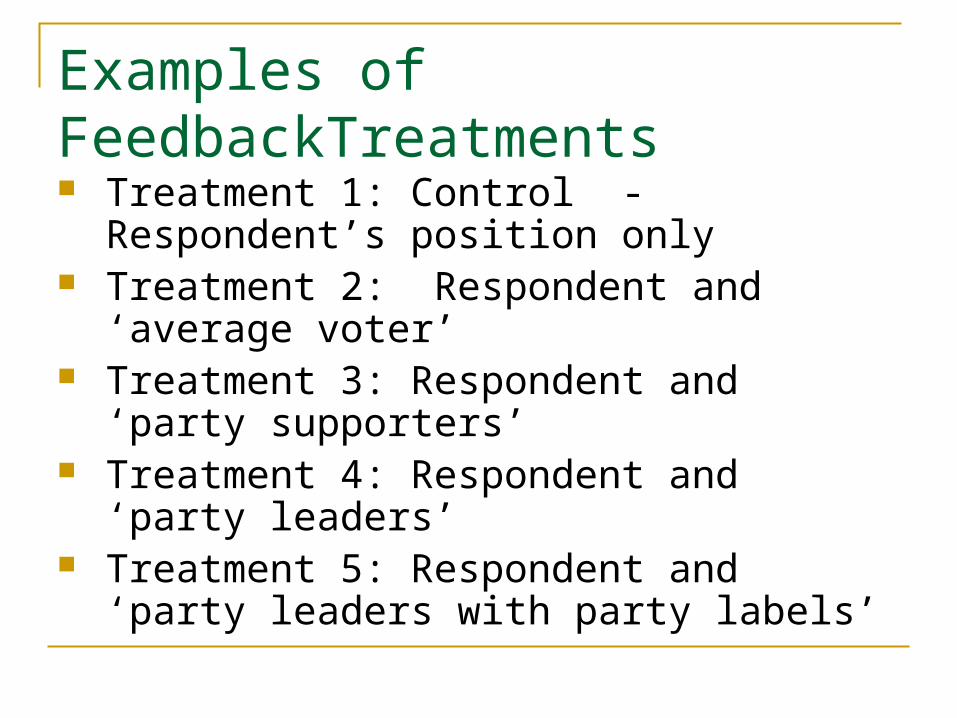
Examples of FeedbackTreatments Treatment 1: Control - Respondent’s
position only Treatment 2: Respondent and ‘average
voter’ Treatment 3: Respondent and ‘party
supporters’ Treatment 4: Respondent and ‘party leaders’ Treatment 5: Respondent and ‘party leaders
with party labels’
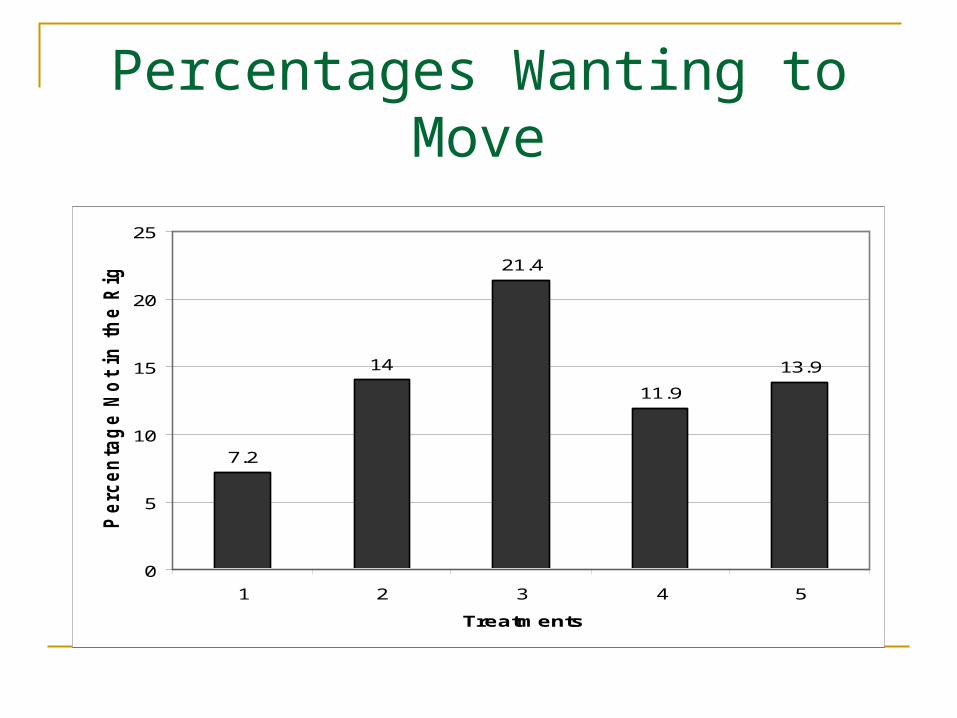
Percentages Wanting to Move
7.2
14
21.4
11.9
13.9
0
5
10
15
20
25
1 2 3 4 5
Treatments
Perc
en
tag
e N
ot
in t
he R
igh
t P
lace
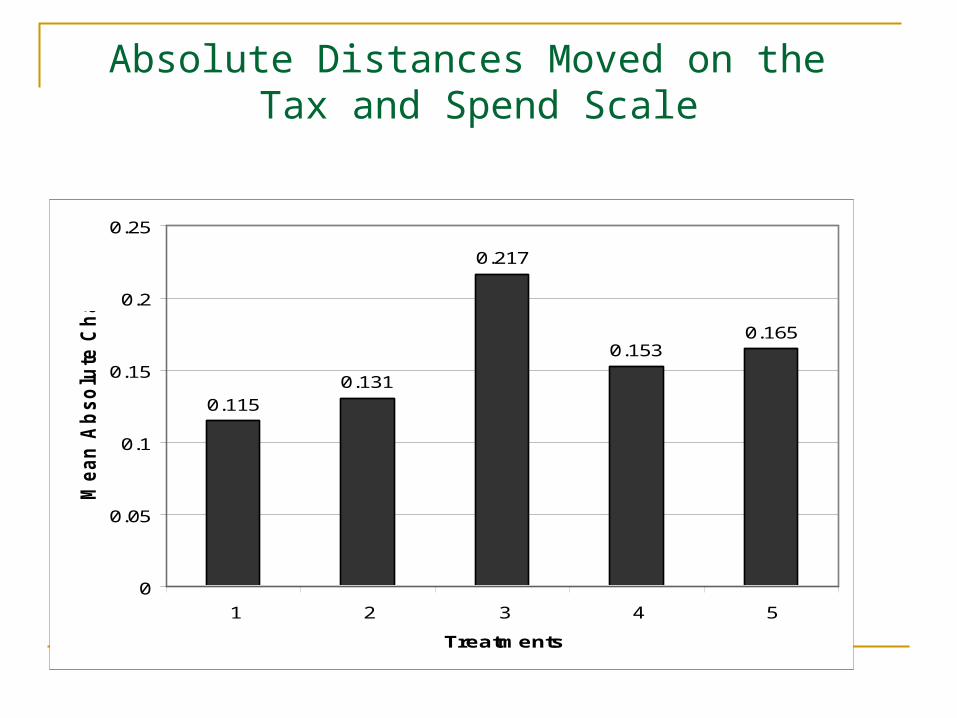
Absolute Distances Moved on the Tax and Spend Scale
0.1150.131
0.217
0.1530.165
0
0.05
0.1
0.15
0.2
0.25
1 2 3 4 5
Treatments
Mean
Ab
so
lute
Ch
an
ge
Conclusions
Respondents change their preferences on issues if given feedback
Cues relating to political parties are particularly likely to move them
If preferences are not exogenous then spatial models of party competition are wrong
Much of neo-classical economic theory is wrong too!
Summary – Advantages of Internet Surveys
Huge N’s
Quick & Flexible– not tied to slow-moving in-person data collection
Clean administration of surveys – avoiding priming and interviewer effects
Highly cost-effective
Hi-tech experimentation possible (again cost effective)
Panels – study dynamics in multi-wave panels easily


![Sean Whiteley] Memletics Effective Speed Reading](https://static.fdocuments.in/doc/165x107/5695d38f1a28ab9b029e60d5/sean-whiteley-memletics-effective-speed-reading.jpg)