British Columbia's Empty Bedrooms
19
British Columbia's Empty Bedrooms Occupancy of British Columbia’s Housing Stock By Andrew Ramlo The Urban Futures Institute T HE L AND C ENTRE I. Introduction Contemporary regional planning in British Columbia has given significant emphasis to the management of urban growth, particularly in regions where growth has historically been accommodated by development of green field sites on the fringe of expanding urban areas. Much of growth management has been focused towards the role of housing in determining land uses, and changes in uses, in these regions. As growth is (often erroneously) seen as the sole cause of land use change, the housing aspects of growth management discussions have often focused on issues of additional supply (the provision of new housing and related cost, price, accessibility, and land use issues) and additional demand (sources of demand by structure and tenure type). Some examples of the focus on new construction are the popularity of Neo- Traditional housing developments, infill, sustainable development and stacked ground-oriented housing forms often presented as a means of implementing and achieving growth management strategies. Much less discussion has been focused on the potential for accommodating not only growth in demand, but also its change, within the existing housing stock. Certainly there have been discussions of the efficiency of use of the existing housing stock, but rarely have they been based on measurement of the degree of efficiency of utilization of the existing housing stock, nor the ability of the stock to accommodate increases in demand brought about by population growth and, more importantly, change. According to the 1996 Census there were 3,724,500 people in the province of British Columbia, 99% (3,677,890) of whom lived in private dwellings and 46,600 of whom lived in institutions (including jails, hospitals, care facilities, and boarding and rooming houses where living quarters are shared). The 3,677,900 people in private dwellings occupied a total of 1,424,600 dwelling units, which includes all forms of housing (such as apartments and ground oriented homes of both rental and ownership tenure where living quarters are not shared: thus, a basement suite in a house is counted as a dwelling unit, just as the upstairs with the empty bedrooms is). Therefore, there was an average of 2.6 persons living in each of these dwelling units. The 1996 Census also reported that there was an average of 2.6 bedrooms in each of these private dwellings. This reveals the astonishing fact that there is one bedroom for every person living in private dwellings in the province. On average everyone in the province has a (bed) room of their own: 3,677,900 people and 3,677,900 bedrooms in private dwellings. These figures are averages, and therein lies the issue: bedrooms are not distributed in the same way people are distributed. For example, for every person who lives by themselves in a dwelling with no bedroom, such as a studio apartment, there must be a person who lives alone living in a dwelling with two bedrooms. Similarly, for every couple in a one-bedroom unit there is a couple in a three-bedroom dwelling. Throughout the province there are many neighbourhoods where there are a surplus of bedrooms (more bedrooms than there are people living in private dwellings), while in other neighbourhoods there are more people than there are bedrooms.
Transcript of British Columbia's Empty Bedrooms

British Columbia's Empty Bedrooms Occupancy of British Columbia’s Housing Stock
By Andrew Ramlo
T h e U r b a n F u t u r e s I n s t i t u t e T H E L A N D C E N T R E
I. Introduction Contemporary regional planning in British Columbia has given significant emphasis to the management of urban growth, particularly in regions where growth has historically been accommodated by development of green field sites on the fringe of expanding urban areas. Much of growth management has been focused towards the role of housing in determining land uses, and changes in uses, in these regions. As growth is (often erroneously) seen as the sole cause of land use change, the housing aspects of growth management discussions have often focused on issues of additional supply (the provision of new housing and related cost, price, accessibility, and land use issues) and additional demand (sources of demand by structure and tenure type). Some examples of the focus on new construction are the popularity of Neo-Traditional housing developments, infill, sustainable development and stacked ground-oriented housing forms often presented as a means of implementing and achieving growth management strategies. Much less discussion has been focused on the potential for accommodating not only growth in demand, but also its change, within the existing housing stock. Certainly there have been discussions of the efficiency of use of the existing housing stock, but rarely have they been based on measurement of the degree of efficiency of utilization of the existing housing stock, nor the ability of the stock to accommodate increases in demand brought about by population growth and, more importantly, change. According to the 1996 Census there were 3,724,500 people in the province of British Columbia, 99% (3,677,890) of whom lived in private dwellings and 46,600 of whom lived in institutions (including jails, hospitals, care facilities, and boarding and rooming houses where living quarters are shared). The 3,677,900 people in private dwellings occupied a total of 1,424,600 dwelling units, which includes all forms of housing (such as apartments and ground oriented homes of both rental and ownership tenure where living quarters are not shared: thus, a basement suite in a house is counted as a dwelling unit, just as the upstairs with the empty bedrooms is). Therefore, there was an average of 2.6 persons living in each of these dwelling units. The 1996 Census also reported that there was an average of 2.6 bedrooms in each of these private dwellings. This reveals the astonishing fact that there is one bedroom for every person living in private dwellings in the province. On average everyone in the province has a (bed) room of their own: 3,677,900 people and 3,677,900 bedrooms in private dwellings. These figures are averages, and therein lies the issue: bedrooms are not distributed in the same way people are distributed. For example, for every person who lives by themselves in a dwelling with no bedroom, such as a studio apartment, there must be a person who lives alone living in a dwelling with two bedrooms. Similarly, for every couple in a one-bedroom unit there is a couple in a three-bedroom dwelling. Throughout the province there are many neighbourhoods where there are a surplus of bedrooms (more bedrooms than there are people living in private dwellings), while in other neighbourhoods there are more people than there are bedrooms.

BC's Empty Bedrooms: Occupancy of British Columbia’s Housing Stock July 1999 Page 2
T h e U r b a n F u t u r e s I n s t i t u t e T H E L A N D C E N T R E
This data provides a new dimension for the term “bedroom communities”, as many neighbourhoods throughout the province now are truly communities of bedrooms. It is in this context that issues of efficient use of the housing stock emerge, where efficiency is measured in terms of the number of persons per bedroom and the number of bedrooms per person. Efficiency has become an important policy criterion in the 1990’s. Driven by both the environmental and economic concerns of consuming scarce resources, all sectors of society have made efficiency a cornerstone of operations and planning. An example of this is BC Hydro’s “Power Smart” Program. The objective of this program is to increase the efficiency of consumer usage of electrical power in order to increase the productivity of the output of the company’s existing capital generating stock (dams and turbines), thereby reducing the need to expand the capital stock and flood additional valleys. PowerSmart seeks to do this through attempting to reduce the “waste” of electricity by a wide range of activities from the purchasing old, inefficient beer refrigerators, to getting customers to replace incandescent light bulbs with energy savers, to sealing leaks in air hoses in factories. The goal is to increase the effective supply of electricity through increasing the efficiency of usage rather than continually adding capital (dams) to accommodate additional demand. The existing number of dwelling units in the province form a stock of housing capital, much like BC Hydro’s dams and power stations form a stock of electrical generating capital. It is important for us to also ask how efficiently the existing capital stock of housing is being used. There is an overall allocation question about the efficiently of use of the housing stock: is it necessary to have an average of one bedroom per person? There is a second question related to the distribution of the stock: how effectively is the location of supply of bedrooms matched to the location of demand for bedrooms? In turn, there is also a third question that relates to the policy that governs the creation of the stock: can anything be done to change the matching of people and bedrooms if there is currently an inefficient use of the housing stock? All of these lead to the final question: Do we need a “Home Smart” program that works with communities to bring about a more efficient use of the housing stock in the province, and to reduce the reliance on green field development to accommodate not only increases in housing demand, but also changes in demand that will be brought about by the coming significant aging of our population. Over the next three decades the aging of BC’s population will have a greater impact on housing demand, and hence land use, than will the overall growth in the number of people living in the province. The inevitable process of aging will see the province move from a situation today where one in eight people are over the age of 65 to a situation in 30 years where one in four are senior citizens. The challenges presented by the aging of the population will be enhanced in many communities by a growth in the number of young couples, teenagers and children. In turn, this growth and change of the population will have a great impact on the future of housing within the province. The significant impact of aging on housing markets is a result of age related patterns of demand for housing. As an individual ages through the lifecycle the propensity to maintain ground-oriented dwellings, especially owner occupied ground oriented dwellings, increases dramatically. In the early family formation stage of the lifecycle, there is a need for a multi bedroom dwelling. Where inefficiencies of use arise is when children establish their own households and the number of people in their parents homes becomes much smaller than the number of bedrooms in the dwelling units.

BC's Empty Bedrooms: Occupancy of British Columbia’s Housing Stock July 1999 Page 3
T h e U r b a n F u t u r e s I n s t i t u t e T H E L A N D C E N T R E
Using the published data from the most recent (1996) Census on the average number of bedrooms and the average number of persons per private dwelling unit, this report documents the current efficiency of usage of the existing dwelling stock within the province and the potential for increasing the efficiency of using this housing stock. II. People and Their Homes Over the past 35 years the province’s population increased by 2.1 million people, growing from 1.64 million in 1961 to over 3.8 million by 1996. Over this same period, the population living in private dwellings grew by 134% from 1.57 to 3.7 million residents. The growth in the number of people calling British Columbia home has been reflected in housing markets as the number of homes has grown to accommodate the additional people. Between 1961 and 1996 the total number of occupied private dwellings in the province grew by 210%, (965,100 more units), from 459,500 in 1961 to over 1,424,600 units by 1996 (Figure 1). The result was an overall decline in the average number of people living in these dwelling units over the past 35 years, from 3.4 people per dwelling unit in 1961 to 2.6 by 1996, a decline of 33%.
1,572,237
1,816,509
2,694,9172,837,522
3,233,196
3,678,210
459,534 543,075668,303
828,287996,641
1,087,1161,243,894
1,424,635
2,420,173
2,137,926
3.4 3.33.2
2.92.7 2.6 2.6 2.6
1961 1966 1971 1976 1981 1986 1991 1996
Figrue 1: Population and Dwelling Units, 1961 to 1996, British Columbia
Population in Private Dwellings
PrivateHouseholds
Persons per Dwelling Unit
Over the quarter century from 1971 to 1996, the population in private dwellings grew by 134%, the number of private dwellings by 210%, and hence the average number of people per dwelling unit has declined by 16%. As part of the 1971 Census for the first time the average number of bedrooms per dwelling unit was tabulated as part of the Census questionnaire. In 1971 there was an average of 2.5 bedrooms per private dwelling. By the time the 1996 Census there was an average of 2.6 bedrooms per private dwelling unit. Therefore, between 1971 and 1996, while the average number of people per dwelling unit declined by 33%, the average number of bedrooms per dwelling unit increased by over 4%. This has taken us from a situation in 1971 where there

BC's Empty Bedrooms: Occupancy of British Columbia’s Housing Stock July 1999 Page 4
T h e U r b a n F u t u r e s I n s t i t u t e T H E L A N D C E N T R E
were approximately 1.2 persons per bedroom to today’s situation where there is essentially one bedroom for every individual living in private dwellings in the province. The majority of the growth in the number of bedrooms per person can be attributed to the empty nester phenomenon. While most of the baby boomers left their parental home more than a decade ago, many of their parents didn’t. The age profile of the province in 1971 showed an overwhelmingly young population with 35% of the population under the age of 25; by 1996 the age profile of the province’s population had become overwhelmingly adult, with 33% of the population between the ages of 32 and 51 (Figure 2). With the long life expectancy of today’s population, many of the homes that the boomers moved out of to establish their own homes are still occupied by both (or at least one) of the boomers parents. Houses that were fully occupied in 1971 are now under-occupied: the average number of bedrooms per person has increased because there are now fewer people in the family household. This is what has caused the mismatch between the number of bedrooms and people in the private dwelling stock in some areas.
40,000 30,000 20,000 10,000 0 10,000 20,000 30,000 40,000
0
10
20
30
40
50
60
70
80
90
100 Figure 4: Population of British Columbia, by Age and Sex, 1971 and 1996
MaleFemale
1996 - 69,10035 year olds
BC's typical Resident
1996 - 1,151,60032 to 51 years old
33% of BC's Population
1971
1996
1971 - 45,78011 year olds
BC's typical Resident1971 - 77,2407 to 25 years old
35% of BC's Population
Behavioral change has also pulled down the average number of people per dwelling. These social changes include an increasing number of women entering both the labour and housing markets, increasing divorce rates, declining family sizes and a growth in the urban singles lifestyle. Finally, rising affluence and building standards have greatly reduced the construction of studio (i.e. no bedroom) apartments, with one or more bedroom units becoming the norm. This has also worked to push up the number of bedrooms per person in the apartment stock. Combined, these three factors have contributed to the overall decline in average household sizes and the average number of persons per bedroom in many communities throughout the province.

BC's Empty Bedrooms: Occupancy of British Columbia’s Housing Stock July 1999 Page 5
T h e U r b a n F u t u r e s I n s t i t u t e T H E L A N D C E N T R E
In relation to previous generations where the housing stock was passed from one generation to the next as a result of relatively short life expectancies, today most individuals can count on a retirement that may last as long as time spent in the labour force. The result of people living longer is that they have remained in family homes longer. Their homes have lasted longer than the growing families that they were constructed to shelter. These homes have remained in this form as zoning bylaws and community opposition have not allowed the dwelling stock to change as rapidly as the people living inside their walls have. This situation of an overhoused empty nester population may grow considerably in the future, as the bulk of the boomers children of the boomers will enter the family formation stage of the lifecycle, while the large baby boom generation continues to live in the large family home. This will increase pressure for green field housing development as the baby boomers compete with their parents for family housing today, and their children of the baby boomers will compete with their parents (and potentially their grandparents) by 2026. As Figure 3 shows, this process, the Post World War II baby boom clearly dominates the age profile of the province with the considerably smaller bulges of the boomers parents and their children falling a generation before and after them. The impact of the aging of this generation through the lifecycle can be clearly seen as it moves its way up the population pyramid. What can also be seen are the boomers parents, the slight bulge that appears 30 year before that of the post World War II bulge. These are the individuals who are remaining in their homes well after their children (the boomers) have moved on and started their own families. This process will perpetuate itself as the next small boom (those now between the ages of 5 and 18) begin to start families within the coming decade. They too will be looking for housing that suits raising a family. And they too will still have their parents living in large single family homes as they begin to do so. This becomes an important growth management issue, as the only alternative to increasing the efficiency of the existing housing stock will be to create new residential capacity on greenfield sites on the fringe of urban areas. In 1971 the baby boom generation was under 25, most living in their family homes with their parents. In 1996 the boomers had replaced their parents, being in the 25 to 49 age group, with their children under the age of 25 and their parents between the ages of 50 and 75, many of who still remain in the family home. The growth management issue over the next 25 years will be the aging of the baby boom generation into the 50 to 74 age group (Figure 3) and the accommodation of their children in the housing stock as they too begin to start families.

BC's Empty Bedrooms: Occupancy of British Columbia’s Housing Stock July 1999 Page 6
T h e U r b a n F u t u r e s I n s t i t u t e T H E L A N D C E N T R E
50,000 40,000 30,000 20,000 10,000 0 10,000 20,000 30,000 40,000 50,000
0
10
20
30
40
50
60
70
80
90
100Figure 3: Population of British Columbia, by Age and Sex, 1971, 1996 and 2026
MaleFemale
1996
Baby Boom
52 to 71 years olds1996 - 658,650
2026- 1,492,350126% Growth 1996 to 2026
1971
2026
Baby Booms'Children
Baby Boomers'Parents
Baby Boom
Baby Boom
III. Regional Districts In 1996 the population living in private dwellings in the Regional Districts in the province ranged from the 1,735 people in the Central Coast to the 1.8 million people residing in the Greater Vancouver Regional District. The number of private dwellings in these regions ranged from 685 dwellings in the Central Coast Regional District to 690,400 dwellings in Greater Vancouver. The number of people living in private dwelling units and the number of bedrooms in these dwellings varies greatly amongst the Regional Districts. Of the 26 Regional Districts in the province, eight had a greater number of people living in private dwellings than there were bedrooms, while 19 had a greater number of bedrooms than there were people in private dwellings (Figure 4). The Greater Vancouver, Fort Nelson-Liard, Skeena Queen Charlotte, Comox-Strathcona, Peace River, Squamish Lilooet and Bulkley Districts each have fewer individuals living in private dwellings than the number of bedrooms in private dwellings.

BC's Empty Bedrooms: Occupancy of British Columbia’s Housing Stock July 1999 Page 7
T h e U r b a n F u t u r e s I n s t i t u t e T H E L A N D C E N T R E
4,2874,560
5,1465,3845,457
5,9536,7656,908
7,21810,052
12,75022,713
(16)
2,888
1,160949
728142
(319)
(470)(419)
(1,129)(1,431)
(5,175)
1,8172,465
(113,570)
(8,000) (3,000) 2,000 7,000 12,000 17,000 22,000
Greater Vancouver
Comox-Strathcona
Peace River
Skeena-Queen Charlotte
Bulkley-Nechako
Squamish-Lillooet
Fort Nelson-Liard
Mount Waddington
Central Coast
Kitimat-Stikine
Sunshine Coast
Cariboo
Powell River
Fraser-Fort George
Columbia-Shuswap
Kootenay Boundary
East Kootenay
Fraser Valley
North Okanagan
Cowichan Valley
Okanagan-Similkameen
Central Kootenay
Capital
Thompson-Nicola
Nanaimo
Central Okanagan
Alberni-Clayoquot
Figure 4: Difference Between the Number of Bedrooms and
People Living in Private Dwellings by Regional District,
British Columbia, 1996
More Bedrooms
More People
When calculated at the regional level the difference between the number of people and the number of bedrooms in private dwellings ranged from there being 22,700 more bedrooms than people in the Alberni-Calyoquot Regional District to 113,600 more people than bedrooms in the Greater Vancouver Regional District. Of the 19 Regional Districts that had more bedrooms than people, there were a total of 110,550 empty bedrooms, potential housing for 100,000 residents (assuming one bedroom per person). In the other eight Regional Districts, there were 122,000 more people than there were bedrooms, most of which were found in Greater Vancouver. Another useful way to look at the empty bedroom phenomenon is to consider the average number of persons per bedroom. Eight of the Regional Districts have more than one person per bedroom while eighteen have fewer than one person per dwelling unit (Figure 5). This mismatch is a result of the composition of the resident population, and economic conditions that prevailed within the province’s regions in 1996. For example, the Alberni-Clayoquot Regional District has recently been challenged by economic restructuring of its primary industries, resulting in economic uncertainty and job losses. Consequently, there has been an outflow of mainly young workers looking for employment opportunities in other regions and provinces. This has resulted in a change in the number of people, but not the bedrooms, causing a decline in the average number of persons per household, and in the average number of persons per bedroom. Another example is that of the Central Okanagan Regional District. While not necessarily facing the same challenges of economic restructuring, the region is experiencing a change in their age profile. The Central Okanagan is a destination for retirees from other regions in the province, and other provinces in Canada. This substantial aging of the resident population has contributed to a change in the average number of persons per bedroom in the Region. Figure 5 shows that they range from the highest rate in the Greater Vancouver Regional District (where there is an average of 1.09 people per bedroom), to the Central Okanagan Regional District (where there are only 0.89 persons per bedroom).

BC's Empty Bedrooms: Occupancy of British Columbia’s Housing Stock July 1999 Page 8
T h e U r b a n F u t u r e s I n s t i t u t e T H E L A N D C E N T R E
0.920.92
0.930.940.94
0.89
0.920.92
0.920.92
0.91
0.89
1.01
0.980.96
1.02
1.091.06
1.061.05
1.02
1.000.980.980.980.98
Central Okanagan
Central Kootenay
Alberni-Clayoquot
Powell River
Nanaimo
Central Coast
East Kootenay
Cowichan Valley
Okanagan-Similkameen
North Okanagan
Thompson-Nicola
Columbia-Shuswap
Sunshine Coast
Fraser Valley
Capital
Kitimat-Stikine
Cariboo
Fraser-Fort George
Mount Waddington
Bulkley-Nechako
Squamish-Lillooet
Peace River
Comox-Strathcona
Skeena-Queen Charlotte
Fort Nelson-Liard
Greater Vancouver
Figure 5: Number of Persons per Bedroom by Regional District, British Columbia, 1996
1 personper bedroom
7.5%
7.5%
7.5%
3.7%
5.8%
8.4%
8.7%
9.3%
10.6%
11.7%
7.5%
7.8%
1.6%
2.0%
2.2%
2.4%
6.0%
7.3%
1.8%
Fraser-Fort George
Cariboo
Kitimat-Stikine
Capital
Fraser Valley
Sunshine Coast
Columbia-Shuswap
Thompson-Nicola
North Okanagan
Okanagan-Similkameen
Cowichan Valley
East Kootenay
Central Coast
Nanaimo
Powell River
Central Okanagan
Alberni-Clayoquot
Central Kootenay
Kootenay Boundary
Figure 6: Percentage of Empty Bedrooms by Regional District, British Columbia, 1996
BC's Empty Bedrooms: Occupancy of British Columbia’s Housing Stock July 1999 Page 9
T h e U r b a n F u t u r e s I n s t i t u t e T H E L A N D C E N T R E
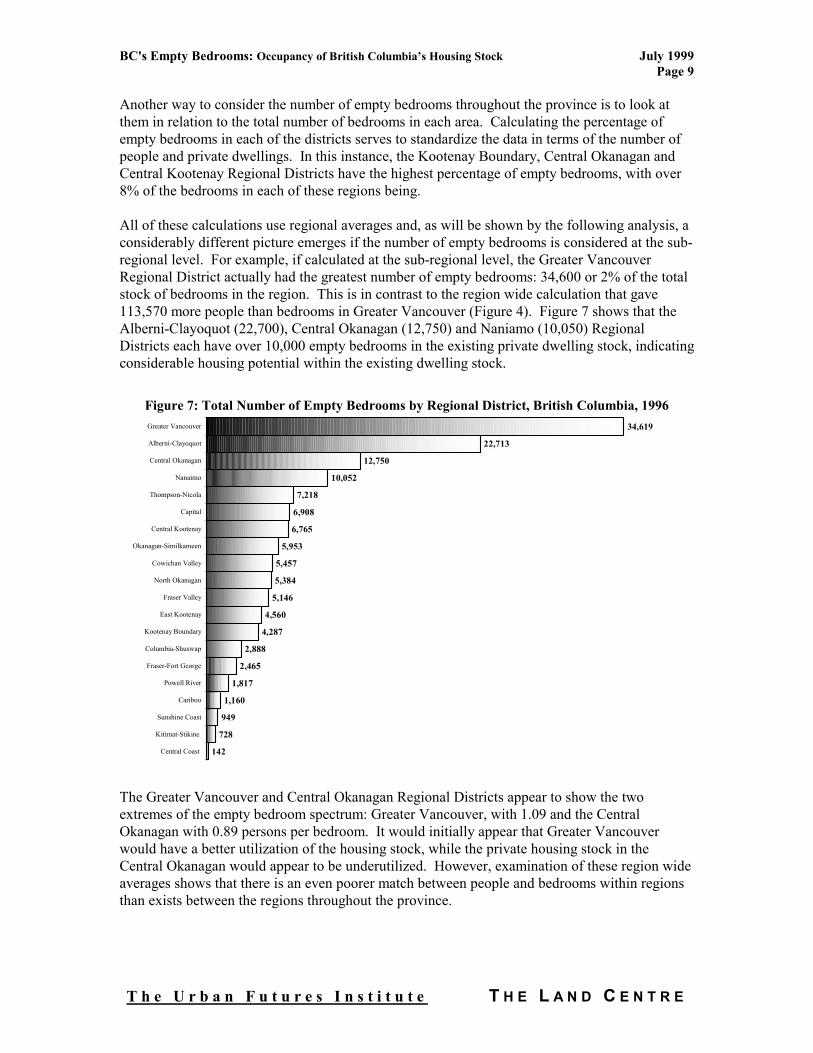
Another way to consider the number of empty bedrooms throughout the province is to look at them in relation to the total number of bedrooms in each area. Calculating the percentage of empty bedrooms in each of the districts serves to standardize the data in terms of the number of people and private dwellings. In this instance, the Kootenay Boundary, Central Okanagan and Central Kootenay Regional Districts have the highest percentage of empty bedrooms, with over 8% of the bedrooms in each of these regions being. All of these calculations use regional averages and, as will be shown by the following analysis, a considerably different picture emerges if the number of empty bedrooms is considered at the sub-regional level. For example, if calculated at the sub-regional level, the Greater Vancouver Regional District actually had the greatest number of empty bedrooms: 34,600 or 2% of the total stock of bedrooms in the region. This is in contrast to the region wide calculation that gave 113,570 more people than bedrooms in Greater Vancouver (Figure 4). Figure 7 shows that the Alberni-Clayoquot (22,700), Central Okanagan (12,750) and Naniamo (10,050) Regional Districts each have over 10,000 empty bedrooms in the existing private dwelling stock, indicating considerable housing potential within the existing dwelling stock.
2,465
2,888
5,146
5,384
5,457
728
4,560
4,287
1,817
1,160
949
142
34,619
6,765
5,953
22,713
12,750
10,052
7,218
6,908
Central Coast
Kitimat-Stikine
Sunshine Coast
Cariboo
Powell River
Fraser-Fort George
Columbia-Shuswap
Kootenay Boundary
East Kootenay
Fraser Valley
North Okanagan
Cowichan Valley
Okanagan-Similkameen
Central Kootenay
Capital
Thompson-Nicola
Nanaimo
Central Okanagan
Alberni-Clayoquot
Greater Vancouver
Figure 7: Total Number of Empty Bedrooms by Regional District, British Columbia, 1996
The Greater Vancouver and Central Okanagan Regional Districts appear to show the two extremes of the empty bedroom spectrum: Greater Vancouver, with 1.09 and the Central Okanagan with 0.89 persons per bedroom. It would initially appear that Greater Vancouver would have a better utilization of the housing stock, while the private housing stock in the Central Okanagan would appear to be underutilized. However, examination of these region wide averages shows that there is an even poorer match between people and bedrooms within regions than exists between the regions throughout the province.

BC's Empty Bedrooms: Occupancy of British Columbia’s Housing Stock July 1999 Page 10
T h e U r b a n F u t u r e s I n s t i t u t e T H E L A N D C E N T R E
IV. Metropolitan Vancouver – The distribution of People, Homes and Bedrooms In 1996 there were 1,809,900 people living in private households in the Greater Vancouver Regional District. These residents lived in 692,800 private dwellings, giving an average of 2.6 persons living in each dwelling unit. There was an average of 5.9 rooms and 2.5 bedrooms per dwelling. Therefore, in the entire region there were a total of 1,696,300 bedrooms in 692,800 private dwellings for 1,809,900 people in the regioni. Thus, in contrast to the provincial average where there was almost exactly one person per bedroom, in the GVRD there were 1.09 persons per bedroom. However, this is an average, and once again therein lies the issue: bedrooms and people are not distributed evenly throughout the Greater Vancouver Region. When considered at the neighborhood (Census Tract) level there is a wide range of average number of persons per bedroom (from 3.75 persons per bedroom in one community to 0.85 persons per bedroom in another) that are averaged out at the regional level. Mapping these ratios (Maps 1 to 3) show a distinct spatial difference in the distribution of people, and bedrooms. The GVRD is comprised of 298 Census Tracts (CTs) that range in population from 1,678 to 19,740 people. Of these 298 Census tracts, 119 had more bedrooms in private dwellings than there are people in private dwellings, and 179 had more people in private dwellings than there were bedrooms (Map 1). There is an estimated 34,600 empty bedrooms (the sum of the number of bedrooms in CTs where there are more bedrooms than people) in the region. In the other 179 Census Tracts there were 148,200 more people than there were bedrooms (Note that this under-estimates the total, as these are averages at the census tract level: there will be situations within Census Tracts where dwellings with empty bedrooms will be averaged with dwellings where there are two people per bedroom and therefore we can assume these numbers are low). The parts of the region with the largest number of empty bedrooms were in the North Shore municipalities of West and North Vancouver, the westside of the City of Vancouver and in south Surrey and south Delta. These three areas combined account for approximately 46% of all of the empty bedrooms in the region (Map 1). The census tract with the largest number of empty bedrooms was CT number 133, situated in West Vancouver. This CT has 1,226 empty bedrooms in 3,200 private dwellings; approximately 12% of the bedrooms in the Census Tract were empty. The number of persons per bedroom ranges from a low of 0.85, found in Census Tract 132 in West Vancouver, to a high of 3.75, found in Census Tract 58 in East Vancouver. The smallest average number of persons per bedroom were found in parts of North Vancouver and West Vancouver Districts, the Crescent Beach area of South Surrey, and in south west Burnaby (Map 2). Conversely, the greatest number of persons per bedroom were found in the Downtown East Side of Vancouver. It is informative to consider the percentage of a neighbourhood’s bedrooms that are empty. The greatest percentage of bedrooms that are vacant are in the 10% to 15% range found in parts of North Vancouver and West Vancouver Districts, the Crescent Beach area of South Surrey, and in south west Burnaby. Between 5% and 10% of the bedrooms in Dunbar Point Grey, North Burnaby and North Delta, most of North Vancouver District, and in Anmore and Belcarra, with pockets of high vacancy throughout the rest of the region (Map 3). In 1996 the District of North Vancouver had 79,600 people living in 27,900 private dwelling units. Within these private dwellings there were at least 4,440 empty, or 6% of the total

BC's Empty Bedrooms: Occupancy of British Columbia’s Housing Stock July 1999 Page 11
T h e U r b a n F u t u r e s I n s t i t u t e T H E L A N D C E N T R E
bedrooms in the District. Between 1996 and 2006 the Greater Vancouver Livable Region Strategic Plan (LRSP) projects that the District of North Vancouver will add 7,600 new residents, growing by 9%. Therefore, if the existing dwelling stock were to be used more efficiently, there is the potential to accommodate over 60% of the anticipated growth in population over this 10-year period without new construction.
The Municipality of West Vancouver shows a similar pattern. In 1996 West Vancouver had 42,400 residents living in 17,100 private dwellings. A total of 4,350 empty bedrooms were found in the dwelling stock, 9.5% of the total number of bedrooms in the municipality. The Municipality of West Vancouver is projected to grow by 5% between 1996 and 2006, adding 2,370 residents. Given the number of empty bedrooms in the municipality, there is the potential to accommodate growth within the existing dwelling stock well past 2006, as the 2,370 new residents would only consume 54% of the capacity found in the existing dwelling stock. Combined, there are at least 8,800 empty bedrooms on the North Shore, enough to house 9,000 people in the existing dwellings if there was a greater match between people and bedrooms.
The Dunbar Point Grey and South Granville areas show a similar pattern with 5,400 empty bedrooms in the existing private dwelling stock. As on the North Shore, this area could potentially provide accommodation for up to an additional 5,400 residents, or approximately 1,930 families of 2.8 people and an average of 2.8 bedrooms per dwelling unit. Given the LRSP forecasts the city of Vancouver adding 40,000 people between 1996 and 2006, the proportion of growth for these areas based on the number of people living there today would be 4,700 new residents. Considering only these areas of the city where there are more bedrooms than there are residents, the potential exists to accommodate the projected number of new residents in these areas well beyond 2006.
Each of these areas that has a large number of empty bedrooms are in areas characterized as older suburban areas where large single family detached houses predominate. Interestingly, many of the Municipalities that show a greater proportion of bedrooms than people living in private households also have a far greater proportion of individuals over the age of 65; 19% of the population in West Vancouver is over the age of 65, 12% of North Vancouver District’s and 12% of Vancouver City’s. Approximately 11% of the regions population is over the age of 65.
The number of empty bedrooms in the Metropolitan Region is only one part of the story. The highest average number of people to bedrooms is found in the Census Tracts in Vancouver’s Downtown and East Side where the number of persons per bedroom reaches 3.75, almost four and a half times that found in on the North Shore. This is the result of the large number of single room occupancy hotels and rooming houses found on Downtown East Side and a high proportion of singles and couples living in studio apartments in the West End.
In the areas that show a high degree of utilization of the private dwelling stock housing alternatives could be constructed in order to relieve pressure on the existing dwelling stock. However, creating alternatives in the communities that show a low degree of utilization, such as in West and North Vancouver, will not translate into a reduction of housing pressure in these areas. This is a result of a mismatch not between the number of people and bedrooms, but between the people and where the bedrooms are located. Neighborhood alternatives that would allow older couples and singles to move out of their family homes would not necessarily be creating viable alternatives for those residents living in the West End, False Creek or the Downtown East Side.

BC's Empty Bedrooms: Occupancy of British Columbia’s Housing Stock July 1999 Page 12
T h e U r b a n F u t u r e s I n s t i t u t e T H E L A N D C E N T R E

BC's Empty Bedrooms: Occupancy of British Columbia’s Housing Stock July 1999 Page 13
T h e U r b a n F u t u r e s I n s t i t u t e T H E L A N D C E N T R E
V. Central Okanagan Regional District The Kelowna Census Agglomeration (CA) follows the geographic boundaries of the Central Okanagan Regional District. Like the Greater Vancouver Region, the Kelowna CA is divided into Census Tracts that allow smaller areas to be considered when looking at the spatial distribution of bedrooms in private dwellings. In 1996 there were 134,600 people living in private households in the Kelowna CA. These residents lived in 53,500 private dwellings, giving an average of 2.5 persons per dwelling unit. With an average of 2.8 bedrooms per dwelling, there were a total of 147,300 bedrooms in Kelownaii, there were more bedrooms in the District than there were people to live in them. Thus, in contrast to the provincial average where there was exactly one person per bedroom, and the Greater Vancouver Region where there were 1.09 persons per bedroom, the Kelowna CA had an average of only 0.91 people per bedroom. These are region wide averages: people and bedrooms are not distributed any more evenly in the Central Okanagan than they are in Greater Vancouver Regional District. Mapping these ratios show a distinct spatial pattern to the distribution of people, and bedrooms, within the Kelowna CA (Maps 4 to 6). The Kelowna CA is comprised of 27 Census Tracts that range in population from 945 to 13,100 people: 26 of these 27 Census tracts have more bedrooms in private dwellings than people in private dwellings (Map 4). In total there were 12,750 empty bedrooms (i.e. the sum of the number of bedrooms in Census Tracts where there were more bedrooms than people) in the region. Note that this under-estimates the total, as these are averages at the census tract level: just as there are differences at the regional level, there will be situations within Census Tracts where dwellings with empty bedrooms will be averaged with dwellings where there are two people per bedroom. The parts of the region with the largest number of empty bedrooms are in Lakeview Heights, Glenmore, Okanagan Mission, Westbank and along Lakeshore road in South Kelowna. These five areas combined account for 49% (6,250) of all of the empty bedrooms in the region (Map 4). The Census Tract with the largest number of empty bedrooms was CT number 19, located in Glenmore (where there were a total of 1,630 empty bedrooms) and number 100 located in Lakeview Heights (where there were 1,100). Combined, these two Census Tracts have 2,730 empty bedrooms, 21% of the total number of bedrooms. When the number of people per bedroom is considered at the Census Tract level, the number of persons per bedroom ranges from an average of 1.0 person per bedroom (which was the provincial average) in one community in East Kelowna to a low of 0.82 persons per bedroom in south west Westbank (Map 5). Unlike either the province or Greater Vancouver where there were areas that had an average of more than one person per bedroom, there were none with that average in the Kelowna CA. The greatest percentage of bedrooms that are vacant are the 15% to 18% range. These areas of excess bedrooms are in Lakeview Heights, southwest Westbank and one Census Tract in downtown Kelowna (Map 6). The only Census Tract that had no empty bedrooms was in Rutland (CT number 27) where there was an average of one person per bedroom. In the 53,500 private dwelling units that are found in the Kelowna CA there are at least 12,750 empty bedrooms, or 9% of the total bedroom stock within the region. Between 1996 and 2006 BC Statistics projects that the Central Okanagan Regional District will add 35,700 new residents
BC's Empty Bedrooms: Occupancy of British Columbia’s Housing Stock July 1999 Page 14
T h e U r b a n F u t u r e s I n s t i t u t e T H E L A N D C E N T R E
and grow by 25%. Therefore, if the existing dwelling stock were to be used in a more efficient manner, the potential exists to accommodate 36% of the anticipated growth in population over this 10-year period without new construction. As in Greater Vancouver, the areas characterized by a surplus of bedrooms are situated in older neighbourhoods where there is a large supply of single family detached homes. In addition as the Central Okanagan has become a retirement destination for many seniors, this region also has a far greater proportion of senior citizens who have retired to the Okanagan. Overall 16% of the population in Kelowna is over the age of 65, while the province has under half of that proportion of seniors (6%). Only by providing a reasonable set of housing alternatives to traditional suburban homes, such as smaller dwelling forms located within these communities, can we facilitate a housing market adjustment that will increase the efficiency of housing within these and other municipalities. Neighborhood alternatives would allow older couples and singles to remain within the communities that they raised their families, while allowing the single family dwelling stock to be passed onto the next generation of families.

BC's Empty Bedrooms: Occupancy of British Columbia’s Housing Stock July 1999 Page 15
T h e U r b a n F u t u r e s I n s t i t u t e T H E L A N D C E N T R E
BC's Empty Bedrooms: Occupancy of British Columbia’s Housing Stock July 1999 Page 16
T h e U r b a n F u t u r e s I n s t i t u t e T H E L A N D C E N T R E

BC's Empty Bedrooms: June 1999 Page 17
T h e U r b a n F u t u r e s I n s t i t u t e T H E L A N D C E N T R E

BC's Empty Bedrooms: June 1999 Page 18
T h e U r b a n F u t u r e s I n s t i t u t e T H E L A N D C E N T R E
VI. Conclusions
Two physical characteristics distinguish housing (and other real estate) from the standard commodities that are used as examples of markets. These are the fact that housing is immobile, and hence cannot be moved geographically between markets, and durable, which means that its physical characteristics do not change as fast as the market would dictate.
These two characteristics provide some guidance towards answering the four questions posed at the start of this paper. The first question asked whether an average of one person per bedroom in the province was necessary? The analysis of the regional district data showed that, while it may not be necessary, to some extent it is unavoidable, as dwelling units are immobile and durable, while people are mobile: the empty dwellings of regional districts such as Alberni-Clayoquot are the result of economic growth and decline not being uniform across the province. As some regions decline, we can anticipate people (particularly young people) leaving regions, resulting in there being too many bedrooms for the people who remain. In the extreme, economic decline can lead to ghost towns, the ultimate under-utilization of the durable housing stock. So long as regions have differing economic lives, we will likely see some regions where the housing stock is under utilized and some where it is well utilized. Short of building houses out of cardboard, or on wheels, this mismatch is difficult to remedy.
The second question was how well does the distribution of the stock match demand. At the interregional level, the answer to the previous question prevails: not well, but as this is a by-product of mobile labour forces and a durable housing stock, it is an inevitable situation. At the regional level, however, a different response is necessary. First, while dwelling units in regions are still immobile and durable, they are within a single transportation/commuting shed and the mobility of people within the region should ensure a better match of bedrooms and people. In fact, as indicated by the Greater Vancouver and Central Okanagan Regions, the mismatch of bedrooms and people is even greater within regions than it is between them. In some parts of metropolitan Vancouver, there are more people than bedrooms, while in others there are significantly more bedrooms than there are people.
Which takes us into the third question: can anything be done to change the matching of people and bedrooms so that this discrepancy does not exist? Unfortunately, the answer is in the short run very little. The sharing of bedrooms in one part of a community is not the result of there being a surplus of bedrooms in other parts of the community. The empty bedrooms are in older single detached neighbourhoods, beyond the incomes and lifestyles of the people dwelling in areas with more than one person per bedroom. Neither the units nor the people match between the markets. So, if the issue is the simple matching of people and bedrooms, the answer is there is little that can be done to fill the empty bedrooms with the people occupying the filled ones as the units the bedrooms are in are immobile. Just as we can not physically move the bedrooms to the residents, nor can we move the residents to bedrooms.
The reason the bedrooms are empty is twofold: a) the durability of the units, and their existing beyond the requirements of the occupying household, and b) zoning policies that ensures that the units cannot be changed to match the changing requirements of the residents. The focus of the matching is not between apartment dwellers and empty nesters, but rather between the empty nesters and the newly nesters. The under utilization is of direct concern to growth management because the new nesters cannot move into the empty nest areas, not only because of price but also because the current occupants do not move. This means, without change in the empty nester ones, the newly nester will be accommodated on green field sites at the end of community infrastructure rather than in the underdeveloped existing service areas.

BC's Empty Bedrooms: June 1999 Page 19
T h e U r b a n F u t u r e s I n s t i t u t e T H E L A N D C E N T R E
The answer to the final question is yes, we should have a HomeSmart program that seeks to create a better match between housing needs; to better meet the needs of both empty and newly nesters. This means allowing faster adjustment in older neighbourhoods so that empty nesters can remain, but consume less housing, and newly nesters can begin to settle. The willingness of empty nesters to do so is already shown by the prominence of illegal suites in many older neighbourhoods. However, to attract the new nesters, a bigger adjustment is necessary so that they can own in the empty neighbourhood.
45%39%
48% 49%
31%
17%23%
36%46%
53%58% 61% 63% 67%
71% 74%
25%30%
26% 24%
29%
36%
35%
31%
26%
23%20% 18% 15%
14%14%
14%16% 18%13% 12%
19%
23%23%
18%15%
13%13% 12% 12% 12%
10% 9%7% 8% 6%6%
11% 15%12%
8% 7%5% 5% 5% 4% 4%6% 5% 6% 9% 9% 9% 8% 6% 7% 6% 4% 5%
Tot
al
5-9
10-
14
15-
19
20-
24
25-
29
30-
34
35-
39
40-
44
45-
49
50-
54
55-
59
60-
64
65-
69
70-
74
75
+
Figure 8: 1996 Population of British Columbia, 5 years of Age and Older, By Mobility Status
Did NotMove
Movedin Same
Municipality
Moved FromAnother
Municipalityin Province
Moved fromAnotherProvince
Moved From Another Country
The aging of traditional postwar housing patterns will become an increasingly important issue for many communities throughout the province. Just as the baby boom spurred the massive suburban housing boom of the 1950’s, the aging of this generation in to the “empty nester” stage of the lifecycle will have a significant impact on housing markets and land efficiency. Some of these empty nesters will move towards smaller dwelling forms such as small ground-oriented units or apartments in more urban settings. However, as Figure 8 shows, the vast majority will remain in the dwellings and communities where they raised their families. This process will perpetuate itself in the near future as the kids of the baby boom generation begin families, and contend with their parents, and their parents’ parents for housing that meets their needs.
The adjustment mechanism exists through choice, not coercion. One strategy would be to allow owners the outright permission to duplex or subdivide property after 10 years of participating in a homeowners grant. This would allow large suburban style lots to be divided into, for example, 25X80 foot lots, allowing housing to become more affordable, while increasing the overall occupancy within these neighbourhoods and providing an overall better match between housing needs and housing consumption. i In 1996 Statistics Canada tabulation for the average number of bedrooms per private dwelling has been randomly rounded to one decimal place, while the average number of persons per unit value was rounded to two decimal places. In order to make the calculation more representative of actual counts, the average number of bedrooms per dwelling unit statistic was randomly rounded back to two decimal places. ii Once again, in order to make the calculation more representative of actual counts, the average number of bedrooms per dwelling unit statistic was randomly rounded back to two decimal places.