British Columbia Seafood Industry 2013 Year in Review · British Columbia Seafood Industry | 2013...
20
BRITISH COLUMBIA SEAFOOD INDUSTRY YEAR IN REVIEW 2013
Transcript of British Columbia Seafood Industry 2013 Year in Review · British Columbia Seafood Industry | 2013...

BRITISH COLUMBIA SEAFOOD INDUSTRYYEAR IN REVIEW2013

ii British Columbia Seafood Industry | 2013 Y E A R I N R E V I E W
ISSN 1197-1649 (Print) ISSN 2368-1950 (Online)
Copyright © 2014, Province of British Columbia All rights reserved.

British Columbia Seafood Industry | 2013 Y E A R I N R E V I E W iii
Table of ContentsA message from the Minister of Agriculture 1
2013 Highlights 2
British Columbia Seafood Production 2004–2013 2British Columbia Seafood Production 2011–2013 3
Industry Performance 4
British Columbia’s Salmon Sector 5British Columbia’s Herring Sector 6British Columbia’s Groundfish Sector 7British Columbia’s Shellfish Sector 8British Columbia’s Other Seafood Sector 9
British Columbia’s Export Markets 10
British Columbia Seafood Top 5 Markets – Shares By Species 10
Significant Events in B.C.’s Seafood Sector – 2013/14 11

iv British Columbia Seafood Industry | 2013 Y E A R I N R E V I E W
British Columbia Seafood Industry | 2013 Y E A R I N R E V I E W 1
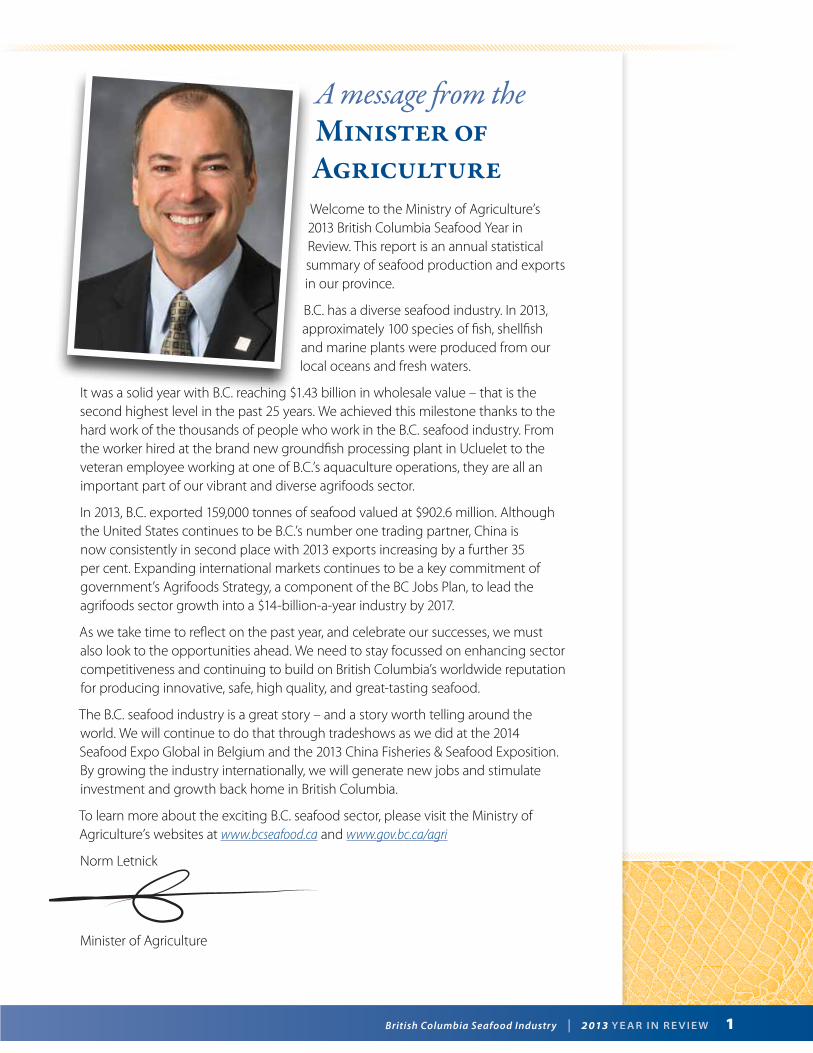
A message from the Minister of AgricultureWelcome to the Ministry of Agriculture’s 2013 British Columbia Seafood Year in Review. This report is an annual statistical summary of seafood production and exports in our province.
B.C. has a diverse seafood industry. In 2013, approximately 100 species of fish, shellfish and marine plants were produced from our local oceans and fresh waters.
It was a solid year with B.C. reaching $1.43 billion in wholesale value – that is the second highest level in the past 25 years. We achieved this milestone thanks to the hard work of the thousands of people who work in the B.C. seafood industry. From the worker hired at the brand new groundfish processing plant in Ucluelet to the veteran employee working at one of B.C.’s aquaculture operations, they are all an important part of our vibrant and diverse agrifoods sector.
In 2013, B.C. exported 159,000 tonnes of seafood valued at $902.6 million. Although the United States continues to be B.C.’s number one trading partner, China is now consistently in second place with 2013 exports increasing by a further 35 per cent. Expanding international markets continues to be a key commitment of government’s Agrifoods Strategy, a component of the BC Jobs Plan, to lead the agrifoods sector growth into a $14-billion-a-year industry by 2017.
As we take time to reflect on the past year, and celebrate our successes, we must also look to the opportunities ahead. We need to stay focussed on enhancing sector competitiveness and continuing to build on British Columbia’s worldwide reputation for producing innovative, safe, high quality, and great-tasting seafood.
The B.C. seafood industry is a great story – and a story worth telling around the world. We will continue to do that through tradeshows as we did at the 2014 Seafood Expo Global in Belgium and the 2013 China Fisheries & Seafood Exposition. By growing the industry internationally, we will generate new jobs and stimulate investment and growth back home in British Columbia.
To learn more about the exciting B.C. seafood sector, please visit the Ministry of Agriculture’s websites at www.bcseafood.ca and www.gov.bc.ca/agri
Norm Letnick
Minister of Agriculture

British Columbia Seafood Production2004-2013
Year Harvest ('000 tonnes)2004 341 2005 338 2006 308 2007 270 2008 256 2009 255 2010 267 2011 264 2012 235 2013 246
-
200
400
600
800
1,000
1,200
1,400
1,600
2004 2005 2006 2007 2008 2009 2010 2011 2012 2013
Wholesale Value ($ millions)
Landed Value ($ millions)
Harvest ('000 tonnes)
B.C. AGRIFOODS REVENUES 2013 ($ BILLIONS)Food and Beverage Processing 8.0 Agriculture 2.8 Seafood 0.8
11.6
Food and Beverage
Processing 8.0
Agriculture 2.8
Seafood 0.8
B.C. AGRIFOODS REVENUES 2013 ($ BILLIONS)
2 British Columbia Seafood Industry | 2013 Y E A R I N R E V I E W
2013 HighlightsBritish Columbia’s agrifoods sector includes primary production in agriculture, aquaculture and commercial fisheries, and processing of food and beverages. In 2013, the sector generated $11.6 billion in combined gross revenues and exported $2.7 billion worth of products to more than 140 markets.
This document focuses on the B.C. seafood sector. The provincial agriculture and food and beverage processing sectors are profiled in the B.C. Agrifood Industry Year in Review.
British Columbia’s seafood sector embraces opportunities to derive additional economic benefits from our fisheries resources. New harvesting vessels, state-of-the-art processing facilities and renewed fisheries arrangements coupled with the culturing of high-valued species and the ability to access new fisheries for underutilized species, have all contributed to the growth in B.C.’s seafood industry.
Around 100 species of fish, shellfish and marine plants were produced commercially from British Columbia’s marine and fresh waters in 2013. Provincial production totalled 245,800 tonnes with a landed value of $810.5 million. The commercial capture fisheries harvest of 155,400 tonnes was worth $300.2 million to the fishers, while aquaculture operations realized a farmgate value of $510.3 million from 90,400 tonnes of production.
British Columbia produced a range of 483 seafood commodities with a combined wholesale value of $1.43 billion - the second highest wholesale value in the last 25 years. In 2013, 159,000 tonnes of processed B.C. seafood was shipped to 62 export markets with a total value of $902.6 million.
Harvest: The round (whole) weight of the fish harvested from British Columbia capture fisheries and aquaculture operations. One tonne equals 2,204.6 pounds.
Landed Value: The price paid to commercial fishers and aquaculturists for the whole fish. In aquaculture this can also be referred to as farm gate value.
Wholesale Value: The value of the fish post-processing. All of the British Columbia harvest is included in the wholesale value as well as any fish imported from outside British Columbia that underwent significant processing within the province.
British Columbia Seafood Production 2004–2013
British Columbia Seafood Industry | 2013 Y E A R I N R E V I E W 3
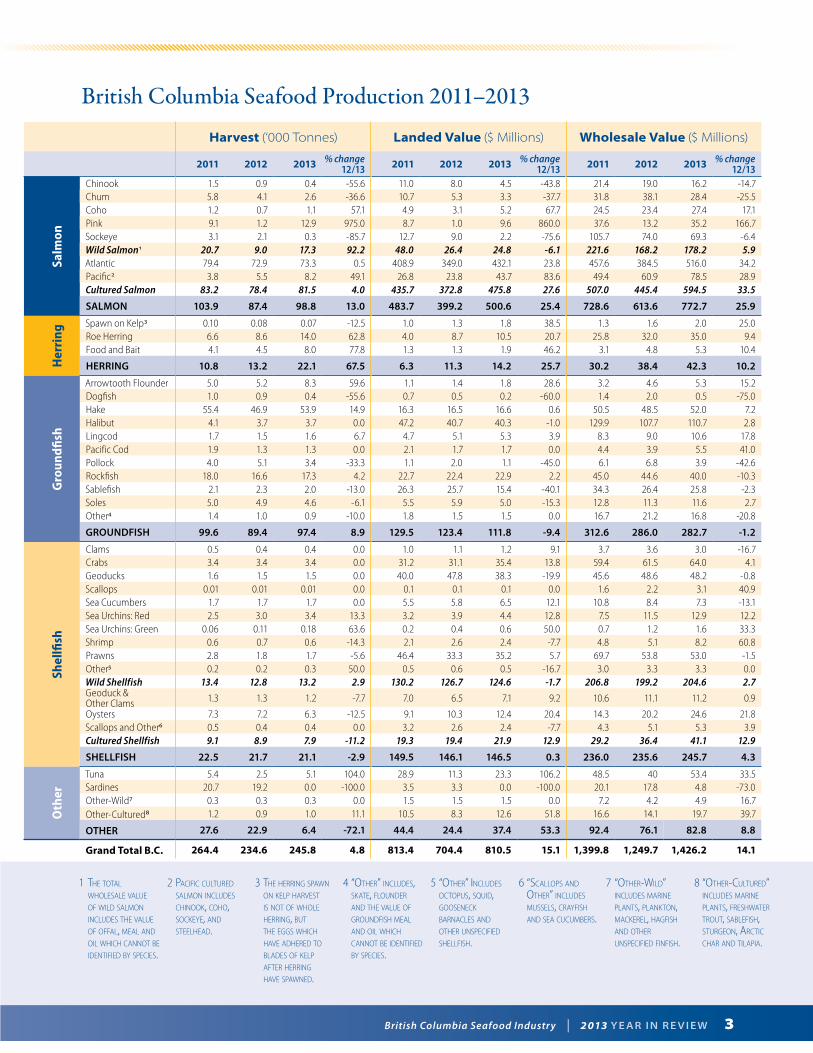
British Columbia Seafood Production 2011–2013
Harvest (‘000 Tonnes) Landed Value ($ Millions) Wholesale Value ($ Millions)
2011 2012 2013 % change 12/13 2011 2012 2013 % change
12/13 2011 2012 2013 % change 12/13
Salm
on
Chinook 1.5 0.9 0.4 -55.6 11.0 8.0 4.5 -43.8 21.4 19.0 16.2 -14.7Chum 5.8 4.1 2.6 -36.6 10.7 5.3 3.3 -37.7 31.8 38.1 28.4 -25.5Coho 1.2 0.7 1.1 57.1 4.9 3.1 5.2 67.7 24.5 23.4 27.4 17.1Pink 9.1 1.2 12.9 975.0 8.7 1.0 9.6 860.0 37.6 13.2 35.2 166.7Sockeye 3.1 2.1 0.3 -85.7 12.7 9.0 2.2 -75.6 105.7 74.0 69.3 -6.4Wild Salmon1 20.7 9.0 17.3 92.2 48.0 26.4 24.8 -6.1 221.6 168.2 178.2 5.9Atlantic 79.4 72.9 73.3 0.5 408.9 349.0 432.1 23.8 457.6 384.5 516.0 34.2Pacific2 3.8 5.5 8.2 49.1 26.8 23.8 43.7 83.6 49.4 60.9 78.5 28.9Cultured Salmon 83.2 78.4 81.5 4.0 435.7 372.8 475.8 27.6 507.0 445.4 594.5 33.5
SALMON 103.9 87.4 98.8 13.0 483.7 399.2 500.6 25.4 728.6 613.6 772.7 25.9
Herring
Spawn on Kelp3 0.10 0.08 0.07 -12.5 1.0 1.3 1.8 38.5 1.3 1.6 2.0 25.0Roe Herring 6.6 8.6 14.0 62.8 4.0 8.7 10.5 20.7 25.8 32.0 35.0 9.4Food and Bait 4.1 4.5 8.0 77.8 1.3 1.3 1.9 46.2 3.1 4.8 5.3 10.4
HERRING 10.8 13.2 22.1 67.5 6.3 11.3 14.2 25.7 30.2 38.4 42.3 10.2
Groun
dfish
Arrowtooth Flounder 5.0 5.2 8.3 59.6 1.1 1.4 1.8 28.6 3.2 4.6 5.3 15.2Dogfish 1.0 0.9 0.4 -55.6 0.7 0.5 0.2 -60.0 1.4 2.0 0.5 -75.0Hake 55.4 46.9 53.9 14.9 16.3 16.5 16.6 0.6 50.5 48.5 52.0 7.2Halibut 4.1 3.7 3.7 0.0 47.2 40.7 40.3 -1.0 129.9 107.7 110.7 2.8Lingcod 1.7 1.5 1.6 6.7 4.7 5.1 5.3 3.9 8.3 9.0 10.6 17.8Pacific Cod 1.9 1.3 1.3 0.0 2.1 1.7 1.7 0.0 4.4 3.9 5.5 41.0Pollock 4.0 5.1 3.4 -33.3 1.1 2.0 1.1 -45.0 6.1 6.8 3.9 -42.6Rockfish 18.0 16.6 17.3 4.2 22.7 22.4 22.9 2.2 45.0 44.6 40.0 -10.3Sablefish 2.1 2.3 2.0 -13.0 26.3 25.7 15.4 -40.1 34.3 26.4 25.8 -2.3Soles 5.0 4.9 4.6 -6.1 5.5 5.9 5.0 -15.3 12.8 11.3 11.6 2.7Other4 1.4 1.0 0.9 -10.0 1.8 1.5 1.5 0.0 16.7 21.2 16.8 -20.8
GROUNDFISH 99.6 89.4 97.4 8.9 129.5 123.4 111.8 -9.4 312.6 286.0 282.7 -1.2
Shellfish
Clams 0.5 0.4 0.4 0.0 1.0 1.1 1.2 9.1 3.7 3.6 3.0 -16.7Crabs 3.4 3.4 3.4 0.0 31.2 31.1 35.4 13.8 59.4 61.5 64.0 4.1Geoducks 1.6 1.5 1.5 0.0 40.0 47.8 38.3 -19.9 45.6 48.6 48.2 -0.8Scallops 0.01 0.01 0.01 0.0 0.1 0.1 0.1 0.0 1.6 2.2 3.1 40.9Sea Cucumbers 1.7 1.7 1.7 0.0 5.5 5.8 6.5 12.1 10.8 8.4 7.3 -13.1Sea Urchins: Red 2.5 3.0 3.4 13.3 3.2 3.9 4.4 12.8 7.5 11.5 12.9 12.2Sea Urchins: Green 0.06 0.11 0.18 63.6 0.2 0.4 0.6 50.0 0.7 1.2 1.6 33.3Shrimp 0.6 0.7 0.6 -14.3 2.1 2.6 2.4 -7.7 4.8 5.1 8.2 60.8Prawns 2.8 1.8 1.7 -5.6 46.4 33.3 35.2 5.7 69.7 53.8 53.0 -1.5Other5 0.2 0.2 0.3 50.0 0.5 0.6 0.5 -16.7 3.0 3.3 3.3 0.0Wild Shellfish 13.4 12.8 13.2 2.9 130.2 126.7 124.6 -1.7 206.8 199.2 204.6 2.7Geoduck & Other Clams 1.3 1.3 1.2 -7.7 7.0 6.5 7.1 9.2 10.6 11.1 11.2 0.9
Oysters 7.3 7.2 6.3 -12.5 9.1 10.3 12.4 20.4 14.3 20.2 24.6 21.8Scallops and Other6 0.5 0.4 0.4 0.0 3.2 2.6 2.4 -7.7 4.3 5.1 5.3 3.9Cultured Shellfish 9.1 8.9 7.9 -11.2 19.3 19.4 21.9 12.9 29.2 36.4 41.1 12.9
SHELLFISH 22.5 21.7 21.1 -2.9 149.5 146.1 146.5 0.3 236.0 235.6 245.7 4.3
Other
Tuna 5.4 2.5 5.1 104.0 28.9 11.3 23.3 106.2 48.5 40 53.4 33.5Sardines 20.7 19.2 0.0 -100.0 3.5 3.3 0.0 -100.0 20.1 17.8 4.8 -73.0Other-Wild7 0.3 0.3 0.3 0.0 1.5 1.5 1.5 0.0 7.2 4.2 4.9 16.7Other-Cultured8 1.2 0.9 1.0 11.1 10.5 8.3 12.6 51.8 16.6 14.1 19.7 39.7
OTHER 27.6 22.9 6.4 -72.1 44.4 24.4 37.4 53.3 92.4 76.1 82.8 8.8
Grand Total B.C. 264.4 234.6 245.8 4.8 813.4 704.4 810.5 15.1 1,399.8 1,249.7 1,426.2 14.1
1 The ToTal wholesale value of wild salmon includes The value of offal, meal and oil which cannoT be idenTified by species.
2 pacific culTured salmon includes chinook, coho, sockeye, and sTeelhead.
3 The herring spawn on kelp harvesT is noT of whole herring, buT The eggs which have adhered To blades of kelp afTer herring have spawned.
4 “oTher” includes, skaTe, flounder and The value of groundfish meal and oil which cannoT be idenTified by species.
5 “oTher” includes ocTopus, squid, gooseneck barnacles and oTher unspecified shellfish.
6 “scallops and oTher” includes mussels, crayfish and sea cucumbers.
7 “oTher-wild” includes marine planTs, plankTon, mackerel, hagfish and oTher unspecified finfish.
8 “oTher-culTured” includes marine planTs, freshwaTer TrouT, sablefish, sTurgeon, arcTic char and Tilapia.

!"#$%&'&
(")*%*+$"(,%
-!.(%&"(%+$"(,%-!.(%&"(%+$"(,%
(")*%*+$"(,%
Wild Salmon
17.3
Cultured Salmon
81.5
Herring 22.1
Ground sh 97.4
Cultured Shell sh
7.9
Wild Shell sh
13.2
Other Wild 5.4
Other Cultured
1.0
Wild Salmon
24.8
Cultured Salmon 475.8
Herring 14.2
Ground sh 111.8
Cultured Shell sh
21.9
Wild Shell sh
124.6
Other Wild 24.8
Other Cultured
12.6
Wild Salmon 178.2
Cultured Salmon 594.5
Herring 42.3
Ground sh 282.7
Cultured Shell sh
41.1
Wild Shell sh
204.6 Other
Wild 63.1
Other Cultured
19.7
HARVEST (‘000 TONNES)
LANDED VALUE ($ MILLIONS)
WHOLESALE VALUE ($ MILLIONS)
4 British Columbia Seafood Industry | 2013 Y E A R I N R E V I E W
Industry PerformanceIn 2013, British Columbia’s seafood sector experienced solid growth in harvest levels, the landed value of the harvest, the wholesale value of processed products and in export market values.
Harvest
In 2013, British Columbia’s seafood production of 245,800 tonnes was up five per cent from the previous year. The salmon harvest increased 13 per cent to 98,800 tonnes, the herring harvest increased 68 per cent to 22,100 tonnes, the groundfish harvest grew nine per cent to 97,400 tonnes and the wild shellfish harvest of 13,200 tonnes was up three per cent from 2012. Declines in harvest volumes were seen in both cultured shellfish (down 11 per cent to 7,900 tonnes) and “other” species (down 72 per cent to 6,400 tonnes).
Landed Value
British Columbia’s capture and culture operations combined to generate $810.5 million in landed value in 2013, a 15 per cent increase from 2012. Significant increases in landed value occurred in “other” species (up 53 per cent to $37.4 million), herring (up 26 per cent to $14.2 million), and salmon (up 25 per cent to $500.6 million). The landed value of shellfish increased slightly to $146.5 million, while groundfish declined nine per cent to $111.8 million.
Wholesale Value
The total wholesale value of British Columbia seafood products grew 14 per cent to $1.43 billion. Groundfish was the only species group with a decline in wholesale value in 2013, down one per cent to $282.7 million. All other groups showed notable increases: salmon up 26 per cent to $772.7 million, herring up 10 per cent to $42.3 million, shellfish up four per cent to $245.7 million, and “other” species up nine per cent to $82.8 million.
BRITISH COLUMBIA COMMERCIAL CAPTURE (WILD) AND CULTURED SEAFOOD PRODUCTION 2011 – 2013
Harvest (‘000 Tonnes) Landed Value ($ Millions) Wholesale Value ($ Millions)
2011 2012 2013 % change 12/13 2011 2012 2013 % change
12/13 2011 2012 2013 % change 12/13
Commercial Capture 170.9 146.4 155.4 6.1 347.9 303.9 300.2 -1.2 847.0 753.8 770.9 2.3
Cultured 93.5 88.2 90.4 2.5 465.5 400.5 510.3 27.4 552.8 495.9 655.3 32.1
Grand Total B.C. 264.4 234.6 245.8 4.8 813.4 704.4 810.5 15.1 1,399.8 1,249.7 1,426.2 14.1

SALMON STORY
Harvest ('000 tonnes)
Landed Value ($ Millions)
Wholesale Value ($ Millions)
Chinook 0.4 4.5 16.2Chum 2.6 3.3 28.4Coho 1.1 5.2 27.4Pink 12.9 9.6 35.2Sockeye 0.3 2.2 69.3Cultured Atlantics 73.3 432.1 516.0Cultured Pacifics 8.2 43.7 78.5Total 98.8 500.6 772.7
Chinook 0.4 Chum 2.6
Coho 1.1
Pink 12.9
Sockeye 0.3
Cultured Atlantics 73.3
Cultured Pacifics 8.2
SALMON HARVEST (‘000 TONNES)
Chinook 4.5 Chum 3.3
Coho 5.2 Pink 9.6
Sockeye 2.2
Cultured Atlantics 432.1
Cultured Pacifics 43.7
Chinook 16.2 Chum 28.4 Coho 27.4
Pink 35.2
Sockeye 69.3
Cultured Atlantics 516.0
Cultured Pacifics 78.5
SALMON WHOLESALE VALUE ($ MILLIONS)
Chinook 4.5 Chum 3.3
Coho 5.2 Pink 9.6
Sockeye 2.2
Cultured Atlantics 432.1
Cultured Pacifics 43.7
Chinook 16.2 Chum 28.4 Coho 27.4
Pink 35.2
Sockeye 69.3
Cultured Atlantics 516.0
Cultured Pacifics 78.5
SALMON WHOLESALE VALUE ($ MILLIONS)
SALMON LANDED VALUE ($ MILLIONS)
SALMON WHOLESALE VALUE ($ MILLIONS)
British Columbia Seafood Industry | 2013 Y E A R I N R E V I E W 5
British Columbia’s Salmon SectorSalmon products generated more than half of the total wholesale value of B.C. seafood.
Harvest
British Columbia’s salmon production, at 98,800 tonnes in 2013, increased by 13 per cent over 2012 and accounted for 40 per cent of all seafood production in the province. Cultured salmon production, at 81,500 tonnes, made up 82 per cent of B.C.’s total salmon harvest while the capture fisheries harvest of 17,300 tonnes made up the remainder.
Cultured Atlantic salmon contributed 30 per cent of the provincial seafood harvest and 74 per cent of the total salmon harvest. Wild pink salmon experienced a high-cycle year in 2013, showing a 42 per cent increase over 2011 (the most recent high-cycle year) to 12,900 tonnes. Harvests of other wild salmon species fluctuated dramatically with coho up and chinook, chum and sockeye catches down in 2013 due to changes in abundance and harvest allocations. Production of cultured Pacific salmon (coho and chinook) rose by 49 per cent in 2013.
Landed Value
The landed value of the salmon harvest was up 25 per cent in 2013 to $500.6 million. The 28 per cent increase in landed value for cultured salmon was due primarily to stronger market prices. Fluctuations in landed values for the wild salmon species echoed the changes in harvest levels with an overall decline of six per cent. Cultured salmon generated $475.8 million, representing 95 per cent of the total landed value of B.C. salmon, while capture fisheries at $24.8 million generated the remaining five per cent.
Wholesale Value
Salmon products generated a total wholesale value of $772.7 million in 2013, a 26 per cent increase from 2012. This increase was driven mainly by the 34 per cent increase in cultured salmon wholesale value to $594.5 million. Cultured salmon products accounted for 77 per cent of the total 2013 salmon wholesale value, while capture salmon products, which totaled $178.2 million, accounted for the remainder. Sockeye salmon was the dominant species in the wild salmon sector and at $69.3 million contributed a notable 39 per cent share of the total wholesale value of wild salmon.
Food & Bait 8.0
Spawn on Kelp 0.1
Roe Herring 14.0
HERRING HARVEST ('000 TONNES)
Food & Bait 1.9 Spawn on Kelp 1.8
Roe Herring 10.5
HERRING LANDED VALUE ($ MILLIONS)
Food & Bait 5.3 Spawn on Kelp 2.0
Roe Herring 35.0
HERRING WHOLESALE VALUE ($ MILLIONS)
HERRING HARVEST (‘000 TONNES)
Food & Bait 8.0
Spawn on Kelp 0.1
Roe Herring 14.0
HERRING HARVEST ('000 TONNES)
Food & Bait 1.9 Spawn on Kelp 1.8
Roe Herring 10.5
HERRING LANDED VALUE ($ MILLIONS)
Food & Bait 5.3 Spawn on Kelp 2.0
Roe Herring 35.0
HERRING WHOLESALE VALUE ($ MILLIONS)
HERRING LANDED VALUE ($ MILLIONS)
Food & Bait 8.0
Spawn on Kelp 0.1
Roe Herring 14.0
HERRING HARVEST ('000 TONNES)
Food & Bait 1.9 Spawn on Kelp 1.8
Roe Herring 10.5
HERRING LANDED VALUE ($ MILLIONS)
Food & Bait 5.3 Spawn on Kelp 2.0
Roe Herring 35.0
HERRING WHOLESALE VALUE ($ MILLIONS) HERRING WHOLESALE VALUE ($ MILLIONS)
6 British Columbia Seafood Industry | 2013 Y E A R I N R E V I E W
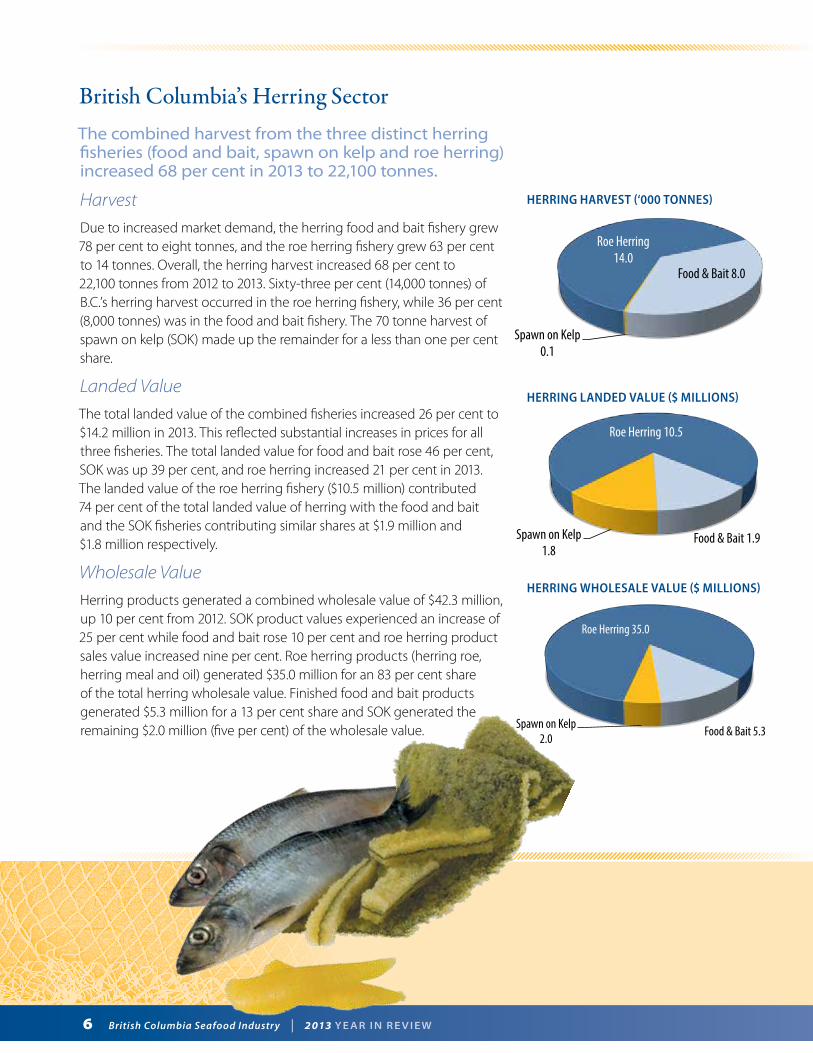
British Columbia’s Herring SectorThe combined harvest from the three distinct herring fisheries (food and bait, spawn on kelp and roe herring) increased 68 per cent in 2013 to 22,100 tonnes.
Harvest
Due to increased market demand, the herring food and bait fishery grew 78 per cent to eight tonnes, and the roe herring fishery grew 63 per cent to 14 tonnes. Overall, the herring harvest increased 68 per cent to 22,100 tonnes from 2012 to 2013. Sixty-three per cent (14,000 tonnes) of B.C.’s herring harvest occurred in the roe herring fishery, while 36 per cent (8,000 tonnes) was in the food and bait fishery. The 70 tonne harvest of spawn on kelp (SOK) made up the remainder for a less than one per cent share.
Landed Value
The total landed value of the combined fisheries increased 26 per cent to $14.2 million in 2013. This reflected substantial increases in prices for all three fisheries. The total landed value for food and bait rose 46 per cent, SOK was up 39 per cent, and roe herring increased 21 per cent in 2013. The landed value of the roe herring fishery ($10.5 million) contributed 74 per cent of the total landed value of herring with the food and bait and the SOK fisheries contributing similar shares at $1.9 million and $1.8 million respectively.
Wholesale Value
Herring products generated a combined wholesale value of $42.3 million, up 10 per cent from 2012. SOK product values experienced an increase of 25 per cent while food and bait rose 10 per cent and roe herring product sales value increased nine per cent. Roe herring products (herring roe, herring meal and oil) generated $35.0 million for an 83 per cent share of the total herring wholesale value. Finished food and bait products generated $5.3 million for a 13 per cent share and SOK generated the remaining $2.0 million (five per cent) of the wholesale value.
Arrowtooth Flounder 8.3 Dogfish 0.4
Hake 53.9
Halibut 3.7 Lingcod 1.6 Pacific Cod 1.3
Pollock 3.4
Rockfish 17.3
Sablefish 2.0
Soles 4.6
Other 0.9
Arrowtooth Flounder 1.8
Dogfish 0.2
Hake 16.6
Halibut 40.3
Lingcod 5.3 Pacific Cod
1.7
Pollock 1.1 Rockfish 22.9
Sablefish 15.4
Soles 5.0 Other
1.5
Arrowtooth Flounder 5.3
Dogfish 0.5
Hake 52.0
Halibut 110.7
Lingcod 10.6
Pacific Cod 5.5
Pollock 3.9
Rockfish 40.0
Sablefish 25.8 Soles 11.6 Other 16.8
GROUNDFISH HARVEST (‘000 TONNES)
GROUNDFISH LANDED VALUE ($ MILLIONS)
GROUNDFISH WHOLESALE VALUE ($ MILLIONS)
British Columbia Seafood Industry | 2013 Y E A R I N R E V I E W 7
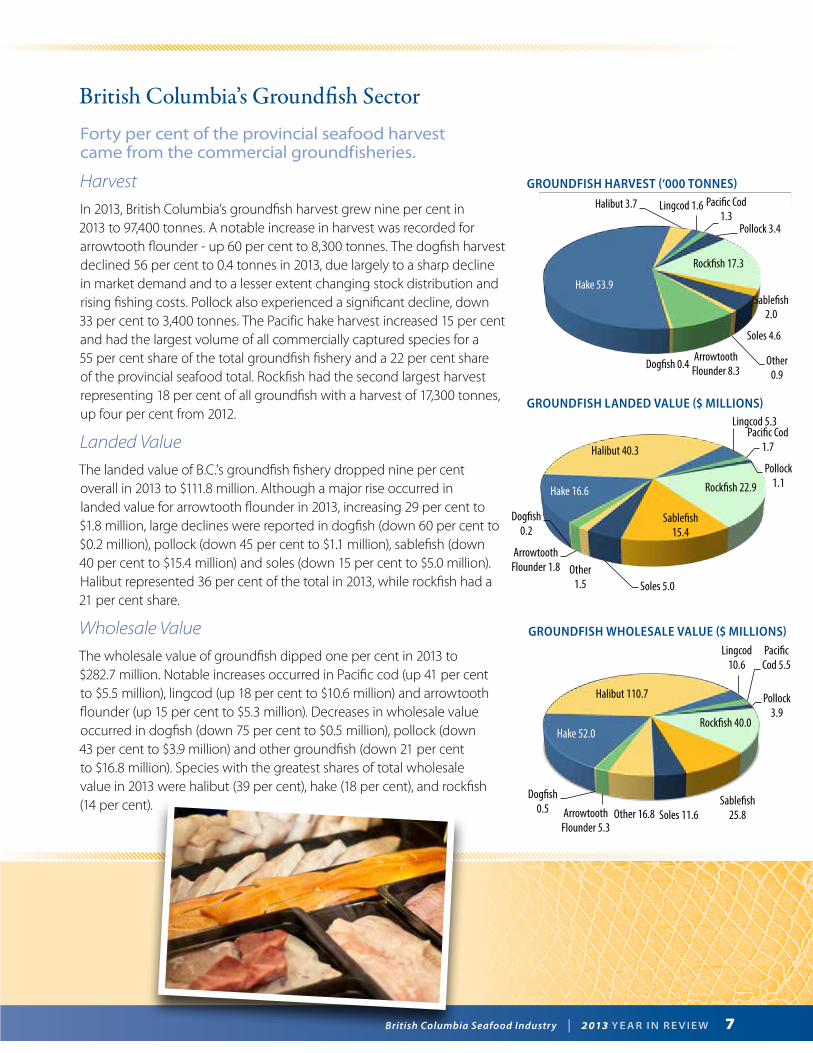
British Columbia’s Groundfish SectorForty per cent of the provincial seafood harvest came from the commercial groundfisheries.
Harvest
In 2013, British Columbia’s groundfish harvest grew nine per cent in 2013 to 97,400 tonnes. A notable increase in harvest was recorded for arrowtooth flounder - up 60 per cent to 8,300 tonnes. The dogfish harvest declined 56 per cent to 0.4 tonnes in 2013, due largely to a sharp decline in market demand and to a lesser extent changing stock distribution and rising fishing costs. Pollock also experienced a significant decline, down 33 per cent to 3,400 tonnes. The Pacific hake harvest increased 15 per cent and had the largest volume of all commercially captured species for a 55 per cent share of the total groundfish fishery and a 22 per cent share of the provincial seafood total. Rockfish had the second largest harvest representing 18 per cent of all groundfish with a harvest of 17,300 tonnes, up four per cent from 2012.
Landed Value
The landed value of B.C.’s groundfish fishery dropped nine per cent overall in 2013 to $111.8 million. Although a major rise occurred in landed value for arrowtooth flounder in 2013, increasing 29 per cent to $1.8 million, large declines were reported in dogfish (down 60 per cent to $0.2 million), pollock (down 45 per cent to $1.1 million), sablefish (down 40 per cent to $15.4 million) and soles (down 15 per cent to $5.0 million). Halibut represented 36 per cent of the total in 2013, while rockfish had a 21 per cent share.
Wholesale Value
The wholesale value of groundfish dipped one per cent in 2013 to $282.7 million. Notable increases occurred in Pacific cod (up 41 per cent to $5.5 million), lingcod (up 18 per cent to $10.6 million) and arrowtooth flounder (up 15 per cent to $5.3 million). Decreases in wholesale value occurred in dogfish (down 75 per cent to $0.5 million), pollock (down 43 per cent to $3.9 million) and other groundfish (down 21 per cent to $16.8 million). Species with the greatest shares of total wholesale value in 2013 were halibut (39 per cent), hake (18 per cent), and rockfish (14 per cent).

Cultured Clams 1.2
Cultured Oysters 6.3
Cultured Scallops and
Other 0.4
Wild Clams 0.4
Crabs 3.4
Wild Geoducks
1.5
Wild Scallops 0.01
Sea Cucumbers
1.7
Red Sea Urchins 3.4
Green Sea Urchins 0.2 Shrimp 0.6
Prawns 1.7
Wild Other
0.3
Cultured Clams 7.1
Cultured Oysters 12.4
Cultured Scallops and
Other 2.4 Wild Clams 1.2
Crabs 35.4
Wild Geoducks 38.3
Wild Scallops 0.1
Sea Cucumbers 6.5
Red Sea Urchins 4.4
Green Sea Urchins 0.6
Shrimp 2.4
Prawns 35.2 Wild Other 0.5
Cultured Clams 11.2
Cultured Oysters 24.6 Cultured
Scallops and Other 5.3
Wild Clams 3.0
Crabs 64.0
Wild Geoducks 48.2
Wild Scallops 3.1
Sea Cucumbers 7.3
Red Sea Urchins 12.9
Green Sea Urchins 1.6
Shrimp 8.2
Prawns 53.0 Wild Other 3.3
SHELLFISH HARVEST (‘000 TONNES)
SHELLFISH LANDED VALUE ($ MILLIONS)
SHELLFISH WHOLESALE VALUE ($ MILLIONS)
8 British Columbia Seafood Industry | 2013 Y E A R I N R E V I E W
British Columbia’s Shellfish SectorThe wholesale value of B.C. shellfish products increased four per cent to $245.7 million.
Harvest
In 2013, the total shellfish harvest declined three per cent to 21,100 tonnes. Cultured shellfish production decreased 11 per cent to 7,900 tonnes, while the capture shellfish harvest grew three per cent to 13,200 tonnes. Green sea urchins and shellfish in the “wild other” category showed particularly large increases. In 2013, cultured oysters made up the largest share of the provincial shellfish harvest at 30 per cent, followed by crabs and red sea urchins at 16 per cent each, and prawns and sea cucumbers each contributing eight per cent.
Landed Value
Shellfish accounted for 18 per cent of the total landed value of B.C. seafood in 2013. Compared to 2012, the total landed value of B.C. shellfish increased less than one per cent to $146.5 million in 2013. Cultured shellfish operations generated $21.9 million (up 13 per cent) and wild shellfish fisheries generated $124.6 million (down two per cent). Large increases were seen in green urchins and cultured oysters, while large decreases were seen in wild geoducks and “wild other” shellfish. Wild geoducks (26 per cent), crabs (24 per cent) and prawns (24 per cent) contributed the highest shares of all shellfish species.
Wholesale Value
The wholesale value of B.C. shellfish products increased four per cent to $245.7 million in 2013. Cultured shellfish increased 13 per cent to $41.1 million, while wild shellfish increased three per cent to $204.6 million. Large increases were seen in shrimp, wild scallops, green sea urchins and cultured oysters, while a large decline occurred in wild clams. In 2013, the wholesale value of wild shellfish products generated $204.6 million and accounted for 83 per cent of total B.C. shellfish sales while cultured shellfish, at $41.1 million, accounted for the remaining 17 per cent. Crabs, prawns, and wild geoducks contributed the highest shares of all shellfish at 26, 22 and 20 per cent, respectively.

British Columbia Seafood Industry | 2013 Y E A R I N R E V I E W 9
British Columbia’s Other Seafood SectorSix per cent of British Columbia’s seafood wholesale value was derived from value-added niche products such as sturgeon caviar, dried marine micro-algae and frozen hagfish.
In 2013, 6,400 tonnes of lesser known or less abundant species in both capture and culture fisheries were harvested. With a combined landed value of $37.4 million, these species generated an above average value-added markup of 221 per cent. The wholesale value of high-valued processed products rose nine per cent to $82.8 million in 2013.
Albacore tuna contributed the largest harvest in this group in 2013, at 5,100 tonnes worth $23.3 million to the fishers and processed products worth $53.4 million in wholesale value. The large increases in harvest (104 per cent), landed value (106 per cent) and wholesale value (34 per cent) in 2013 over 2012, resulted from regained access to tuna in U.S. waters under the Canada-US Pacific Albacore Treaty.
In 2013, a significant decline in the North Pacific sardine population resulted in no harvest for B.C. fishers. The average landed tonnage for sardines from 2008 to 2012 had been 17,577 tonnes. With no domestic fishery in 2013, the wholesale value of sardines ($4.8 million) was derived from imported sardines value-added by processors in the province.
The primary species included in the “other-wild” and “other-cultured” categories were marine plants, mackerel, freshwater trout, sablefish, sturgeon, Arctic char, tilapia and hagfish. The combined harvest from these species was 1,300 tonnes (up eight per cent over 2012), with a landed value of $14.1 million (up 44 per cent), and a wholesale value of $24.6 million (up 34 per cent).
The hagfish fishery is new and developing and began in 2013 on the West Coast of Vancouver Island. One three-year experimental licence was issued by Fisheries and Oceans Canada to conduct a stock assessment and biological sampling program. Once the program has been completed, an evaluation of the experimental fishery will be done to determine if the stocks are large enough to warrant an expansion of the fishery.

BRITISH COLUMBIA SEAFOOD TOP 5 MARKETS -‐ SHARES BY SPECIESGroup Farmed Salmon Groundfish Herring/Pelagics Shellfish Wild SalmonUkraine 0 25116248 0 0 821101Hong Kong 141573 597834 15361 39940680 1091983Japan 12015231 12070235 27005117 37403679 15129400China 1622198 18320064 13878946 115009691 13944513United States 269656987 47318918 21284850 31519332 59256324
0% 10% 20% 30% 40% 50% 60% 70% 80% 90% 100%
Ukraine
Hong Kong
Japan
China
United States Farmed Salmon Groundfish Herring/Pelagics Shellfish Wild Salmon Other Products
!"#"$%&'())*$&+,)-.%$/0$12332)4%5#67869:;$'87<=8>?$%<7@A= BCD"E#9<F GH"IJ<K: CE"LM:A;6?K$#7<@N OD"C%P9>@Q$<=;$,9<R=N OC"BJ:99>=S TD"LU>7;$<=;$#67869:;$#P>=AAK$%<7@A=TH"E,>=K$%<7@A= TH"HJ<7>F68 BC"E)8P:9 BCL"D
GHB"C
Cultured Atlantic Salmon
267.1 Crab 90.8
Hake 61.5
Geoduck Clams 47.6
Shrimp and Prawns 46.2
Herring 37.5 Wild and Cultured Chinook
Salmon 30.1
Pink Salmon
30.0
Halibut 26.1
Other 265.7
B.C. SEAFOOD EXPORTS ($ MILLIONS) B.C. SEAFOOD EXPORTS ($ MILLIONS)
10 British Columbia Seafood Industry | 2013 Y E A R I N R E V I E W
British Columbia’s Export MarketsIn 2013 B.C. exported 159,000 tonnes of seafood valued at $902.6 million.
In 2013, five markets accounted for more than 89 per cent of B.C.’s seafood exports: United States (52 per cent worth $470.7 million), China (18 per cent worth $163.0 million), Japan (12 per cent worth $105.1 million), Hong Kong (five per cent worth $42.4 million) and the Ukraine (three per cent worth $26.0 million).
The United States continued to be B.C.’s number one trading partner in 2013. For the past four years China has been the second-most important market for B.C. seafood and in 2013 exports to China increased another 35 per cent.
Among the major categories of seafood products, herring exports rose by 11 per cent to $37.5 million in 2013, shellfish rose by 16 per cent to $235.7 million and groundfish increased by four per cent to $135.1 million. Cultured salmon exports decreased by five per cent to $287.9 million and wild salmon exports increased by eight per cent to $129.2 million.
Five species generated 57 per cent of B.C.’s total seafood export value: cultured Atlantic salmon (30 per cent), wild crab (ten per cent), wild hake (seven per cent), cultured and wild geoduck clams (five per cent) and wild shrimp and prawns (five per cent).
B.C. seafood products with notable increases in export value from 2012 to 2013 were wild pink salmon (up 82 per cent to $30.0 million), tuna (up 74 per cent to $25.8 million), crab (up 26 per cent to $90.8 million), and shrimp and prawns (up 23 per cent to $46.2 million). In 2013, British Columbia’s most widely exported species included pink salmon (25 markets), chum salmon (22 markets), crab (16 markets) and hake (16 markets).
British Columbia Seafood Top 5 Markets – Shares By Species

British Columbia Seafood Industry | 2013 Y E A R I N R E V I E W 11
Significant Events in B.C.’s Seafood Sector – 2013/14International Promotion of B.C. Seafood
In June 2014, the Minister of Agriculture led a B.C. delegation on a highly successful trade mission to China, B.C’s second-largest export market. The Ministry of Agriculture also sponsored a booth at the 2014 Seafood Expo Global in Brussels, Belgium, showcasing B.C. seafood products to buyers around the globe, and in coordination with the Ministry of International Trade participated at the 2014 Seafood Expo North America and the 2013 China Fisheries and Seafood Exposition. The mission and trade shows were supported by Growing Forward 2 funding. Well attended by B.C. seafood industry representatives and international buyers, the events provided an opportunity to develop and strengthen relationships in the international market.
More information:
î Trade delegation to China www.newsroom.gov.bc.ca/2014/06/bcs-agrifoods-reputation-grows-stronger-in-china.html
î China Fisheries and Seafood Exposition: Dalian, China www.chinaseafoodexpo.com
î Seafood Expo Global: Brussels, Belgium www.seafoodexpo.com/global
î Seafood Expo North America: www.seafoodexpo.com/north-america
Closed Containment Aquaculture
The Namgis First Nation’s Land-Based Atlantic Salmon Recirculating Aquaculture System Pilot Project near Port McNeill is being developed to demonstrate the economic feasibility of this technology. The operation reached a major milestone in March 2014 when it began harvesting its first market-sized fish under the brand name “Kuterra”. More information: www.namgis.bc.ca/ccp/Pages/default.aspx
Aquaculture Collaborative Research and Development Program (ACRDP)
The ACRDP is a Federal Government initiative to increase the level of collaborative research and development activity between the aquaculture industry and Fisheries and Oceans Canada (DFO). The program pairs industry with DFO researchers to undertake research activities that lie within DFO’s mandate but are based on the aquaculture industry’s needs and priorities. In 2013/14, ACRDP provided funding for six Pacific Region projects, totalling $395,000.
More information:
www.dfo-mpo.gc.ca/science/enviro/aquaculture/acrdp-pcrda/projects/projects-eng.asp?region=p
12 British Columbia Seafood Industry | 2013 Y E A R I N R E V I E W
International Fisheries Treaties and Agreements
Canada participates in international fisheries treaties agreements as a mechanism for conservation and effective management of fisheries stocks. Major treaties that underwent changes in 2013/14 include:
î SALMON: Renegotiation of several chapters of the Pacific Salmon Treaty including those for Fraser River sockeye and pink salmon;
î HALIBUT: Renegotiation of the International Pacific Halibut Commission catch limits for 2014;
î HAKE: Coast-wide adjustment of total allowable catch (TAC) by the Hake Joint Management Committee resulting in a 16 per cent increase in Canada’s TAC over 2013; and
î TUNA: Following the suspension of the fishing arrangement for 2012 under the Canada-United States Pacific Albacore Tuna Treaty, parties reached agreement on a three-year fishing arrangement in April 2014.
Sustainable Seafood
In 2013, three more British Columbia fisheries were certified by the Marine Stewardship Council (MSC) as sustainable. The Fraser, Inner South Coast and West Coast Vancouver Island chum salmon fisheries achieved MSC certification in January 2013. British Columbia has six species harvested in 13 fisheries holding MSC certification: Pacific halibut, hake, albacore tuna, sockeye salmon, pink salmon and now chum salmon.
More information: www.msc.org/track-a-fishery/fisheries-in-the-program/certified/pacific

For more information on the species and products supplied by the British Columbia seafood industry to the global market visit us at www.bcseafood.ca
F R O M C A N A D A S P A C I F I C C O A S T
Chinook Salmon
Chum Salmon
Coho Salmon
Pink Salmon
Sockeye Salmon
Albacore Tuna
Herring & Sardines
Farmed Atlantic Salmon
Farmed Chinook Salmon
Crabs
Geoduck
Prawn & Shrimp
Wild Scallops
Sea Cucumber
Sea Urchins
Farmed Clams
Farmed Oysters
Farmed Scallops
Arrowtooth
Dogfish
Hake
Halibut Lingcod Pacific Cod Pollock Rockfish
Sablefish Soles
Marine Stewardship Council (MSC) certified fisheries.
For more information on the MSC visit www.msc.org.
WIL
D A
ND
FA
RM
ED F
INFI
SH
WIL
D A
ND
FA
RM
ED S
HEL
LFIS
H
GR
OU
ND
FISH
A Taste of the Pristine
FOLLOW BCSEAFOOD TWITTERLIKE SEAFOODBC FACEBOOK
BRIT ISH COLUMBIA SEAFOOD. . . A COMMITMENT TO QUALITY AND SUSTAINABILITY
British Columbia Seafood Industry | 2013 Y E A R I N R E V I E W 13

14 British Columbia Seafood Industry | 2013 Y E A R I N R E V I E W
Data Sources
î All aquaculture industry harvests and farm-gate values compiled by the Ministry of Agriculture (2011) and Fisheries and Oceans Canada, Pacific Region (2012 and 2013).
î All seafood finished products and wholesale values compiled by the Ministry of Agriculture.
î All capture fisheries landings provided by Fisheries and Oceans Canada, Pacific Region.
î Export data provided by Statistics Canada and Global Trade Atlas.
Contact Information
This report is available online at www.bcseafood.ca
For more information on B.C. seafood products and suppliers please contact:
Ministry of Agriculture PO Box 9120 Stn Prov Gov Victoria, B.C. V8W 9B4
Email: [email protected]
For more information on B.C.’s agrifood industry, please visit www.agf.gov.bc.ca/stats
August 2014