
British Columbia Labour Market Outlook - WordPress.com · will serve educators, counsellors,...
34
Transcript of British Columbia Labour Market Outlook - WordPress.com · will serve educators, counsellors,...

British Columbia 2022 Labour Market Outlook
1British Columbia 2022 Labour Market Outlook
CONTENTS
INTRODUCTION . . . . . . . . . . . . . . . . . . . . . . . . . . . . . . . . . . . . . . . . . . . . . . . . . . . . . . . . . . . 2
B.C. LABOUR MARKET Outlook . . . . . . . . . . . . . . . . . . . . . . . . . . . . . . . . . . . . . . . . . . . . 4
EDUCATION and TRAINING NEEDS . . . . . . . . . . . . . . . . . . . . . . . . . . . . . . . . . . . . . . . . 6
COMPONENTS of LABOUR SUPPLY . . . . . . . . . . . . . . . . . . . . . . . . . . . . . . . . . . . . . . . . 7
OCCUPATIONAL OUTLOOK . . . . . . . . . . . . . . . . . . . . . . . . . . . . . . . . . . . . . . . . . . . . . . . . 8
REGIONAL OUTLOOK . . . . . . . . . . . . . . . . . . . . . . . . . . . . . . . . . . . . . . . . . . . . . . . . . . . . 10
Vancouver Island / Coast . . . . . . . . . . . . . . . . . . . . . . . . . . . . . . . . . . . . . . . . . . . . . . . . . . . . . . . . 11
Mainland / Southwest . . . . . . . . . . . . . . . . . . . . . . . . . . . . . . . . . . . . . . . . . . . . . . . . . . . . . . . . . . 12
Thompson–Okanagan . . . . . . . . . . . . . . . . . . . . . . . . . . . . . . . . . . . . . . . . . . . . . . . . . . . . . . . . . 13
Kootenay . . . . . . . . . . . . . . . . . . . . . . . . . . . . . . . . . . . . . . . . . . . . . . . . . . . . . . . . . . . . . . . . . . . . . . . 14
Cariboo . . . . . . . . . . . . . . . . . . . . . . . . . . . . . . . . . . . . . . . . . . . . . . . . . . . . . . . . . . . . . . . . . . . . . . . . . 15
North Coast and Nechako . . . . . . . . . . . . . . . . . . . . . . . . . . . . . . . . . . . . . . . . . . . . . . . . . . . . . . 16
Northeast . . . . . . . . . . . . . . . . . . . . . . . . . . . . . . . . . . . . . . . . . . . . . . . . . . . . . . . . . . . . . . . . . . . . . . . 17
BC LNG WORKFORCE OCCUPATION Forecast . . . . . . . . . . . . . . . . . . . . . . . . . . . . . . . 18
CONCLUSION . . . . . . . . . . . . . . . . . . . . . . . . . . . . . . . . . . . . . . . . . . . . . . . . . . . . . . . . . . . . 22
APPENDIX 1: Provincial Labour Market Outlook Summary Data . . . . . . . . . . . . . . . 23
APPENDIX 2: Jobs in Demand: Top 60 . . . . . . . . . . . . . . . . . . . . . . . . . . . . . . . . . . . . . . . 24
APPENDIX 3: Methodology and Assumptions . . . . . . . . . . . . . . . . . . . . . . . . . . . . . . . . . 29
INTRODUCTIONIn B.C.’s Skills for Jobs Blueprint: Re-Engineering Education and Training, we said we
would get and use better data to drive decisions. This B.C. Labour Market Outlook
(the Outlook) is that data. Presented by the Ministry of Jobs, Tourism, and Skills
Training and Responsible for Labour (the Ministry), the Outlook provides labour
market demand and supply trends to 2022.
With the anticipated investment and activity related to LNG, the Ministry contracted
KPMG to produce labour market forecasts for the LNG sector. The resulting LNG
workforce occupation forecasts are added as a supplementary analysis of workforce
needs in the Outlook and are aimed at providing a better understanding of the
skills needs for this new sector. This Outlook report includes two major parts:
THE FIRST PART provides the labour market outlook based on an economic
scenario without LNG; and THE SECOND PART highlights the findings of the
LNG workforce occupation forecasts.
Reliable and up-to-date data give us the information we need to make the best
decisions for education and industry. While information on labour market-trends
will serve educators, counsellors, students and their families, it can also serve as
a compass for the unemployed and underemployed, who can fill jobs immediately.
This data is based on the B.C. Labour Market Scenario Model (the Model) which was
developed in 2009. The Model incorporated demographic changes, industry growth,
major projects and other relevant information. Both the Model and the KPMG LNG
labour market forecasts have been vetted by our industry partners to ensure the
validity of the information. The Labour Market Priorities Board has also endorsed
the relevance of both forecasts as the foundation for program and funding decisions
across government ministries.
We committed to publishing up-to-date labour market information each quarter
for priority sectors. These updates will be based on this annual report and will
include information on changing economic and labour market conditions.
2 British Columbia 2022 Labour Market Outlook
Finally, our decision-making needs to be responsive. This means two streams
of action. Firstly, as our economy grows, the data will change as a result. As the
data change, government decision-making will reflect those changes. Secondly,
we will track and report on the outcomes of decisions made. For example, this
data is already driving the realignment of funding to programs for high-demand
occupations at post-secondary institutions. These funds will be re-directed again
if programs do not meet measurable outcomes that align with labour market needs.
Students, and all British Columbians, deserve to be employed, industry deserves
a reliable workforce and British Columbians deserve a growing economy. This
information is an important tool for that future.
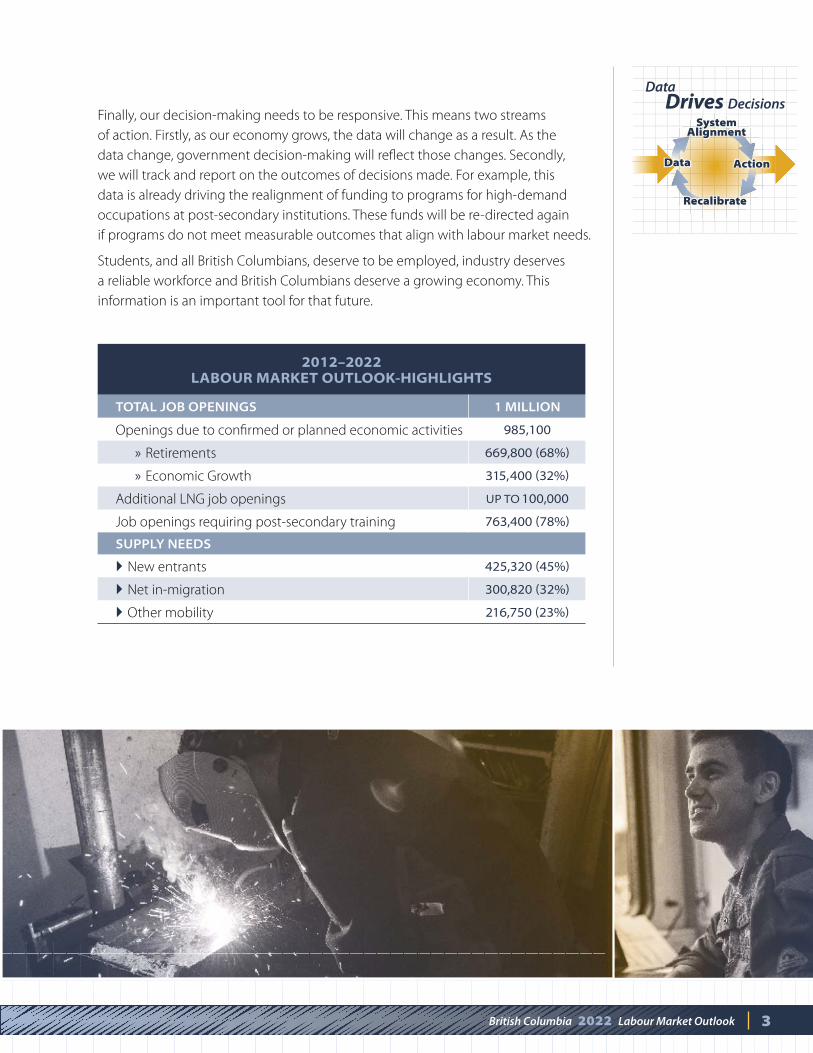
2012–2022 LABOUR MARKET OUTLOOK-HIGHLIGHTS
TOTAL JOB OPENINGS 1 MILLION
Openings due to confirmed or planned economic activities 985,100
» Retirements 669,800 68%
» Economic Growth 315,400 32%
Additional LNG job openings UP TO 100,000
Job openings requiring post-secondary training 763,400 78%
SUPPLY NEEDS
New entrants 425,320 45%
Net in-migration 300,820 32%
Other mobility 216,750 23%
3British Columbia 2022 Labour Market Outlook
Data Drives Decisions
DataData
RecalibrateRecalibrate
ActionAction
SystemAlignment
SystemAlignment

4 British Columbia 2022 Labour Market Outlook
B.C. LABOUR MARKET Outlook
This section of the report provides labour market demand and supply forecasts for
B.C. and its regions to 2022, based on output from the B.C. Labour Market Scenario
Model (the Model). This forecasting work is conducted in consultation with BC
Stats and the Ministry of Finance. The occupational forecast in this section does
not incorporate potential LNG projects.
The Model was developed by the Province in 2009 to improve labour market
decision-making. Information from the Model helps citizens, employers and
government to forecast occupation demand and supply. The Outlook seeks to
identify significant labour market trends, based on statistical data, assumptions,
and consultation with industry and other
stakeholders. Within particular occupations
and regions there may be unique conditions
that are not captured in the analysis.
Assumptions and conditions may also change
over time. Thus, despite best efforts, actual
conditions may differ from those presented in
the Outlook.
The Model is updated every year.
Improvements are incorporated into each
cycle. Details of changes for the cycle are
provided in Appendix 3. Key Model outputs,
demand and supply by occupation, are
determined using two sets of models. The
first set of models contains seven regional
macroeconomic models and the second
set contains seven regional occupational
demand and supply models. Occupations
are defined based on the three-digit National
Occupational Classification (NOC) from
Employment and Social Development Canada.
Over ONE MILLION total
job openings are expected in B.C.
to 2022, including 985,000
from economic activity already
confirmed or planned, as well as
up to 100,000 jobs from the
expected LNG activity.
KEY DATA SOURCES
ECONOMIC AND LABOUR MARKET PROJECTIONS:
2013 / 2014–2015 / 2016
Budget and Fiscal Plan:
June 2013 Update
(B.C. Ministry of Finance)
ECONOMIC ACCOUNTS:
B.C. Economic Accounts
(Statistics Canada)
MAJOR PROJECTS INFORMATION:
Major Projects Inventory
(B.C. Ministry of Jobs,
Tourism, and Skills Training
and Responsible
for Labour)
POPULATION ESTIMATES AND PROJECTIONS:
BC Stats
LABOUR FORCE INFORMATION:
Labour Force Survey
(Statistics Canada)
National Household Survey
2011 (Statistics Canada)
Funding for the Model has been provided by the Canada-British Columbia Labour Market Agreement and the Province of British Columbia.
5British Columbia 2022 Labour Market Outlook
B.C. LABOUR MARKET Outlook CONTINUED
The seven development regions include Vancouver Island / Coast, Mainland /
Southwest, Thompson-Okanagan, Kootenay, Cariboo, North Coast and Nechako,
and Northeast.
The BC Labour Market Outlook incorporates economic projections provided in the
BC Ministry of Finance Budget and Fiscal Plan (June 2013 Budget Update). The key
economic indicators in the June Budget Update cover the period 2012 to 2017,
which includes information available as of June 14, 2013.The Outlook reflects
a prudent approach to forecasting economic growth. The growth incorporates
the impacts of the major projects that are currently underway or confirmed
over the outlook period. The projections provided in the Outlook are meant to
reflect general expected trends over the medium to long term. As such, the weak
employment growth observed in 2013 should not have a material impact on the
medium to long term labour market outlook.
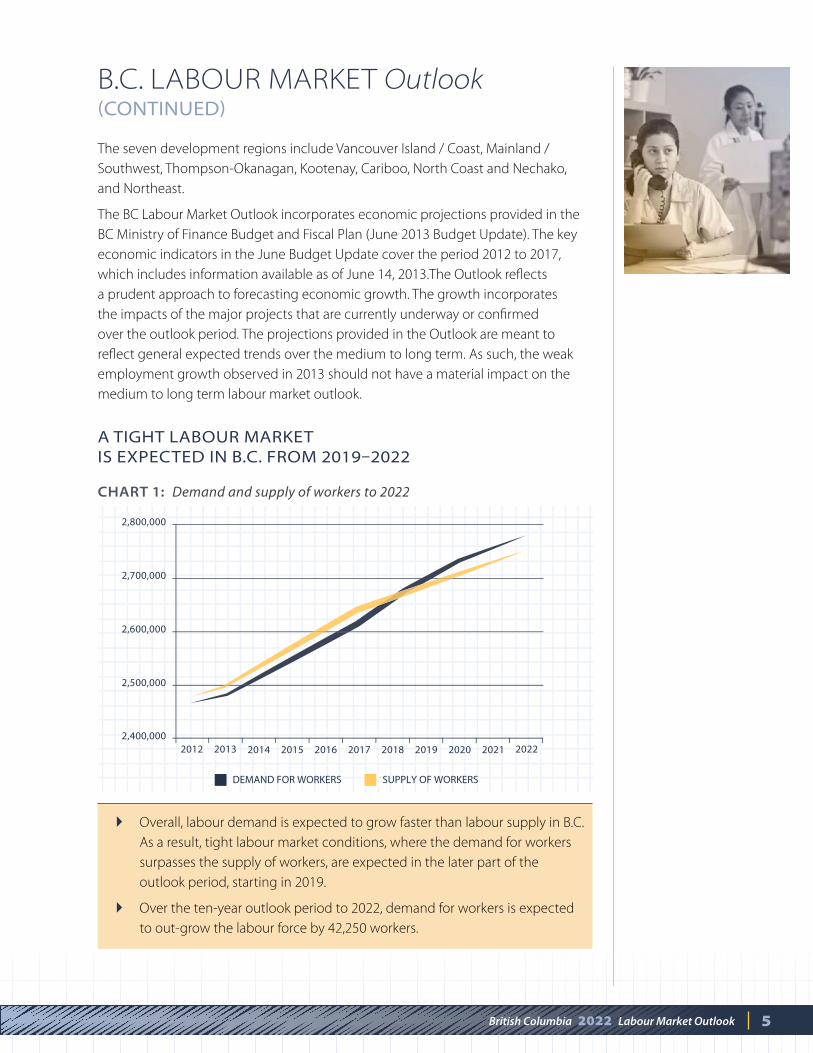
A TIGHT LABOUR MARKET IS EXPECTED IN B.C. FROM 20192022
CHART 1: Demand and supply of workers to 2022
2,400,000
2,700,000
2,600,000
2,500,000
2,800,000
20132012 202220212020201920182017201620152014
DEMAND FOR WORKERS SUPPLY OF WORKERS
Overall, labour demand is expected to grow faster than labour supply in B.C.
As a result, tight labour market conditions, where the demand for workers
surpasses the supply of workers, are expected in the later part of the
outlook period, starting in 2019.
Over the ten-year outlook period to 2022, demand for workers is expected
to out-grow the labour force by 42,250 workers.
6 British Columbia 2022 Labour Market Outlook
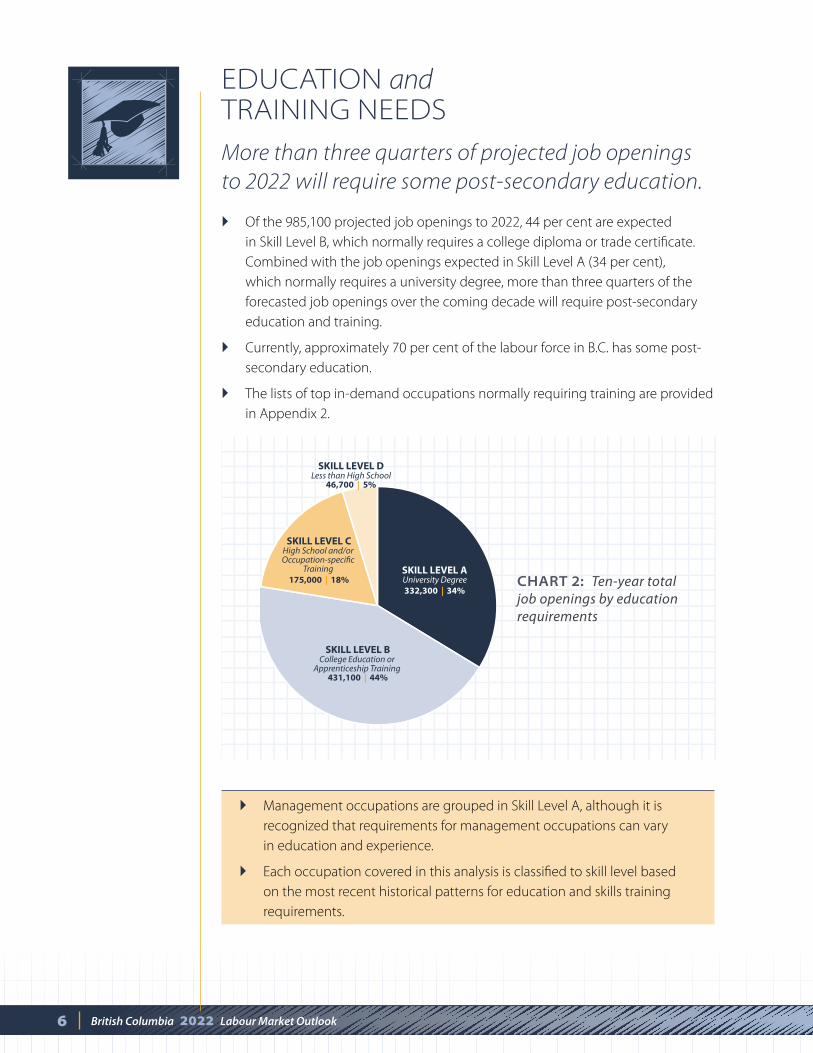
EDUCATION and TRAINING NEEDSMore than three quarters of projected job openings
to 2022 will require some post-secondary education.
Of the 985,100 projected job openings to 2022, 44 per cent are expected
in Skill Level B, which normally requires a college diploma or trade certificate.
Combined with the job openings expected in Skill Level A (34 per cent),
which normally requires a university degree, more than three quarters of the
forecasted job openings over the coming decade will require post-secondary
education and training.
Currently, approximately 70 per cent of the labour force in B.C. has some post-
secondary education.
The lists of top in-demand occupations normally requiring training are provided
in Appendix 2.
SKILL LEVEL CHigh School and/or Occupation-specific
Training 175,000 | 18%
SKILL LEVEL DLess than High School
46,700 | 5%
SKILL LEVEL BCollege Education or
Apprenticeship Training 431,100 | 44%
SKILL LEVEL AUniversity Degree332,300 | 34%
Management occupations are grouped in Skill Level A, although it is
recognized that requirements for management occupations can vary
in education and experience.
Each occupation covered in this analysis is classified to skill level based
on the most recent historical patterns for education and skills training
requirements.
CHART 2: Ten-year total job openings by education requirements

7British Columbia 2022 Labour Market Outlook
COMPONENTS of LABOUR SUPPLYOne-third of workers expected to fill projected
job openings in B.C. to 2022 are migrants.
Both migrants and new labour market entrants (those who leave the school system
and enter the labour market for the first time) are important components of new
labour supply and add to the labour pool each year. Given the aging population
challenge facing B.C. and the decreasing number of new entrants to the labour
market over the forecast period, B.C. will rely more on migrants as a source of new
labour supply. Migrants to B.C. that arrive during the forecast period are expected
to fill one-third of the total projected job openings in the province to 2022.
Note: Migrants refer to those who come from outside of B.C., including those
from out of country.
8 British Columbia 2022 Labour Market Outlook
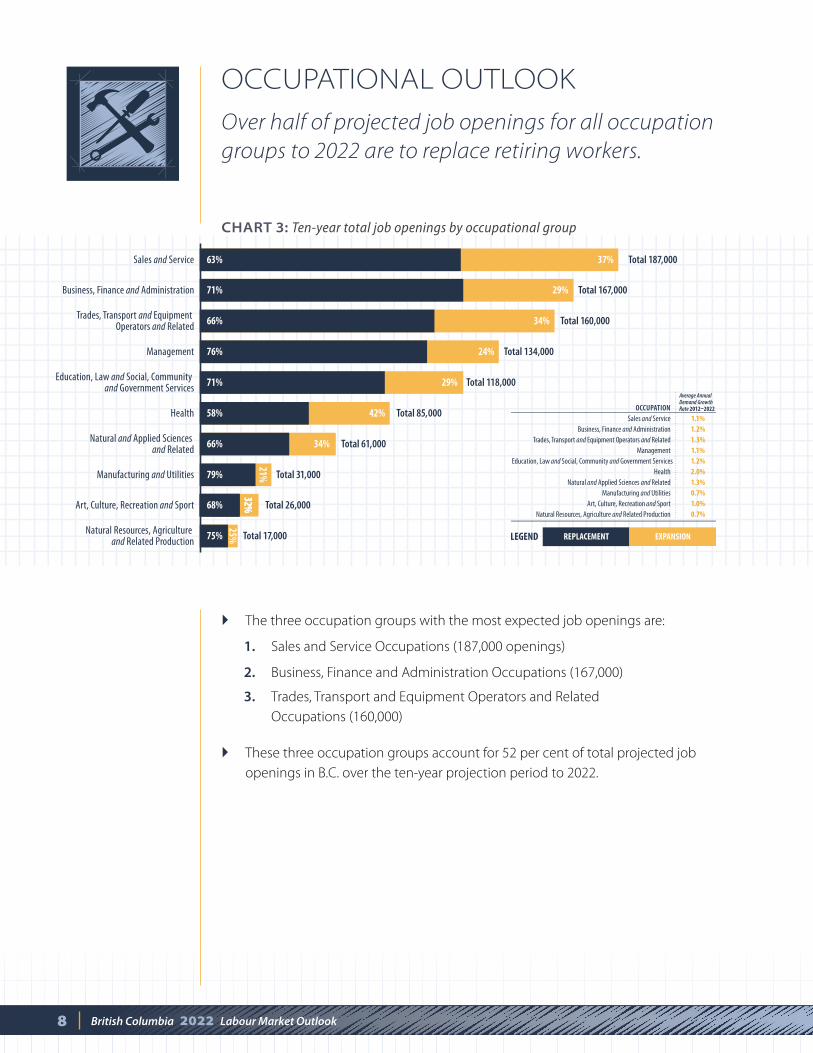
OCCUPATIONAL OUTLOOKOver half of projected job openings for all occupation
groups to 2022 are to replace retiring workers.
CHART 3: Ten-year total job openings by occupational group
The three occupation groups with the most expected job openings are:
1. Sales and Service Occupations (187,000 openings)
2. Business, Finance and Administration Occupations (167,000)
3. Trades, Transport and Equipment Operators and Related
Occupations (160,000)
These three occupation groups account for 52 per cent of total projected job
openings in B.C. over the ten-year projection period to 2022.
Business, Finance and Administration Total 167,00071% 29%
Trades, Transport and Equipment Operators and Related
Total 160,00066% 34%
Management Total 134,00076% 24%
Education, Law and Social, Community and Government Services
Total 118,00071% 29%
Health Total 85,00058% 42%
Natural and Applied Sciences and Related
Total 61,00066% 34%
Manufacturing and Utilities Total 31,00079%
21%
Art, Culture, Recreation and Sport Total 26,00068%
32%68%
32%68%
32%
Natural Resources, Agriculture and Related Production
Total 17,00075%
25%
Total 187,000Sales and Service 63% 37%
Average Annual Demand G OCCUPATION Rate 20122022
Sales and Service 1.1% Business, Finance and Administration 1.2% Trades, Transport and Equipment Operators and Related 1.3% Management 1.1% Education, Law and Social, Community and Government Services 1.2% Health 2.0% Natural and Applied Sciences and Related 1.3% Manufacturing and Utilities 0.7% Art, Culture, Recreation and Sport 1.0% Natural Resources, Agriculture and Related Production 0.7%
REPLACEMENT EXPANSIONLEGEND
Average Annual Demand Growth Rate 20122022
9British Columbia 2022 Labour Market Outlook
OCCUPATIONAL OUTLOOK CONTINUED
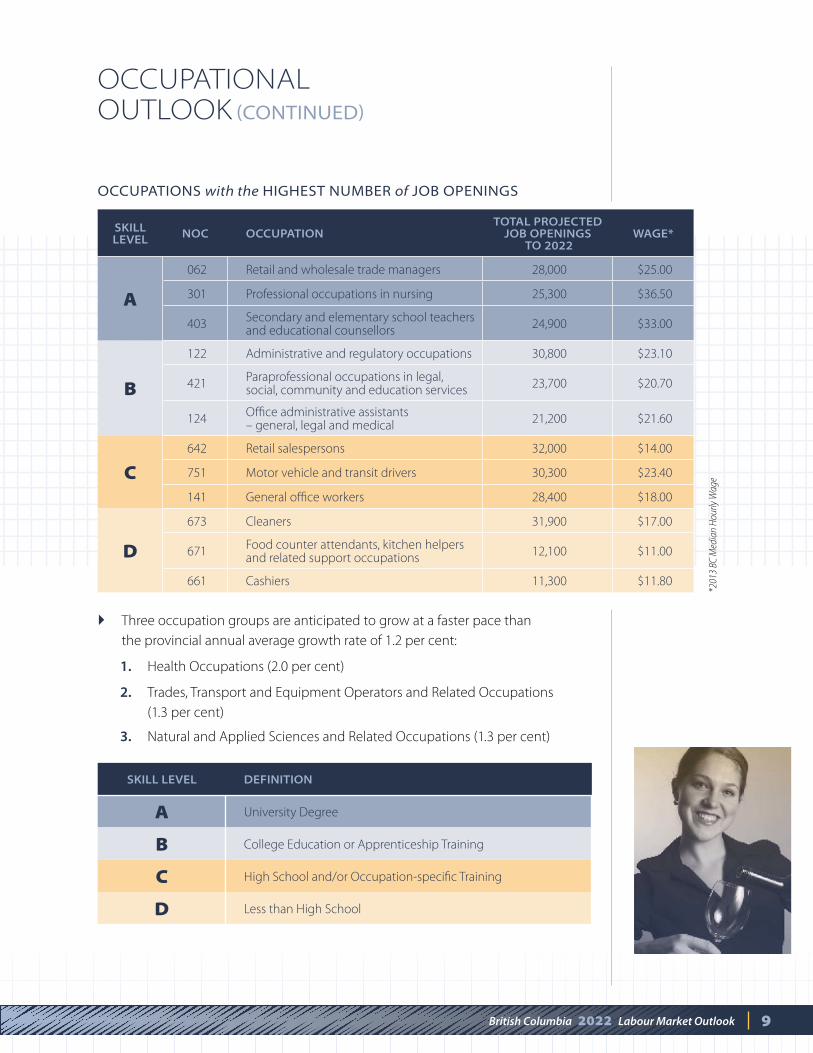
SKILL LEVEL NOC OCCUPATION
TOTAL PROJECTED JOB OPENINGS
TO 2022WAGE*
A
062 Retail and wholesale trade managers 28,000 $25.00
301 Professional occupations in nursing 25,300 $36.50
403Secondary and elementary school teachers and educational counsellors
24,900 $33.00
B
122 Administrative and regulatory occupations 30,800 $23.10
421Paraprofessional occupations in legal, social, community and education services
23,700 $20.70
124Office administrative assistants – general, legal and medical
21,200 $21.60
C642 Retail salespersons 32,000 $14.00
751 Motor vehicle and transit drivers 30,300 $23.40
141 General office workers 28,400 $18.00
D
673 Cleaners 31,900 $17.00
671Food counter attendants, kitchen helpers and related support occupations
12,100 $11.00
661 Cashiers 11,300 $11.80
*201
3 BC
Med
ian
Ho
url
y W
ag
e
Three occupation groups are anticipated to grow at a faster pace than
the provincial annual average growth rate of 1.2 per cent:
1. Health Occupations (2.0 per cent)
2. Trades, Transport and Equipment Operators and Related Occupations
(1.3 per cent)
3. Natural and Applied Sciences and Related Occupations (1.3 per cent)
OCCUPATIONS with the HIGHEST NUMBER of JOB OPENINGS
SKILL LEVEL DEFINITION
A University Degree
B College Education or Apprenticeship Training
C High School and/or Occupation-specific Training
D Less than High School
10 British Columbia 2022 Labour Market Outlook
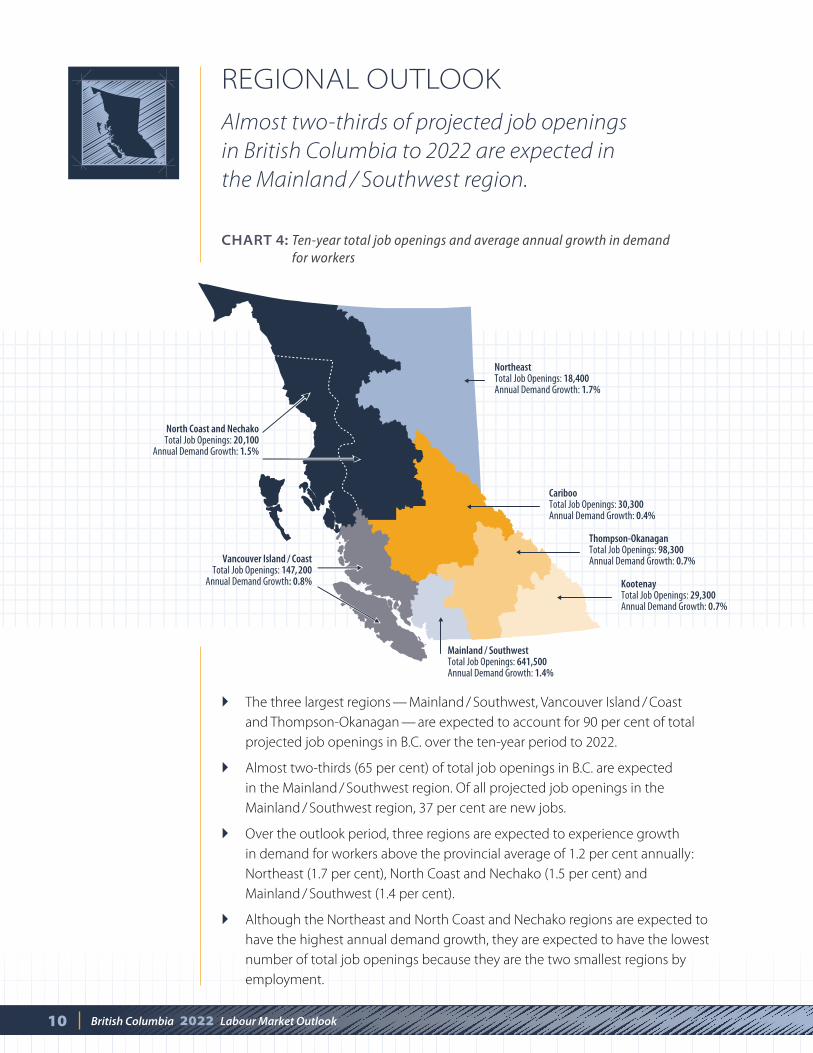
REGIONAL OUTLOOKAlmost two-thirds of projected job openings
in British Columbia to 2022 are expected in
the Mainland / Southwest region.
The three largest regions — Mainland / Southwest, Vancouver Island / Coast
and Thompson-Okanagan — are expected to account for 90 per cent of total
projected job openings in B.C. over the ten-year period to 2022.
Almost two-thirds (65 per cent) of total job openings in B.C. are expected
in the Mainland / Southwest region. Of all projected job openings in the
Mainland / Southwest region, 37 per cent are new jobs.
Over the outlook period, three regions are expected to experience growth
in demand for workers above the provincial average of 1.2 per cent annually:
Northeast (1.7 per cent), North Coast and Nechako (1.5 per cent) and
Mainland / Southwest (1.4 per cent).
Although the Northeast and North Coast and Nechako regions are expected to
have the highest annual demand growth, they are expected to have the lowest
number of total job openings because they are the two smallest regions by
employment.
North Coast and Nechako
Total Job Openings: 20,100Annual Demand Growth: 1.5%
Mainland / SouthwestTotal Job Openings: 641,500Annual Demand Growth: 1.4%
Vancouver Island / CoastTotal Job Openings: 147, 200
Annual Demand Growth: 0.8% KootenayTotal Job Openings: 29,300Annual Demand Growth: 0.7%
Thompson-OkanaganTotal Job Openings: 98,300Annual Demand Growth: 0.7%
CaribooTotal Job Openings: 30,300Annual Demand Growth: 0.4%
NortheastTotal Job Openings: 18,400Annual Demand Growth: 1.7%
CHART 4: Ten-year total job openings and average annual growth in demand for workers
SKILL LEVEL
NOC DESCRIPTION EXPANSION REPLACEMENT TOTAL JOB OPENINGS
WAGE*
A
301 Professional occupations in nursing 2,280 3,220 5,500 $36.50
062 Retail and wholesale trade managers 990 3,940 4,930 $25.00
403Secondary and elementary school teachers and educational counsellors
830 3,250 4,080 $33.00
B
421Paraprofessional occupations in legal, social, community and education services
2,130 2,800 4,930 $20.70
122Administrative and regulatory occupations
820 4,000 4,820 $23.10
124Office administrative assistants – general, legal and medical
650 2,700 3,350 $21.60
C
642 Retail salespersons 1,740 4,070 5,810 $14.00
141 General office workers 1,470 3,650 5,120 $18.00
341Assisting occupations in support of health services
2,070 2,690 4,760 $21.00
D
673 Cleaners 840 3,730 4,570 $17.00
661 Cashiers 750 1,150 1,900 $11.80
671Food counter attendants, kitchen helpers and related support occupations
860 540 1,400 $11.00
*2013 BC Median Hourly Wage
OCCUPATIONS with the HIGHEST NUMBER of JOB OPENINGS
11British Columbia 2022 Labour Market Outlook
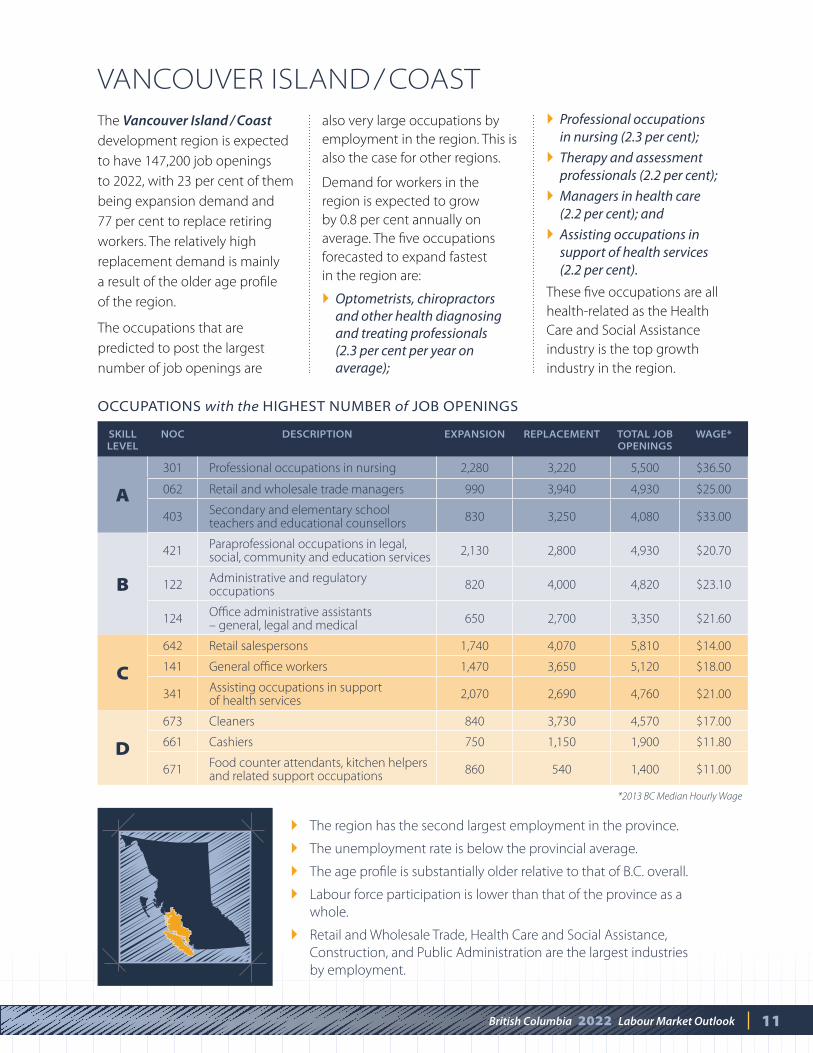
VANCOUVER ISLAND / COASTThe Vancouver Island / Coast
development region is expected
to have 147,200 job openings
to 2022, with 23 per cent of them
being expansion demand and
77 per cent to replace retiring
workers. The relatively high
replacement demand is mainly
a result of the older age profile
of the region.
The occupations that are
predicted to post the largest
number of job openings are
also very large occupations by
employment in the region. This is
also the case for other regions.
Demand for workers in the
region is expected to grow
by 0.8 per cent annually on
average. The five occupations
forecasted to expand fastest
in the region are:
Optometrists, chiropractors and other health diagnosing and treating professionals (2.3 per cent per year on average);
Professional occupations in nursing (2.3 per cent);
Therapy and assessment professionals (2.2 per cent);
Managers in health care (2.2 per cent); and
Assisting occupations in support of health services (2.2 per cent).
These five occupations are all
health-related as the Health
Care and Social Assistance
industry is the top growth
industry in the region.
The region has the second largest employment in the province.
The unemployment rate is below the provincial average.
The age profile is substantially older relative to that of B.C. overall.
Labour force participation is lower than that of the province as a
whole.
Retail and Wholesale Trade, Health Care and Social Assistance,
Construction, and Public Administration are the largest industries
by employment.
12 British Columbia 2022 Labour Market Outlook
SKILL LEVEL
NOC DESCRIPTION EXPANSION REPLACEMENT TOTAL JOB OPENINGS
WAGE*
A
062 Retail and wholesale trade managers 5,260 12,380 17,640 $25.00
403Secondary and elementary school teachers and educational counsellors
2,100 12,480 14,580 $33.00
111Auditors, accountants and investment professionals
4,980 9,470 14,450 $31.50
B
122Administrative and regulatory occupations
6,390 13,770 20,160 $23.10
421Paraprofessional occupations in legal, social, community and education services
5,970 7,420 13,390 $20.70
124Office administrative assistants – general, legal and medical
4,290 8,990 13,280 $21.60
C642 Retail salespersons 9,380 11,740 21,120 $14.00
751 Motor vehicle and transit drivers 6,290 12,660 18,950 $23.40
141 General office workers 6,880 10,420 17,300 $18.00
D
673 Cleaners 6,900 13,320 20,220 $17.00
671Food counter attendants, kitchen helpers and related support occupations
4,570 3,540 8,110 $11.00
661 Cashiers 3,820 3,530 7,350 $11.80
*2013 BC Median Hourly Wage
OCCUPATIONS with the HIGHEST NUMBER of JOB OPENINGS
More than 60 per cent of the workers in the province are employed
in the region.
The unemployment rate is close to the provincial average.
The population is slightly younger relative to the province as a whole.
Compared to B.C. overall, labour force participation is slightly higher.
Retail and Wholesale Trade, Health Care and Social Assistance,
Manufacturing, and Professional, Scientific and Technical Services
are the largest industries by employment.
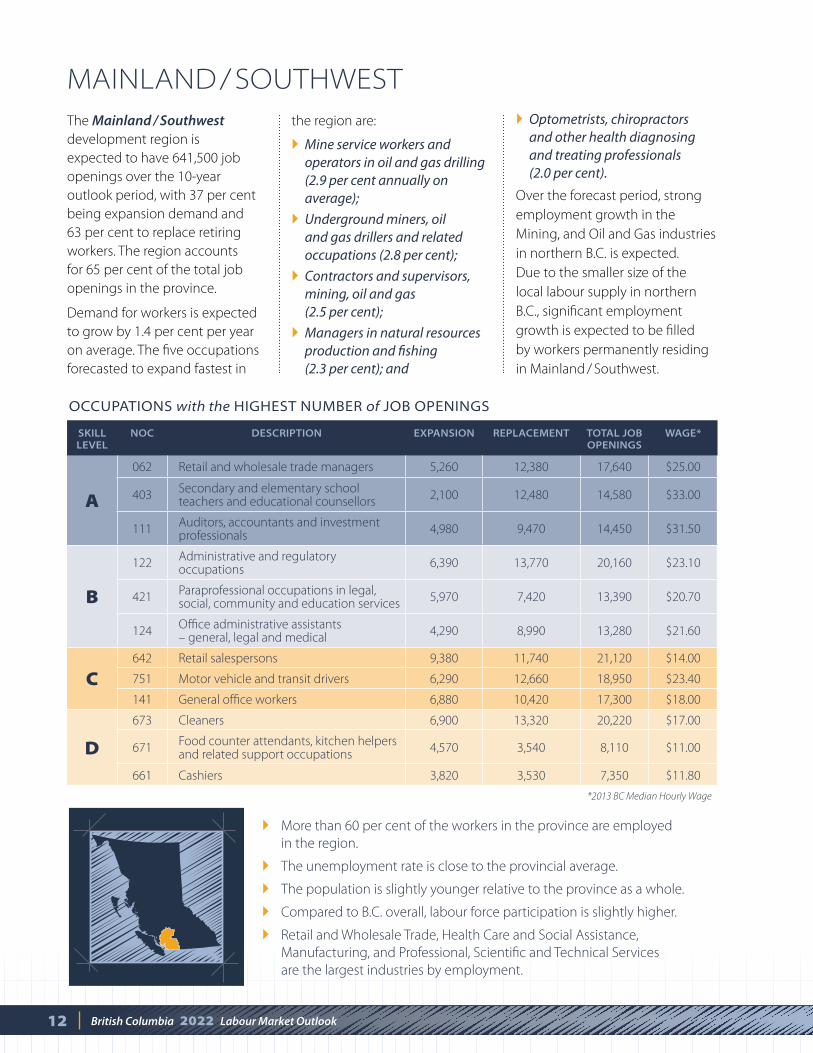
MAINLAND / SOUTHWESTThe Mainland / Southwest
development region is
expected to have 641,500 job
openings over the 10-year
outlook period, with 37 per cent
being expansion demand and
63 per cent to replace retiring
workers. The region accounts
for 65 per cent of the total job
openings in the province.
Demand for workers is expected
to grow by 1.4 per cent per year
on average. The five occupations
forecasted to expand fastest in
the region are:
Mine service workers and operators in oil and gas drilling (2.9 per cent annually on average);
Underground miners, oil and gas drillers and related occupations (2.8 per cent);
Contractors and supervisors, mining, oil and gas (2.5 per cent);
Managers in natural resources production and fishing (2.3 per cent); and
Optometrists, chiropractors and other health diagnosing and treating professionals (2.0 per cent).
Over the forecast period, strong
employment growth in the
Mining, and Oil and Gas industries
in northern B.C. is expected.
Due to the smaller size of the
local labour supply in northern
B.C., significant employment
growth is expected to be filled
by workers permanently residing
in Mainland / Southwest.
SKILL LEVEL
NOC DESCRIPTION EXPANSION REPLACEMENT TOTAL JOB OPENINGS
WAGE*
A
301 Professional occupations in nursing 1,160 1,900 3,060 $36.50
403Secondary and elementary school teachers and educational counsellors
600 2,200 2,800 $33.00
062 Retail and wholesale trade managers 250 2,540 2,790 $25.00
B
122Administrative and regulatory occupations
460 2,540 3,000 $23.10
421Paraprofessional occupations in legal, social, community and education services
1,060 1,630 2,690 $20.70
124Office administrative assistants – general, legal and medical
460 1,910 2,370 $21.60
C141 General office workers 790 2,490 3,280 $18.00
751 Motor vehicle and transit drivers 510 2,580 3,090 $23.40
642 Retail salespersons 340 2,530 2,870 $14.00
D
673 Cleaners 880 2,770 3,650 $17.00
671Food counter attendants, kitchen helpers and related support occupations
1,050 780 1,830 $11.00
661 Cashiers 260 850 1,110 $11.80
*2013 BC Median Hourly Wage
OCCUPATIONS with the HIGHEST NUMBER of JOB OPENINGS
13British Columbia 2022 Labour Market Outlook
The region employs the third most workers in B.C.
The unemployment rate is slightly above the provincial average.
The population is older relative to B.C. as a whole.
Labour force participation is lower than the provincial
participation rate
Retail and Wholesale Trade, Health Care and Social Assistance,
Construction, and Accommodation and Food Services are the
largest industries by employment.
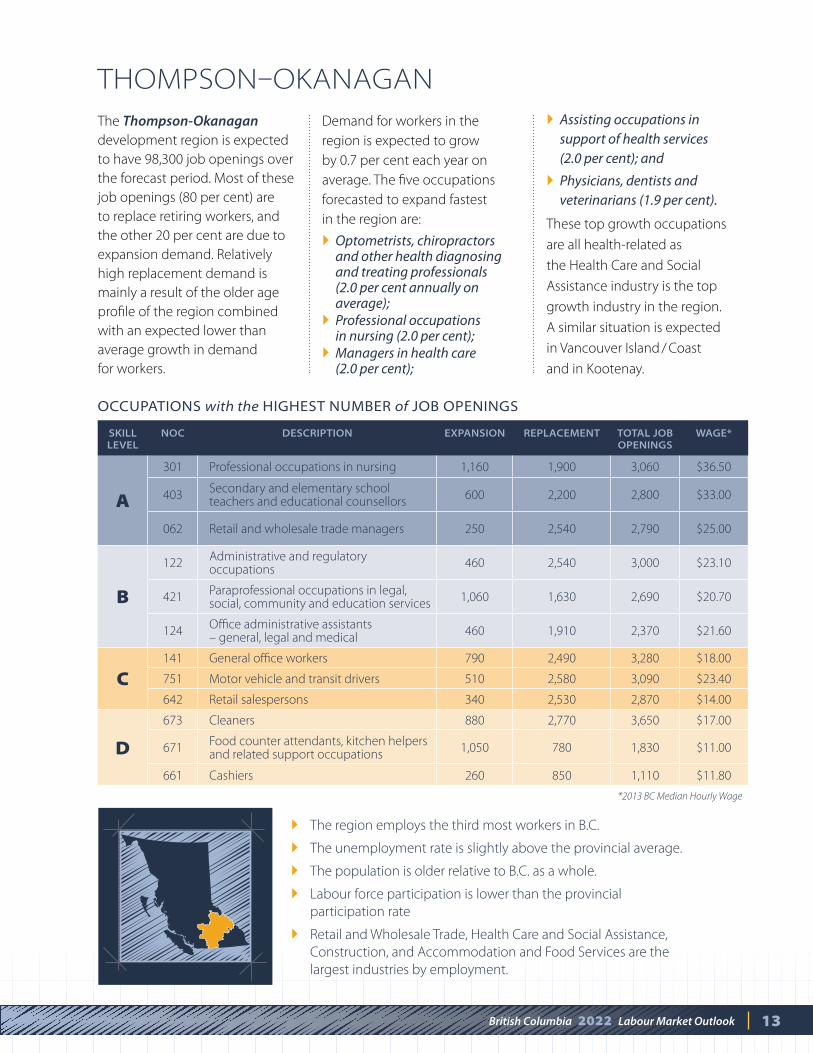
THOMPSONOKANAGANThe Thompson-Okanagan development region is expected
to have 98,300 job openings over
the forecast period. Most of these
job openings (80 per cent) are
to replace retiring workers, and
the other 20 per cent are due to
expansion demand. Relatively
high replacement demand is
mainly a result of the older age
profile of the region combined
with an expected lower than
average growth in demand
for workers.
Demand for workers in the
region is expected to grow
by 0.7 per cent each year on
average. The five occupations
forecasted to expand fastest
in the region are:
Optometrists, chiropractors and other health diagnosing and treating professionals (2.0 per cent annually on average);
Professional occupations in nursing (2.0 per cent);
Managers in health care (2.0 per cent);
Assisting occupations in support of health services (2.0 per cent); and
Physicians, dentists and veterinarians (1.9 per cent).
These top growth occupations
are all health-related as
the Health Care and Social
Assistance industry is the top
growth industry in the region.
A similar situation is expected
in Vancouver Island / Coast
and in Kootenay.
14 British Columbia 2022 Labour Market Outlook
SKILL LEVEL
NOC DESCRIPTION EXPANSION REPLACEMENT TOTAL JOB OPENINGS
WAGE*
A403
Secondary and elementary school teachers and educational counsellors
310 810 1,120 $33.00
062 Retail and wholesale trade managers 80 960 1,040 $25.00
301 Professional occupations in nursing 400 560 960 $36.50
B
421Paraprofessional occupations in legal, social, community and education services
390 490 880 $20.70
122 Administrative and regulatory occupations 140 740 880 $23.10
124Office administrative assistants – general, legal and medical
170 600 770 $21.60
C
751 Motor vehicle and transit drivers 200 970 1,170 $23.40
441Home care providers and educational support occupations
310 690 1,000 $17.90
341Assisting occupations in support of health services
440 550 990 $21.00
D
673 Cleaners 330 960 1,290 $17.00
861Harvesting, landscaping and natural resources labourers
110 260 370 $18.00
661 Cashiers 60 300 360 $11.80
*2013 BC Median Hourly Wage
The region employs over three per cent of workers in B.C.
The unemployment rate is below the provincial average.
The population is substantially older compared to the overall
population in B.C.
Labour force participation is lower than that of the province overall.
Retail and Wholesale Trade, Health Care and Social Assistance,
Construction, and Forestry, Fishing, Mining, Oil and Gas are the largest
industries by employment.
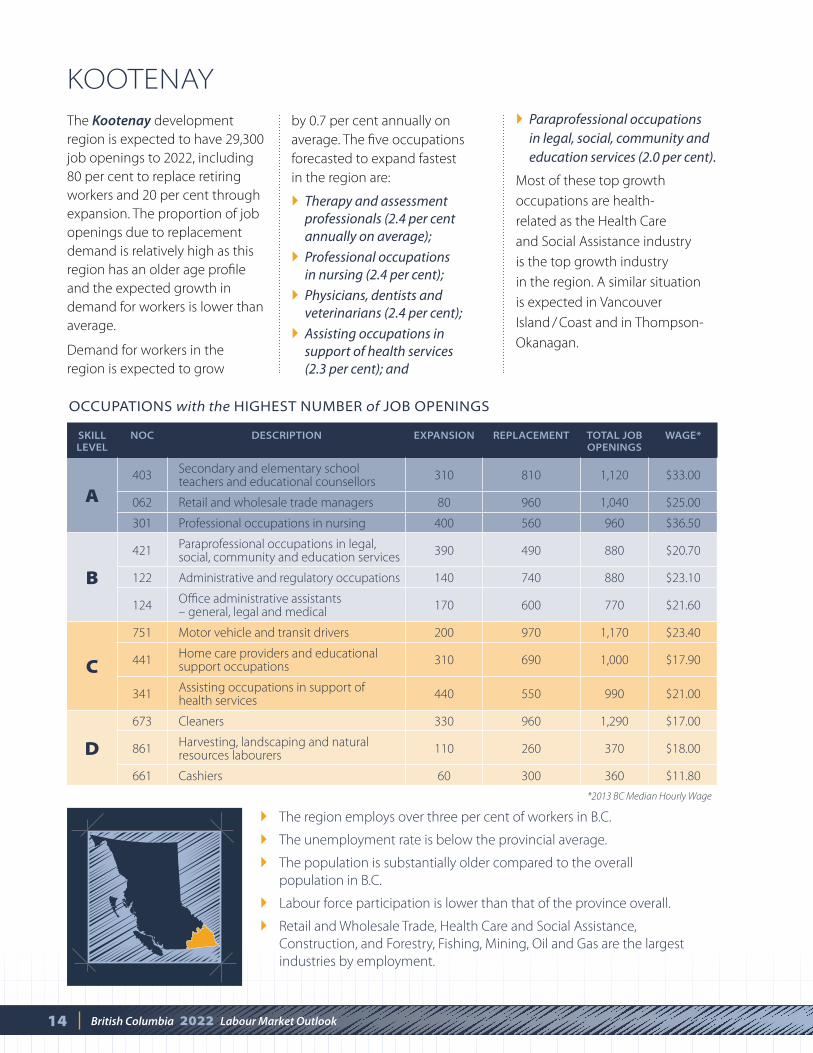
KOOTENAYThe Kootenay development
region is expected to have 29,300
job openings to 2022, including
80 per cent to replace retiring
workers and 20 per cent through
expansion. The proportion of job
openings due to replacement
demand is relatively high as this
region has an older age profile
and the expected growth in
demand for workers is lower than
average.
Demand for workers in the
region is expected to grow
by 0.7 per cent annually on
average. The five occupations
forecasted to expand fastest
in the region are:
Therapy and assessment professionals (2.4 per cent annually on average);
Professional occupations in nursing (2.4 per cent);
Physicians, dentists and veterinarians (2.4 per cent);
Assisting occupations in support of health services (2.3 per cent); and
Paraprofessional occupations in legal, social, community and education services (2.0 per cent).
Most of these top growth
occupations are health-
related as the Health Care
and Social Assistance industry
is the top growth industry
in the region. A similar situation
is expected in Vancouver
Island / Coast and in Thompson-
Okanagan.
OCCUPATIONS with the HIGHEST NUMBER of JOB OPENINGS
SKILL LEVEL
NOC DESCRIPTION EXPANSION REPLACEMENT TOTAL JOB OPENINGS
WAGE*
A403
Secondary and elementary school teachers and educational counsellors
170 960 1,130 $33.00
301 Professional occupations in nursing 410 640 1,050 $36.50
062 Retail and wholesale trade managers -30 750 720 $25.00
B
731Machinery and transportation equipment mechanics (except motor vehicle)
70 1,140 1,210 $31.00
421Paraprofessional occupations in legal, social, community and education services
450 660 1,110 $20.70
724Electrical trades and electrical power line and telecommunications workers
260 700 960 $32.00
C
751 Motor vehicle and transit drivers 200 1,550 1,750 $23.40
141 General office workers 210 760 970 $18.00
341Assisting occupations in support of health services
340 500 840 $21.00
D
673 Cleaners 80 960 1,040 $17.00
761 Trades helpers and labourers 230 290 520 $21.00
861Harvesting, landscaping and natural resources labourers
140 180 320 $18.00
*2013 BC Median Hourly Wage
15British Columbia 2022 Labour Market Outlook
Employment accounts for less than four per cent of the total
employment in the province.
The unemployment rate is below the provincial average.
The population is slightly younger, compared to the overall
population in B.C.
Labour force participation rates are higher than that of the
province overall.
Retail and Wholesale Trade, Manufacturing, Health Care and Social
Assistance, and Forestry, Fishing, Mining, Oil and Gas are the largest
industries by employment.
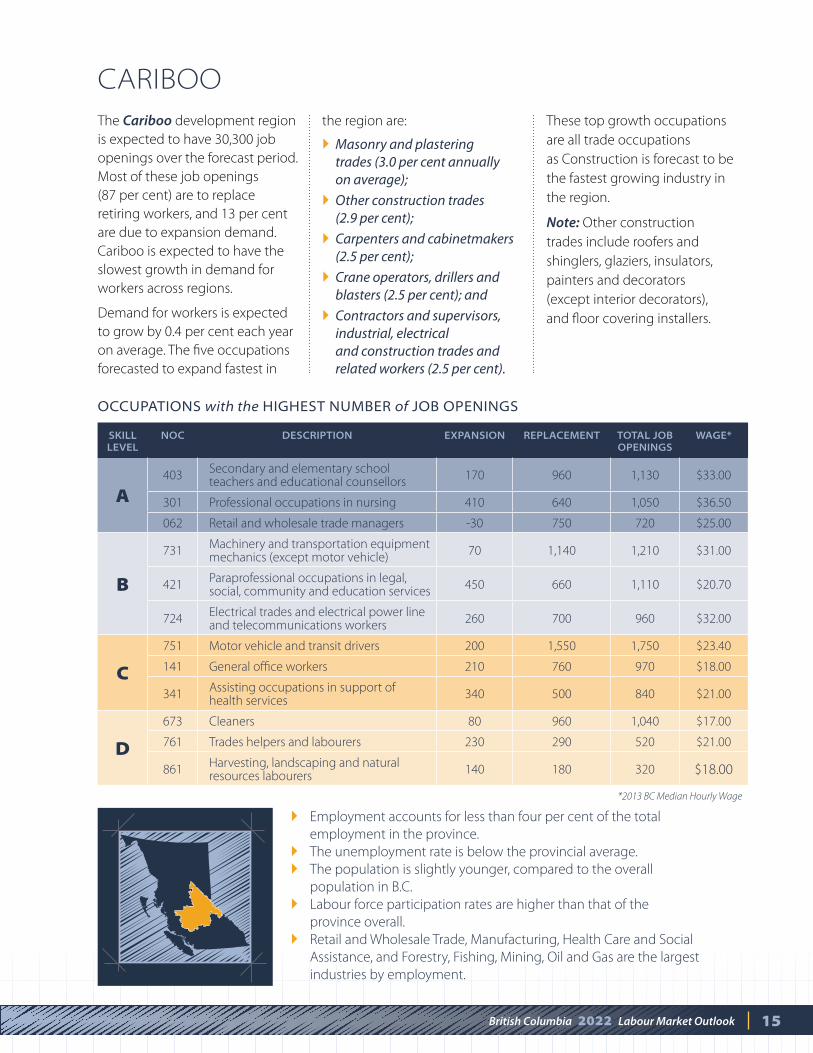
CARIBOOThe Cariboo development region
is expected to have 30,300 job
openings over the forecast period.
Most of these job openings
(87 per cent) are to replace
retiring workers, and 13 per cent
are due to expansion demand.
Cariboo is expected to have the
slowest growth in demand for
workers across regions.
Demand for workers is expected
to grow by 0.4 per cent each year
on average. The five occupations
forecasted to expand fastest in
the region are:
Masonry and plastering trades (3.0 per cent annually on average);
Other construction trades (2.9 per cent);
Carpenters and cabinetmakers (2.5 per cent);
Crane operators, drillers and blasters (2.5 per cent); and
Contractors and supervisors, industrial, electrical and construction trades and related workers (2.5 per cent).
These top growth occupations
are all trade occupations
as Construction is forecast to be
the fastest growing industry in
the region.
Note: Other construction
trades include roofers and
shinglers, glaziers, insulators,
painters and decorators
(except interior decorators),
and floor covering installers.
OCCUPATIONS with the HIGHEST NUMBER of JOB OPENINGS
16 British Columbia 2022 Labour Market Outlook
SKILL LEVEL
NOC DESCRIPTION EXPANSION REPLACEMENT TOTAL JOB OPENINGS
WAGE*
A
071Managers in construction and facility operation and maintenance
170 350 520 $36.90
403Secondary and elementary school teachers and educational counsellors
30 450 480 $33.00
301 Professional occupations in nursing 150 270 420 $36.50
B
122Administrative and regulatory occupations
200 390 590 $23.10
727 Carpenters and cabinetmakers 220 300 520 $22.00
731Machinery and transportation equipment mechanics (except motor vehicle)
150 320 470 $31.00
C
751 Motor vehicle and transit drivers 300 520 820 $23.40
141 General office workers 190 320 510 $18.00
441Home care providers and educational support occupations
110 290 400 $17.90
D
673 Cleaners 160 280 440 $17.00
761 Trades helpers and labourers 150 160 310 $21.00
861Harvesting, landscaping and natural resources labourers
110 90 200 $18.00
*2013 BC Median Hourly Wage
The region is one of the smallest by employment, accounting for less
than two per cent of the employment in B.C.
The unemployment rate is close to the provincial average.
The population is younger compared to the B.C. overall.
Labour force participation is higher than that of the province overall.
Retail and Wholesale Trade, Manufacturing, Construction, and Health
Care and Social Assistance are the largest industries by employment.
OCCUPATIONS with the HIGHEST NUMBER of JOB OPENINGS
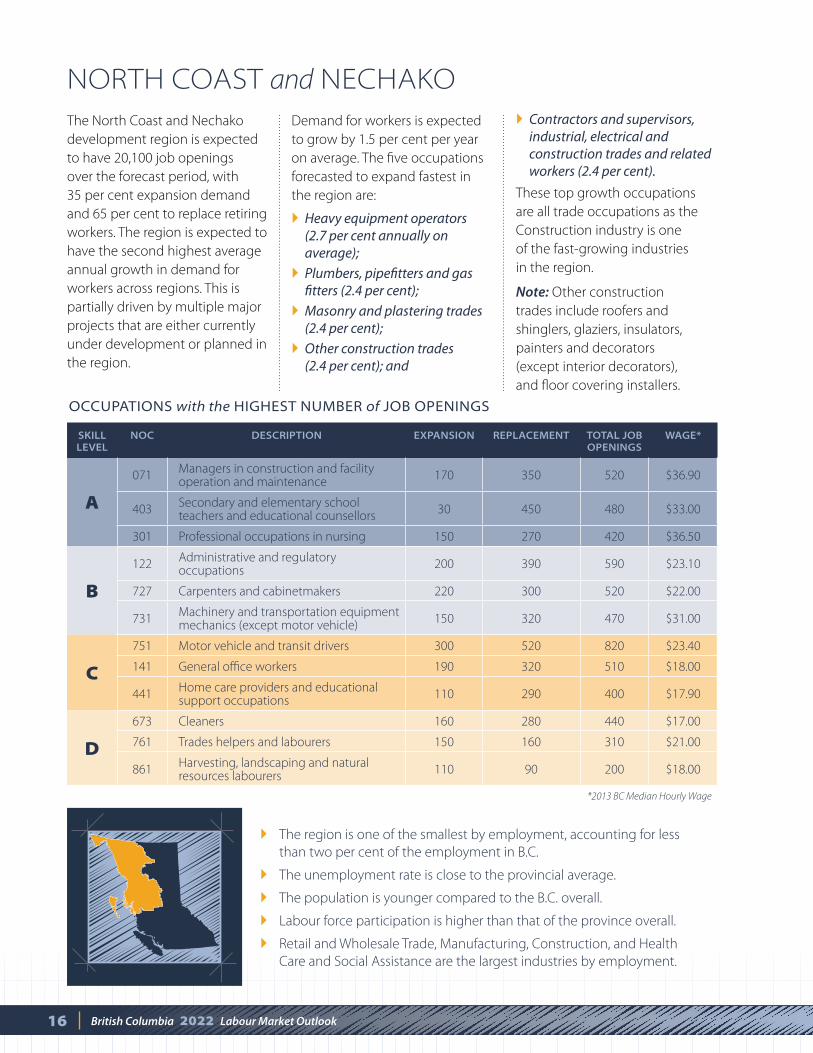
NORTH COAST and NECHAKOThe North Coast and Nechako
development region is expected
to have 20,100 job openings
over the forecast period, with
35 per cent expansion demand
and 65 per cent to replace retiring
workers. The region is expected to
have the second highest average
annual growth in demand for
workers across regions. This is
partially driven by multiple major
projects that are either currently
under development or planned in
the region.
Demand for workers is expected
to grow by 1.5 per cent per year
on average. The five occupations
forecasted to expand fastest in
the region are:
Heavy equipment operators (2.7 per cent annually on average);
Plumbers, pipefitters and gas fitters (2.4 per cent);
Masonry and plastering trades (2.4 per cent);
Other construction trades (2.4 per cent); and
Contractors and supervisors, industrial, electrical and construction trades and related workers (2.4 per cent).
These top growth occupations
are all trade occupations as the
Construction industry is one
of the fast-growing industries
in the region.
Note: Other construction
trades include roofers and
shinglers, glaziers, insulators,
painters and decorators
(except interior decorators),
and floor covering installers.
SKILL LEVEL
NOC DESCRIPTION EXPANSION REPLACEMENT TOTAL JOB OPENINGS
WAGE*
A
403Secondary and elementary school teachers and educational counsellors
250 460 710 $33.00
062 Retail and wholesale trade managers 140 420 560 $25.00
082Managers in agriculture, horticulture and aquaculture
70 300 370 $20.00
B
122Administrative and regulatory occupations
210 400 610 $23.10
131Finance, insurance and related business administrative occupations
210 370 580 $22.60
724Electrical trades and electrical power line and telecommunications workers
210 240 450 $32.00
C751 Motor vehicle and transit drivers 270 720 990 $23.40
752 Heavy equipment operators 280 330 610 $28.90
141 General office workers 190 280 470 $18.00
D673 Cleaners 290 350 640 $17.00
761 Trades helpers and labourers 290 120 410 $21.00
661 Cashiers 150 140 290 $11.80
*2013 BC Median Hourly Wage
17British Columbia 2022 Labour Market Outlook
The region is one of the smallest by employment, accounting
for less than two per cent of the employment in B.C.
The region has the lowest unemployment rate in the province.
The Northeast has the youngest population across all regions.
Labour force participation is the highest in the province.
Retail and Wholesale Trade, Construction, Forestry, Fishing, Mining,
Oil and Gas, and Health Care and Social Assistance are the largest
industries by employment.
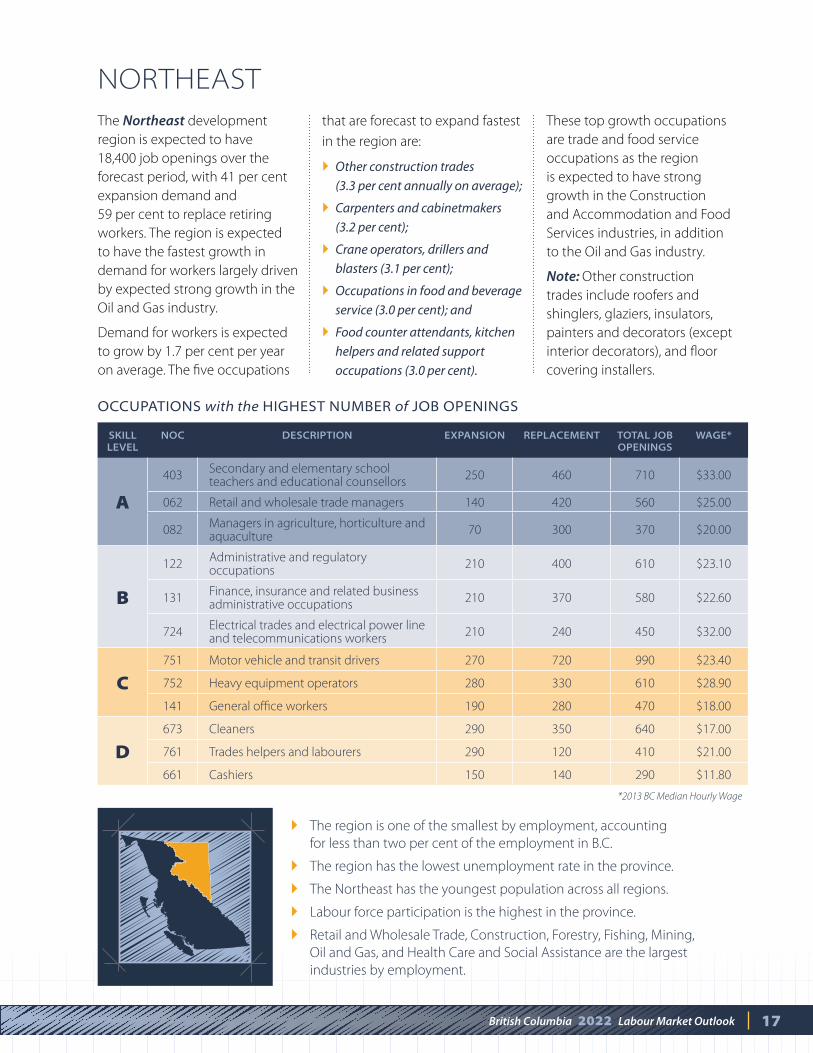
NORTHEASTThe Northeast development
region is expected to have
18,400 job openings over the
forecast period, with 41 per cent
expansion demand and
59 per cent to replace retiring
workers. The region is expected
to have the fastest growth in
demand for workers largely driven
by expected strong growth in the
Oil and Gas industry.
Demand for workers is expected
to grow by 1.7 per cent per year
on average. The five occupations
that are forecast to expand fastest
in the region are:
Other construction trades
(3.3 per cent annually on average);
Carpenters and cabinetmakers
(3.2 per cent);
Crane operators, drillers and
blasters (3.1 per cent);
Occupations in food and beverage
service (3.0 per cent); and
Food counter attendants, kitchen
helpers and related support
occupations (3.0 per cent).
These top growth occupations
are trade and food service
occupations as the region
is expected to have strong
growth in the Construction
and Accommodation and Food
Services industries, in addition
to the Oil and Gas industry.
Note: Other construction
trades include roofers and
shinglers, glaziers, insulators,
painters and decorators (except
interior decorators), and floor
covering installers.
OCCUPATIONS with the HIGHEST NUMBER of JOB OPENINGS
18 British Columbia 2022 Labour Market Outlook
NATURAL GAS EXTRACTION & PROCESSING
LIQUEFACTION & TRANSPORTATION
TRANSMISSION
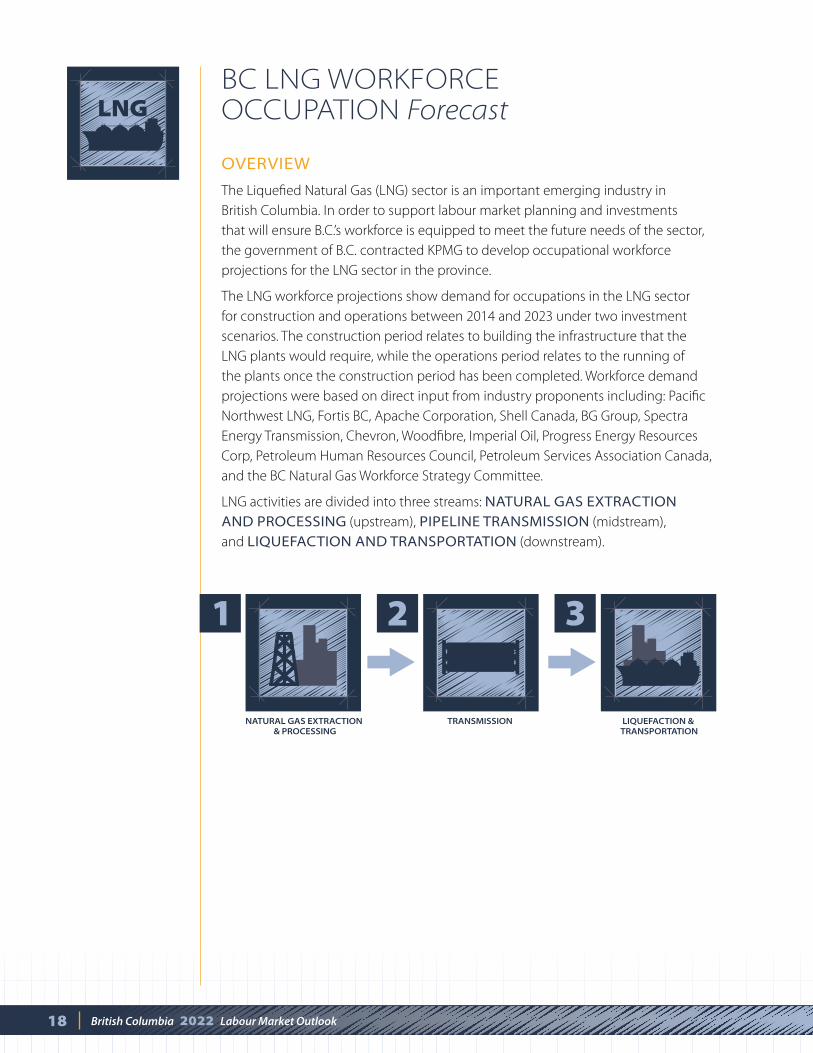
BC LNG WORKFORCE OCCUPATION Forecast
OVERVIEW
The Liquefied Natural Gas (LNG) sector is an important emerging industry in
British Columbia. In order to support labour market planning and investments
that will ensure B.C.’s workforce is equipped to meet the future needs of the sector,
the government of B.C. contracted KPMG to develop occupational workforce
projections for the LNG sector in the province.
The LNG workforce projections show demand for occupations in the LNG sector
for construction and operations between 2014 and 2023 under two investment
scenarios. The construction period relates to building the infrastructure that the
LNG plants would require, while the operations period relates to the running of
the plants once the construction period has been completed. Workforce demand
projections were based on direct input from industry proponents including: Pacific
Northwest LNG, Fortis BC, Apache Corporation, Shell Canada, BG Group, Spectra
Energy Transmission, Chevron, Woodfibre, Imperial Oil, Progress Energy Resources
Corp, Petroleum Human Resources Council, Petroleum Services Association Canada,
and the BC Natural Gas Workforce Strategy Committee.
LNG activities are divided into three streams: NATURAL GAS EXTRACTION AND PROCESSING (upstream), PIPELINE TRANSMISSION (midstream),
and LIQUEFACTION AND TRANSPORTATION (downstream).
LNG
19British Columbia 2022 Labour Market Outlook
BC LNG WORKFORCE OCCUPATION Forecast CONTINUED
KEY FINDINGS
A scenario with five LNG plants and a total production capacity of 82 Million Tonnes
Per Annum would generate a total sector investment of $175 billion.
The projections show two peaks of workforce needs in 2018 and 2022.
In this scenario, up to 100,000 jobs would be created between 2015 and 2023:
58,700 direct and indirect construction jobs at the height of the construction
phase in 2018, including 31,700 direct construction jobs and 27,000 indirect
construction jobs.
TABLE 1: Estimated direct and indirect construction workforce demand 2014-2023 (FTEs)
YEAR DIRECT DOWNSTREAM
DIRECT MIDSTREAM
DIRECT UPSTREAM DIRECT INDIRECT
DIRECT AND INDIRECT
TOTAL
2014 0 0 0 0 0 0
2015 1,100 1,560 690 3,300 4,500 7,900
2016 4,340 4,310 2,800 11,400 12,300 23,800
2017 9,060 7,870 5,700 22,600 20,200 42,800
2018 14,690 11,420 5,540 31,700 27,000 58,700
2019 13,090 7,780 6,180 27,000 21,700 48,800
2020 12,720 4,660 6,470 23,900 24,600 48,500
2021 14,780 4,910 9,830 29,500 25,400 54,900
2022 16,840 5,160 7,920 29,900 26,300 56,200
2023 11,410 4,260 4,430 20,100 8,100 28,200
20 British Columbia 2022 Labour Market Outlook
BC LNG WORKFORCE OCCUPATION Forecast CONTINUED
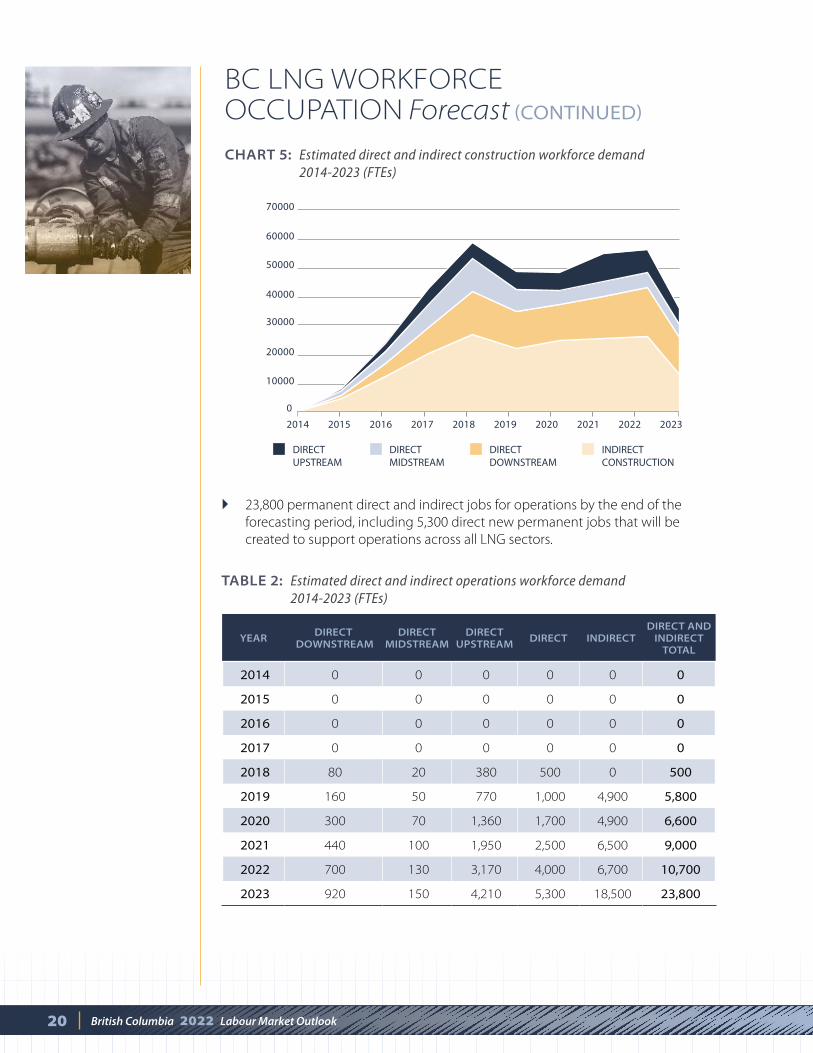
CHART 5: Estimated direct and indirect construction workforce demand 2014-2023 (FTEs)
0
10000
20000
30000
40000
50000
60000
70000
2014 2015 2016 2017 2018 2019 2020 2021 2022 2023
DIRECT UPSTREAM
DIRECT MIDSTREAM
DIRECT DOWNSTREAM
INDIRECT CONSTRUCTION
23,800 permanent direct and indirect jobs for operations by the end of the
forecasting period, including 5,300 direct new permanent jobs that will be
created to support operations across all LNG sectors.
TABLE 2: Estimated direct and indirect operations workforce demand 2014-2023 (FTEs)
YEAR DIRECT DOWNSTREAM
DIRECT MIDSTREAM
DIRECT UPSTREAM DIRECT INDIRECT
DIRECT AND INDIRECT
TOTAL
2014 0 0 0 0 0 0
2015 0 0 0 0 0 0
2016 0 0 0 0 0 0
2017 0 0 0 0 0 0
2018 80 20 380 500 0 500
2019 160 50 770 1,000 4,900 5,800
2020 300 70 1,360 1,700 4,900 6,600
2021 440 100 1,950 2,500 6,500 9,000
2022 700 130 3,170 4,000 6,700 10,700
2023 920 150 4,210 5,300 18,500 23,800
21British Columbia 2022 Labour Market Outlook
BC LNG WORKFORCE OCCUPATION Forecast CONTINUED
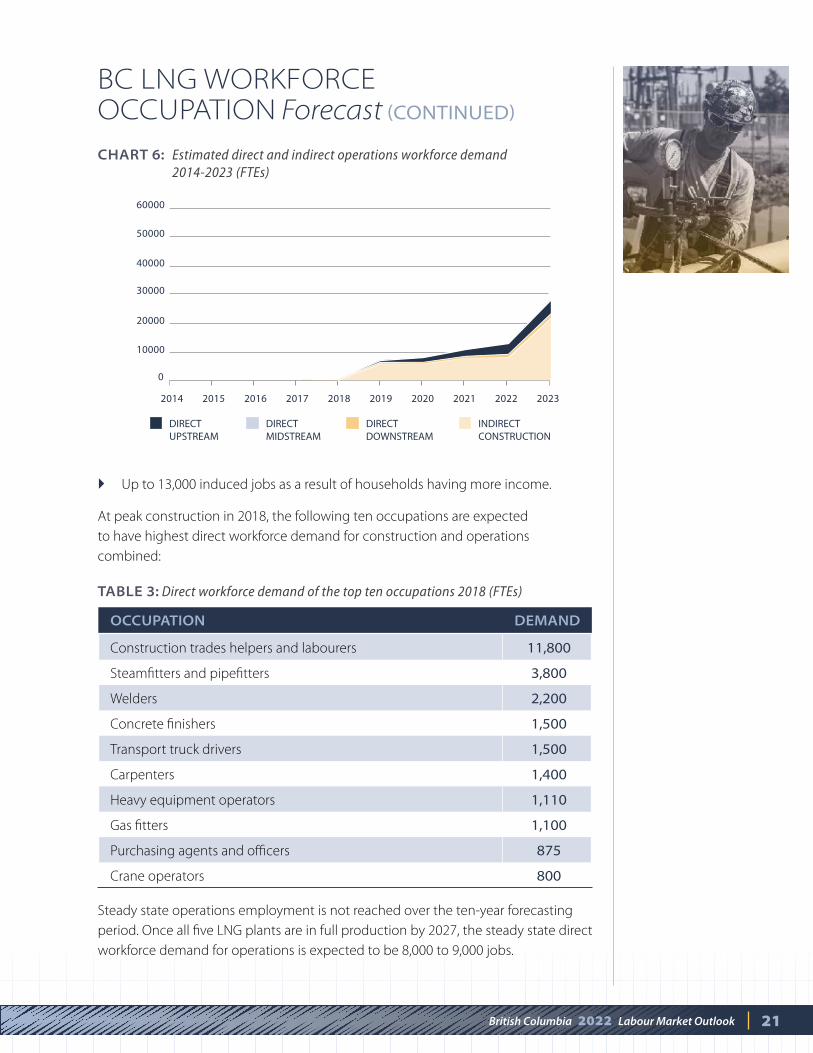
CHART 6: Estimated direct and indirect operations workforce demand 2014-2023 (FTEs)
0
10000
20000
30000
40000
50000
60000
2014 2015 2016 2017 2018 2019 2020 2021 2022 2023
DIRECT UPSTREAM
DIRECT MIDSTREAM
DIRECT DOWNSTREAM
INDIRECT CONSTRUCTION
Up to 13,000 induced jobs as a result of households having more income.
At peak construction in 2018, the following ten occupations are expected
to have highest direct workforce demand for construction and operations
combined:
TABLE 3: Direct workforce demand of the top ten occupations 2018 (FTEs)
OCCUPATION DEMAND
Construction trades helpers and labourers 11,800
Steamfitters and pipefitters 3,800
Welders 2,200
Concrete finishers 1,500
Transport truck drivers 1,500
Carpenters 1,400
Heavy equipment operators 1,110
Gas fitters 1,100
Purchasing agents and officers 875
Crane operators 800
Steady state operations employment is not reached over the ten-year forecasting
period. Once all five LNG plants are in full production by 2027, the steady state direct
workforce demand for operations is expected to be 8,000 to 9,000 jobs.

22 British Columbia 2022 Labour Market Outlook
CONCLUSIONFrom 2010 to 2013, the B.C. economy and labour market experienced moderate
gains and while uncertainty remains about the strength of future growth, the labour
market is expected to improve in the coming years. Tight labour market conditions
for B.C. overall are expected in the second half of the forecast period starting
in 2019.
Over the outlook period to 2022, over one million job openings are expected
across the province including the expected LNG activity. At the same time,
the number of workers needed will gradually become greater than the number
of workers available.
The demographic profile of the province continues to influence the dynamics
of the labour market. With relatively modest growth in new job creation, over two-
thirds (68 per cent) of projected job openings will be to replace retiring workers.
The population of the province is expected to continue to age, and the number
of new entrants from within B.C. that join the workforce for the first time is expected
to decline slightly over the forecast period. Migrants from outside the province will
be an increasingly important source of new labour supply.
A key assumption of the Model is that the regions of the province will be able
to attract migrants to meet labour market needs. If regions are unable to attract
migrants at the predicted levels, then labour market pressures will be more intense.
As a result, in addition to increasing participation rates, enhancing productivity and
ensuring the most responsive education and training systems possible, migration
is expected to become an increasingly important means to address B.C.’s anticipated
labour market shortages.
WE LOOK FORWARD TO CONTINUING TO IMPROVE THE OUTLOOK. We welcome your thoughts
on those aspects of the Outlook that are most valuable, as well as those
that can be improved as we continue to build a reliable labour market
information system for our province and its diverse regions.
PLEASE CONTACT US AT: [email protected]
23British Columbia 2022 Labour Market Outlook
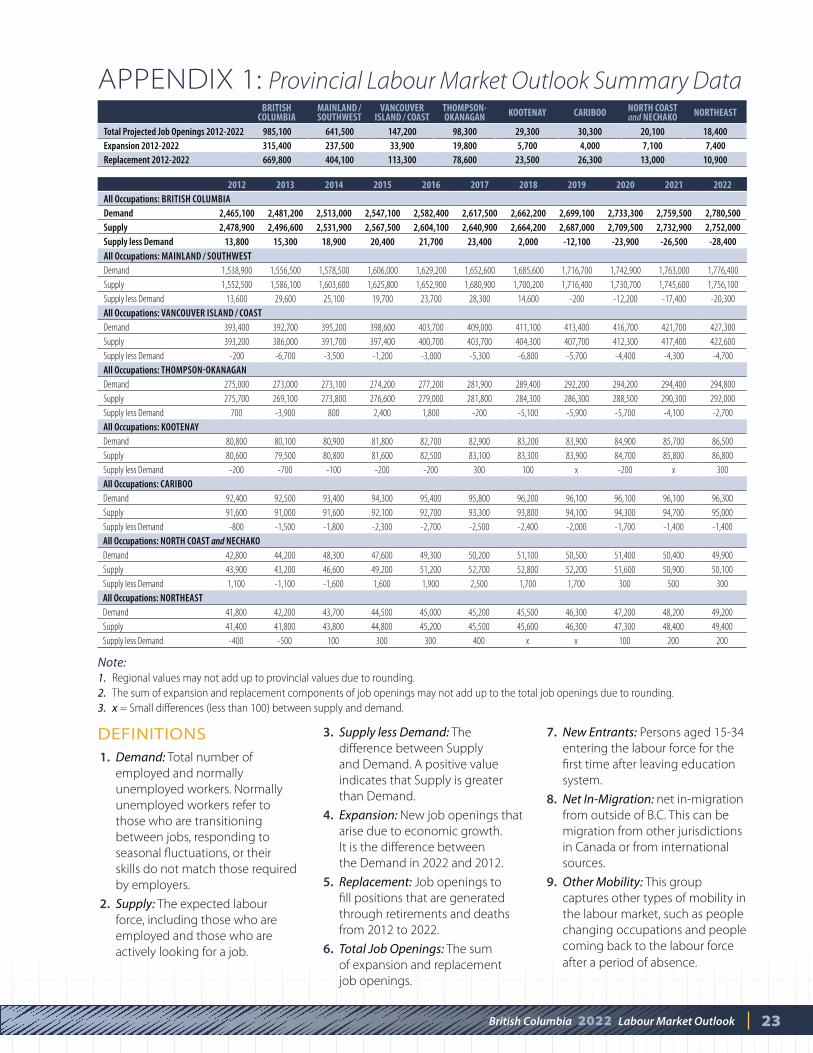
APPENDIX 1: Provincial Labour Market Outlook Summary Data
2012 2013 2014 2015 2016 2017 2018 2019 2020 2021 2022All Occupations: BRITISH COLUMBIADemand 2,465,100 2,481,200 2,513,000 2,547,100 2,582,400 2,617,500 2,662,200 2,699,100 2,733,300 2,759,500 2,780,500Supply 2,478,900 2,496,600 2,531,900 2,567,500 2,604,100 2,640,900 2,664,200 2,687,000 2,709,500 2,732,900 2,752,000Supply less Demand 13,800 15,300 18,900 20,400 21,700 23,400 2,000 -12,100 -23,900 -26,500 -28,400All Occupations: MAINLAND / SOUTHWESTDemand 1,538,900 1,556,500 1,578,500 1,606,000 1,629,200 1,652,600 1,685,600 1,716,700 1,742,900 1,763,000 1,776,400Supply 1,552,500 1,586,100 1,603,600 1,625,800 1,652,900 1,680,900 1,700,200 1,716,400 1,730,700 1,745,600 1,756,100Supply less Demand 13,600 29,600 25,100 19,700 23,700 28,300 14,600 -200 -12,200 -17,400 -20,300All Occupations: VANCOUVER ISLAND / COASTDemand 393,400 392,700 395,200 398,600 403,700 409,000 411,100 413,400 416,700 421,700 427,300Supply 393,200 386,000 391,700 397,400 400,700 403,700 404,300 407,700 412,300 417,400 422,600Supply less Demand -200 -6,700 -3,500 -1,200 -3,000 -5,300 -6,800 -5,700 -4,400 -4,300 -4,700All Occupations: THOMPSONOKANAGANDemand 275,000 273,000 273,100 274,200 277,200 281,900 289,400 292,200 294,200 294,400 294,800Supply 275,700 269,100 273,800 276,600 279,000 281,800 284,300 286,300 288,500 290,300 292,000Supply less Demand 700 -3,900 800 2,400 1,800 -200 -5,100 -5,900 -5,700 -4,100 -2,700All Occupations: KOOTENAYDemand 80,800 80,100 80,900 81,800 82,700 82,900 83,200 83,900 84,900 85,700 86,500Supply 80,600 79,500 80,800 81,600 82,500 83,100 83,300 83,900 84,700 85,800 86,800Supply less Demand -200 -700 -100 -200 -200 300 100 x -200 x 300All Occupations: CARIBOODemand 92,400 92,500 93,400 94,300 95,400 95,800 96,200 96,100 96,100 96,100 96,300Supply 91,600 91,000 91,600 92,100 92,700 93,300 93,800 94,100 94,300 94,700 95,000Supply less Demand -800 -1,500 -1,800 -2,300 -2,700 -2,500 -2,400 -2,000 -1,700 -1,400 -1,400All Occupations: NORTH COAST and NECHAKODemand 42,800 44,200 48,300 47,600 49,300 50,200 51,100 50,500 51,400 50,400 49,900Supply 43,900 43,200 46,600 49,200 51,200 52,700 52,800 52,200 51,600 50,900 50,100Supply less Demand 1,100 -1,100 -1,600 1,600 1,900 2,500 1,700 1,700 300 500 300All Occupations: NORTHEASTDemand 41,800 42,200 43,700 44,500 45,000 45,200 45,500 46,300 47,200 48,200 49,200Supply 41,400 41,800 43,800 44,800 45,200 45,500 45,600 46,300 47,300 48,400 49,400Supply less Demand -400 -500 100 300 300 400 x x 100 200 200
BRITISH COLUMBIA
MAINLAND / SOUTHWEST
VANCOUVER ISLAND / COAST
THOMPSON- OKANAGAN KOOTENAY CARIBOO NORTH COAST
and NECHAKO NORTHEAST
Total Projected Job Openings 2012-2022 985,100 641,500 147,200 98,300 29,300 30,300 20,100 18,400Expansion 2012-2022 315,400 237,500 33,900 19,800 5,700 4,000 7,100 7,400Replacement 2012-2022 669,800 404,100 113,300 78,600 23,500 26,300 13,000 10,900
DEFINITIONS 1. Demand: Total number of
employed and normally
unemployed workers. Normally
unemployed workers refer to
those who are transitioning
between jobs, responding to
seasonal fluctuations, or their
skills do not match those required
by employers.
2. Supply: The expected labour
force, including those who are
employed and those who are
actively looking for a job.
3. Supply less Demand: The
difference between Supply
and Demand. A positive value
indicates that Supply is greater
than Demand.
4. Expansion: New job openings that
arise due to economic growth.
It is the difference between
the Demand in 2022 and 2012.
5. Replacement: Job openings to
fill positions that are generated
through retirements and deaths
from 2012 to 2022.
6. Total Job Openings: The sum
of expansion and replacement
job openings.
7. New Entrants: Persons aged 15-34
entering the labour force for the
first time after leaving education
system.
8. Net In-Migration: net in-migration
from outside of B.C. This can be
migration from other jurisdictions
in Canada or from international
sources.
9. Other Mobility: This group
captures other types of mobility in
the labour market, such as people
changing occupations and people
coming back to the labour force
after a period of absence.
Note: 1. Regional values may not add up to provincial values due to rounding.
2. The sum of expansion and replacement components of job openings may not add up to the total job openings due to rounding.
3. x = Small differences (less than 100) between supply and demand.

24 British Columbia 2022 Labour Market Outlook
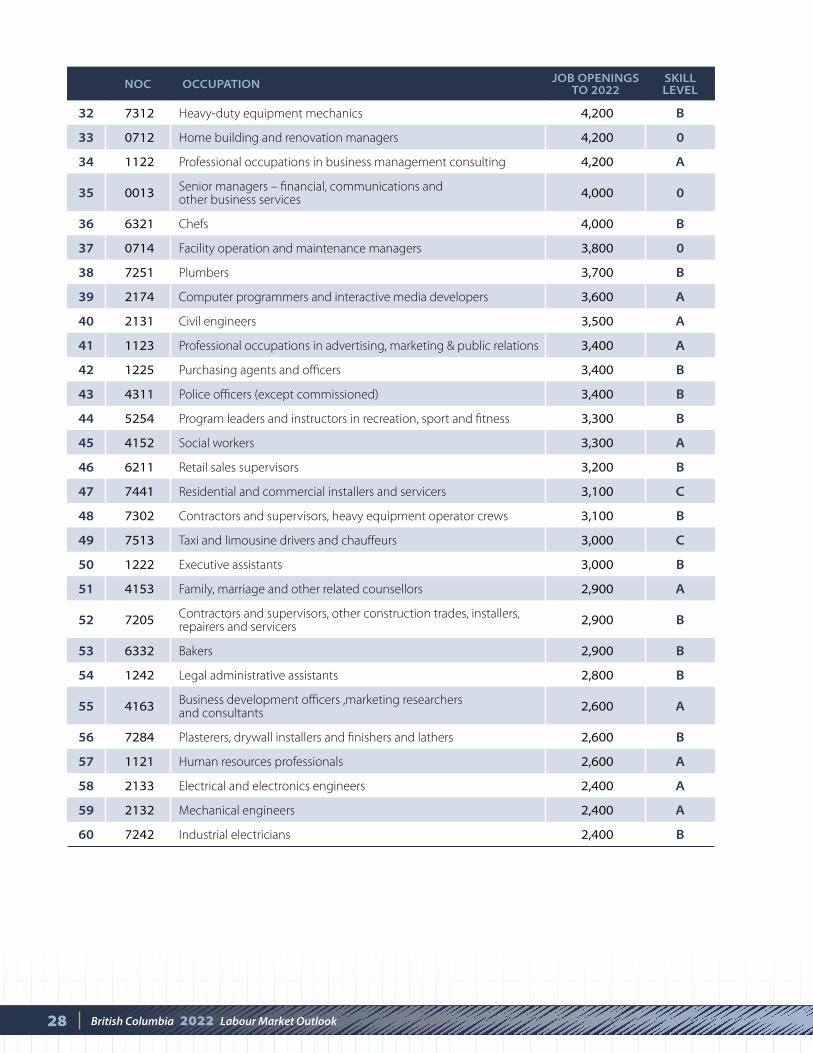
APPENDIX 2: Jobs in Demand: Top 60
All jobs in the economy are categorized into 500 occupations. Projected labour
market needs were compared to the projected labour supply for each occupation.
The top occupations are largely determined by the expected cumulative job
openings to 2022. Occupations that are expected to have an adequate supply of
workers are not included. Job openings here incorporate both the Model results and
LNG workforce needs. Job openings are created by people permanently leaving the
labour force and creating a vacancy through retirements and deaths, and new jobs
created through economic growth.
The lists include occupations that require training, broadly defined as a university
degree (Skill level A), college or apprenticeship training (Skill level B), and high
school and/or occupation-specific training (Skill level C). Skill Level D, or lower-skilled
occupations, are excluded. Management occupations are included in Skill Level A.
Skill levels are based on Statistics Canada’s National Occupational Classification
(NOC) system.
The Ministry of Health has identified the priority health professions in B.C. These
occupations are presented separately from the top 60 lists of occupations that
require training.
PROVINCIAL PRIORITY HEALTH PROFESSIONS
Audiologist
Medical Laboratory Technologist
Medical Radiation Technologist
Occupational Therapist
Physical Therapist
Physician-General/Specialist
Registered Nurse
Registered Nurse – Specialty
Speech Language Pathologist
Ultrasonographer
REPORT DESCRIPTIONS:
List 1: Top 60 occupations that require training – Post-Secondary Only
Skill type 0*, Skill level A and B
List 2: Top 60 occupations that require training
Skill type 0*, Skill level A, B and C
* In this report, management occupations are identified using their skill type ("0")
to distinguish them from other Skill Level A occupations.
25British Columbia 2022 Labour Market Outlook
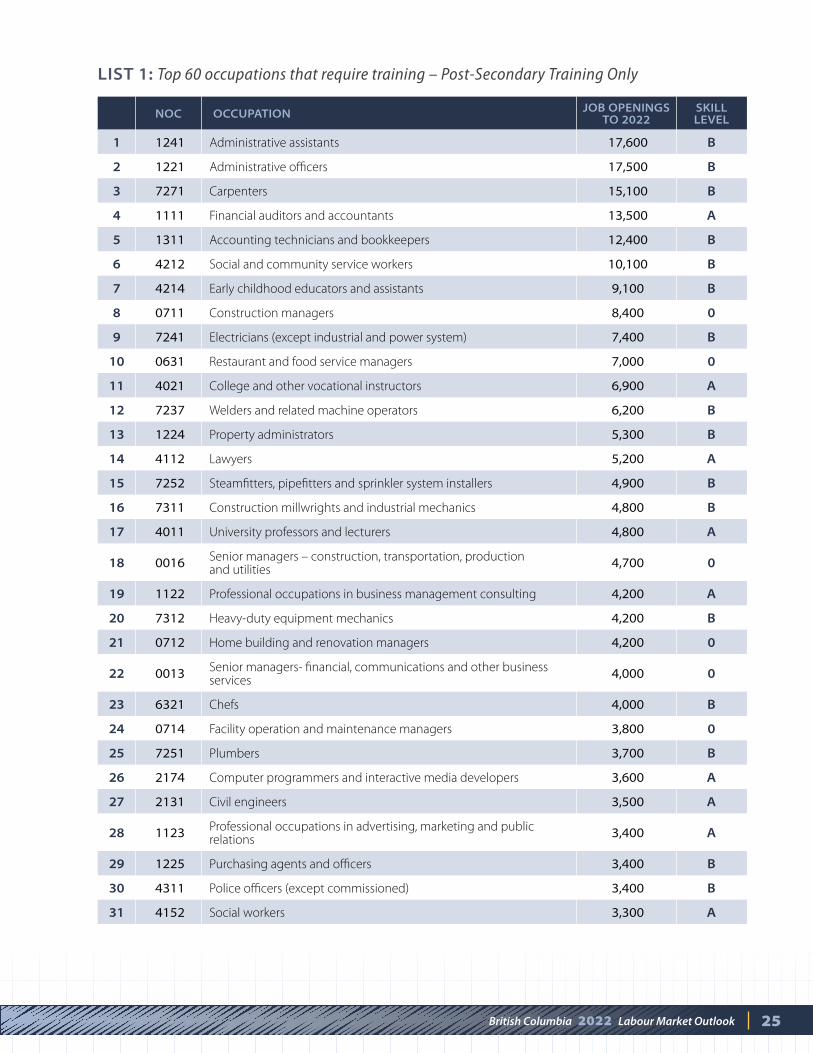
LIST 1: Top 60 occupations that require training – Post-Secondary Training Only
NOC OCCUPATION JOB OPENINGS TO 2022
SKILL LEVEL
1 1241 Administrative assistants 17,600 B
2 1221 Administrative officers 17,500 B
3 7271 Carpenters 15,100 B
4 1111 Financial auditors and accountants 13,500 A
5 1311 Accounting technicians and bookkeepers 12,400 B
6 4212 Social and community service workers 10,100 B
7 4214 Early childhood educators and assistants 9,100 B
8 0711 Construction managers 8,400 0
9 7241 Electricians (except industrial and power system) 7,400 B
10 0631 Restaurant and food service managers 7,000 0
11 4021 College and other vocational instructors 6,900 A
12 7237 Welders and related machine operators 6,200 B
13 1224 Property administrators 5,300 B
14 4112 Lawyers 5,200 A
15 7252 Steamfitters, pipefitters and sprinkler system installers 4,900 B
16 7311 Construction millwrights and industrial mechanics 4,800 B
17 4011 University professors and lecturers 4,800 A
18 0016 Senior managers – construction, transportation, production and utilities
4,700 0
19 1122 Professional occupations in business management consulting 4,200 A
20 7312 Heavy-duty equipment mechanics 4,200 B
21 0712 Home building and renovation managers 4,200 0
22 0013 Senior managers- financial, communications and other business services
4,000 0
23 6321 Chefs 4,000 B
24 0714 Facility operation and maintenance managers 3,800 0
25 7251 Plumbers 3,700 B
26 2174 Computer programmers and interactive media developers 3,600 A
27 2131 Civil engineers 3,500 A
28 1123 Professional occupations in advertising, marketing and public relations
3,400 A
29 1225 Purchasing agents and officers 3,400 B
30 4311 Police officers (except commissioned) 3,400 B
31 4152 Social workers 3,300 A
26 British Columbia 2022 Labour Market Outlook
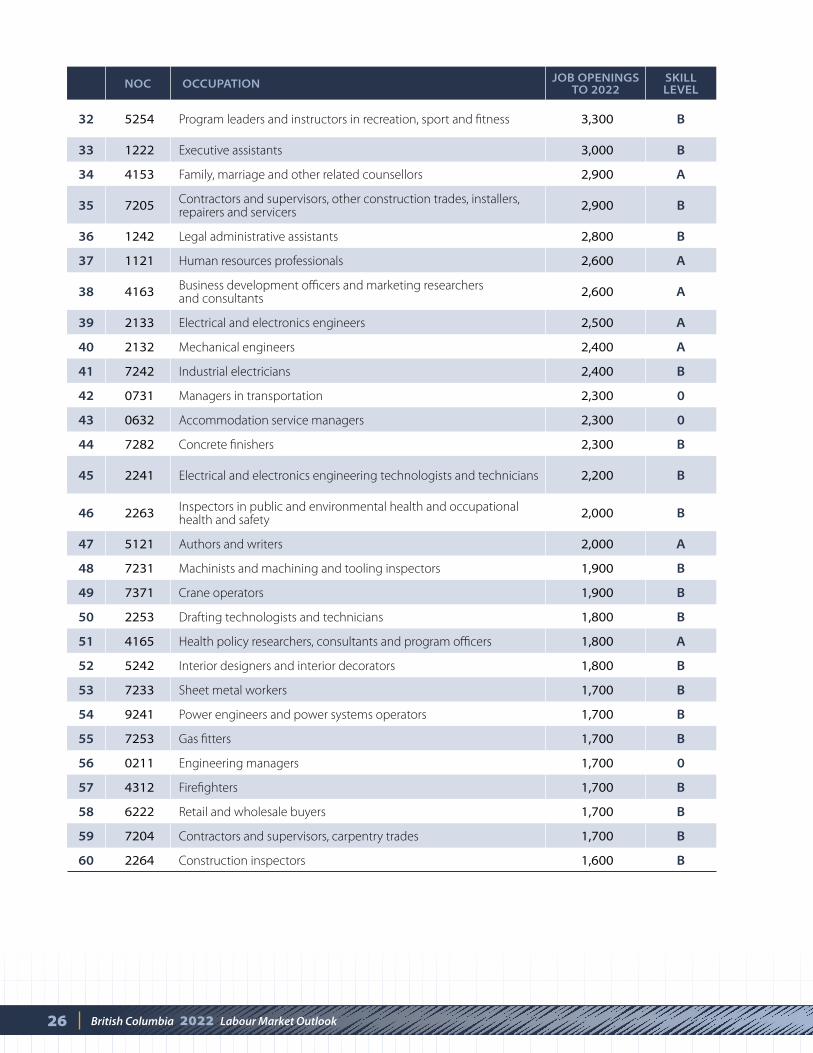
NOC OCCUPATION JOB OPENINGS TO 2022
SKILL LEVEL
32 5254 Program leaders and instructors in recreation, sport and fitness 3,300 B
33 1222 Executive assistants 3,000 B
34 4153 Family, marriage and other related counsellors 2,900 A
35 7205 Contractors and supervisors, other construction trades, installers, repairers and servicers
2,900 B
36 1242 Legal administrative assistants 2,800 B
37 1121 Human resources professionals 2,600 A
38 4163 Business development officers and marketing researchers and consultants
2,600 A
39 2133 Electrical and electronics engineers 2,500 A
40 2132 Mechanical engineers 2,400 A
41 7242 Industrial electricians 2,400 B
42 0731 Managers in transportation 2,300 0
43 0632 Accommodation service managers 2,300 0
44 7282 Concrete finishers 2,300 B
45 2241 Electrical and electronics engineering technologists and technicians 2,200 B
46 2263 Inspectors in public and environmental health and occupational health and safety
2,000 B
47 5121 Authors and writers 2,000 A
48 7231 Machinists and machining and tooling inspectors 1,900 B
49 7371 Crane operators 1,900 B
50 2253 Drafting technologists and technicians 1,800 B
51 4165 Health policy researchers, consultants and program officers 1,800 A
52 5242 Interior designers and interior decorators 1,800 B
53 7233 Sheet metal workers 1,700 B
54 9241 Power engineers and power systems operators 1,700 B
55 7253 Gas fitters 1,700 B
56 0211 Engineering managers 1,700 0
57 4312 Firefighters 1,700 B
58 6222 Retail and wholesale buyers 1,700 B
59 7204 Contractors and supervisors, carpentry trades 1,700 B
60 2264 Construction inspectors 1,600 B
27British Columbia 2022 Labour Market Outlook
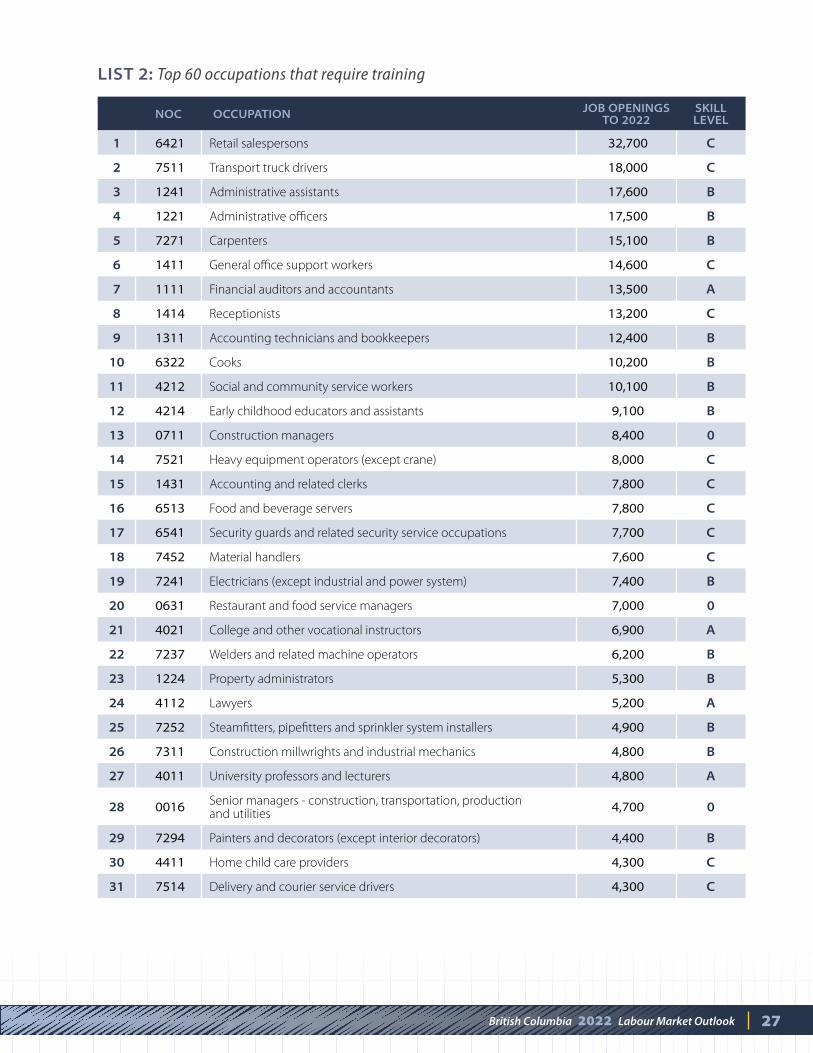
LIST 2: Top 60 occupations that require training
NOC OCCUPATION JOB OPENINGS TO 2022
SKILL LEVEL
1 6421 Retail salespersons 32,700 C
2 7511 Transport truck drivers 18,000 C
3 1241 Administrative assistants 17,600 B
4 1221 Administrative officers 17,500 B
5 7271 Carpenters 15,100 B
6 1411 General office support workers 14,600 C
7 1111 Financial auditors and accountants 13,500 A
8 1414 Receptionists 13,200 C
9 1311 Accounting technicians and bookkeepers 12,400 B
10 6322 Cooks 10,200 B
11 4212 Social and community service workers 10,100 B
12 4214 Early childhood educators and assistants 9,100 B
13 0711 Construction managers 8,400 0
14 7521 Heavy equipment operators (except crane) 8,000 C
15 1431 Accounting and related clerks 7,800 C
16 6513 Food and beverage servers 7,800 C
17 6541 Security guards and related security service occupations 7,700 C
18 7452 Material handlers 7,600 C
19 7241 Electricians (except industrial and power system) 7,400 B
20 0631 Restaurant and food service managers 7,000 0
21 4021 College and other vocational instructors 6,900 A
22 7237 Welders and related machine operators 6,200 B
23 1224 Property administrators 5,300 B
24 4112 Lawyers 5,200 A
25 7252 Steamfitters, pipefitters and sprinkler system installers 4,900 B
26 7311 Construction millwrights and industrial mechanics 4,800 B
27 4011 University professors and lecturers 4,800 A
28 0016 Senior managers - construction, transportation, production and utilities
4,700 0
29 7294 Painters and decorators (except interior decorators) 4,400 B
30 4411 Home child care providers 4,300 C
31 7514 Delivery and courier service drivers 4,300 C
28 British Columbia 2022 Labour Market Outlook
NOC OCCUPATION JOB OPENINGS TO 2022
SKILL LEVEL
32 7312 Heavy-duty equipment mechanics 4,200 B
33 0712 Home building and renovation managers 4,200 0
34 1122 Professional occupations in business management consulting 4,200 A
35 0013 Senior managers – financial, communications and other business services
4,000 0
36 6321 Chefs 4,000 B
37 0714 Facility operation and maintenance managers 3,800 0
38 7251 Plumbers 3,700 B
39 2174 Computer programmers and interactive media developers 3,600 A
40 2131 Civil engineers 3,500 A
41 1123 Professional occupations in advertising, marketing & public relations 3,400 A
42 1225 Purchasing agents and officers 3,400 B
43 4311 Police officers (except commissioned) 3,400 B
44 5254 Program leaders and instructors in recreation, sport and fitness 3,300 B
45 4152 Social workers 3,300 A
46 6211 Retail sales supervisors 3,200 B
47 7441 Residential and commercial installers and servicers 3,100 C
48 7302 Contractors and supervisors, heavy equipment operator crews 3,100 B
49 7513 Taxi and limousine drivers and chauffeurs 3,000 C
50 1222 Executive assistants 3,000 B
51 4153 Family, marriage and other related counsellors 2,900 A
52 7205 Contractors and supervisors, other construction trades, installers, repairers and servicers
2,900 B
53 6332 Bakers 2,900 B
54 1242 Legal administrative assistants 2,800 B
55 4163 Business development officers ,marketing researchers and consultants
2,600 A
56 7284 Plasterers, drywall installers and finishers and lathers 2,600 B
57 1121 Human resources professionals 2,600 A
58 2133 Electrical and electronics engineers 2,400 A
59 2132 Mechanical engineers 2,400 A
60 7242 Industrial electricians 2,400 B
29British Columbia 2022 Labour Market Outlook
APPENDIX 3: Methodology and Assumptions
MODEL STRUCTURE AND METHODOLOGY
The B.C. Labour Market Scenario Model is a labour market forecasting system to
generate a 10-year projection of occupation labour demand and supply for B.C.
and its seven development regions.
The Model is composed of two sets of models: regional macroeconomic models
and regional occupational models. The results of the regional models are rolled
up to generate the provincial results.
Regional Macroeconomic Models:
Each of the seven regional macroeconomic models includes 15 industries that
describe the entire economy. Industries are grouped using the 2007 North
American Industry Classification System (NAICS) structure. Twenty industries
(two-digit codes) in the NAICS are regrouped into 15 industries in the B.C.
Labour Market Scenario Model:
There are two main components in each regional macroeconomic model:
economic and demographic. The economic component links to the labour
demand projections in the occupational model. The demographic component
links to the labour supply projections in the occupational model.
Regional Occupational Models:
Provide projected labour demand and supply for a total of 140 occupations
at the 3-digit NOC level.
Economic and industry growth as well as major projects drive labour demand
in each region. Labour demand is determined by expected economic and
industry performance, as well as labour productivity.
Labour supply and its components of change are primarily driven by
demographic shifts, economic performance and labour force participation rates.
1. Agriculture
2. Oil and Gas
3. Forestry, Mining, Fishing and Hunting
(Other Primary Excluding Oil and Gas)
4. Manufacturing
5. Construction
6. Utilities
7. Transportation and Warehousing
8. Wholesale and Retail Trade
9. Finance, Insurance, and Real Estate
10. Professional, Scientific and
Managerial Services
11. Accommodation
and Food Services
12. Education Services
13. Health Care and Social
Assistance
14. Other Private Services (Repair
and maintenance; Automotive
repair and maintenance;
Personal and laundry services;
Religious, grant-making civic,
and professional and similar
organizations; and Private
households)
15. Government Services
30 British Columbia 2022 Labour Market Outlook
MODEL VALIDATION
Industry intelligence and expertise from ministries, industry associations,
professional groups, businesses, and other organizations are incorporated
to validate the model approach, assumptions and results.
Staff knowledge and internal research are also incorporated into Model
development.
The Conference Board of Canada reviewed the approach and methodology
of the B.C. Labour Market Scenario Model and concluded it to be sound and
“ The approach and methodology taken in developing the model is consistent with similar
customized products developed by leading organizations conducting economic analysis
and research.”
KEY ASSUMPTIONS
Macroeconomic indicators: Assumptions on key economic indicators such as
GDP, investment, income, capital stock and housing starts are incorporated into
the Model. GDP and employment growth assumptions are consistent with the
medium-term economic outlook in the B.C. Ministry of Finance Budget and
Fiscal Plan 2013 / 14 – 2015 / 16, released in June 2013. Economic outlooks for
B.C.’s major trading partners such as the U.S., Japan and European Union are
incorporated.
Labour productivity: Assumptions are made on the labour productivity growth
for each industry.
Population: Population projections (by region, including age and sex breakdown
and components of population change) are consistent with BC Stats’ population
projections.
Labour force participation rate: Assumptions are made on participation rate
trends by age and sex. Overall labour force participation rates are expected to
drop over the outlook period. However, the participation rate of women aged
55 and over is expected to increase.
APPENDIX 3: Methodology
and Assumptions CONTINUED
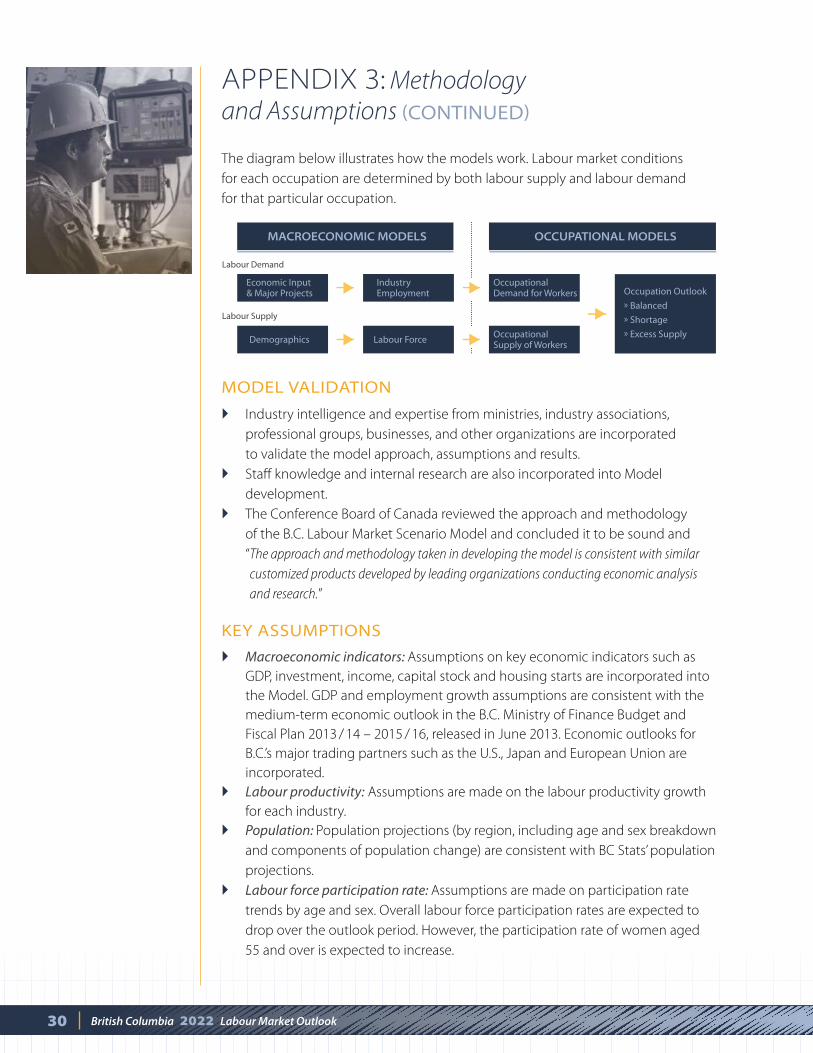
The diagram below illustrates how the models work. Labour market conditions
for each occupation are determined by both labour supply and labour demand
for that particular occupation.
MACROECONOMIC MODELS
Labour Demand
Labour Supply
Economic Input & Major Projects
Demographics
IndustryEmployment
Labour Force
Occupational Demand for Workers
Occupational Supply of Workers
OCCUPATIONAL MODELS
Occupation Outlook
Balanced
Shortage
Excess Supply
31British Columbia 2022 Labour Market Outlook
KEY ASSUMPTIONS CONTINUED
New entrants: Age and sex-specific participation rates are used to calculate
the number of new entrants to the labour market. New entrants are allocated
to different occupations based on each occupation’s historical demand share
out of occupation demand for all occupations. The Model assumes that there
will be no new entrants entering management and supervisory occupations
as these occupations usually require several years of work experience.
Retirements and deaths: Occupation-specific median retirement age and labour
force age structure are used to derive the number of retirements from the
labour force. Age and sex-specific death rates are used to calculate the number
of deaths in the labour force.
Labour force adjustment: It is assumed that: (1) Labour supply generally
responds to labour demand, and in the long run, labour force for an occupation
will be determined by the demand for the occupation; (2) Occupations need
to compete with each other for new labour supply; and (3) If the share of an
occupation in the economy is rising, so will its share of new entrants.
MAJOR CHANGES IN THE CYCLE
Rebasing of Provincial Economic Accounts (PEA): The new PEA were rebased to
2007 dollars and, as a result, all real variables are rebased from 2002 to 2007 with
some model equations calibrated to use the new 2007 dollars data. At the time
of updating, the available new PEA data were from 2007 to 2011, and these
were linked to the old 2002 PEA data from 1981 to 2006. More recently
released data, including back to 1981 and through 2012, will be incorporated
in future updates.
Industries: In the macroeconomic models, the Other Primary industry is broken
down into (1) Oil and Gas, and (2) Forestry, Mining, Fishing and Hunting.
Labour force: The macroeconomic models now include an estimate of the
labour force by age and sex.
Net in-migration: Net in-migration is further broken down to net international
in-migration and net inter-regional in-migration. Net inter-provincial in-
migration is the sum of net inter-regional in-migration for all seven regions.
Occupation-Industry employment matrix: The current forecasting cycle uses
an occupation-industry employment matrix based on the 2011 National
Household Survey (NHS). In previous model cycles, the occupation-industry
employment matrix was based on the 2006 Census.
National Occupational Classification (NOC): Occupations are now coded with
the 2011 version of the National Occupational Classification (NOC). In previous
model cycles, occupations were coded using the NOC 2006.

FOR MORE INFORMATION:
WWW.GOV.BC.CA
FOR MORE INFORMATION:
WWW.GOV.BC.CA


![British Columbia Labour Market Outlook 2010 - 2020 · Labour Market OutlookLabour Market Outlook British Columbia Labour Market Outlook: 2010-2020 [2] B.C. Labour Market Outlook,](https://static.fdocuments.in/doc/165x107/5e167e8e481eae63a43f8127/british-columbia-labour-market-outlook-2010-2020-labour-market-outlooklabour-market.jpg)
