Brighter Africa the Growth Potential of the Sub-Saharan Electricity Sector
64
February 2015 Antonio Castellano Adam Kendall Mikhail Nikomarov Tarryn Swemmer Electric Power & Natural Gas Brighter Africa The growth potential of the sub-Saharan electricity sector
-
Upload
adebayo-olanrewaju-charles -
Category
Documents
-
view
17 -
download
2
description
McKinsey confidential document on the Growth of the SSA Electricity Sector.
Transcript of Brighter Africa the Growth Potential of the Sub-Saharan Electricity Sector
February 2015
Antonio Castellano
Adam Kendall
Mikhail Nikomarov
Tarryn Swemmer
Electric Power & Natural Gas
Brighter AfricaThe growth potential of the sub-Saharan electricity sector
Contents
Brighter Africa: The growth potential of the sub-Saharan electricity sector
Executive summary 2
The African power system is significantly underdeveloped 6
Estimating sub-Saharan Africa’s electricity demand in 2040 10
Estimating capacity needs and investment requirements 17
Sidebar: Is nuclear in Africa’s future? 20
Sidebar: Power project cost overruns 25
Sidebar: The role of coal imports 26
Exploring different paths that could reduce carbon emissions or save on capital spending 27
Sidebar: Can countries rely on imported electricity? 29
Sidebar: The story behind Grand Inga 32
Sidebar: An African gas revolution? 33
Sidebar: Two and a half million new jobs in Africa 35
Sidebar: Can Africa grow without a grid? 35
Pursuing a new approach to achieving Africa’s energy potential 37
Sidebar: The disincentive to grow the power sector 39
Appendix I: Structure of the African Regional Electricity Model 44
Appendix II: Calculation of the capacity available by primary-energy source 45
Appendix III: Weighted average cost of capital 48
Appendix IV: Cost inputs for calculation of levelized costs of energy 50
Appendix V: How the optimization model works 56
Appendix VI: Structure of different scenarios run in the African Regional Electricity Model 57
1
Preface
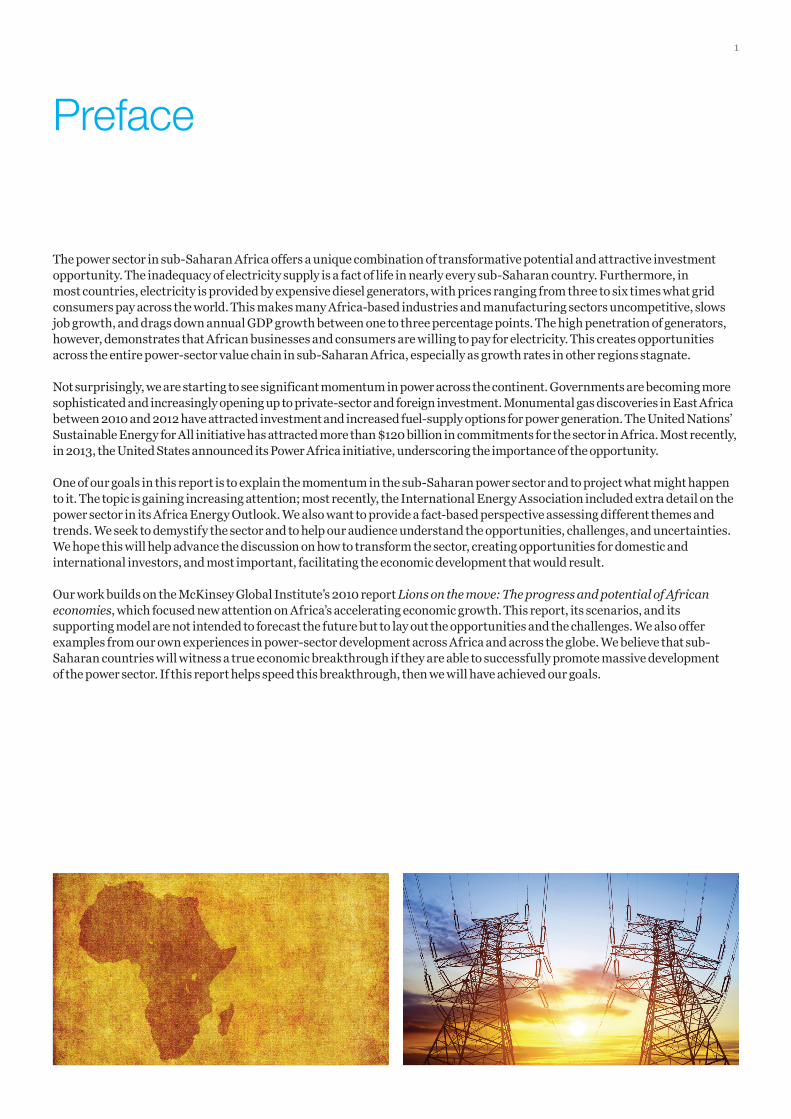
The power sector in sub-Saharan Africa offers a unique combination of transformative potential and attractive investment opportunity. The inadequacy of electricity supply is a fact of life in nearly every sub-Saharan country. Furthermore, in most countries, electricity is provided by expensive diesel generators, with prices ranging from three to six times what grid consumers pay across the world. This makes many Africa-based industries and manufacturing sectors uncompetitive, slows job growth, and drags down annual GDP growth between one to three percentage points. The high penetration of generators, however, demonstrates that African businesses and consumers are willing to pay for electricity. This creates opportunities across the entire power-sector value chain in sub-Saharan Africa, especially as growth rates in other regions stagnate.
Not surprisingly, we are starting to see significant momentum in power across the continent. Governments are becoming more sophisticated and increasingly opening up to private-sector and foreign investment. Monumental gas discoveries in East Africa between 2010 and 2012 have attracted investment and increased fuel-supply options for power generation. The United Nations’ Sustainable Energy for All initiative has attracted more than $120 billion in commitments for the sector in Africa. Most recently, in 2013, the United States announced its Power Africa initiative, underscoring the importance of the opportunity.
One of our goals in this report is to explain the momentum in the sub-Saharan power sector and to project what might happen to it. The topic is gaining increasing attention; most recently, the International Energy Association included extra detail on the power sector in its Africa Energy Outlook. We also want to provide a fact-based perspective assessing different themes and trends. We seek to demystify the sector and to help our audience understand the opportunities, challenges, and uncertainties. We hope this will help advance the discussion on how to transform the sector, creating opportunities for domestic and international investors, and most important, facilitating the economic development that would result.
Our work builds on the McKinsey Global Institute’s 2010 report Lions on the move: The progress and potential of African economies, which focused new attention on Africa’s accelerating economic growth. This report, its scenarios, and its supporting model are not intended to forecast the future but to lay out the opportunities and the challenges. We also offer examples from our own experiences in power-sector development across Africa and across the globe. We believe that sub-Saharan countries will witness a true economic breakthrough if they are able to successfully promote massive development of the power sector. If this report helps speed this breakthrough, then we will have achieved our goals.
2
Executive summary
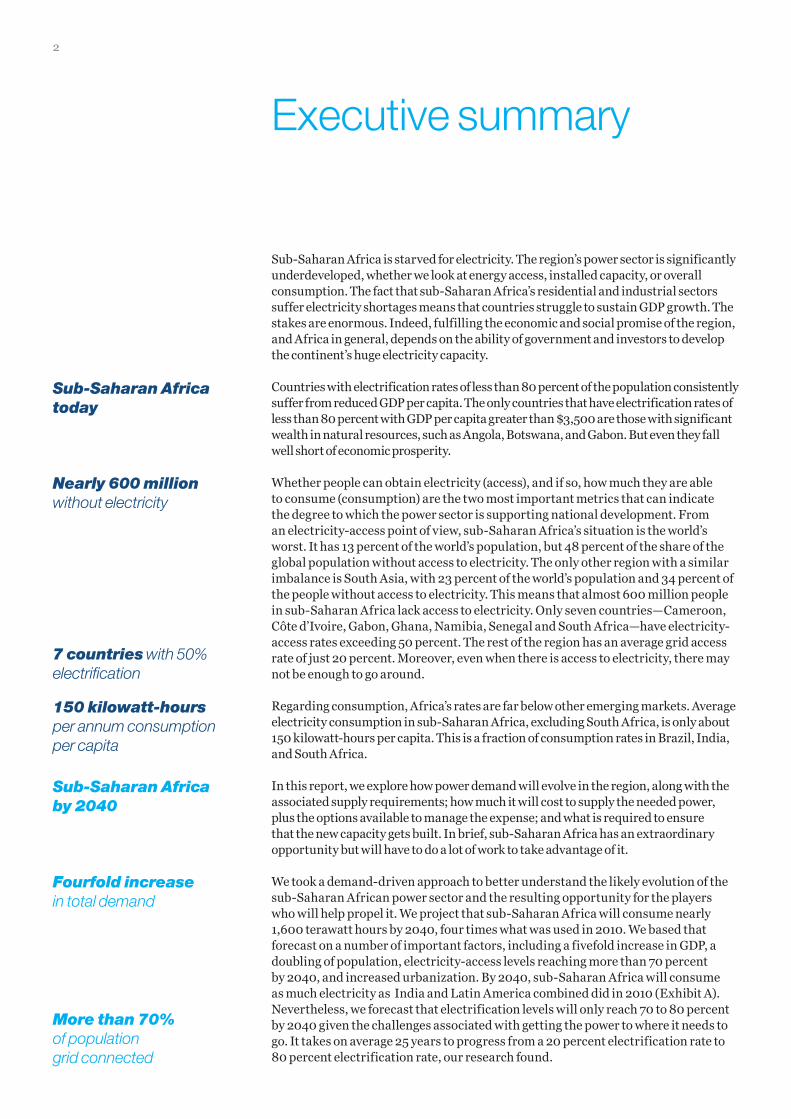
Sub-Saharan Africa is starved for electricity. The region’s power sector is significantly underdeveloped, whether we look at energy access, installed capacity, or overall consumption. The fact that sub-Saharan Africa’s residential and industrial sectors suffer electricity shortages means that countries struggle to sustain GDP growth. The stakes are enormous. Indeed, fulfilling the economic and social promise of the region, and Africa in general, depends on the ability of government and investors to develop the continent’s huge electricity capacity.
Countries with electrification rates of less than 80 percent of the population consistently suffer from reduced GDP per capita. The only countries that have electrification rates of less than 80 percent with GDP per capita greater than $3,500 are those with significant wealth in natural resources, such as Angola, Botswana, and Gabon. But even they fall well short of economic prosperity.
Whether people can obtain electricity (access), and if so, how much they are able to consume (consumption) are the two most important metrics that can indicate the degree to which the power sector is supporting national development. From an electricity-access point of view, sub-Saharan Africa’s situation is the world’s worst. It has 13 percent of the world’s population, but 48 percent of the share of the global population without access to electricity. The only other region with a similar imbalance is South Asia, with 23 percent of the world’s population and 34 percent of the people without access to electricity. This means that almost 600 million people in sub-Saharan Africa lack access to electricity. Only seven countries—Cameroon, Côte d’Ivoire, Gabon, Ghana, Namibia, Senegal and South Africa—have electricity-access rates exceeding 50 percent. The rest of the region has an average grid access rate of just 20 percent. Moreover, even when there is access to electricity, there may not be enough to go around.
Regarding consumption, Africa’s rates are far below other emerging markets. Average electricity consumption in sub-Saharan Africa, excluding South Africa, is only about 150 kilowatt-hours per capita. This is a fraction of consumption rates in Brazil, India, and South Africa.
In this report, we explore how power demand will evolve in the region, along with the associated supply requirements; how much it will cost to supply the needed power, plus the options available to manage the expense; and what is required to ensure that the new capacity gets built. In brief, sub-Saharan Africa has an extraordinary opportunity but will have to do a lot of work to take advantage of it.
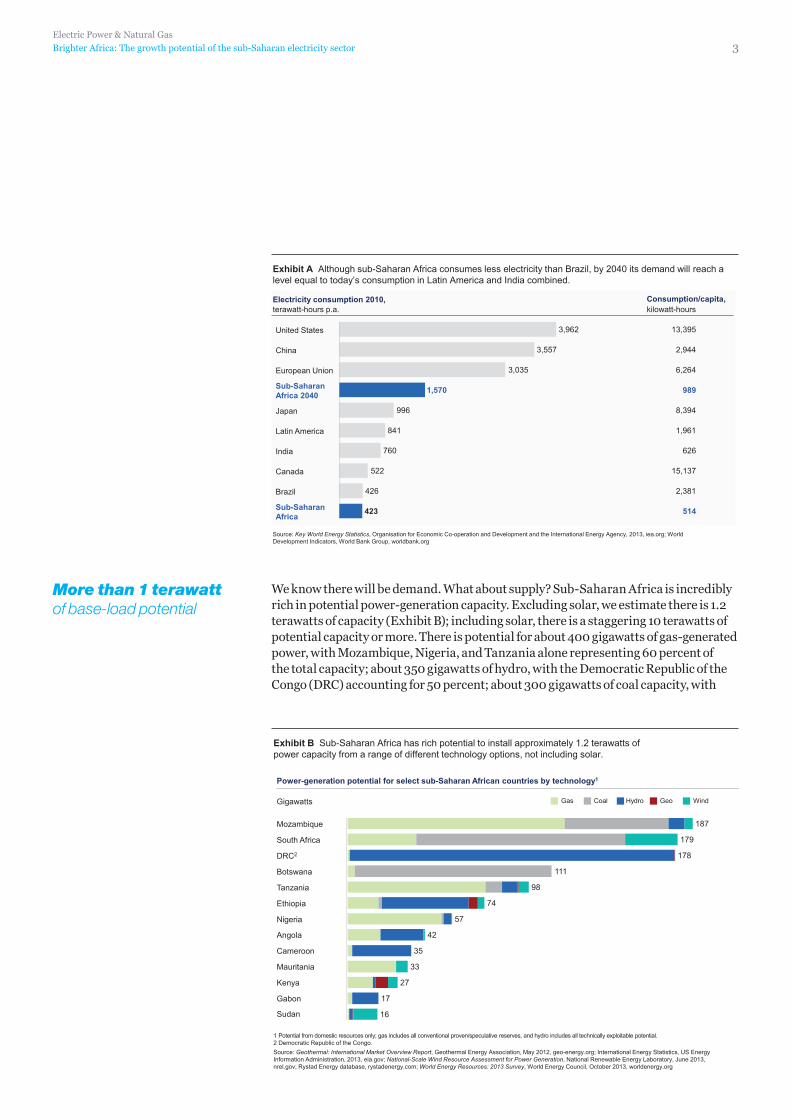
We took a demand-driven approach to better understand the likely evolution of the sub-Saharan African power sector and the resulting opportunity for the players who will help propel it. We project that sub-Saharan Africa will consume nearly 1,600 terawatt hours by 2040, four times what was used in 2010. We based that forecast on a number of important factors, including a fivefold increase in GDP, a doubling of population, electricity-access levels reaching more than 70 percent by 2040, and increased urbanization. By 2040, sub-Saharan Africa will consume as much electricity as India and Latin America combined did in 2010 (Exhibit A). Nevertheless, we forecast that electrification levels will only reach 70 to 80 percent by 2040 given the challenges associated with getting the power to where it needs to go. It takes on average 25 years to progress from a 20 percent electrification rate to 80 percent electrification rate, our research found.
Nearly 600 million without electricity
Sub-Saharan Africa today
Sub-Saharan Africa by 2040
150 kilowatt-hours per annum consumption per capita
7 countries with 50% electrification
Fourfold increase in total demand
More than 70% of population grid connected
Electric Power & Natural Gas
Brighter Africa: The growth potential of the sub-Saharan electricity sector 3
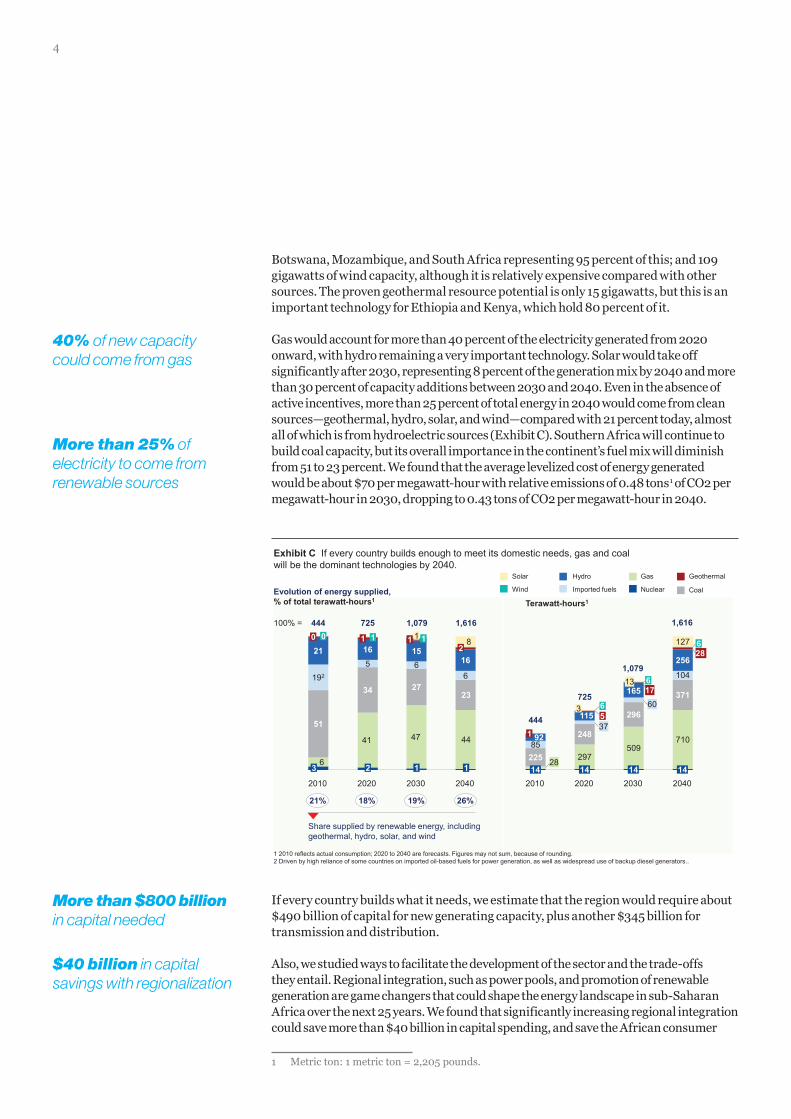
We know there will be demand. What about supply? Sub-Saharan Africa is incredibly rich in potential power-generation capacity. Excluding solar, we estimate there is 1.2 terawatts of capacity (Exhibit B); including solar, there is a staggering 10 terawatts of potential capacity or more. There is potential for about 400 gigawatts of gas-generated power, with Mozambique, Nigeria, and Tanzania alone representing 60 percent of the total capacity; about 350 gigawatts of hydro, with the Democratic Republic of the Congo (DRC) accounting for 50 percent; about 300 gigawatts of coal capacity, with
More than 1 terawatt of base-load potential
Exhibit A Although sub-Saharan Africa consumes less electricity than Brazil, by 2040 its demand will reach a level equal to today’s consumption in Latin America and India combined.
Source: Key World Energy Statistics, Organisation for Economic Co-operation and Development and the International Energy Agency, 2013, iea.org; World Development Indicators, World Bank Group, worldbank.org
terawatt-hours p.a.Consumption/capita,Electricity consumption 2010,
426
522
760
841
996
3,035
3,557
3,962
Brazil
Sub-SaharanAfrica 423
Canada
India
Latin America
Japan
Sub-Saharan Africa 2040 1,570
European Union
China
United States
kilowatt-hours
13,395
2,944
6,264
989
8,394
1,961
626
15,137
2,381
514
Exhibit B Sub-Saharan Africa has rich potential to install approximately 1.2 terawatts of power capacity from a range of different technology options, not including solar.
1 Potential from domestic resources only; gas includes all conventional proven/speculative reserves, and hydro includes all technically exploitable potential.2 Democratic Republic of the Congo.Source: Geothermal: International Market Overview Report, Geothermal Energy Association, May 2012, geo-energy.org; International Energy Statistics, US Energy Information Administration, 2013, eia.gov; National-Scale Wind Resource Assessment for Power Generation, National Renewable Energy Laboratory, June 2013, nrel.gov; Rystad Energy database, rystadenergy.com; World Energy Resources: 2013 Survey, World Energy Council, October 2013, worldenergy.org
Gigawatts
Power-generation potential for select sub-Saharan African countries by technology1
Mozambique
South Africa
Gabon
Kenya
Mauritania
Cameroon
Angola
Nigeria
Ethiopia
Tanzania
Botswana
DRC2
WindHydroCoalGas Geo
27
33
16
57
74
98
111
35
178
187
17
42
179
Sudan
4
Botswana, Mozambique, and South Africa representing 95 percent of this; and 109 gigawatts of wind capacity, although it is relatively expensive compared with other sources. The proven geothermal resource potential is only 15 gigawatts, but this is an important technology for Ethiopia and Kenya, which hold 80 percent of it.
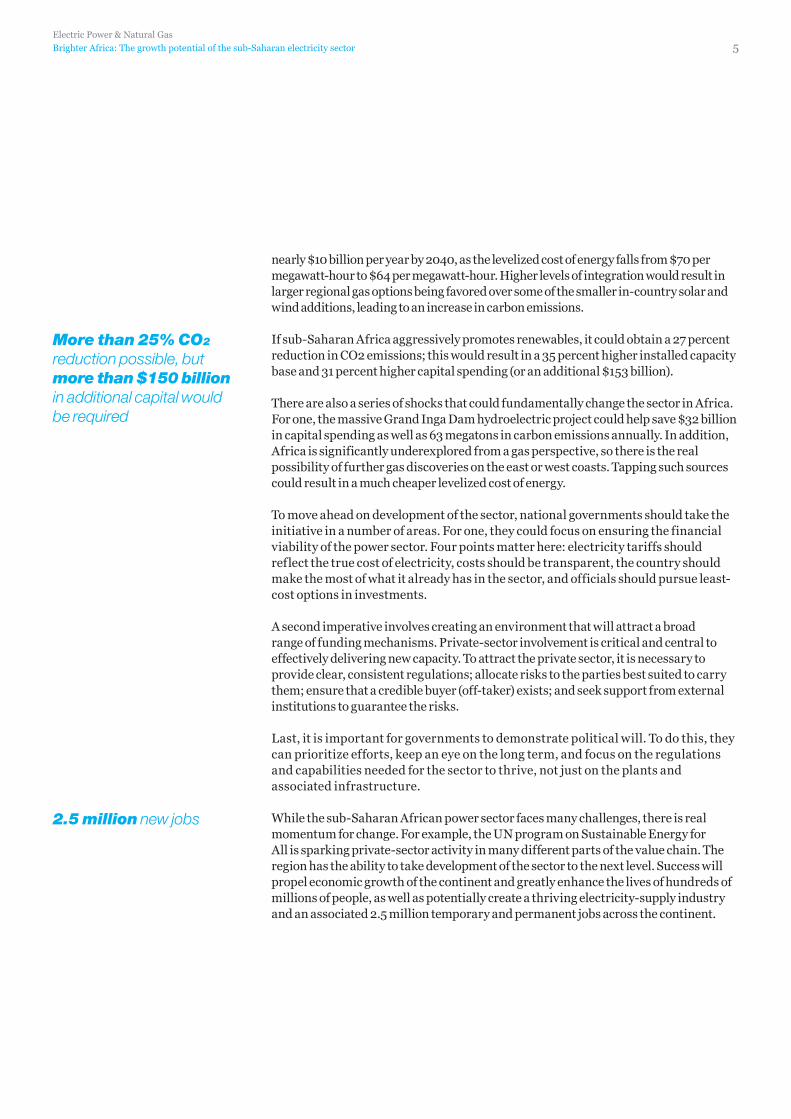
Gas would account for more than 40 percent of the electricity generated from 2020 onward, with hydro remaining a very important technology. Solar would take off significantly after 2030, representing 8 percent of the generation mix by 2040 and more than 30 percent of capacity additions between 2030 and 2040. Even in the absence of active incentives, more than 25 percent of total energy in 2040 would come from clean sources—geothermal, hydro, solar, and wind—compared with 21 percent today, almost all of which is from hydroelectric sources (Exhibit C). Southern Africa will continue to build coal capacity, but its overall importance in the continent’s fuel mix will diminish from 51 to 23 percent. We found that the average levelized cost of energy generated would be about $70 per megawatt-hour with relative emissions of 0.48 tons1 of CO2 per megawatt-hour in 2030, dropping to 0.43 tons of CO2 per megawatt-hour in 2040.
If every country builds what it needs, we estimate that the region would require about $490 billion of capital for new generating capacity, plus another $345 billion for transmission and distribution.
Also, we studied ways to facilitate the development of the sector and the trade-offs they entail. Regional integration, such as power pools, and promotion of renewable generation are game changers that could shape the energy landscape in sub-Saharan Africa over the next 25 years. We found that significantly increasing regional integration could save more than $40 billion in capital spending, and save the African consumer
1 Metric ton: 1 metric ton = 2,205 pounds.
26%19%18%
Exhibit C If every country builds enough to meet its domestic needs, gas and coal will be the dominant technologies by 2040.
Share supplied by renewable energy, including geothermal, hydro, solar, and wind
1 2010 reflects actual consumption; 2020 to 2040 are forecasts. Figures may not sum, because of rounding.2 Driven by high reliance of some countries on imported oil-based fuels for power generation, as well as widespread use of backup diesel generators..Source: McKinsey African Regional Electricity Model
Terawatt-hours1Evolution of energy supplied, % of total terawatt-hours1 1
100% =
2040
1,616
2030
1,079
2020
725
2010
444
21%
Nuclear
Gas
CoalImported fuels
Hydro Geothermal
Wind
Solar
203020202010 2040
3 2 1 1
41 47 44
51
6
34 2723
21 16 1516
192
5 66
0 0 1 1 1 12
81
1,079
725
444
1,616
225
248
296
371
92
115
165
256
297509
710
104
127
85
14 14 14 14
137
65
60
13176
286
28
3
40% of new capacity could come from gas
More than 25% of electricity to come from renewable sources
More than $800 billion in capital needed
$40 billion in capital savings with regionalization
Electric Power & Natural Gas
Brighter Africa: The growth potential of the sub-Saharan electricity sector 5
nearly $10 billion per year by 2040, as the levelized cost of energy falls from $70 per megawatt-hour to $64 per megawatt-hour. Higher levels of integration would result in larger regional gas options being favored over some of the smaller in-country solar and wind additions, leading to an increase in carbon emissions.
If sub-Saharan Africa aggressively promotes renewables, it could obtain a 27 percent reduction in CO2 emissions; this would result in a 35 percent higher installed capacity base and 31 percent higher capital spending (or an additional $153 billion).
There are also a series of shocks that could fundamentally change the sector in Africa. For one, the massive Grand Inga Dam hydroelectric project could help save $32 billion in capital spending as well as 63 megatons in carbon emissions annually. In addition, Africa is significantly underexplored from a gas perspective, so there is the real possibility of further gas discoveries on the east or west coasts. Tapping such sources could result in a much cheaper levelized cost of energy.
To move ahead on development of the sector, national governments should take the initiative in a number of areas. For one, they could focus on ensuring the financial viability of the power sector. Four points matter here: electricity tariffs should reflect the true cost of electricity, costs should be transparent, the country should make the most of what it already has in the sector, and officials should pursue least-cost options in investments.
A second imperative involves creating an environment that will attract a broad range of funding mechanisms. Private-sector involvement is critical and central to effectively delivering new capacity. To attract the private sector, it is necessary to provide clear, consistent regulations; allocate risks to the parties best suited to carry them; ensure that a credible buyer (off-taker) exists; and seek support from external institutions to guarantee the risks.
Last, it is important for governments to demonstrate political will. To do this, they can prioritize efforts, keep an eye on the long term, and focus on the regulations and capabilities needed for the sector to thrive, not just on the plants and associated infrastructure.
While the sub-Saharan African power sector faces many challenges, there is real momentum for change. For example, the UN program on Sustainable Energy for All is sparking private-sector activity in many different parts of the value chain. The region has the ability to take development of the sector to the next level. Success will propel economic growth of the continent and greatly enhance the lives of hundreds of millions of people, as well as potentially create a thriving electricity-supply industry and an associated 2.5 million temporary and permanent jobs across the continent.
More than 25% CO2 reduction possible, but more than $150 billion in additional capital would be required
2.5 million new jobs
6
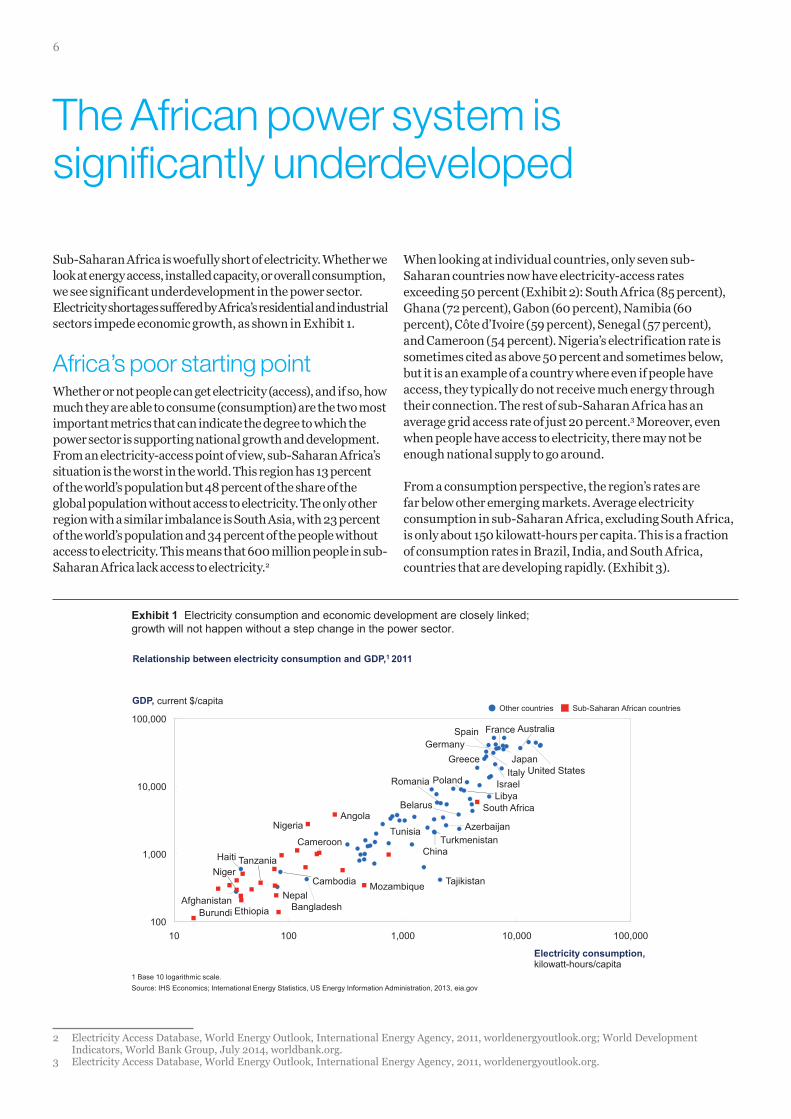
Sub-Saharan Africa is woefully short of electricity. Whether we look at energy access, installed capacity, or overall consumption, we see significant underdevelopment in the power sector. Electricity shortages suffered by Africa’s residential and industrial sectors impede economic growth, as shown in Exhibit 1.
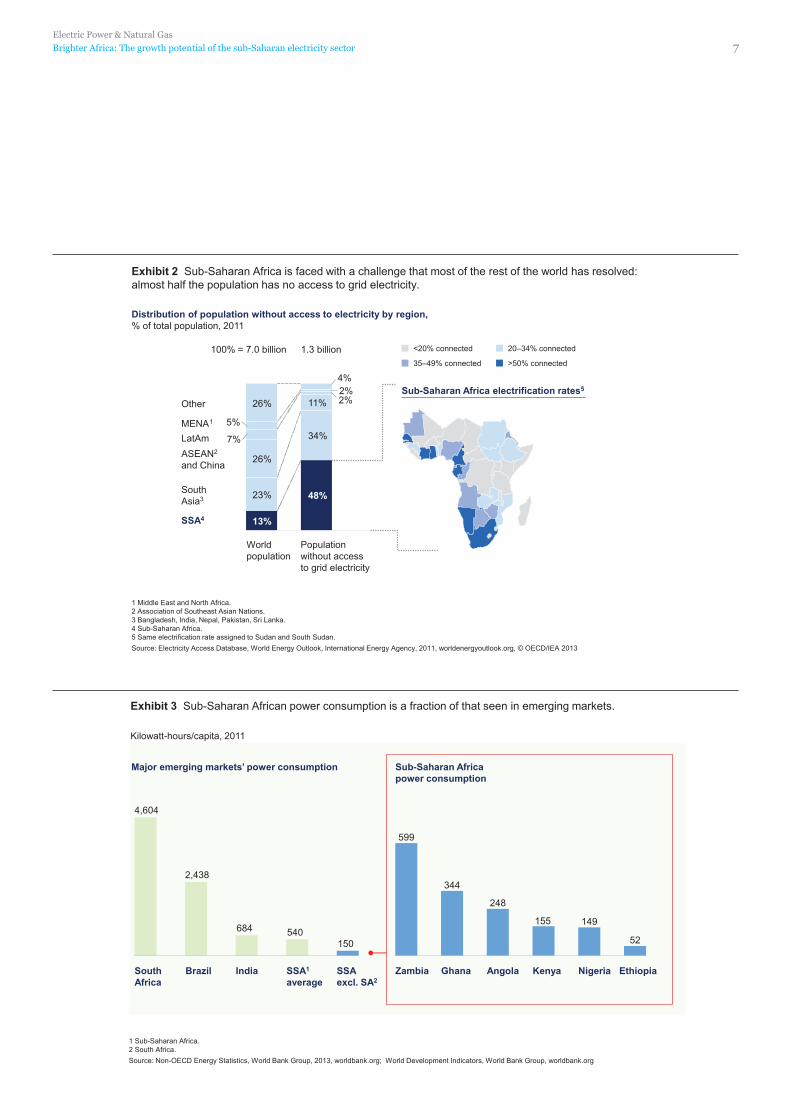
Africa’s poor starting pointWhether or not people can get electricity (access), and if so, how much they are able to consume (consumption) are the two most important metrics that can indicate the degree to which the power sector is supporting national growth and development. From an electricity-access point of view, sub-Saharan Africa’s situation is the worst in the world. This region has 13 percent of the world’s population but 48 percent of the share of the global population without access to electricity. The only other region with a similar imbalance is South Asia, with 23 percent of the world’s population and 34 percent of the people without access to electricity. This means that 600 million people in sub-Saharan Africa lack access to electricity.2
When looking at individual countries, only seven sub-Saharan countries now have electricity-access rates exceeding 50 percent (Exhibit 2): South Africa (85 percent), Ghana (72 percent), Gabon (60 percent), Namibia (60 percent), Côte d’Ivoire (59 percent), Senegal (57 percent), and Cameroon (54 percent). Nigeria’s electrification rate is sometimes cited as above 50 percent and sometimes below, but it is an example of a country where even if people have access, they typically do not receive much energy through their connection. The rest of sub-Saharan Africa has an average grid access rate of just 20 percent.3 Moreover, even when people have access to electricity, there may not be enough national supply to go around.
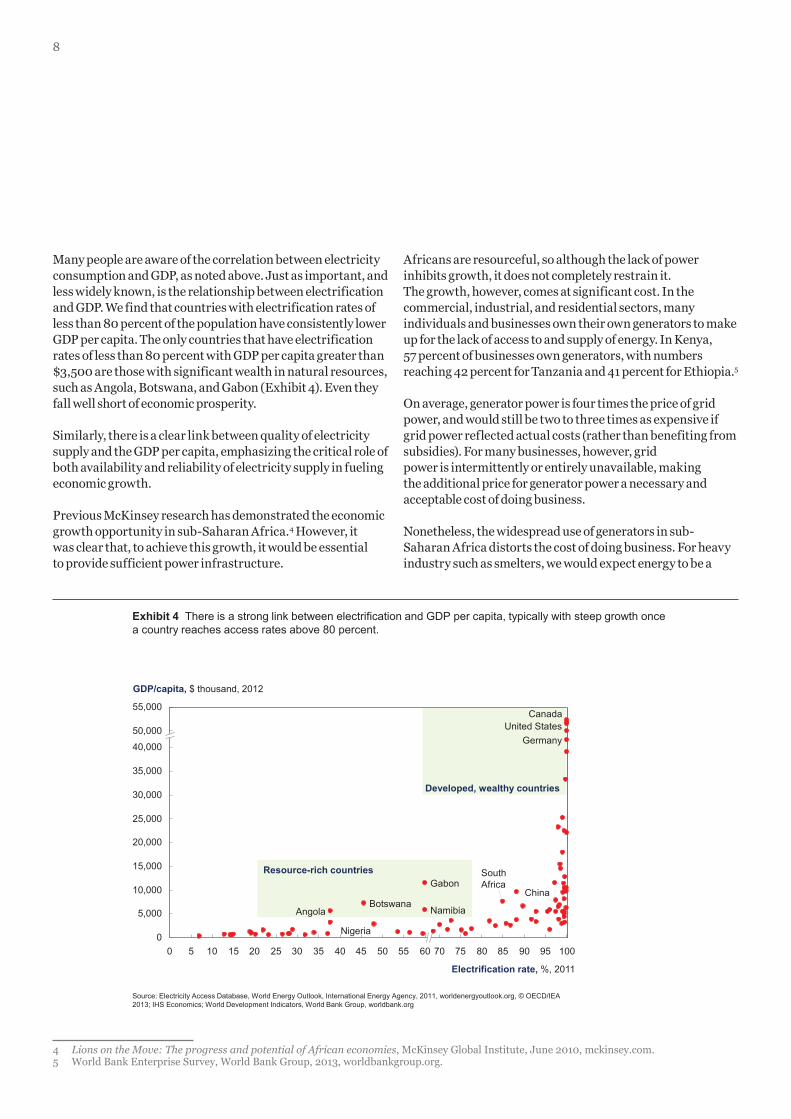
From a consumption perspective, the region’s rates are far below other emerging markets. Average electricity consumption in sub-Saharan Africa, excluding South Africa, is only about 150 kilowatt-hours per capita. This is a fraction of consumption rates in Brazil, India, and South Africa, countries that are developing rapidly. (Exhibit 3).
2 Electricity Access Database, World Energy Outlook, International Energy Agency, 2011, worldenergyoutlook.org; World Development Indicators, World Bank Group, July 2014, worldbank.org.
3 Electricity Access Database, World Energy Outlook, International Energy Agency, 2011, worldenergyoutlook.org.
Exhibit 1 Electricity consumption and economic development are closely linked; growth will not happen without a step change in the power sector.
Sub-Saharan African countries Other countries
Relationship between electricity consumption and GDP,1 2011
1 Base 10 logarithmic scale. Source: IHS Economics; International Energy Statistics, US Energy Information Administration, 2013, eia.gov
100
1,000
10,000
100,000
10 100 1,000 10,000 100,000
Electricity consumption, kilowatt - hours/capita
Greece
Cambodia
Australia
Romania
Nepal Afghanistan
Israel
Angola Nigeria
Niger
France
Ethiopia
Mozambique
Burundi
Tunisia Cameroon
China
Poland
Tajikistan
GDP, current $ /capita
Azerbaijan
Libya
Germany
Turkmenistan
Italy
Spain
Belarus
Japan
Bangladesh
Tanzania
South Africa
United States
Haiti
The African power system is significantly underdeveloped
Electric Power & Natural Gas
Brighter Africa: The growth potential of the sub-Saharan electricity sector 7
Exhibit 2 Sub-Saharan Africa is faced with a challenge that most of the rest of the world has resolved: almost half the population has no access to grid electricity.
<20% connected 20–34% connected
35–49% connected >50% connected
Sub-Saharan Africa electrification rates5
1 Middle East and North Africa. 2 Association of Southeast Asian Nations. 3 Bangladesh, India, Nepal, Pakistan, Sri Lanka. 4 Sub-Saharan Africa. 5 Same electrification rate assigned to Sudan and South Sudan. Source: Electricity Access Database, World Energy Outlook, International Energy Agency, 2011, worldenergyoutlook.org, © OECD/IEA 2013
Distribution of population without access to electricity by region, % of total population, 2011
Population without access to grid electricity
World population
13%
48% 23%
34%
26%
11% 26%
100% = 7.0 billion
SSA 4
LatAm
South Asia 3
ASEAN 2
and China
MENA 1
Other
1.3 billion
7%
5%
4%
2% 2%
Exhibit 3 Sub-Saharan African power consumption is a fraction of that seen in emerging markets.
Kilowatt-hours/capita, 2011
1 Sub-Saharan Africa. 2 South Africa. Source: Non-OECD Energy Statistics, World Bank Group, 2013, worldbank.org; World Development Indicators, World Bank Group, worldbank.org
Major emerging markets’ power consumption Sub-Saharan Africa power consumption
150 540 684
2,438
4,604
South Africa
India SSA excl. SA2
SSA1
average Brazil Zambia Ghana Nigeria Kenya Angola Ethiopia
52
149 155
248
344
599
88
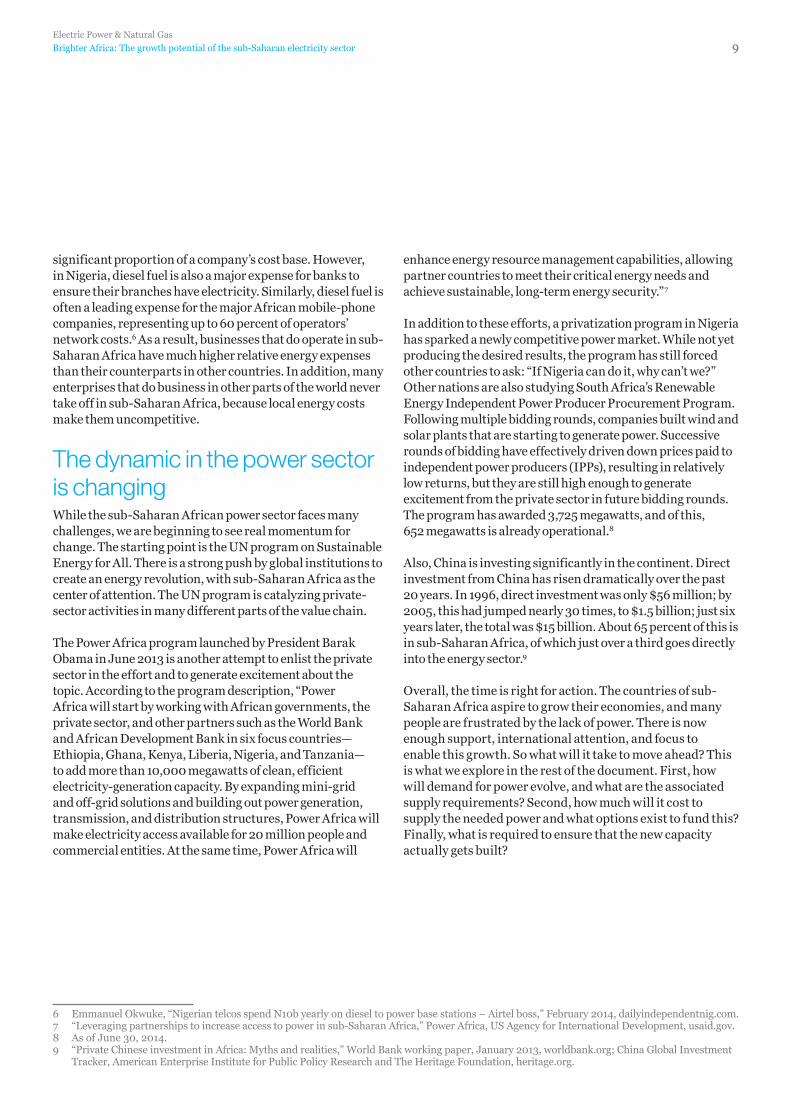
Exhibit 4 There is a strong link between electrification and GDP per capita, typically with steep growth once a country reaches access rates above 80 percent.
Source: Electricity Access Database, World Energy Outlook, International Energy Agency, 2011, worldenergyoutlook.org, © OECD/IEA 2013; IHS Economics; World Development Indicators, World Bank Group, worldbank.org
55 50 45 40 35 30 25 20 15 60 5
55,000
50,000
40,000
10
35,000
30,000
25,000
20,000
15,000
10,000
5,000
0 100 95 90 85 80 75 70 0
Electrification rate, %, 2011
GDP/capita, $ thousand, 2012
Canada
Germany United States
Nigeria
Namibia
China
Angola
Gabon
Botswana
South Africa
Resource-rich countries
Developed, wealthy countries
Many people are aware of the correlation between electricity consumption and GDP, as noted above. Just as important, and less widely known, is the relationship between electrification and GDP. We find that countries with electrification rates of less than 80 percent of the population have consistently lower GDP per capita. The only countries that have electrification rates of less than 80 percent with GDP per capita greater than $3,500 are those with significant wealth in natural resources, such as Angola, Botswana, and Gabon (Exhibit 4). Even they fall well short of economic prosperity.
Similarly, there is a clear link between quality of electricity supply and the GDP per capita, emphasizing the critical role of both availability and reliability of electricity supply in fueling economic growth.
Previous McKinsey research has demonstrated the economic growth opportunity in sub-Saharan Africa.4 However, it was clear that, to achieve this growth, it would be essential to provide sufficient power infrastructure.
Africans are resourceful, so although the lack of power inhibits growth, it does not completely restrain it. The growth, however, comes at significant cost. In the commercial, industrial, and residential sectors, many individuals and businesses own their own generators to make up for the lack of access to and supply of energy. In Kenya, 57 percent of businesses own generators, with numbers reaching 42 percent for Tanzania and 41 percent for Ethiopia.5
On average, generator power is four times the price of grid power, and would still be two to three times as expensive if grid power reflected actual costs (rather than benefiting from subsidies). For many businesses, however, grid power is intermittently or entirely unavailable, making the additional price for generator power a necessary and acceptable cost of doing business.
Nonetheless, the widespread use of generators in sub-Saharan Africa distorts the cost of doing business. For heavy industry such as smelters, we would expect energy to be a
4 Lions on the Move: The progress and potential of African economies, McKinsey Global Institute, June 2010, mckinsey.com.5 World Bank Enterprise Survey, World Bank Group, 2013, worldbankgroup.org.
Electric Power & Natural Gas
Brighter Africa: The growth potential of the sub-Saharan electricity sector 9
significant proportion of a company’s cost base. However, in Nigeria, diesel fuel is also a major expense for banks to ensure their branches have electricity. Similarly, diesel fuel is often a leading expense for the major African mobile-phone companies, representing up to 60 percent of operators’ network costs.6 As a result, businesses that do operate in sub-Saharan Africa have much higher relative energy expenses than their counterparts in other countries. In addition, many enterprises that do business in other parts of the world never take off in sub-Saharan Africa, because local energy costs make them uncompetitive.
The dynamic in the power sector is changingWhile the sub-Saharan African power sector faces many challenges, we are beginning to see real momentum for change. The starting point is the UN program on Sustainable Energy for All. There is a strong push by global institutions to create an energy revolution, with sub-Saharan Africa as the center of attention. The UN program is catalyzing private-sector activities in many different parts of the value chain.
The Power Africa program launched by President Barak Obama in June 2013 is another attempt to enlist the private sector in the effort and to generate excitement about the topic. According to the program description, “Power Africa will start by working with African governments, the private sector, and other partners such as the World Bank and African Development Bank in six focus countries—Ethiopia, Ghana, Kenya, Liberia, Nigeria, and Tanzania—to add more than 10,000 megawatts of clean, efficient electricity-generation capacity. By expanding mini-grid and off-grid solutions and building out power generation, transmission, and distribution structures, Power Africa will make electricity access available for 20 million people and commercial entities. At the same time, Power Africa will
enhance energy resource management capabilities, allowing partner countries to meet their critical energy needs and achieve sustainable, long-term energy security.”7
In addition to these efforts, a privatization program in Nigeria has sparked a newly competitive power market. While not yet producing the desired results, the program has still forced other countries to ask: “If Nigeria can do it, why can’t we?” Other nations are also studying South Africa’s Renewable Energy Independent Power Producer Procurement Program. Following multiple bidding rounds, companies built wind and solar plants that are starting to generate power. Successive rounds of bidding have effectively driven down prices paid to independent power producers (IPPs), resulting in relatively low returns, but they are still high enough to generate excitement from the private sector in future bidding rounds. The program has awarded 3,725 megawatts, and of this, 652 megawatts is already operational.8
Also, China is investing significantly in the continent. Direct investment from China has risen dramatically over the past 20 years. In 1996, direct investment was only $56 million; by 2005, this had jumped nearly 30 times, to $1.5 billion; just six years later, the total was $15 billion. About 65 percent of this is in sub-Saharan Africa, of which just over a third goes directly into the energy sector.9
Overall, the time is right for action. The countries of sub-Saharan Africa aspire to grow their economies, and many people are frustrated by the lack of power. There is now enough support, international attention, and focus to enable this growth. So what will it take to move ahead? This is what we explore in the rest of the document. First, how will demand for power evolve, and what are the associated supply requirements? Second, how much will it cost to supply the needed power and what options exist to fund this? Finally, what is required to ensure that the new capacity actually gets built?
9
6 Emmanuel Okwuke, “Nigerian telcos spend N10b yearly on diesel to power base stations – Airtel boss,” February 2014, dailyindependentnig.com.7 “Leveraging partnerships to increase access to power in sub-Saharan Africa,” Power Africa, US Agency for International Development, usaid.gov.8 As of June 30, 2014.9 “Private Chinese investment in Africa: Myths and realities,” World Bank working paper, January 2013, worldbank.org; China Global Investment
Tracker, American Enterprise Institute for Public Policy Research and The Heritage Foundation, heritage.org.
10
We have taken a demand-driven approach to better understand the likely evolution of the sub-Saharan Africa power sector, and the resulting opportunity for the players who will help propel it. First, we estimated the likely demand evolution for each country, and then assumed that supply would be built to match demand growth, using least-cost technologies on a country-by-country basis. Then, we modeled a variety of scenarios, including major initiatives focused on regional integration and renewable energy.
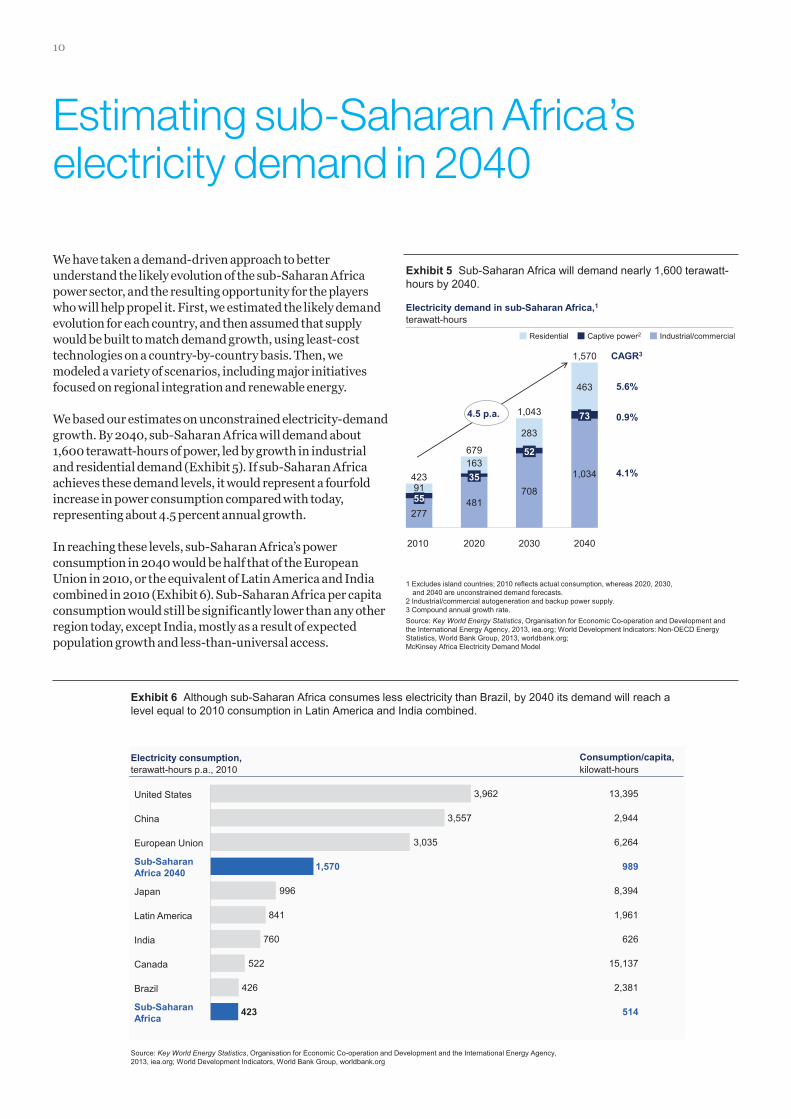
We based our estimates on unconstrained electricity-demand growth. By 2040, sub-Saharan Africa will demand about 1,600 terawatt-hours of power, led by growth in industrial and residential demand (Exhibit 5). If sub-Saharan Africa achieves these demand levels, it would represent a fourfold increase in power consumption compared with today, representing about 4.5 percent annual growth.
In reaching these levels, sub-Saharan Africa’s power consumption in 2040 would be half that of the European Union in 2010, or the equivalent of Latin America and India combined in 2010 (Exhibit 6). Sub-Saharan Africa per capita consumption would still be significantly lower than any other region today, except India, mostly as a result of expected population growth and less-than-universal access.
Estimating sub-Saharan Africa’s electricity demand in 2040
Exhibit 5 Sub-Saharan Africa will demand nearly 1,600 terawatt-hours by 2040.
terawatt-hours
1 Excludes island countries; 2010 reflects actual consumption, whereas 2020, 2030, and 2040 are unconstrained demand forecasts.
2 Industrial/commercial autogeneration and backup power supply. 3 Compound annual growth rate. Source: Key World Energy Statistics, Organisation for Economic Co-operation and Development and the International Energy Agency, 2013, iea.org; World Development Indicators: Non-OECD Energy Statistics, World Bank Group, 2013, worldbank.org; McKinsey Africa Electricity Demand Model
Electricity demand in sub-Saharan Africa,1
CAGR3
5.6%
4.1%
0.9% 4.5 p.a.
481
163
2020
679
35
277
2010
423 91 55
1,034
463
2040
1,570
73
708
283
2030
1,043
52
Industrial/commercial Captive power2 Residential
Exhibit 6 Although sub-Saharan Africa consumes less electricity than Brazil, by 2040 its demand will reach a level equal to 2010 consumption in Latin America and India combined.
Source: Key World Energy Statistics, Organisation for Economic Co-operation and Development and the International Energy Agency, 2013, iea.org; World Development Indicators, World Bank Group, worldbank.org
terawatt-hours p.a., 2010 Consumption/capita, Electricity consumption,
426
522
760
841
996
3,035
3,557
3,962
Brazil
Sub-Saharan Africa 423
Canada
India
Latin America
Japan
Sub-Saharan Africa 2040 1,570
European Union
China
United States
kilowatt-hours
13,395
2,944
6,264
989
8,394
1,961
626
15,137
2,381
514
Electric Power & Natural Gas
Brighter Africa: The growth potential of the sub-Saharan electricity sector 11
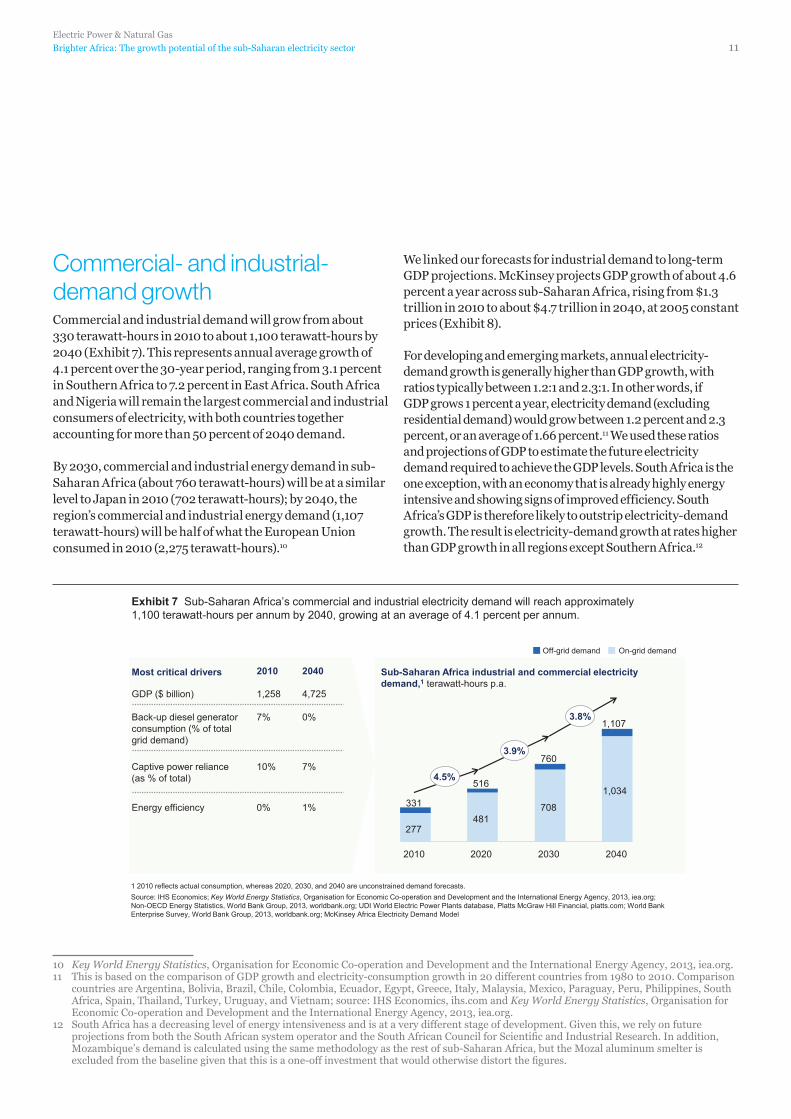
Commercial- and industrial-demand growthCommercial and industrial demand will grow from about 330 terawatt-hours in 2010 to about 1,100 terawatt-hours by 2040 (Exhibit 7). This represents annual average growth of 4.1 percent over the 30-year period, ranging from 3.1 percent in Southern Africa to 7.2 percent in East Africa. South Africa and Nigeria will remain the largest commercial and industrial consumers of electricity, with both countries together accounting for more than 50 percent of 2040 demand.
By 2030, commercial and industrial energy demand in sub-Saharan Africa (about 760 terawatt-hours) will be at a similar level to Japan in 2010 (702 terawatt-hours); by 2040, the region’s commercial and industrial energy demand (1,107 terawatt-hours) will be half of what the European Union consumed in 2010 (2,275 terawatt-hours).10
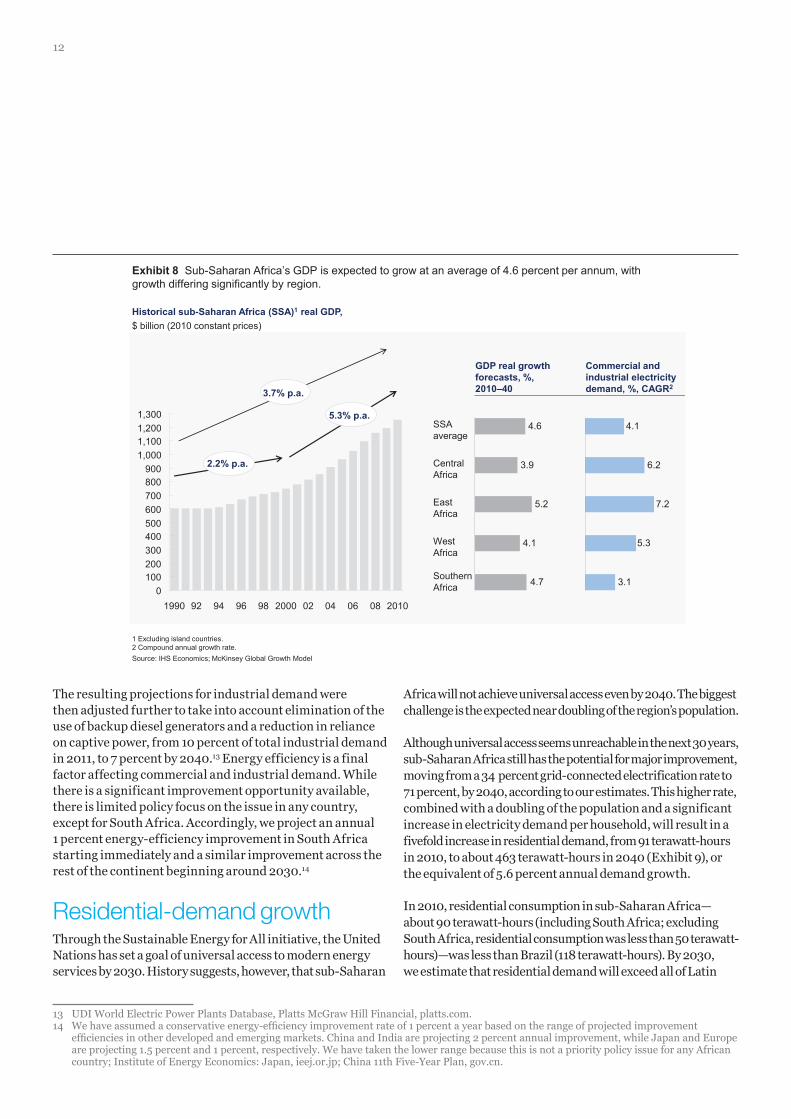
We linked our forecasts for industrial demand to long-term GDP projections. McKinsey projects GDP growth of about 4.6 percent a year across sub-Saharan Africa, rising from $1.3 trillion in 2010 to about $4.7 trillion in 2040, at 2005 constant prices (Exhibit 8).
For developing and emerging markets, annual electricity-demand growth is generally higher than GDP growth, with ratios typically between 1.2:1 and 2.3:1. In other words, if GDP grows 1 percent a year, electricity demand (excluding residential demand) would grow between 1.2 percent and 2.3 percent, or an average of 1.66 percent.11 We used these ratios and projections of GDP to estimate the future electricity demand required to achieve the GDP levels. South Africa is the one exception, with an economy that is already highly energy intensive and showing signs of improved efficiency. South Africa’s GDP is therefore likely to outstrip electricity-demand growth. The result is electricity-demand growth at rates higher than GDP growth in all regions except Southern Africa.12
Exhibit 7 Sub-Saharan Africa’s commercial and industrial electricity demand will reach approximately 1,100 terawatt-hours per annum by 2040, growing at an average of 4.1 percent per annum.
Off-grid demand On-grid demand
2010 2040
1,258 4,725 GDP ($ billion)
7% 0% Back-up diesel generator consumption (% of total grid demand)
10% 7% Captive power reliance (as % of total)
0% 1% Energy efficiency
Most critical drivers Sub-Saharan Africa industrial and commercial electricity demand,1 terawatt-hours p.a.
277 481
708
1,034
2040
1,107
2030
760
2020
516
2010
331
1 2010 reflects actual consumption, whereas 2020, 2030, and 2040 are unconstrained demand forecasts. Source: IHS Economics; Key World Energy Statistics, Organisation for Economic Co-operation and Development and the International Energy Agency, 2013, iea.org; Non-OECD Energy Statistics, World Bank Group, 2013, worldbank.org; UDI World Electric Power Plants database, Platts McGraw Hill Financial, platts.com; World Bank Enterprise Survey, World Bank Group, 2013, worldbank.org; McKinsey Africa Electricity Demand Model
4.5%
3.9%
3.8%
10 Key World Energy Statistics, Organisation for Economic Co-operation and Development and the International Energy Agency, 2013, iea.org.11 This is based on the comparison of GDP growth and electricity-consumption growth in 20 different countries from 1980 to 2010. Comparison
countries are Argentina, Bolivia, Brazil, Chile, Colombia, Ecuador, Egypt, Greece, Italy, Malaysia, Mexico, Paraguay, Peru, Philippines, South Africa, Spain, Thailand, Turkey, Uruguay, and Vietnam; source: IHS Economics, ihs.com and Key World Energy Statistics, Organisation for Economic Co-operation and Development and the International Energy Agency, 2013, iea.org.
12 South Africa has a decreasing level of energy intensiveness and is at a very different stage of development. Given this, we rely on future projections from both the South African system operator and the South African Council for Scientific and Industrial Research. In addition, Mozambique’s demand is calculated using the same methodology as the rest of sub-Saharan Africa, but the Mozal aluminum smelter is excluded from the baseline given that this is a one-off investment that would otherwise distort the figures.
12
The resulting projections for industrial demand were then adjusted further to take into account elimination of the use of backup diesel generators and a reduction in reliance on captive power, from 10 percent of total industrial demand in 2011, to 7 percent by 2040.13 Energy efficiency is a final factor affecting commercial and industrial demand. While there is a significant improvement opportunity available, there is limited policy focus on the issue in any country, except for South Africa. Accordingly, we project an annual 1 percent energy-efficiency improvement in South Africa starting immediately and a similar improvement across the rest of the continent beginning around 2030.14
Residential-demand growthThrough the Sustainable Energy for All initiative, the United Nations has set a goal of universal access to modern energy services by 2030. History suggests, however, that sub-Saharan
Africa will not achieve universal access even by 2040. The biggest challenge is the expected near doubling of the region’s population.
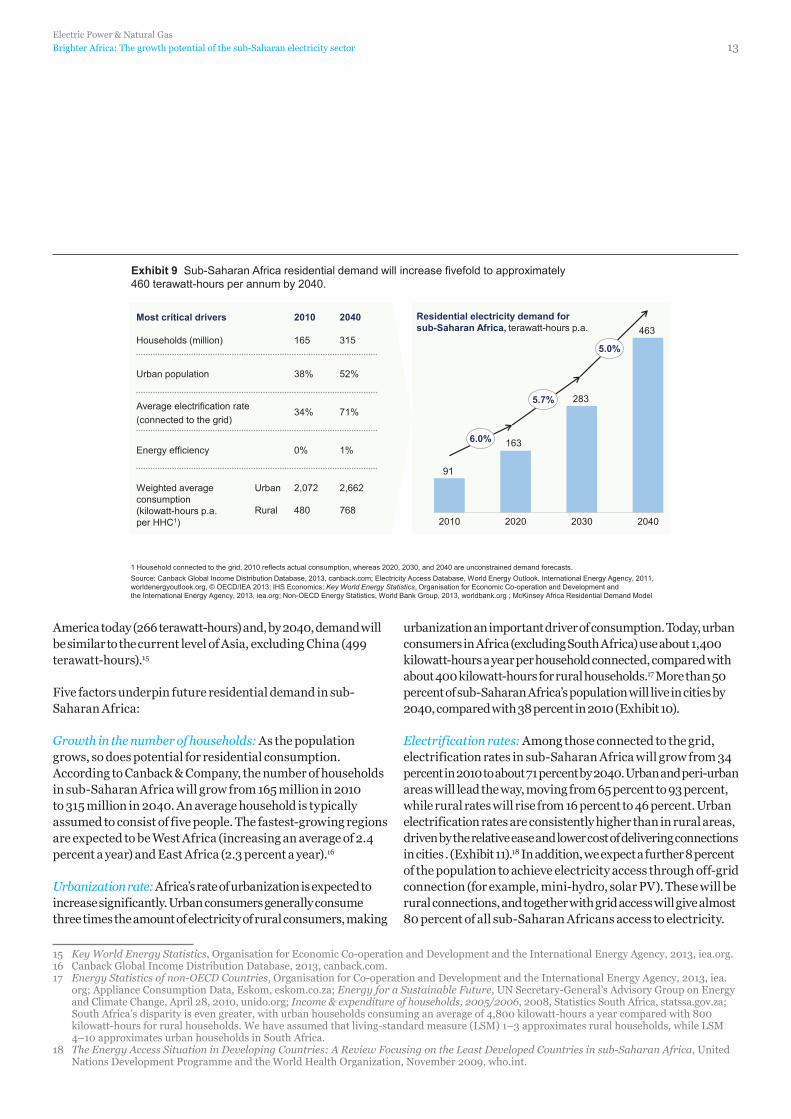
Although universal access seems unreachable in the next 30 years, sub-Saharan Africa still has the potential for major improvement, moving from a 34 percent grid-connected electrification rate to 71 percent, by 2040, according to our estimates. This higher rate, combined with a doubling of the population and a significant increase in electricity demand per household, will result in a fivefold increase in residential demand, from 91 terawatt-hours in 2010, to about 463 terawatt-hours in 2040 (Exhibit 9), or the equivalent of 5.6 percent annual demand growth.
In 2010, residential consumption in sub-Saharan Africa—about 90 terawatt-hours (including South Africa; excluding South Africa, residential consumption was less than 50 terawatt-hours)—was less than Brazil (118 terawatt-hours). By 2030, we estimate that residential demand will exceed all of Latin
Exhibit 8 Sub-Saharan Africa’s GDP is expected to grow at an average of 4.6 percent per annum, with growth differing significantly by region.
$ billion (2010 constant prices)
Commercial and industrial electricity demand, %, CAGR2
GDP real growth forecasts, %, 2010–40
1 Excluding island countries. 2 Compound annual growth rate. Source: IHS Economics; McKinsey Global Growth Model
Historical sub-Saharan Africa (SSA)1 real GDP,
0 100 200 300 400 500 600 700 800 900
1,000 1,100 1,200 1,300
2.2% p.a.
3.7% p.a.
5.3% p.a.
2010 08 06 04 02 2000 98 96 94 92 1990
3.1
7.2
5.3
6.2
4.1
Southern Africa 4.7
West Africa
4.1
East Africa
5.2
Central Africa
3.9
SSA average
4.6
13 UDI World Electric Power Plants Database, Platts McGraw Hill Financial, platts.com.14 We have assumed a conservative energy-efficiency improvement rate of 1 percent a year based on the range of projected improvement
efficiencies in other developed and emerging markets. China and India are projecting 2 percent annual improvement, while Japan and Europe are projecting 1.5 percent and 1 percent, respectively. We have taken the lower range because this is not a priority policy issue for any African country; Institute of Energy Economics: Japan, ieej.or.jp; China 11th Five-Year Plan, gov.cn.
Electric Power & Natural Gas
Brighter Africa: The growth potential of the sub-Saharan electricity sector 13
Exhibit 9 Sub-Saharan Africa residential demand will increase fivefold to approximately 460 terawatt-hours per annum by 2040.
1 Household connected to the grid. 2010 reflects actual consumption, whereas 2020, 2030, and 2040 are unconstrained demand forecasts. Source: Canback Global Income Distribution Database, 2013, canback.com; Electricity Access Database, World Energy Outlook, International Energy Agency, 2011, worldenergyoutlook.org, © OECD/IEA 2013; IHS Economics; Key World Energy Statistics, Organisation for Economic Co-operation and Development and the International Energy Agency, 2013, iea.org; Non-OECD Energy Statistics, World Bank Group, 2013, worldbank.org ; McKinsey Africa Residential Demand Model
Most critical drivers 2010 2040
Households (million) 165 315
Urban population 38% 52%
2,072 2,662
Energy efficiency
Average electrification rate (connected to the grid)
34% 71%
0% 1%
Weighted average consumption (kilowatt-hours p.a. per HHC1)
768 480
Urban
Rural
Residential electricity demand for sub-Saharan Africa, terawatt-hours p.a. 463
283
163
91
2040 2030 2020 2010
6.0%
5.7%
5.0%
America today (266 terawatt-hours) and, by 2040, demand will be similar to the current level of Asia, excluding China (499 terawatt-hours).15
Five factors underpin future residential demand in sub-Saharan Africa:
Growth in the number of households: As the population grows, so does potential for residential consumption. According to Canback & Company, the number of households in sub-Saharan Africa will grow from 165 million in 2010 to 315 million in 2040. An average household is typically assumed to consist of five people. The fastest-growing regions are expected to be West Africa (increasing an average of 2.4 percent a year) and East Africa (2.3 percent a year).16
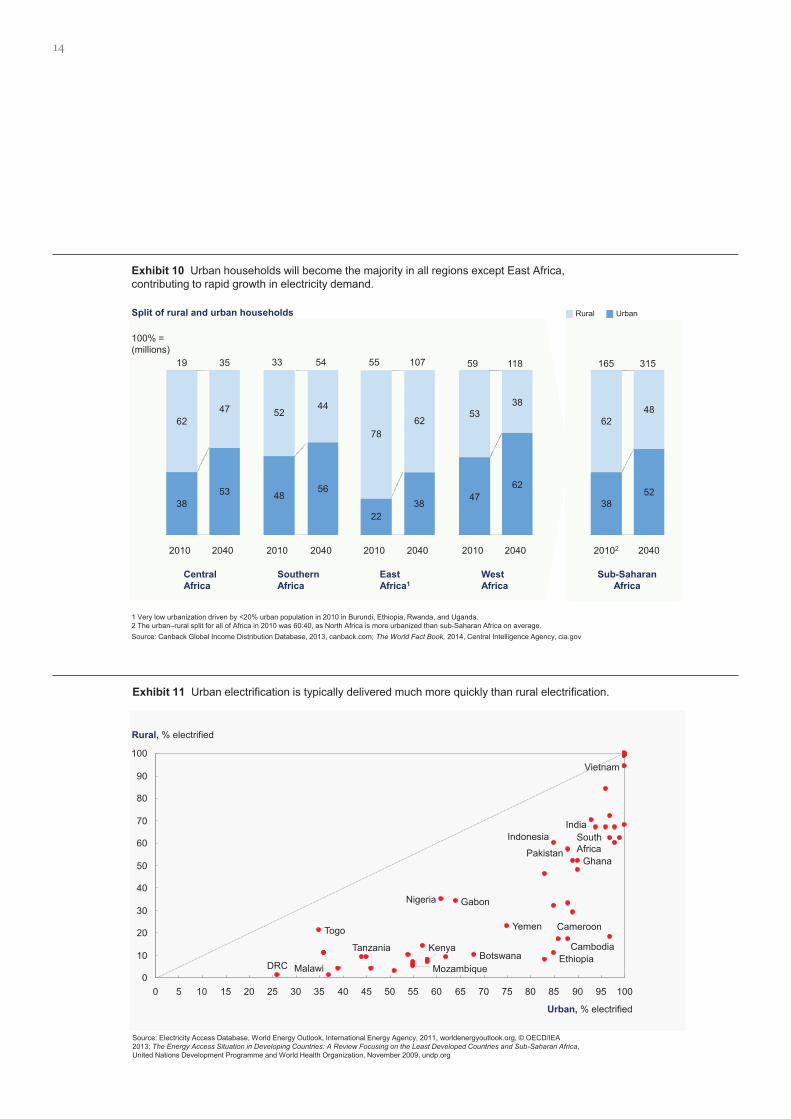
Urbanization rate: Africa’s rate of urbanization is expected to increase significantly. Urban consumers generally consume three times the amount of electricity of rural consumers, making
urbanization an important driver of consumption. Today, urban consumers in Africa (excluding South Africa) use about 1,400 kilowatt-hours a year per household connected, compared with about 400 kilowatt-hours for rural households.17 More than 50 percent of sub-Saharan Africa’s population will live in cities by 2040, compared with 38 percent in 2010 (Exhibit 10).
Electrification rates: Among those connected to the grid, electrification rates in sub-Saharan Africa will grow from 34 percent in 2010 to about 71 percent by 2040. Urban and peri-urban areas will lead the way, moving from 65 percent to 93 percent, while rural rates will rise from 16 percent to 46 percent. Urban electrification rates are consistently higher than in rural areas, driven by the relative ease and lower cost of delivering connections in cities . (Exhibit 11).18 In addition, we expect a further 8 percent of the population to achieve electricity access through off-grid connection (for example, mini-hydro, solar PV). These will be rural connections, and together with grid access will give almost 80 percent of all sub-Saharan Africans access to electricity.
15 Key World Energy Statistics, Organisation for Economic Co-operation and Development and the International Energy Agency, 2013, iea.org.16 Canback Global Income Distribution Database, 2013, canback.com.17 Energy Statistics of non-OECD Countries, Organisation for Co-operation and Development and the International Energy Agency, 2013, iea.
org; Appliance Consumption Data, Eskom, eskom.co.za; Energy for a Sustainable Future, UN Secretary-General’s Advisory Group on Energy and Climate Change, April 28, 2010, unido.org; Income & expenditure of households, 2005/2006, 2008, Statistics South Africa, statssa.gov.za; South Africa’s disparity is even greater, with urban households consuming an average of 4,800 kilowatt-hours a year compared with 800 kilowatt-hours for rural households. We have assumed that living-standard measure (LSM) 1–3 approximates rural households, while LSM 4–10 approximates urban households in South Africa.
18 The Energy Access Situation in Developing Countries: A Review Focusing on the Least Developed Countries in sub-Saharan Africa, United Nations Development Programme and the World Health Organization, November 2009, who.int.
14
Exhibit 11 Urban electrification is typically delivered much more quickly than rural electrification.
0
10
20
30
40
50
60
70
80
90
100
0 5 10 15 20 25 30 35 40 45 50 55 60 65 70 75 80 85 90 95 100
Rural, % electrified
Urban, % electrified
Pakistan
India
Vietnam
Indonesia
Cambodia
Togo
Tanzania
South Africa
Nigeria
Mozambique Malawi
Kenya
Ghana
Gabon
Ethiopia DRC
Cameroon
Botswana
Yemen
Source: Electricity Access Database, World Energy Outlook, International Energy Agency, 2011, worldenergyoutlook.org, © OECD/IEA 2013; The Energy Access Situation in Developing Countries: A Review Focusing on the Least Developed Countries and Sub-Saharan Africa, United Nations Development Programme and World Health Organization, November 2009, undp.org
Central Africa
Southern Africa
East Africa1
West Africa
Sub-Saharan Africa
Exhibit 10 Urban households will become the majority in all regions except East Africa, contributing to rapid growth in electricity demand.
1 Very low urbanization driven by <20% urban population in 2010 in Burundi, Ethiopia, Rwanda, and Uganda. 2 The urban–rural split for all of Africa in 2010 was 60:40, as North Africa is more urbanized than sub-Saharan Africa on average. Source: Canback Global Income Distribution Database, 2013, canback.com; The World Fact Book, 2014, Central Intelligence Agency, cia.gov
Split of rural and urban households
38
62
19
100% = (millions)
2040
35
53
47
2010
Urban Rural
2040
54
56
44
2010
33
48
52
2040
107
38
62
2010
55
22
78
2040
118
62
38
2010
59
47
53
2040
315
52
48
2010 2
165
38
62
Electric Power & Natural Gas
Brighter Africa: The growth potential of the sub-Saharan electricity sector 15
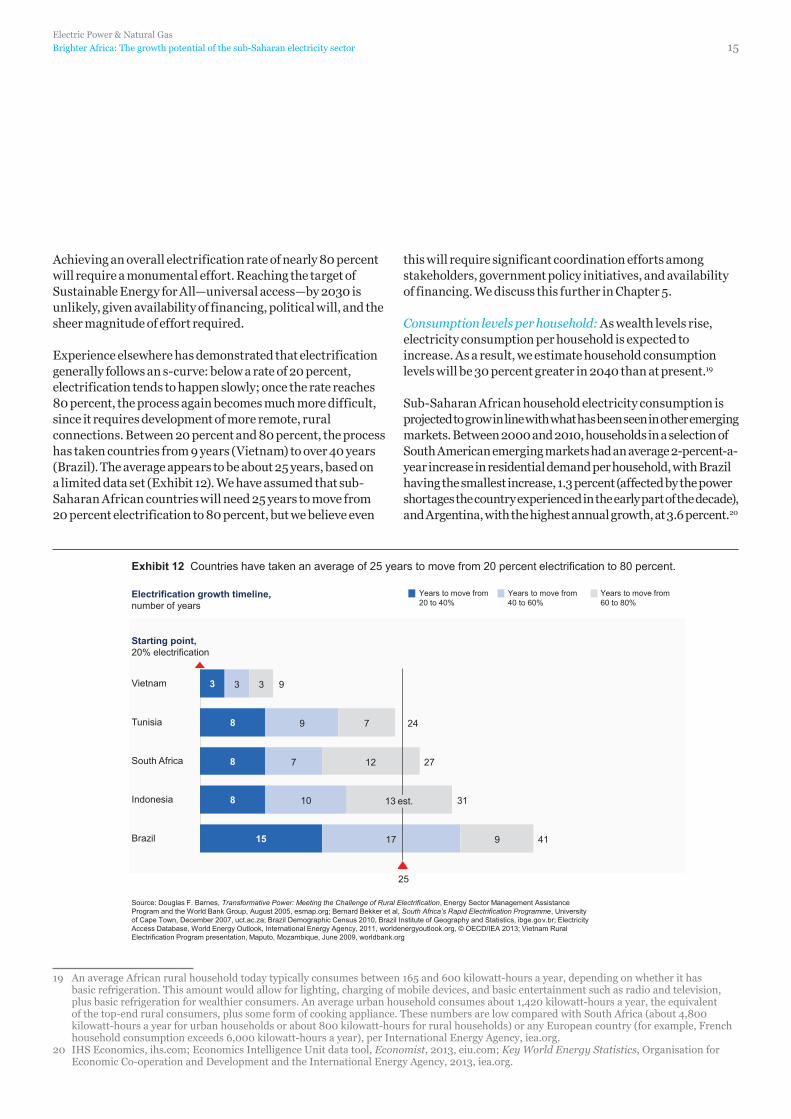
Achieving an overall electrification rate of nearly 80 percent will require a monumental effort. Reaching the target of Sustainable Energy for All—universal access—by 2030 is unlikely, given availability of financing, political will, and the sheer magnitude of effort required.
Experience elsewhere has demonstrated that electrification generally follows an s-curve: below a rate of 20 percent, electrification tends to happen slowly; once the rate reaches 80 percent, the process again becomes much more difficult, since it requires development of more remote, rural connections. Between 20 percent and 80 percent, the process has taken countries from 9 years (Vietnam) to over 40 years (Brazil). The average appears to be about 25 years, based on a limited data set (Exhibit 12). We have assumed that sub-Saharan African countries will need 25 years to move from 20 percent electrification to 80 percent, but we believe even
this will require significant coordination efforts among stakeholders, government policy initiatives, and availability of financing. We discuss this further in Chapter 5.
Consumption levels per household: As wealth levels rise, electricity consumption per household is expected to increase. As a result, we estimate household consumption levels will be 30 percent greater in 2040 than at present.19
Sub-Saharan African household electricity consumption is projected to grow in line with what has been seen in other emerging markets. Between 2000 and 2010, households in a selection of South American emerging markets had an average 2-percent-a-year increase in residential demand per household, with Brazil having the smallest increase, 1.3 percent (affected by the power shortages the country experienced in the early part of the decade), and Argentina, with the highest annual growth, at 3.6 percent.20
Source: Douglas F. Barnes, Transformative Power: Meeting the Challenge of Rural Electrification, Energy Sector Management Assistance Program and the World Bank Group, August 2005, esmap.org; Bernard Bekker et al, South Africa’s Rapid Electrification Programme, University of Cape Town, December 2007, uct.ac.za; Brazil Demographic Census 2010, Brazil Institute of Geography and Statistics, ibge.gov.br; Electricity Access Database, World Energy Outlook, International Energy Agency, 2011, worldenergyoutlook.org, © OECD/IEA 2013; Vietnam Rural Electrification Program presentation, Maputo, Mozambique, June 2009, worldbank.org
Starting point, 20% electrification
Exhibit 12 Countries have taken an average of 25 years to move from 20 percent electrification to 80 percent.
Electrification growth timeline, number of years
3
8
8
8
15
3
9
7
10
17
3
7
12
9
Indonesia
25
13
Brazil
Tunisia
Vietnam
South Africa
Years to move from 40 to 60%
Years to move from 20 to 40%
Years to move from 60 to 80%
est.
9
24
27
31
41
19 An average African rural household today typically consumes between 165 and 600 kilowatt-hours a year, depending on whether it has basic refrigeration. This amount would allow for lighting, charging of mobile devices, and basic entertainment such as radio and television, plus basic refrigeration for wealthier consumers. An average urban household consumes about 1,420 kilowatt-hours a year, the equivalent of the top-end rural consumers, plus some form of cooking appliance. These numbers are low compared with South Africa (about 4,800 kilowatt-hours a year for urban households or about 800 kilowatt-hours for rural households) or any European country (for example, French household consumption exceeds 6,000 kilowatt-hours a year), per International Energy Agency, iea.org.
20 IHS Economics, ihs.com; Economics Intelligence Unit data tool, Economist, 2013, eiu.com; Key World Energy Statistics, Organisation for Economic Co-operation and Development and the International Energy Agency, 2013, iea.org.
16
Energy efficiency: Household energy-efficiency improvements are likely only in more advanced sub-Saharan African economies. The effect of energy-efficiency initiatives is already being felt in South Africa, where higher tariffs and targeted load shedding are forcing all consumers to be more energy efficient. Eskom has reported achieving a 9.4 percent demand savings over the past decade through its efforts to reduce electricity consumption.21 Among the remaining, in more advanced economies such as Ghana and Nigeria, we would expect energy-efficiency improvements to begin from about 2020. For some of the poorest countries, we forecast these improvements to begin only as of 2030.
Our energy-efficiency estimates rely on discussions with industry experts and on benchmarking international results and practices. Energy efficiency has had varied success, even in developed markets, with regulation and energy prices
among the variables with the biggest influence on outcomes. Across developing markets, energy prices are generally low, thus not providing strong investment signals in more expensive energy-efficient technologies, while regulation is still far from achieving the required level of sophistication. As a final consideration, most developing markets heavily focus on ensuring improvements in the security of supply (such as generation investments, transmission and distribution investments, asset efficiency) to support economic growth and less on implementation of a comprehensive energy-efficiency agenda. Therefore, we have taken a conservative approach, forecasting a 1 percent annual energy-efficiency improvement. Even with these modest efforts, we still anticipate overall residential consumption in sub-Saharan Africa to be 62 terawatt-hours, or 12 percent lower in 2040 than what we would expect in a business-as-usual case without any efficiency drives.
21 Eskom Holdings SOC Limited Integrated Report, 2014, eskom.co.za
17
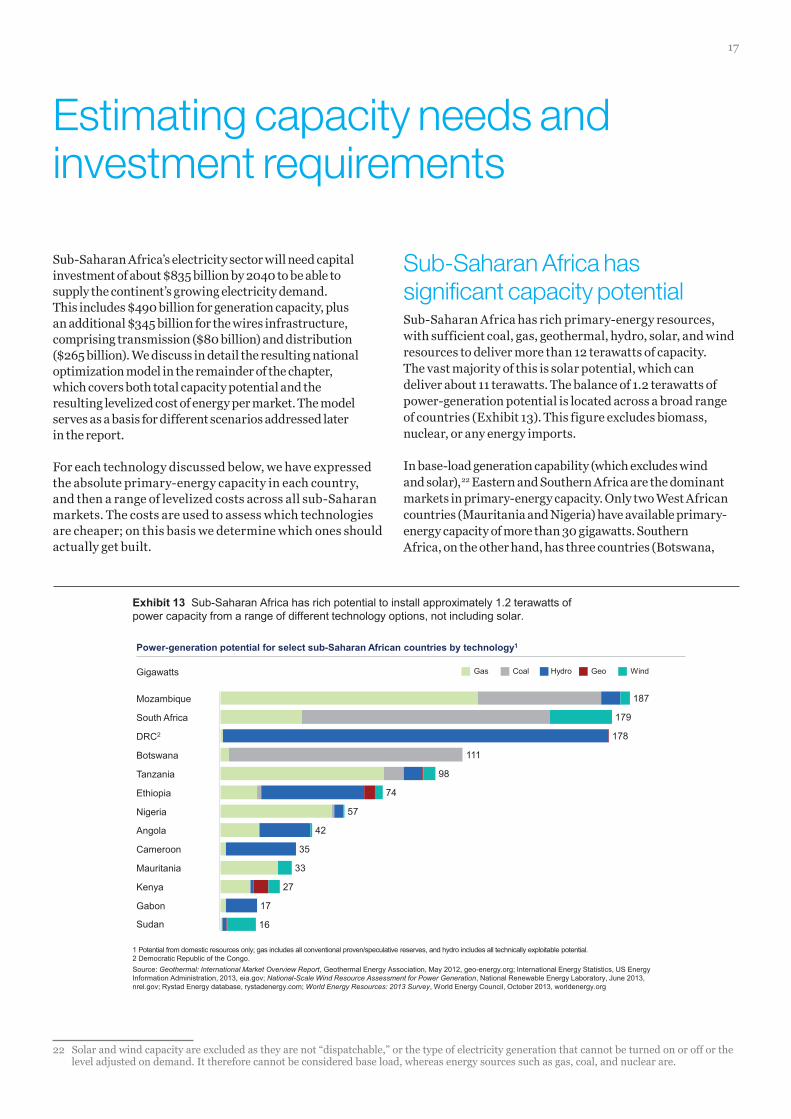
Sub-Saharan Africa’s electricity sector will need capital investment of about $835 billion by 2040 to be able to supply the continent’s growing electricity demand. This includes $490 billion for generation capacity, plus an additional $345 billion for the wires infrastructure, comprising transmission ($80 billion) and distribution ($265 billion). We discuss in detail the resulting national optimization model in the remainder of the chapter, which covers both total capacity potential and the resulting levelized cost of energy per market. The model serves as a basis for different scenarios addressed later in the report.
For each technology discussed below, we have expressed the absolute primary-energy capacity in each country, and then a range of levelized costs across all sub-Saharan markets. The costs are used to assess which technologies are cheaper; on this basis we determine which ones should actually get built.
Sub-Saharan Africa has significant capacity potentialSub-Saharan Africa has rich primary-energy resources, with sufficient coal, gas, geothermal, hydro, solar, and wind resources to deliver more than 12 terawatts of capacity. The vast majority of this is solar potential, which can deliver about 11 terawatts. The balance of 1.2 terawatts of power-generation potential is located across a broad range of countries (Exhibit 13). This figure excludes biomass, nuclear, or any energy imports.
In base-load generation capability (which excludes wind and solar),22 Eastern and Southern Africa are the dominant markets in primary-energy capacity. Only two West African countries (Mauritania and Nigeria) have available primary-energy capacity of more than 30 gigawatts. Southern Africa, on the other hand, has three countries (Botswana,
Estimating capacity needs and investment requirements
Exhibit 13 Sub-Saharan Africa has rich potential to install approximately 1.2 terawatts of power capacity from a range of different technology options, not including solar.
1 Potential from domestic resources only; gas includes all conventional proven/speculative reserves, and hydro includes all technically exploitable potential. 2 Democratic Republic of the Congo. Source: Geothermal: International Market Overview Report, Geothermal Energy Association, May 2012, geo-energy.org; International Energy Statistics, US Energy Information Administration, 2013, eia.gov; National-Scale Wind Resource Assessment for Power Generation, National Renewable Energy Laboratory, June 2013, nrel.gov; Rystad Energy database, rystadenergy.com; World Energy Resources: 2013 Survey, World Energy Council, October 2013, worldenergy.org
Gigawatts
Power-generation potential for select sub-Saharan African countries by technology1
Mozambique
South Africa
Gabon
Kenya
Mauritania
Cameroon
Angola
Nigeria
Ethiopia
Tanzania
Botswana
DRC2
Wind Hydro Coal Gas Geo
27
33
16
57
74
98
111
35
178
187
17
42
179
Sudan
22 Solar and wind capacity are excluded as they are not “dispatchable,” or the type of electricity generation that cannot be turned on or off or the level adjusted on demand. It therefore cannot be considered base load, whereas energy sources such as gas, coal, and nuclear are.
18
Mozambique, and South Africa) with primary-energy capacity of more than 100 gigawatts each.
From a primary-energy point of view, one or two sources are dominant in most countries—an extreme example is the Democratic Republic of the Congo (DRC), where 99 percent of capacity comes from hydro. Looking across the continent, however, the distribution of sources is relatively well balanced:
� Solar has more than 11 terawatts of potential capacity. We have excluded solar from the comparison in in Exhibit 13 because of its nearly unlimited potential. Using a conservative estimate that 0.02 to 0.05 percent of landmass can be covered by solar panels, sub-Saharan Africa should be able to deliver 11.4 terawatts of solar capacity. This is dominated by the large and desert countries, with the top five—Chad, DRC, Mali, Niger, and Sudan—holding about 40 percent of the potential capacity.23
We have taken an aggressive approach to the capital cost associated with solar. 24 We have set a starting point of $1,550 per kilowatt in 2011, with a reduction to $1,040 per kilowatt by 2020, and further reductions to $725 per kilowatt by 2040. However, we have been more conservative
in our expectations for the additional costs of project delivery in Africa. As a result of this additional premium, we effectively see total overnight capital for solar PV decline from $2,500 to $870 per kilowatt over the 30-year period. As a result, solar levelized costs are projected to decline by more than 20 percent from 2020 to 2040. In 2011, the levelized cost for the top ten countries from a highest irradiation point of view was estimated at $164 per megawatt-hour to $197 per megawatt-hour; by 2020 it would range from $106 per megawatt-hour to $147 per megawatt-hour, dropping to between $76 per megawatt-hour and $112 per megawatt-hour by 2040. By 2030, solar would be the cheapest or second-cheapest domestic energy source in more than half of sub-Saharan African countries.
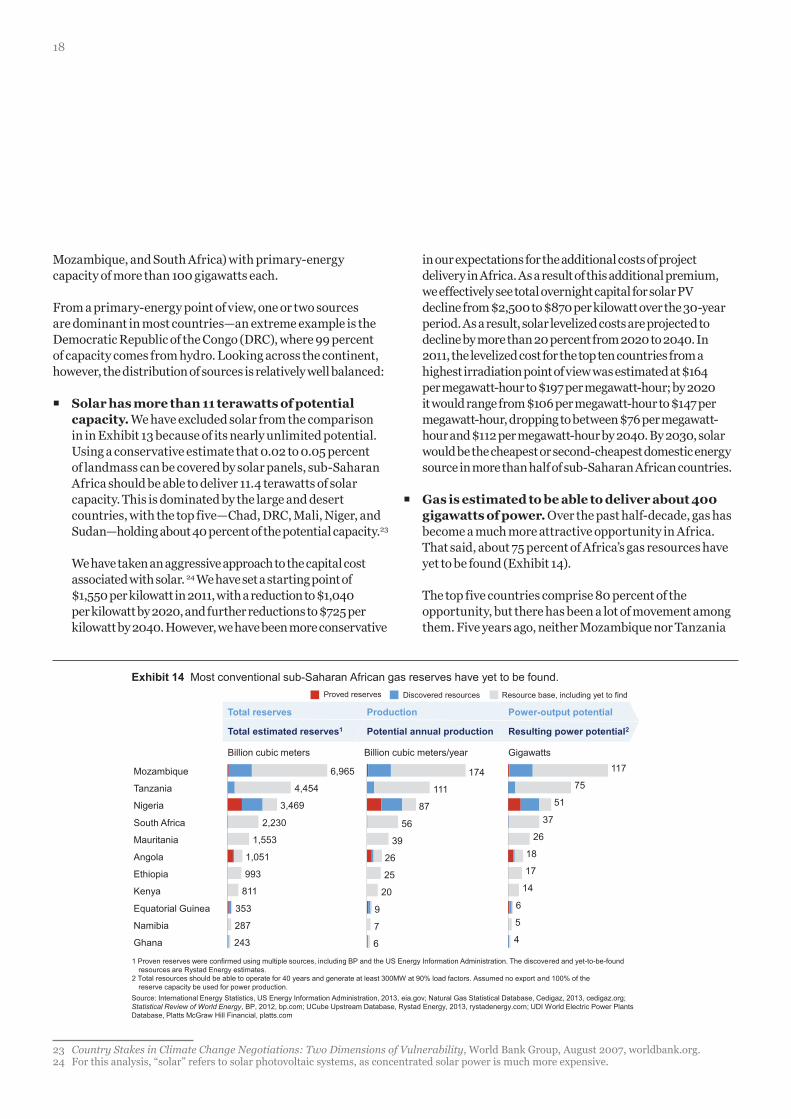
� Gas is estimated to be able to deliver about 400 gigawatts of power. Over the past half-decade, gas has become a much more attractive opportunity in Africa. That said, about 75 percent of Africa’s gas resources have yet to be found (Exhibit 14).
The top five countries comprise 80 percent of the opportunity, but there has been a lot of movement among them. Five years ago, neither Mozambique nor Tanzania
Exhibit 14 Most conventional sub-Saharan African gas reserves have yet to be found.
1 Proven reserves were confirmed using multiple sources, including BP and the US Energy Information Administration. The discovered and yet-to-be-found resources are Rystad Energy estimates.
2 Total resources should be able to operate for 40 years and generate at least 300MW at 90% load factors. Assumed no export and 100% of the reserve capacity be used for power production.
Source: International Energy Statistics, US Energy Information Administration, 2013, eia.gov; Natural Gas Statistical Database, Cedigaz, 2013, cedigaz.org; Statistical Review of World Energy, BP, 2012, bp.com; UCube Upstream Database, Rystad Energy, 2013, rystadenergy.com; UDI World Electric Power Plants Database, Platts McGraw Hill Financial, platts.com
Potential annual production
Billion cubic meters Gigawatts Billion cubic meters/year
Resulting power potential2
Total reserves Production Power-output potential
Total estimated reserves1
4,454
Mozambique 6,965
Ghana 243
Namibia 287
Equatorial Guinea 353
Kenya 811
Ethiopia 993
Angola 1,051
Mauritania 1,553
South Africa 2,230
Nigeria 3,469
Tanzania
Proved reserves Discovered resources Resource base, including yet to find
39
56
87
111
174
6
7
9
20
25
26
4
5
6
14
17
18
26
37
51
75
117
23 Country Stakes in Climate Change Negotiations: Two Dimensions of Vulnerability, World Bank Group, August 2007, worldbank.org.24 For this analysis, “solar” refers to solar photovoltaic systems, as concentrated solar power is much more expensive.
Electric Power & Natural Gas
Brighter Africa: The growth potential of the sub-Saharan electricity sector 19
would feature on the list of countries with significant gas resources; now, these two countries alone represent 50 percent of the gas-fired potential in sub-Saharan Africa, with the next three countries—Mauritania, Nigeria, and South Africa—adding another 30 percent. In addition to these conventional sources, Mauritania, Nigeria, and South Africa have further potential in shale gas (about 62 gigawatts) and coal-bed methane (3 gigawatts).
The levelized cost of gas 25 capacity across the region starts very low, at a range between $47 per megawatt-hour to $65 per megawatt-hour. Gas is inexpensive because of government subsidies throughout much of sub-Saharan Africa.26 The central challenge associated with these gas costs is that the resource may not be available, as the gas producers are not always willing to sell at these low prices. Over time, we expect these subsidies to decrease, meaning that the levelized cost of gas-fired technology will increase to more than $90 per megawatt-hour by 2040.
� The DRC alone has 50 percent of Africa’s hydro capacity. The technically exploitable resource potential from hydroelectric power is about 350 gigawatts and is even more concentrated than the gas opportunity. The DRC has half of sub-Saharan Africa’s technically exploitable hydro-capacity potential, with the next four countries (Angola, Cameroon, Ethiopia, and Gabon) contributing another 33 percent.
Costs of hydroelectric power projects can vary greatly, rendering some of this potential economically unfeasible. The levelized cost of the lower-cost hydro generation ranges from $59 per megawatt-hour in East Africa to $83 per megawatt-hour in Southern Africa. The higher-cost plants range from $104 per megawatt-hour in Southern Africa to more than $130 per megawatt-hour in West
Africa.27 In addition, we modeled four specific power plants—Grand Inga, Inga 3, Kwanza Basin, and Mambilla. The resulting levelized costs for these large projects range from $25 per megawatt-hour for Inga to nearly $100 per megawatt-hour for Mambilla to about $160 per megawatt-hour for Kwanza Basin. We assumed no further benefits from learning-curve effects given the the maturity of the technology, and also because hydro technology has been optimized as much as it can be at this point.28
� Three Southern African countries dominate coal. The coal-resource capacity is estimated at about 290 gigawatts. South Africa (114 gigawatts), Botswana (107 gigawatts), and Mozambique (57 gigawatts) comprise 94 percent of the opportunity.
In 2020, the levelized costs for the big three markets will range from $59 per megawatt-hour to $71 per megawatt-hour.29 These costs will remain stable over the following two decades, given anticipated increases in mining cost and diminishing quality of coal, but offset by improved power-station thermal efficiency.30 The projected levelized cost in 2040 will range between $57 per megawatt-hour and $62 per megawatt-hour.
Other countries, which together represent 6 percent of the total available coal market, will see higher costs, driven by lower calorific value of the coal and larger mining expense. The 2020 levelized costs range from $73 per megawatt-hour to $86 per megawatt-hour; these figures will improve slightly—$62 per megawatt-hour to $73 per megawatt-hour by 2040—as a result of thermal efficiency improvements in power stations.
� Onshore wind can deliver about 109 gigawatts of capacity. Onshore wind capacity has made big strides in Africa. Wind potential is found in most
25 For this analysis, “gas” refers to combined-cycle gas-turbine technology, not open cycle, which has lower capital costs but is significantly less fuel efficient, leading to higher levelized costs of energy overall.
26 Prices are heavily subsidized by many African governments. While the global gas price may be $10 to $15 per million British thermal units, the gas prices seen across the continent are much lower. As an input price for gas, we assumed a 20 percent premium on the production cost and transportation cost in 2020, and then a 40 percent premium in 2030. The resulting price is much lower than the global gas price, and therefore represents an opportunity cost for these gas-producing markets, but also provides electricity more cheaply to these markets. The only country where there is not significant subsidy is Angola. The estimated levelized cost of generation from Angola, without any subsidy, is therefore about $78 per megawatt-hour.
27 Hydro capacity has a broad range of potential costs, including the individual topography of the resource and the availability of water during dry seasons.
28 World Energy Resources: 2013 Survey, World Energy Council, October 2013, worldenergy.org; Regional Power Systems Master Plan, Eastern Africa Power Pool and East African Community, 2011, eac.int; West African Power Pool Master Plan (updated), October 2011, ecowapp.org; Integrated Resource Plan (2010–30), Department of Energy, Republic of South Africa, 2014, energy.gov.za.
29 Levelized costs are calculated without any carbon tax. The calorific value of the coal is one of the key determinants of levelized costs. For the three main markets, we have assumed the lower range of the calorific value, assuming that the higher-quality coal will be exported. For the balance of the markets, we have assumed the average calorific value of the coal they have available.
30 Thermal efficiency is projected to be 35 percent in 2020, improving to 40 percent by 2040; Annual Energy Outlook 2014, US Energy Information Administration, April 2014, eia.gov; World Energy Outlook, International Energy Agency, worldenergyoutlook.org, © OECD/IEA 2013.
20
coastal African countries. As a result, the top five countries—Angola, Chad, Somalia, South Africa, and Sudan—represent just 66 percent of the opportunity. The most promising locations for wind energy in sub-Saharan Africa are primarily on the south and east coasts and along the Rift Valley, with wind speeds peaking in South Africa and Somalia at more than 9.0 meters per second, and in Kenya at more than 8.5 meters per second.31
Energy produced by the countries with the top wind speeds (above 9.6 meters per second) translates into levelized costs of $107 per megawatt-hour to $142 per megawatt-hour in 2020. Lower wind speeds (between 6 and 9.6 meters per second) will have levelized costs of wind generation of about $152 per megawatt-hour to $175 per megawatt-hour in 2020). We expect them to drop as capital costs for wind turbines fall. The resulting levelized costs for wind in 2040 should be $89 per megawatt-hour to $118 per megawatt-hour for the very high load-factor countries, and $126 per megawatt-hour to $146 per megawatt-hour for the mid-range load-factor markets.
� Geothermal capacity is dominated by Ethiopia and Kenya. Total geothermal capacity in Africa is about 15 gigawatts, much smaller than any of the other primary fuel sources. Kenya (7 gigawatts) and Ethiopia (5 gigawatts) represent 80 percent of the opportunity, and both are actively pursuing this resource.
Two main factors influence geothermal levelized costs: depth of the drilling required and the subsurface temperature. Ethiopia and Kenya have the highest sub-surface temperatures, and as a result the lowest levelized costs. Although the total capacity derived from geothermal is small, the levelized costs are low, ranging from $75 per megawatt-hour to $105 per megawatt-hour in 2020. Capital cost reductions will result in a slight drop by 2040, ranging from $69 per megawatt-hour to $97 per megawatt-hour.
Capacity potential exceeds demand in most regions. The future demand level of 1,600 terawatt-hours across sub-Saharan Africa by 2040 translates into a total capacity requirement of 345 gigawatts.32 Of this total demand, 140 gigawatts is in Southern Africa, 115 gigawatts in West Africa, 67 gigawatts in East Africa, and 23 gigawatts in Central Africa.
31 Wind speeds from the Solar and Wind Energy Resource Assessment, National Renewable Energy Laboratory, 2013, nrel.gov; Country Stakes in Climate Change Negotiations: Two Dimensions of Vulnerability, World Bank Group, August 2007, worldbank.org.
32 Capacity need is reverse calculated from energy demand. We assume that residential demand is more volatile than industrial demand. Therefore, capacity levels to deliver residential demand are assumed to operate 30 percent of the time, while capacity levels for industrial load operate 75 percent of the time. The implication is that more capacity would be required to deliver an equivalent level of residential need, compared with industrial need.
Is nuclear in Africa’s future?In this document we have avoided consideration of nuclear as a viable energy option by 2040. It is true that South Africa already has nearly two gigawatts in nuclear capacity and has signed memorandums of understanding to cooperate on developing its nuclear energy sector with China, France, Japan, Russia, South Korea, and the United States. Also, Egypt and Nigeria have used small test reactors. Nevertheless, the likelihood that nuclear generation will be adopted continent-wide is small; although South Africa may be pursuing a nuclear strategy, it is widely regarded as a more expensive source than other available options.
There are many reasons why nuclear power is unlikely to take off in Africa. First, nuclear energy implies environmental, safety, and political issues and the prospect of sub-Saharan Africa building any more nuclear facilities would likely face strong resistance from the local public and international community. Furthermore, nuclear is relatively expensive, and most large countries have access to less expensive energy sources with considerably shorter lead times, while smaller countries do not need the large scale that nuclear power offers. Nuclear also requires the largest amount of upfront capital investment. Since this is already a bottleneck, smaller projects such as gas and renewables secure funding more easily.
A skills gap is another factor preventing adoption of nuclear technology. Government ministries and private-sector developers already struggle to find engineers able to build gas power plants. Identifying experts to cover all the safety and technology intricacies of nuclear would be even more daunting.
Electric Power & Natural Gas
Brighter Africa: The growth potential of the sub-Saharan electricity sector 21
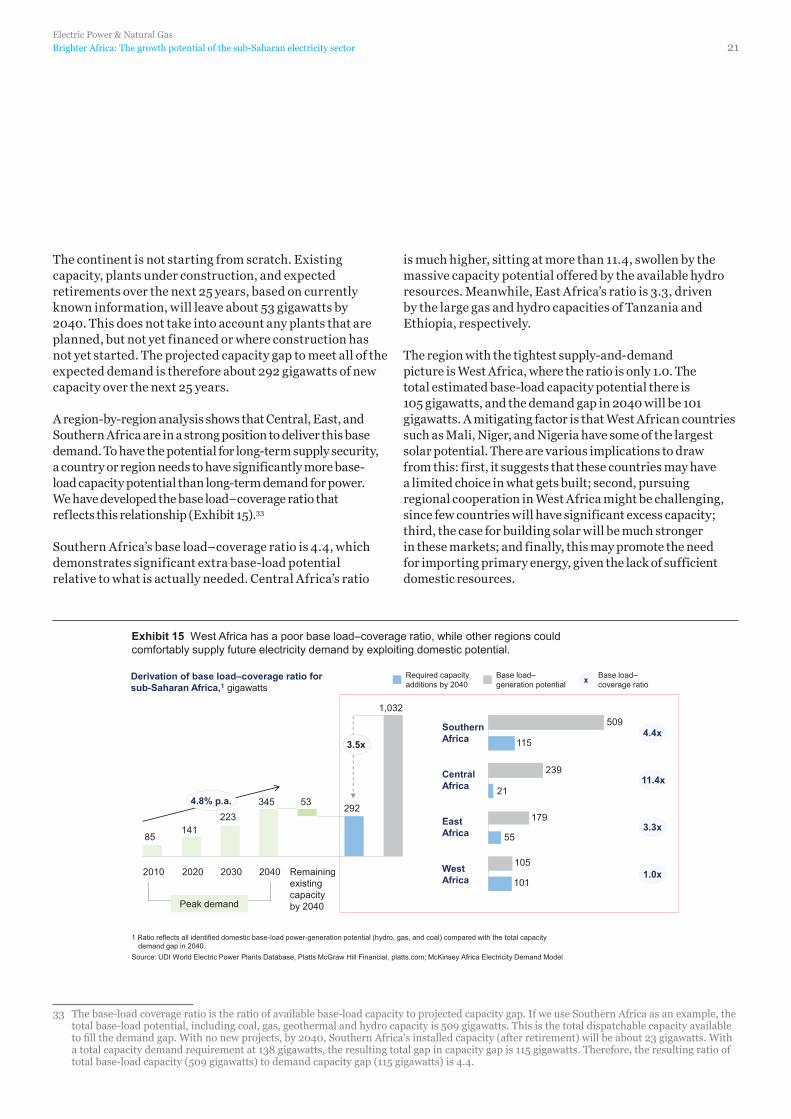
The continent is not starting from scratch. Existing capacity, plants under construction, and expected retirements over the next 25 years, based on currently known information, will leave about 53 gigawatts by 2040. This does not take into account any plants that are planned, but not yet financed or where construction has not yet started. The projected capacity gap to meet all of the expected demand is therefore about 292 gigawatts of new capacity over the next 25 years.
A region-by-region analysis shows that Central, East, and Southern Africa are in a strong position to deliver this base demand. To have the potential for long-term supply security, a country or region needs to have significantly more base- load capacity potential than long-term demand for power. We have developed the base load–coverage ratio that reflects this relationship (Exhibit 15).33
Southern Africa’s base load–coverage ratio is 4.4, which demonstrates significant extra base-load potential relative to what is actually needed. Central Africa’s ratio
is much higher, sitting at more than 11.4, swollen by the massive capacity potential offered by the available hydro resources. Meanwhile, East Africa’s ratio is 3.3, driven by the large gas and hydro capacities of Tanzania and Ethiopia, respectively.
The region with the tightest supply-and-demand picture is West Africa, where the ratio is only 1.0. The total estimated base-load capacity potential there is 105 gigawatts, and the demand gap in 2040 will be 101 gigawatts. A mitigating factor is that West African countries such as Mali, Niger, and Nigeria have some of the largest solar potential. There are various implications to draw from this: first, it suggests that these countries may have a limited choice in what gets built; second, pursuing regional cooperation in West Africa might be challenging, since few countries will have significant excess capacity; third, the case for building solar will be much stronger in these markets; and finally, this may promote the need for importing primary energy, given the lack of sufficient domestic resources.
Exhibit 15 West Africa has a poor base load–coverage ratio, while other regions could comfortably supply future electricity demand by exploiting domestic potential.
Southern Africa
Central Africa
East Africa
West Africa
x Base load– coverage ratio
Derivation of base load–coverage ratio for sub-Saharan Africa,1 gigawatts
1 Ratio reflects all identified domestic base-load power-generation potential (hydro, gas, and coal) compared with the total capacity demand gap in 2040.
Source: UDI World Electric Power Plants Database, Platts McGraw Hill Financial, platts.com; McKinsey Africa Electricity Demand Model
Peak demand
1,032
292 345
223 141
85
3.5x
4.8% p.a.
Remaining existing capacity by 2040
53
2040 2030 2020 2010
Required capacity additions by 2040
Base load– generation potential
509
115
239
21
179
55
105
101
4.4x
11.4x
3.3x
1.0x
33 The base-load coverage ratio is the ratio of available base-load capacity to projected capacity gap. If we use Southern Africa as an example, the total base-load potential, including coal, gas, geothermal and hydro capacity is 509 gigawatts. This is the total dispatchable capacity available to fill the demand gap. With no new projects, by 2040, Southern Africa’s installed capacity (after retirement) will be about 23 gigawatts. With a total capacity demand requirement at 138 gigawatts, the resulting total gap in capacity gap is 115 gigawatts. Therefore, the resulting ratio of total base-load capacity (509 gigawatts) to demand capacity gap (115 gigawatts) is 4.4.
22
Africa requires about $490 billion for new generating capacityHow Africa will build up its power sector becomes a political balancing act that requires trade-offs to be made between security of supply, ensuring the most affordable electricity future, increasing electricity access, maximizing socio-economic gains, and minimizing environmental impact.
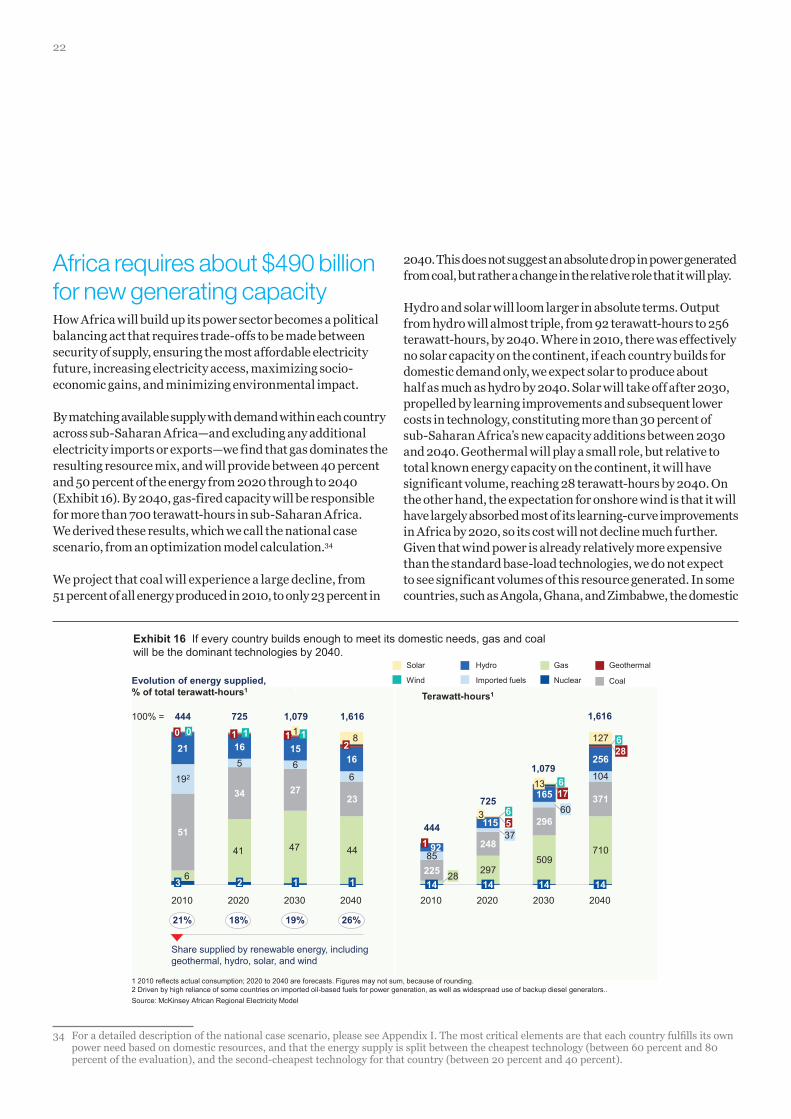
By matching available supply with demand within each country across sub-Saharan Africa—and excluding any additional electricity imports or exports—we find that gas dominates the resulting resource mix, and will provide between 40 percent and 50 percent of the energy from 2020 through to 2040 (Exhibit 16). By 2040, gas-fired capacity will be responsible for more than 700 terawatt-hours in sub-Saharan Africa. We derived these results, which we call the national case scenario, from an optimization model calculation.34
We project that coal will experience a large decline, from 51 percent of all energy produced in 2010, to only 23 percent in
2040. This does not suggest an absolute drop in power generated from coal, but rather a change in the relative role that it will play.
Hydro and solar will loom larger in absolute terms. Output from hydro will almost triple, from 92 terawatt-hours to 256 terawatt-hours, by 2040. Where in 2010, there was effectively no solar capacity on the continent, if each country builds for domestic demand only, we expect solar to produce about half as much as hydro by 2040. Solar will take off after 2030, propelled by learning improvements and subsequent lower costs in technology, constituting more than 30 percent of sub-Saharan Africa’s new capacity additions between 2030 and 2040. Geothermal will play a small role, but relative to total known energy capacity on the continent, it will have significant volume, reaching 28 terawatt-hours by 2040. On the other hand, the expectation for onshore wind is that it will have largely absorbed most of its learning-curve improvements in Africa by 2020, so its cost will not decline much further. Given that wind power is already relatively more expensive than the standard base-load technologies, we do not expect to see significant volumes of this resource generated. In some countries, such as Angola, Ghana, and Zimbabwe, the domestic
26% 19% 18%
Share supplied by renewable energy, including geothermal, hydro, solar, and wind
1 2010 reflects actual consumption; 2020 to 2040 are forecasts. Figures may not sum, because of rounding. 2 Driven by high reliance of some countries on imported oil-based fuels for power generation, as well as widespread use of backup diesel generators.. Source: McKinsey African Regional Electricity Model
Evolution of energy supplied, % of total terawatt-hours1 1
100% =
2040
1,616
2030
1,079
2020
725
2010
444
21%
2030 2020 2010 2040
3 2 1 1
41 47 44
51
6
34 27 23
21 16 15 16
192 5 6
6
0 0 1 1 1 1 2
8 1
1,079
725
444
1,616
225
248
296
371
92
115
165
256
297 509
710
104
127
85
14 14 14 14
1 37
6 5
60
13 17 6
28 6
28
3
Exhibit 16 If every country builds enough to meet its domestic needs, gas and coal will be the dominant technologies by 2040.
Terawatt-hours1 Nuclear
Gas
Coal Imported fuels
Hydro Geothermal
Wind
Solar
34 For a detailed description of the national case scenario, please see Appendix I. The most critical elements are that each country fulfills its own power need based on domestic resources, and that the energy supply is split between the cheapest technology (between 60 percent and 80 percent of the evaluation), and the second-cheapest technology for that country (between 20 percent and 40 percent).
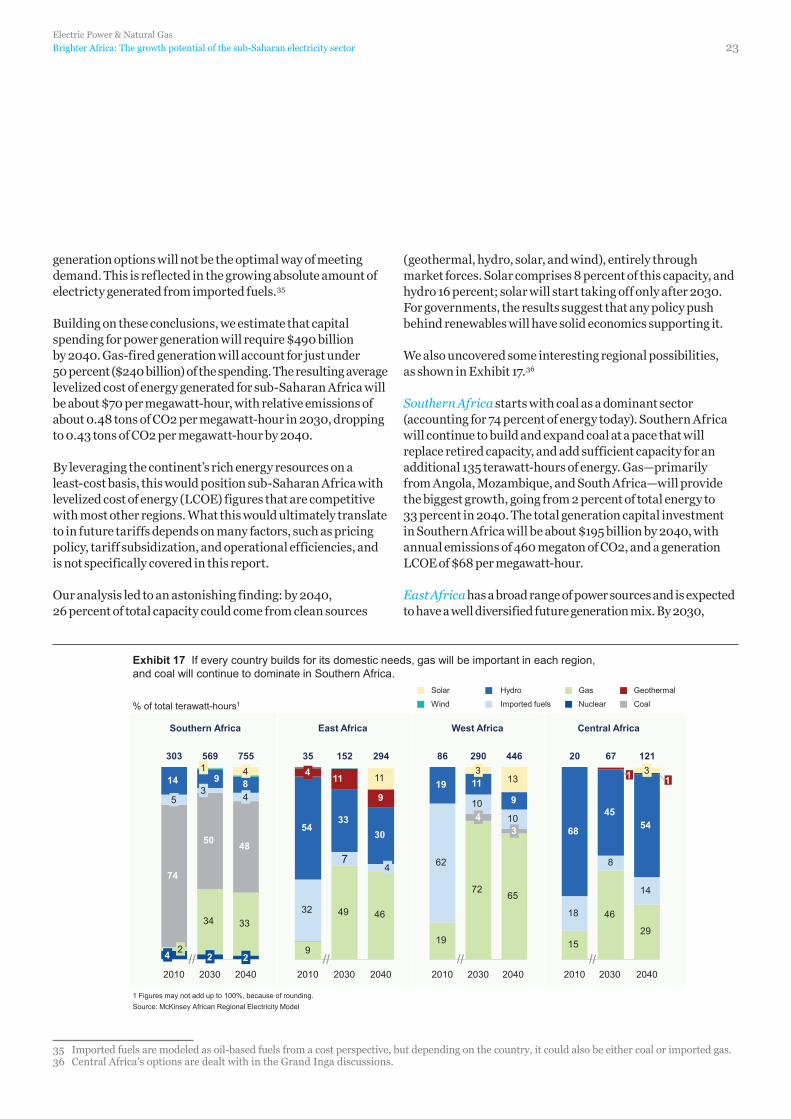
Electric Power & Natural Gas
Brighter Africa: The growth potential of the sub-Saharan electricity sector 23
generation options will not be the optimal way of meeting demand. This is reflected in the growing absolute amount of electricty generated from imported fuels.35
Building on these conclusions, we estimate that capital spending for power generation will require $490 billion by 2040. Gas-fired generation will account for just under 50 percent ($240 billion) of the spending. The resulting average levelized cost of energy generated for sub-Saharan Africa will be about $70 per megawatt-hour, with relative emissions of about 0.48 tons of CO2 per megawatt-hour in 2030, dropping to 0.43 tons of CO2 per megawatt-hour by 2040.
By leveraging the continent’s rich energy resources on a least-cost basis, this would position sub-Saharan Africa with levelized cost of energy (LCOE) figures that are competitive with most other regions. What this would ultimately translate to in future tariffs depends on many factors, such as pricing policy, tariff subsidization, and operational efficiencies, and is not specifically covered in this report.
Our analysis led to an astonishing finding: by 2040, 26 percent of total capacity could come from clean sources
(geothermal, hydro, solar, and wind), entirely through market forces. Solar comprises 8 percent of this capacity, and hydro 16 percent; solar will start taking off only after 2030. For governments, the results suggest that any policy push behind renewables will have solid economics supporting it.
We also uncovered some interesting regional possibilities, as shown in Exhibit 17.36
Southern Africa starts with coal as a dominant sector (accounting for 74 percent of energy today). Southern Africa will continue to build and expand coal at a pace that will replace retired capacity, and add sufficient capacity for an additional 135 terawatt-hours of energy. Gas—primarily from Angola, Mozambique, and South Africa—will provide the biggest growth, going from 2 percent of total energy to 33 percent in 2040. The total generation capital investment in Southern Africa will be about $195 billion by 2040, with annual emissions of 460 megaton of CO2, and a generation LCOE of $68 per megawatt-hour.
East Africa has a broad range of power sources and is expected to have a well diversified future generation mix. By 2030,
34 33
74
50 48
14 8 9 4
3
1
2
5 4
Exhibit 17 If every country builds for its domestic needs, gas will be important in each region, and coal will continue to dominate in Southern Africa.
% of total terawatt-hours1
1 Figures may not add up to 100%, because of rounding. Source: McKinsey African Regional Electricity Model
Nuclear
Gas
Coal Imported fuels
Hydro Geothermal
Wind
Solar
East Africa
2040
294
2030
152
2010
35
West Africa
2040
446
2030
290
2010
86
Southern Africa
2030
569
2010
303
2040
755
Central Africa
2040
67
2030
121
2010
20
4 2 2
49 46 32
7
54 33
30
9
9
11 11
4
4
19
72 65
62
10 10
19 11
9
13
3 4
3
15
46
29
18
8
14
68
45 54
3 1 1
35 Imported fuels are modeled as oil-based fuels from a cost perspective, but depending on the country, it could also be either coal or imported gas.36 Central Africa’s options are dealt with in the Grand Inga discussions.
24
almost half of supply will come from gas sources. Hydro capacity will grow steadily in absolute terms, but decrease in relative terms by 2040, when it will represent 30 percent of capacity. Given the total amount of capacity available, geothermal will play a significant role for Ethiopia and Kenya, with 11 percent of energy supplied in 2030. The total generation capital investment in East Africa will be about $106 billion by 2040, with annual emissions of 57 megatons of CO2, and a generation LCOE of about $70 per megawatt-hour in 2040.
West Africa will be even more dominated by gas than the East African market. Currently, the region relies on expensive imported oil-based fuels for more than 60 percent of its electricity generation (including backup diesel generators), but in 2020 and 2030, the proportion of gas will rise significantly, as it is the only real domestic option for large-scale capacity. Once the cost of solar falls sufficiently, it will become an important source of energy, driving down the proportion of gas from 77 percent in 2020, to 72 percent in 2030, and to 65 percent in 2040. Hydro capacity is available, but given the generally small scale of available options, the levelized cost of hydro generation is typically much higher than gas in the short term and solar in the long term. The total generation capital investment in West Africa will be about $151 billion by 2040, with annual emissions of 151 megatons of CO2, and a generation LCOE of $74 per megawatt-hour.
Relative emissions across the continent will reflect the generation sources. Southern Africa will be the region with the highest relative emissions (0.61 tons CO2 per megawatt-hour) given that coal will still represent 48 percent of generation in 2040. Emissions from West Africa will be just over half of those of Southern Africa, at 0.34 tons CO2 per megawatt-hour, assuming that 65 percent of energy in 2040 will come from gas. East Africa will be the cleanest, with relative emissions of 0.19 tons CO2 per megawatt-hour; gas will be only 46 percent of generation by 2040, while technologies such as geothermal, hydro, and solar will make up 50 percent of production.
Capital spending on distribution and transmission will exceed $300 billion by 2040Effectively delivering generation capacity resolves only half the power challenge—building sufficient electricity
transmission and distribution infrastructure to get power to customers is of equal importance. We estimate that sub-Saharan Africa will need $265 billion to build the distribution infrastructure it requires, and $80 billion for transmission. We base the estimate for distribution on a comparison of the cost of delivering urban and rural grid connections, and rural off-grid connections. We estimated transmission as either about one-sixth the cost of generation or one-third the cost of distribution, both of which indicate a cost of about $80 billion.37
We expect a total of 114 million new urban grid connections by 2040; likewise, there will be 53 million rural grid connections, and roughly 25 million rural nongrid connections. The cost per connection will differ widely. Given shorter distances and significant economies of scale, the urban cost ($750 per connection) is significantly lower than the rural or rural off-grid connections. These urban connection costs compare favorably with the experience of South Africa (about $800 per connection), Tanzania (between $600 and $1,100 per connection), and Vietnam (about $570 per connection).
Rural off-grid, which is a combination of mini-grid solutions and fully independent household connections, will cost between $1,300 and $1,900 per connection, based on the Tanzania and Vietnam experiences.38 We have assumed the midpoint of this range for sub-Saharan Africa. Rural grid connections range more widely, from $1,100 per connection in Vietnam to $2,300 per connection in Tanzania. We adopted the Tanzania number as an Africa benchmark for long-term capital cost requirements, given its market similarity to the rest of the continent.
Total distribution spending between now and 2040 is likely to be about $265 billion. This will result in a grid-connected electrification rate of 71 percent and combined grid and off-grid overall electrification rate of 79 percent across the continent, and new connections for an additional 192 million households.
Including generation ($490 billion), transmission ($80 billion), and distribution ($265 billion), projected capital spending will total $835 billion between now and 2040. This would constitute a dauntingly huge investment requirement in any region, but in Africa the enormity is compounded by a lack of experience in delivering mega projects and a history of cost and schedule overruns. Another major challenge is the
37 These estimates are based on general power-sector asset structures, where generation accounts for about 60 percent of the costs; transmission, about 10 percent; and distribution, about 30 percent.
38 Rural Energy Agency, Tanzania, rea.go.tz.
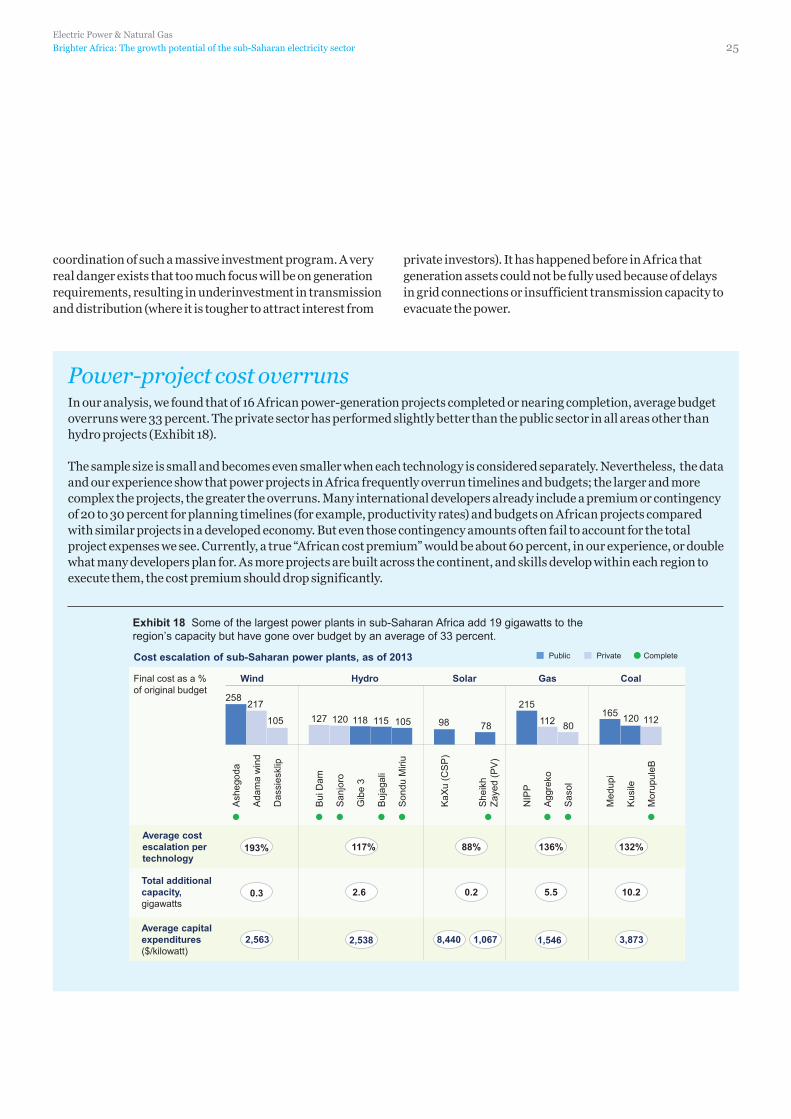
Electric Power & Natural Gas
Brighter Africa: The growth potential of the sub-Saharan electricity sector 25
coordination of such a massive investment program. A very real danger exists that too much focus will be on generation requirements, resulting in underinvestment in transmission and distribution (where it is tougher to attract interest from
private investors). It has happened before in Africa that generation assets could not be fully used because of delays in grid connections or insufficient transmission capacity to evacuate the power.
Power-project cost overrunsIn our analysis, we found that of 16 African power-generation projects completed or nearing completion, average budget overruns were 33 percent. The private sector has performed slightly better than the public sector in all areas other than hydro projects (Exhibit 18).
The sample size is small and becomes even smaller when each technology is considered separately. Nevertheless, the data and our experience show that power projects in Africa frequently overrun timelines and budgets; the larger and more complex the projects, the greater the overruns. Many international developers already include a premium or contingency of 20 to 30 percent for planning timelines (for example, productivity rates) and budgets on African projects compared with similar projects in a developed economy. But even those contingency amounts often fail to account for the total project expenses we see. Currently, a true “African cost premium” would be about 60 percent, in our experience, or double what many developers plan for. As more projects are built across the continent, and skills develop within each region to execute them, the cost premium should drop significantly.
Exhibit 18 Some of the largest power plants in sub-Saharan Africa add 19 gigawatts to the region’s capacity but have gone over budget by an average of 33 percent.
Final cost as a % of original budget
Cost escalation of sub-Saharan power plants, as of 2013
117% 88% 136% 132% Average cost escalation per technology
193%
Total additional capacity, gigawatts
2.6 0.2 5.5 10.2 0.3
2,538 8,440 1,067 1,546 3,873 Average capital expenditures ($/kilowatt)
2,563
258 217
127 120 118 115
215
112 165 120 112 80 78 98 105 105
Mor
upul
eB
Kus
ile
Med
upi
Sas
ol
Agg
reko
NIP
P
She
ikh
Zaye
d (P
V)
KaX
u (C
SP
)
Son
du M
iriu
Buj
agal
i
Gib
e 3
San
joro
Bui
Dam
Das
sies
klip
Ada
ma
win
d
Ash
egod
a
Hydro Solar Gas Coal Wind
Public Private Complete
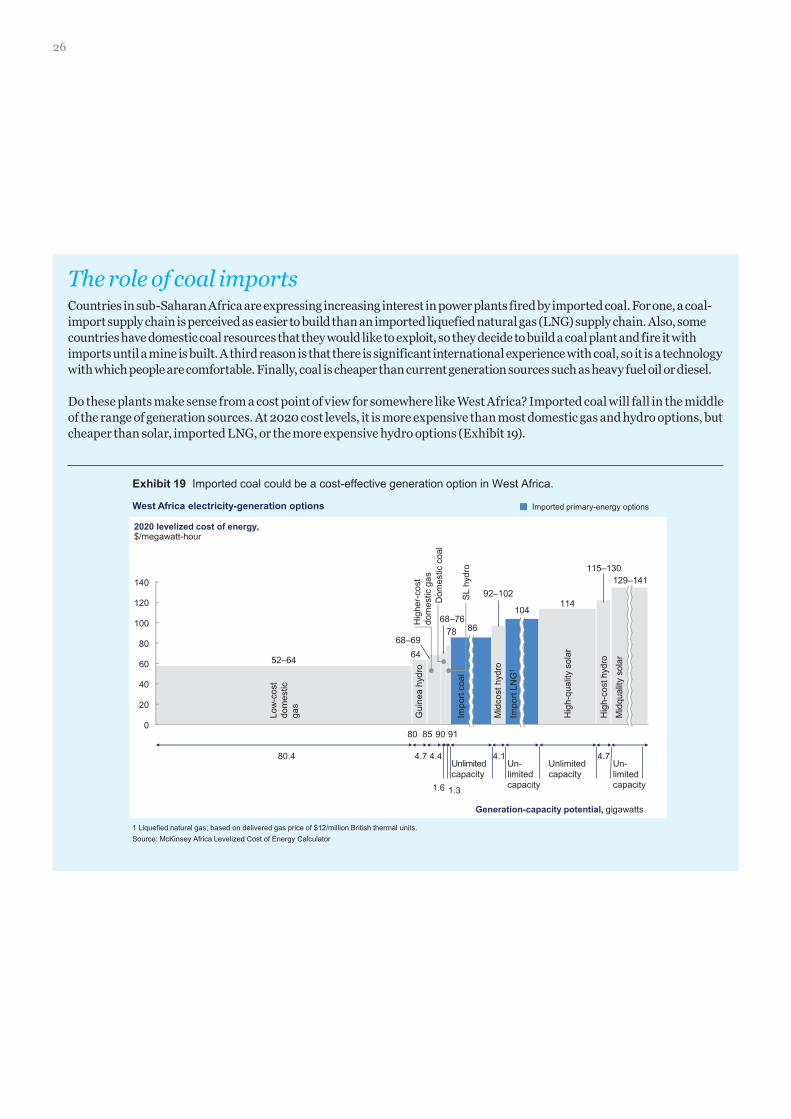
26
The role of coal importsCountries in sub-Saharan Africa are expressing increasing interest in power plants fired by imported coal. For one, a coal-import supply chain is perceived as easier to build than an imported liquefied natural gas (LNG) supply chain. Also, some countries have domestic coal resources that they would like to exploit, so they decide to build a coal plant and fire it with imports until a mine is built. A third reason is that there is significant international experience with coal, so it is a technology with which people are comfortable. Finally, coal is cheaper than current generation sources such as heavy fuel oil or diesel.
Do these plants make sense from a cost point of view for somewhere like West Africa? Imported coal will fall in the middle of the range of generation sources. At 2020 cost levels, it is more expensive than most domestic gas and hydro options, but cheaper than solar, imported LNG, or the more expensive hydro options (Exhibit 19).
2020 levelized cost of energy, $/megawatt-hour
Exhibit 19 Imported coal could be a cost-effective generation option in West Africa.
Imported primary-energy options
1 Liquefied natural gas; based on delivered gas price of $12/million British thermal units. Source: McKinsey Africa Levelized Cost of Energy Calculator
West Africa electricity-generation options
Generation-capacity potential, gigawatts
140
60
120
100
80
40
20
0
Impo
rt co
al
Hig
her-
cost
do
mes
tic g
as
52–64
Low
-cos
t do
mes
tic
gas
80 85 90 91
4.7 4.4
1.6 1.3
Unlimited capacity
4.1 Un- limited capacity
80.4 Unlimited capacity
4.7 Un- limited capacity
68–69
68–76
Gui
nea
hydr
o
64
78 86
92–102
104 114
115–130 129–141
SL
hydr
o
Dom
estic
coa
l
Mid
cost
hyd
ro
Impo
rt LN
G1
Hig
h-qu
ality
sol
ar
Hig
h-co
st h
ydro
Mid
qual
ity s
olar
27
There are a number of different policy decisions, industry developments, and resource discoveries that could alter the outlook of sub-Saharan Africa’s power sector. While security of supply, affordability, and expanding electricity access need to remain at the core of any energy future, we will now explore a few of the potential divergences from the least cost, nationally coordinated development path that has been discussed.
Regional integration, such as power pools, and promotion of renewable generation are game changers that could shape the energy landscape in sub-Saharan Africa over the next 25 years. Efforts in Africa and abroad to encourage these policies have met with mixed success. But there are good reasons to pursue them: regional integration could save more than $40 billion in overall capital spending while greater adoption of renewables could lead to a 27 percent reduction in CO2 from the national case discussed above.
In addition, big, new primary-energy sources, including the Grand Inga Dam, major offshore and onshore gas discoveries, and exploitation of unconventional gas resources, would also fundamentally reshape the economics of the power sector in sub-Saharan Africa.
In this chapter, we explore the different energy scenarios introduced above to better understand their potential impact on the economics and emissions of the sector. We also discuss what will be required to make some of these scenarios a reality.
Regional integration would save more than $40 billion in capital spendingMost African countries have tried to avoid relying on neighbors for power and, instead, have sought complete supply security. In addition, most African markets have focused on least-cost generation sources, regardless of the carbon emissions associated with the method. At the same time, Africans have discussed and promoted regional power integration for many years. The first power pool in Africa began in 1995, but through national self-
interest, insufficient capacity, weak system management, and many other challenges, power pools have yet to take off.39
Sub-Saharan Africa technically has four operating power pools: the Southern African Power Pool (SAPP), the Eastern African Power Pool (EAPP), the West African Power Pool (WAPP), and the Central African Power Pool (CAPP). However, none plays a big role in ensuring that the continent has sufficient electricity. Less than 8 percent of power crosses international borders in any African region, despite the capacity needs of many countries. The SAPP has the highest levels of trade, with 7.5 percent of power crossing international borders,40 but the electricity exchange from Cahora Bassa in Mozambique to South Africa, and the return from South Africa to Mozal, represents a significant proportion of this amount. In CAPP and EAPP, less than 1 percent of power crosses international borders.
The lack of regional trade is not surprising, given Africa’s chronic capacity shortage. Only countries with excess capacity could be expected to sell power across borders. For a time, South Africa had excess capacity, and the SAPP flourished, but since the energy crisis in 2008, exports of electricity from South Africa have slightly declined.41
Despite the difficulties, the benefits of regional power trade remain significant. The national case discussed above assumes no further increase in international power trade beyond what already exists. As we relax this constraint, we see substantial cost savings for the overall power sector.42
By encouraging regional integration, sub-Saharan Africa would save $50 billion in generation capital spending, while spending only an additional $9 billion for transmission. This net savings of $41 billion represents a 9 percent reduction in total generation capital spending from the national case scenario.
In addition to the capital savings, regional integration would lead to savings of between 6 percent (in Southern Africa) and 10 percent (in East Africa) in the levelized cost of energy. This equates to an annual reduction of nearly $10 billion in the amount the African consumer needs to pay by 2040. These savings translate into a direct reduction in the required tariff an end user would
Exploring different paths that could reduce carbon emissions or save on capital spending
39 Southern African Power Pool presentation at SADC Investors Round Table Conference, Livingston, Zambia, July 15–17, 2009, sapp.co.zw.40 Regional Power Status in African Power Pools, Infrastructure Consortium for Africa, 2011, icafrica.org.41 Eskom Holdings SOC exports declined by 9 percent—from 13.9 terawatt-hours in 2008 to 12.6 terawatt-hours in 2009—after the 2008
electricity crisis in South Africa. By 2013, the export levels had mostly recovered, but are still not at previous levels: 2013 had export levels of 13.8 terawatt-hours, per Eskom Holdings SOC Limited Integrated Report, 2014, eskom.co.za.
42 In the national case scenario discussed in the previous chapter, no electricity imports are allowed to be used to meet the national demand of an individual country, beyond what is already being imported. In the regional integration scenario, we allow increased levels of import dependency. In 2020, up to 20 percent of power can be imported to meet local demand; in 2030, up to 30 percent; and in 2040, up to 40 percent.
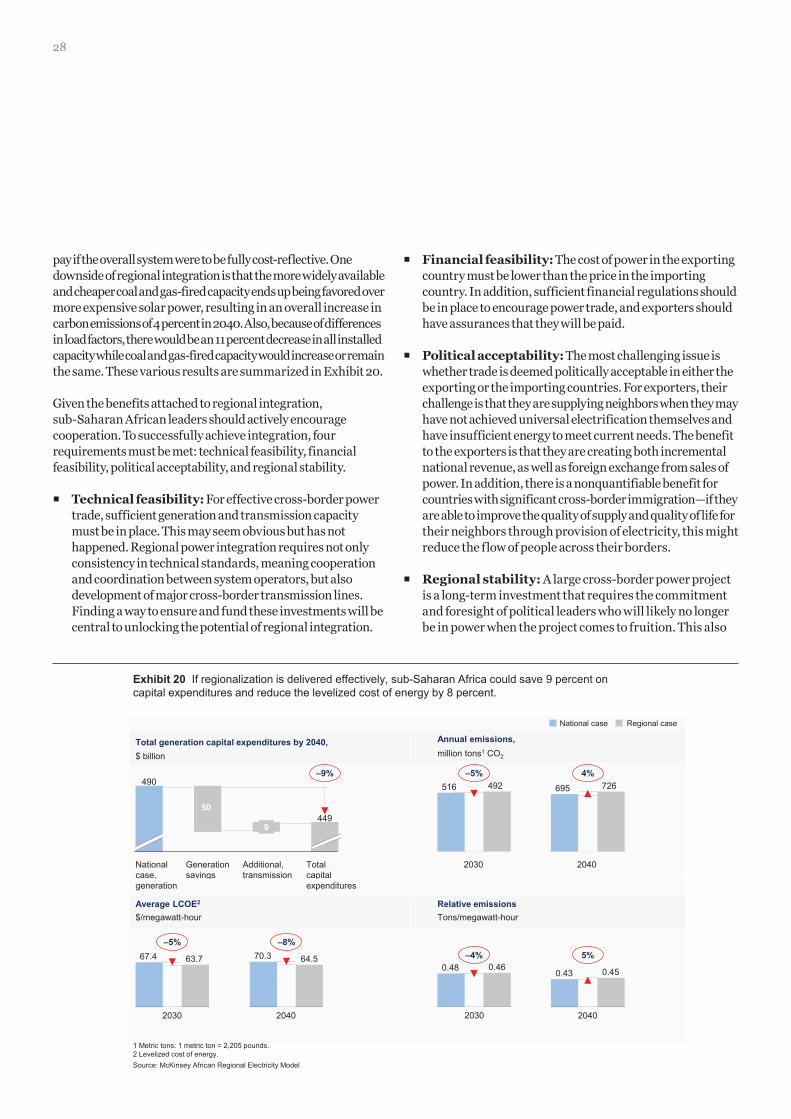
28
pay if the overall system were to be fully cost-reflective. One downside of regional integration is that the more widely available and cheaper coal and gas-fired capacity ends up being favored over more expensive solar power, resulting in an overall increase in carbon emissions of 4 percent in 2040. Also, because of differences in load factors, there would be an 11 percent decrease in all installed capacity while coal and gas-fired capacity would increase or remain the same. These various results are summarized in Exhibit 20.
Given the benefits attached to regional integration, sub-Saharan African leaders should actively encourage cooperation. To successfully achieve integration, four requirements must be met: technical feasibility, financial feasibility, political acceptability, and regional stability.
� Technical feasibility: For effective cross-border power trade, sufficient generation and transmission capacity must be in place. This may seem obvious but has not happened. Regional power integration requires not only consistency in technical standards, meaning cooperation and coordination between system operators, but also development of major cross-border transmission lines. Finding a way to ensure and fund these investments will be central to unlocking the potential of regional integration.
� Financial feasibility: The cost of power in the exporting country must be lower than the price in the importing country. In addition, sufficient financial regulations should be in place to encourage power trade, and exporters should have assurances that they will be paid.
� Political acceptability: The most challenging issue is whether trade is deemed politically acceptable in either the exporting or the importing countries. For exporters, their challenge is that they are supplying neighbors when they may have not achieved universal electrification themselves and have insufficient energy to meet current needs. The benefit to the exporters is that they are creating both incremental national revenue, as well as foreign exchange from sales of power. In addition, there is a nonquantifiable benefit for countries with significant cross-border immigration—if they are able to improve the quality of supply and quality of life for their neighbors through provision of electricity, this might reduce the flow of people across their borders.
� Regional stability: A large cross-border power project is a long-term investment that requires the commitment and foresight of political leaders who will likely no longer be in power when the project comes to fruition. This also
Exhibit 20 If regionalization is delivered effectively, sub-Saharan Africa could save 9 percent on capital expenditures and reduce the levelized cost of energy by 8 percent.
$ billion million tons1 CO2
$/megawatt-hour Tons/megawatt-hour
National case Regional case
2040
2040
2040 2030
2030
2030
449
Total capital expenditures
Additional, transmission
9
Generation savings
National case, generation
490
1 Metric tons: 1 metric ton = 2,205 pounds. 2 Levelized cost of energy. Source: McKinsey African Regional Electricity Model
Total generation capital expenditures by 2040, Annual emissions,
Average LCOE2 Relative emissions
50
492 516 726 695
63.7 67.4 –5%
64.5 70.3 0.46 0.48 0.45 0.43
–8% –4% 5%
4% –9% –5%
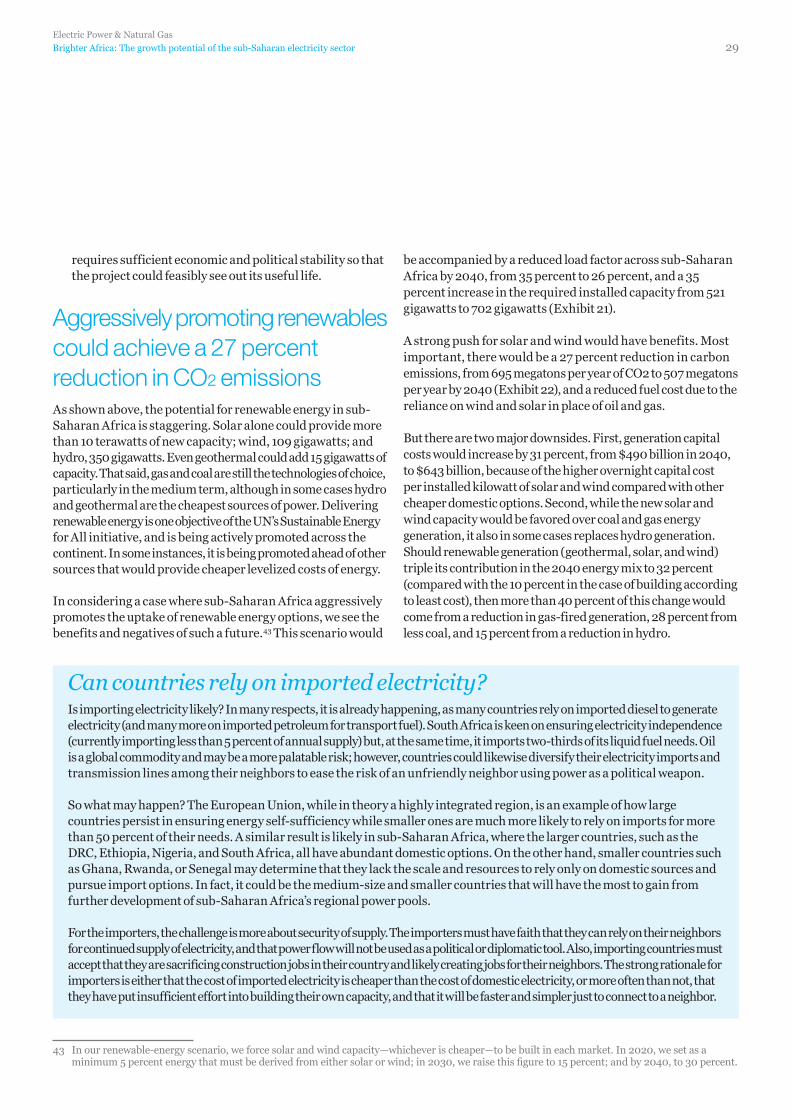
Electric Power & Natural Gas
Brighter Africa: The growth potential of the sub-Saharan electricity sector 29
requires sufficient economic and political stability so that the project could feasibly see out its useful life.
Aggressively promoting renewables could achieve a 27 percent reduction in CO2 emissionsAs shown above, the potential for renewable energy in sub-Saharan Africa is staggering. Solar alone could provide more than 10 terawatts of new capacity; wind, 109 gigawatts; and hydro, 350 gigawatts. Even geothermal could add 15 gigawatts of capacity. That said, gas and coal are still the technologies of choice, particularly in the medium term, although in some cases hydro and geothermal are the cheapest sources of power. Delivering renewable energy is one objective of the UN’s Sustainable Energy for All initiative, and is being actively promoted across the continent. In some instances, it is being promoted ahead of other sources that would provide cheaper levelized costs of energy.
In considering a case where sub-Saharan Africa aggressively promotes the uptake of renewable energy options, we see the benefits and negatives of such a future.43 This scenario would
be accompanied by a reduced load factor across sub-Saharan Africa by 2040, from 35 percent to 26 percent, and a 35 percent increase in the required installed capacity from 521 gigawatts to 702 gigawatts (Exhibit 21).
A strong push for solar and wind would have benefits. Most important, there would be a 27 percent reduction in carbon emissions, from 695 megatons per year of CO2 to 507 megatons per year by 2040 (Exhibit 22), and a reduced fuel cost due to the reliance on wind and solar in place of oil and gas.
But there are two major downsides. First, generation capital costs would increase by 31 percent, from $490 billion in 2040, to $643 billion, because of the higher overnight capital cost per installed kilowatt of solar and wind compared with other cheaper domestic options. Second, while the new solar and wind capacity would be favored over coal and gas energy generation, it also in some cases replaces hydro generation. Should renewable generation (geothermal, solar, and wind) triple its contribution in the 2040 energy mix to 32 percent (compared with the 10 percent in the case of building according to least cost), then more than 40 percent of this change would come from a reduction in gas-fired generation, 28 percent from less coal, and 15 percent from a reduction in hydro.
43 In our renewable-energy scenario, we force solar and wind capacity—whichever is cheaper—to be built in each market. In 2020, we set as a minimum 5 percent energy that must be derived from either solar or wind; in 2030, we raise this figure to 15 percent; and by 2040, to 30 percent.
Can countries rely on imported electricity?Is importing electricity likely? In many respects, it is already happening, as many countries rely on imported diesel to generate electricity (and many more on imported petroleum for transport fuel). South Africa is keen on ensuring electricity independence (currently importing less than 5 percent of annual supply) but, at the same time, it imports two-thirds of its liquid fuel needs. Oil is a global commodity and may be a more palatable risk; however, countries could likewise diversify their electricity imports and transmission lines among their neighbors to ease the risk of an unfriendly neighbor using power as a political weapon.
So what may happen? The European Union, while in theory a highly integrated region, is an example of how large countries persist in ensuring energy self-sufficiency while smaller ones are much more likely to rely on imports for more than 50 percent of their needs. A similar result is likely in sub-Saharan Africa, where the larger countries, such as the DRC, Ethiopia, Nigeria, and South Africa, all have abundant domestic options. On the other hand, smaller countries such as Ghana, Rwanda, or Senegal may determine that they lack the scale and resources to rely only on domestic sources and pursue import options. In fact, it could be the medium-size and smaller countries that will have the most to gain from further development of sub-Saharan Africa’s regional power pools.
For the importers, the challenge is more about security of supply. The importers must have faith that they can rely on their neighbors for continued supply of electricity, and that power flow will not be used as a political or diplomatic tool. Also, importing countries must accept that they are sacrificing construction jobs in their country and likely creating jobs for their neighbors. The strong rationale for importers is either that the cost of imported electricity is cheaper than the cost of domestic electricity, or more often than not, that they have put insufficient effort into building their own capacity, and that it will be faster and simpler just to connect to a neighbor.
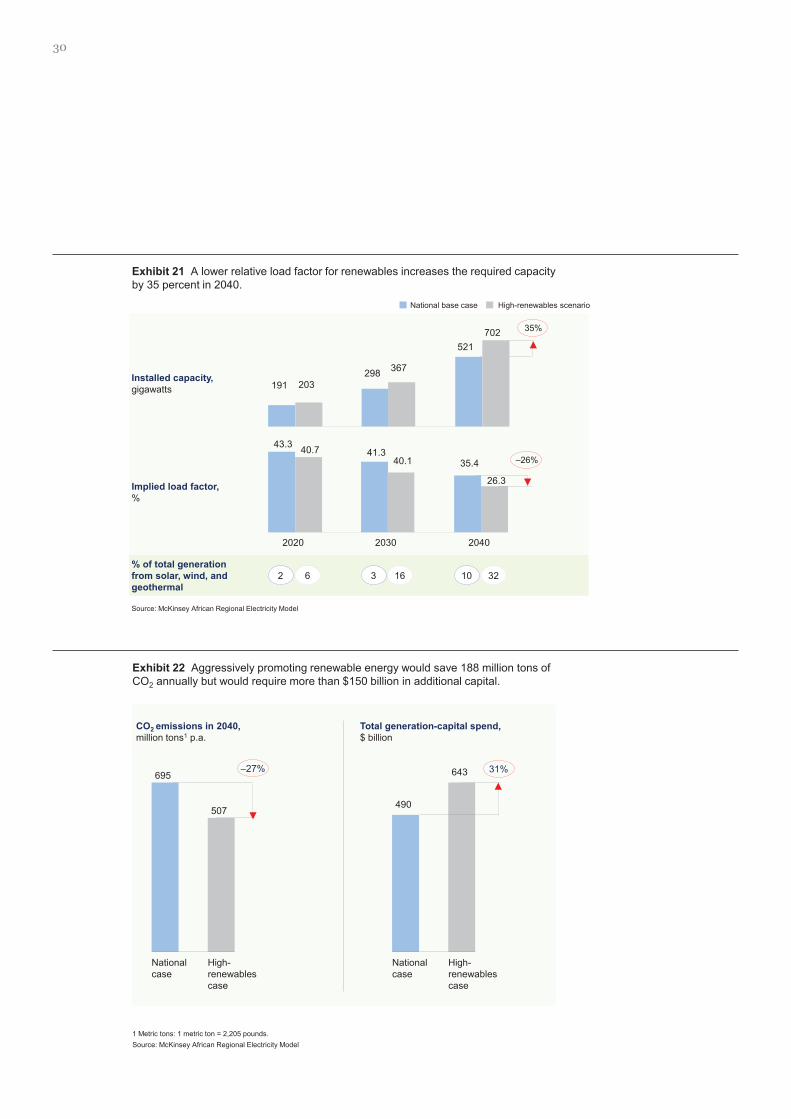
30
Exhibit 22 Aggressively promoting renewable energy would save 188 million tons of CO2 annually but would require more than $150 billion in additional capital.
643
490
High- renewables case
31%
National case
507
695 –27%
High- renewables case
National case
CO2 emissions in 2040, million tons1 p.a.
Total generation-capital spend, $ billion
1 Metric tons: 1 metric ton = 2,205 pounds. Source: McKinsey African Regional Electricity Model
Exhibit 21 A lower relative load factor for renewables increases the required capacity by 35 percent in 2040.
Source: McKinsey African Regional Electricity Model
2 6 3 16 10 32 % of total generation from solar, wind, and geothermal
Implied load factor, %
35.4 41.3
43.3
26.3
40.1 40.7
2040 2030 2020
–26%
Installed capacity, gigawatts
521
298 191
702
367
203
35%
High-renewables scenario National base case
Electric Power & Natural Gas
Brighter Africa: The growth potential of the sub-Saharan electricity sector 31
Major primary-energy shocks could alter the face of electricity in sub-Saharan AfricaRegional integration and renewables are two important factors that could change the energy picture in sub-Saharan Africa. But there are other big uncertainties. The biggest include the Grand Inga Dam project, significant additional conventional gas discoveries (as recently happened in Ghana, Mozambique, and Tanzania), unconventional gas findings or exploitation of existing deposits (as could happen in South Africa), or a fundamental shift that goes beyond anything previously attempted, such as the Desertec renewable-energy campaign.
Grand Inga is a contemplated 40-gigawatt hydroelectric project in the DRC that could fundamentally change the electricity market in sub-Saharan Africa. If it were to happen, it would be the largest infrastructure project in history and has the ability to deliver more than 200 terawatt-hours of electricity—the equivalent of 13 percent of all of sub-Saharan Africa’s total demand by 2040.
There are various estimates of Grand Inga’s cost, but one that is accepted is about $80 billion. This amount comprises roughly $40 billion for generation and $40 billion for transmission. Multiple transmission routes have been planned, but the one most likely to serve as the project’s backbone would be the western corridor of the Southern Highway. This would be a massive expansion of an existing transmission line that runs from the DRC, through Angola and Namibia, and into Botswana and South Africa.
Building Grand Inga would upend the economics of power in Africa. The expected generation cost is $25 per megawatt-hour (LCOE), with transmission cost expected to be about $2 to $3 per megawatt-hour. The total cost of power delivered into the national grids from Grand Inga would then roughly equate to $28 per megawatt-hour, compared with about $70 per megawatt-hour on average for the other available sources for the rest of the continent.
If Grand Inga were to be successfully completed (based on least-cost economic modeling when compared with the regional integration scenario),44 one interesting consequence would be
that the energy it generates would more economically flow north to Cameroon, Ghana, and Nigeria than south to South Africa. Successful execution of Grand Inga would replace 53 terawatt-hours of gas energy, most notably in Angola, Ghana, and Nigeria. In addition, Grand Inga would replace 26 terawatt-hours of coal energy, specifically in Zambia and Zimbabwe. Finally, Grand Inga would replace more than 50 terawatt-hours of solar energy production across a broad range of countries.
Despite the significant replacement of solar energy, there would still be significant CO2 savings. Successful completion of Grand Inga would deliver 63 megatons of CO2 savings compared with the regional integration scenario, and it would save $32 billion in net capital costs.45
Much has been written about what would be required to complete Grand Inga, but here are the most important elements:
� Ensuring the bankability of the project: Funders must be convinced of a project’s merits before they will lend enough money to allow it go forward. In Grand Inga’s case, the most critical bottleneck in bankability would be a guaranteed off-take agreement, so that if the power is delivered, it will be consumed and paid for. South Africa is the only country with sufficient financial resources and a credible electricity sector that would be able to sign a long-term off-take agreement.
� Obtaining sufficient funding to deliver the project: Once the project is considered bankable, it will require a range of organizations to cooperate to ensure the funding. Assuming the project comes in on budget, the total financing cost is 7 times DRC’s GDP, and 20 times DRC’s national budget. The expectation is that multiple development finance institutions (for example, the African Development Bank and the International Finance Corporation), African governments (for example, Nigeria and South Africa) as well as international (the United States and China), and many private stakeholders will need to participate.
� Securing effective stakeholder cooperation and collaboration: Given the scale, no single institution will be able to make Grand Inga happen. Most likely, it will require an unprecedented level of international cooperation and collaboration, driven by good governance and transparency.
44 In previous scenarios, we have allowed for maximum imports of 40 percent by 2040. In this scenario, we have allowed for maximum imports of 80 percent, under the condition that the imports are of electricity from Grand Inga. All other imports are fixed at a maximum of 40 percent.
45 All savings are calculated compared to the regional integration scenario discussed previously in this chapter. When compared with the national case scenario presented in the previous section, the results are even starker: there would be generation capital cost savings of $73 billion, and a reduction of 32 megatons of CO2. The CO2 reduction is less than described above, because there is a significant increase in gas capacity when moving from a national case scenario to any scenario that involves regional integration.
32
Major conventional gas discoveries: The second major disruption that could affect Africa is additional large discoveries of natural gas, likely off the coasts of the continent. Gas discoveries made from 2010 to 2013 accounted for 75 percent of the sub-Saharan gas discoveries of the past 20 years, with the majority made in Mozambique and Tanzania.46 In addition, exploration spending has reached unprecedented levels for Africa—nearly $15 billion annually over 2012 and 2013 versus an average annual spend of $4.7 billion in the previous decade. Because sub-Saharan Africa has been relatively underexplored so far, we could expect further natural-gas discoveries to occur in the future (Exhibit 23).
The density of exploration for sub-Saharan Africa is 0.3 wells per million square kilometers, compared with 1.1 wells per million square kilometers in North Africa, and 3.1 wells per million square kilometers in central Asia.
Gas discoveries can be game changers if the price at which the resource can be produced is lower than the average levelized cost of other choices. For example, if Kenya and Tanzania could not
count on recent conventional gas finds as part of their energy mix, the average electricity price in East Africa would rise from $70 per megawatt-hour to $79 per megawatt-hour and would cost the continent an extra $30 billion in generation capital spending.
Unconventional gas finds: A big part of the energy debate in South Africa centers on unconventional gas opportunities—in this case, shale gas. Total reserves for unconventional gas across sub-Saharan Africa are estimated to be 4,000 billion cubic meters, with 52 percent of this amount from South Africa and 35 percent from Mauritania. This adds another 18 percent to Africa’s total gas reserves.
The effect of unconventional gas on the power markets will depend on where the gas is discovered and the resulting cost of power. Shale gas in South Africa will potentially have the biggest effect on the markets. That’s because it has the potential to displace regional coal-fired power that would otherwise be built, assuming that the gas would have a cheaper levelized cost of energy than the coal. There would also be a significant decrease in carbon emissions.
46 Rystad Energy database, rystadenergy.com.
The story behind Grand IngaGrand Inga captures the imagination of power experts as much for its transformational capacity as for its incredible complexity. The planned 40-gigawatt, $80 billion hydro project on the Congo River in the Democratic Republic of the Congo (DRC) has a long history. In fact, the power of the mighty Congo was first tapped in 1972 with the 385-megawatt Inga 1, which was followed in 1982 by the 1,425-megawatt Inga 2. But utilization of those plants has fallen because of political instability, low demand, and poor maintenance.
However, overall growth in demand in sub-Saharan Africa has sparked renewed interest in hydro development along the Congo River. Meeting a large portion of Africa’s power needs with one project is a big reason. The fact that Grand Inga’s levelized cost of energy is less than half of the sub-Saharan African average is another. Bringing revenue and economic development to the DRC is a third.
Despite the opportunity, stakeholders must still resolve many challenges. The project would need not only construction of a dam but also new transmission facilities. Delivering the full Grand Inga scheme would require massive transmission lines across three to four countries each in Southern Africa and Western Africa. It would need cooperation among half a dozen countries and their national utilities, a level of governance complexity never before attempted in sub-Saharan Africa. Then there is the political complexity—for example, the DRC’s leadership has had difficult relations with Western governments and development agencies.
The greatest limitation has always been the need for a viable power buyer, or off-taker, to make the Inga project bankable. Potential options include BHP aluminum smelters in the DRC and the South African utility Eskom. In fact, in October 2014, South Africa and the DRC signed a treaty to jointly develop the project, with South Africa agreeing to buy about 2.5 gigawatts of capacity from Inga. That has led to renewed interest in the project or at least in its first phase, the 4.5-gigawatt Inga 3. While less spectacular than delivering 40 gigawatts of capacity all at once, it is more likely to succeed.
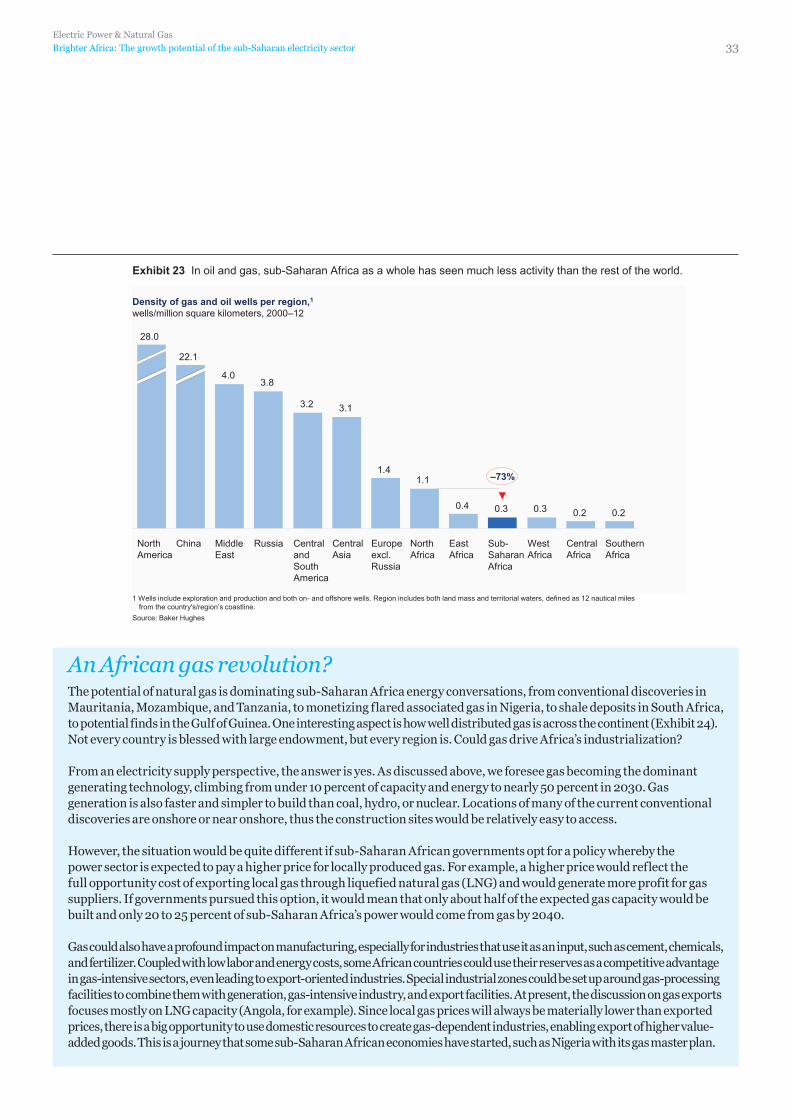
Electric Power & Natural Gas
Brighter Africa: The growth potential of the sub-Saharan electricity sector 33
Exhibit 23 In oil and gas, sub-Saharan Africa as a whole has seen much less activity than the rest of the world.
1 Wells include exploration and production and both on- and offshore wells. Region includes both land mass and territorial waters, defined as 12 nautical miles from the country's/region’s coastline.
Source: Baker Hughes
Density of gas and oil wells per region,1
wells/million square kilometers, 2000–12
–73%
0.2 0.2 0.3 0.3 0.4
1.1 1.4
3.1 3.2
3.8 4.0
22.1
28.0
North America
China Middle East
Russia Central and South America
Central Asia
Europe excl. Russia
North Africa
East Africa
Sub- Saharan Africa
West Africa
Central Africa
Southern Africa
An African gas revolution?The potential of natural gas is dominating sub-Saharan Africa energy conversations, from conventional discoveries in Mauritania, Mozambique, and Tanzania, to monetizing flared associated gas in Nigeria, to shale deposits in South Africa, to potential finds in the Gulf of Guinea. One interesting aspect is how well distributed gas is across the continent (Exhibit 24). Not every country is blessed with large endowment, but every region is. Could gas drive Africa’s industrialization?
From an electricity supply perspective, the answer is yes. As discussed above, we foresee gas becoming the dominant generating technology, climbing from under 10 percent of capacity and energy to nearly 50 percent in 2030. Gas generation is also faster and simpler to build than coal, hydro, or nuclear. Locations of many of the current conventional discoveries are onshore or near onshore, thus the construction sites would be relatively easy to access.
However, the situation would be quite different if sub-Saharan African governments opt for a policy whereby the power sector is expected to pay a higher price for locally produced gas. For example, a higher price would reflect the full opportunity cost of exporting local gas through liquefied natural gas (LNG) and would generate more profit for gas suppliers. If governments pursued this option, it would mean that only about half of the expected gas capacity would be built and only 20 to 25 percent of sub-Saharan Africa’s power would come from gas by 2040.
Gas could also have a profound impact on manufacturing, especially for industries that use it as an input, such as cement, chemicals, and fertilizer. Coupled with low labor and energy costs, some African countries could use their reserves as a competitive advantage in gas-intensive sectors, even leading to export-oriented industries. Special industrial zones could be set up around gas-processing facilities to combine them with generation, gas-intensive industry, and export facilities. At present, the discussion on gas exports focuses mostly on LNG capacity (Angola, for example). Since local gas prices will always be materially lower than exported prices, there is a big opportunity to use domestic resources to create gas-dependent industries, enabling export of higher value-added goods. This is a journey that some sub-Saharan African economies have started, such as Nigeria with its gas master plan.
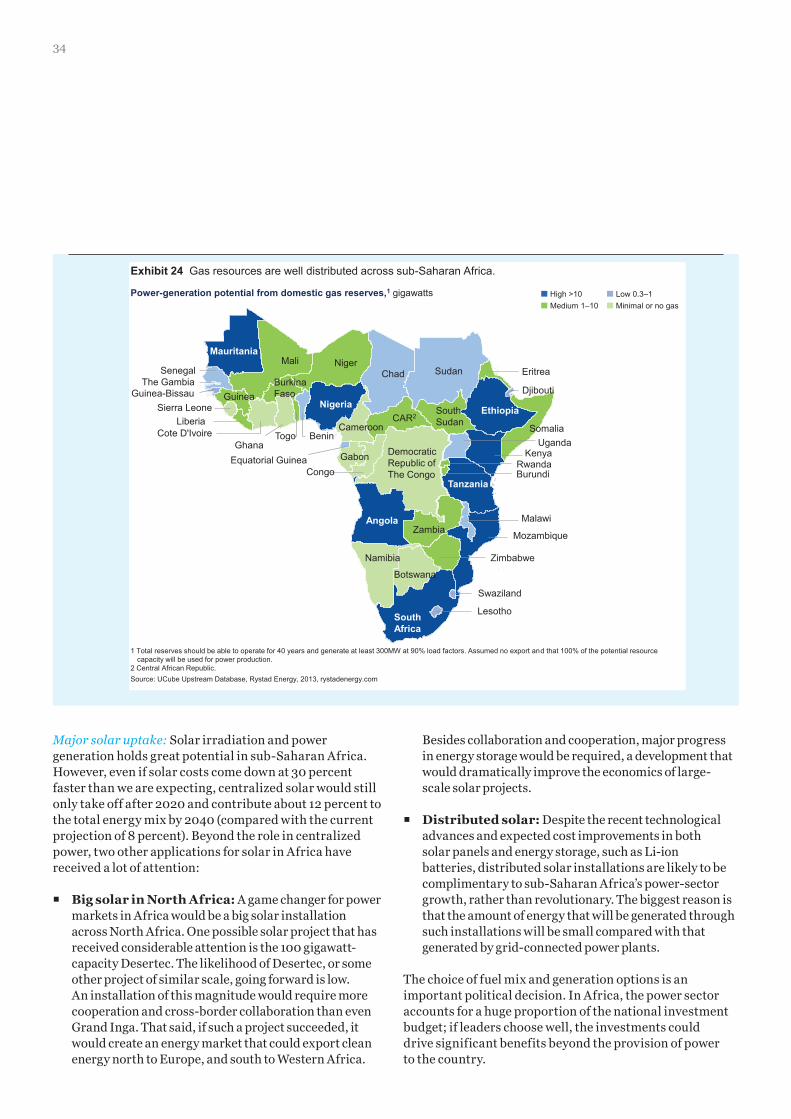
34
Major solar uptake: Solar irradiation and power generation holds great potential in sub-Saharan Africa. However, even if solar costs come down at 30 percent faster than we are expecting, centralized solar would still only take off after 2020 and contribute about 12 percent to the total energy mix by 2040 (compared with the current projection of 8 percent). Beyond the role in centralized power, two other applications for solar in Africa have received a lot of attention:
� Big solar in North Africa: A game changer for power markets in Africa would be a big solar installation across North Africa. One possible solar project that has received considerable attention is the 100 gigawatt-capacity Desertec. The likelihood of Desertec, or some other project of similar scale, going forward is low. An installation of this magnitude would require more cooperation and cross-border collaboration than even Grand Inga. That said, if such a project succeeded, it would create an energy market that could export clean energy north to Europe, and south to Western Africa.
Besides collaboration and cooperation, major progress in energy storage would be required, a development that would dramatically improve the economics of large-scale solar projects.
� Distributed solar: Despite the recent technological advances and expected cost improvements in both solar panels and energy storage, such as Li-ion batteries, distributed solar installations are likely to be complimentary to sub-Saharan Africa’s power-sector growth, rather than revolutionary. The biggest reason is that the amount of energy that will be generated through such installations will be small compared with that generated by grid-connected power plants.
The choice of fuel mix and generation options is an important political decision. In Africa, the power sector accounts for a huge proportion of the national investment budget; if leaders choose well, the investments could drive significant benefits beyond the provision of power to the country.
Exhibit 24 Gas resources are well distributed across sub-Saharan Africa.
1 Total reserves should be able to operate for 40 years and generate at least 300MW at 90% load factors. Assumed no export and that 100% of the potential resource capacity will be used for power production.
2 Central African Republic. Source: UCube Upstream Database, Rystad Energy, 2013, rystadenergy.com
High >10 Medium 1–10
Low 0.3–1 Minimal or no gas
Power-generation potential from domestic gas reserves,1 gigawatts
Guinea-Bissau
Senegal
Mauritania Mali
Burkina Faso
Ghana Cote D'Ivoire
Liberia
Guinea Sierra Leone
Equatorial Guinea
Cameroon CAR2
Nigeria
Togo Benin
Niger Chad Sudan Eritrea
Djibouti
Ethiopia
Uganda Somalia
Kenya
Tanzania Burundi Rwanda
Democratic Republic of The Congo Congo
Gabon
Angola
Botswana
Zimbabwe
Zambia Malawi
Mozambique
Lesotho South Africa
Swaziland
Namibia
The Gambia
South Sudan
Electric Power & Natural Gas
Brighter Africa: The growth potential of the sub-Saharan electricity sector 35
Two-and-a-half million new jobs in AfricaBuilding power-generation and distribution capacity can add significantly to employment. Construction and operation of power plants directly spur job creation, but there are also indirect employment effects: for example, industries supplying goods to the plants add jobs. Also, there is a large knock-on benefit as the economies of the relevant countries grow and jobs are created in industries that emerge as a result of stable electricity supply.
The power sector could create up to two and a half million direct new jobs in Africa. Based on the generation split in the national case, nearly 1.9 million jobs would be created in the construction of the power plants alone. This is by far the most labor-intensive segment of the sector compared with construction of transmission and distribution systems, which would also create construction jobs. By the nature of the work, the construction jobs are temporary, for the period that the power plant or transmission line is being constructed. However, skills are typically built during this period that can then be used in other construction projects, or adjacent industries after completion of the project.
A further 300,000 to 450,000 jobs would be created in the day-to-day operations and maintenance of the generation, transmission, and distribution assets. This range is appropriate for “efficient” operations in Africa. Eskom, which is one of the most efficient integrated utilities in sub-Saharan Africa, averages roughly one employee per installed megawatt, though this is roughly twice as high as for US power utilities. In other sub-Saharan African countries, such as Tanzania and Nigeria before utility privatization, utilities average five to ten employees per installed megawatt. As a result, there are many countries in Africa that will end up with significantly higher numbers as they employ personnel not fully needed. Privatizing Power Holding Company of Nigeria’s assets, for example, required retrenchment of a significant portion of the 50,000 strong workforce, covering the full value chain.
In addition, during both construction and operations, we expect to see a significant number and range of jobs emerge in supply industries. While larger, high-tech equipment, such as turbines, and major boiler components and other complex materials, will be imported, we would expect most sub-Saharan African countries to be able to supply basic construction components and materials, such as cement. Finally, the increased demand for primary energy would likely spark employment growth along other parts of the value chain, such as mining, oil and gas, and transport, including pipelines and rail.
Can Africa grow without a grid?As our research shows, nearly three-quarters of electricity demand will come from industrial and commercial users by 2040. With the exception of resource-extractive facilities, most users are clustered around major urban centers; this situation is unlikely to change given these users’ reliance on transport links and large amounts of labor. Similarly, the heaviest residential consumers of electricity in sub-Saharan Africa are urban, who consume four times as much power as rural residents. These types of users are the easiest and cheapest to connect to the grid and reap the cost benefits of generation at scale. While they use self-generation (primarily diesel) today, the long-term economics show that it would be much cheaper to deliver power to them through grid options. Although solar will play a significant role in the future, it is often still more expensive than fossil fuels or hydro sources, where these resources are available. Adding the cost of storage (for example, lithium ion or vanadium redox flow-cell batteries) to provide nighttime supply would make it more expensive. In fact, the cost of solar plus storage would have to drop by a further 30 percent on top of what is already assumed to be competitive with the average sub-Saharan African grid LCOEs. Governments could subsidize the cost difference to encourage adoption, as is done extensively in the European Union, but this is extremely unlikely given the limited resources of most sub-Saharan African countries.
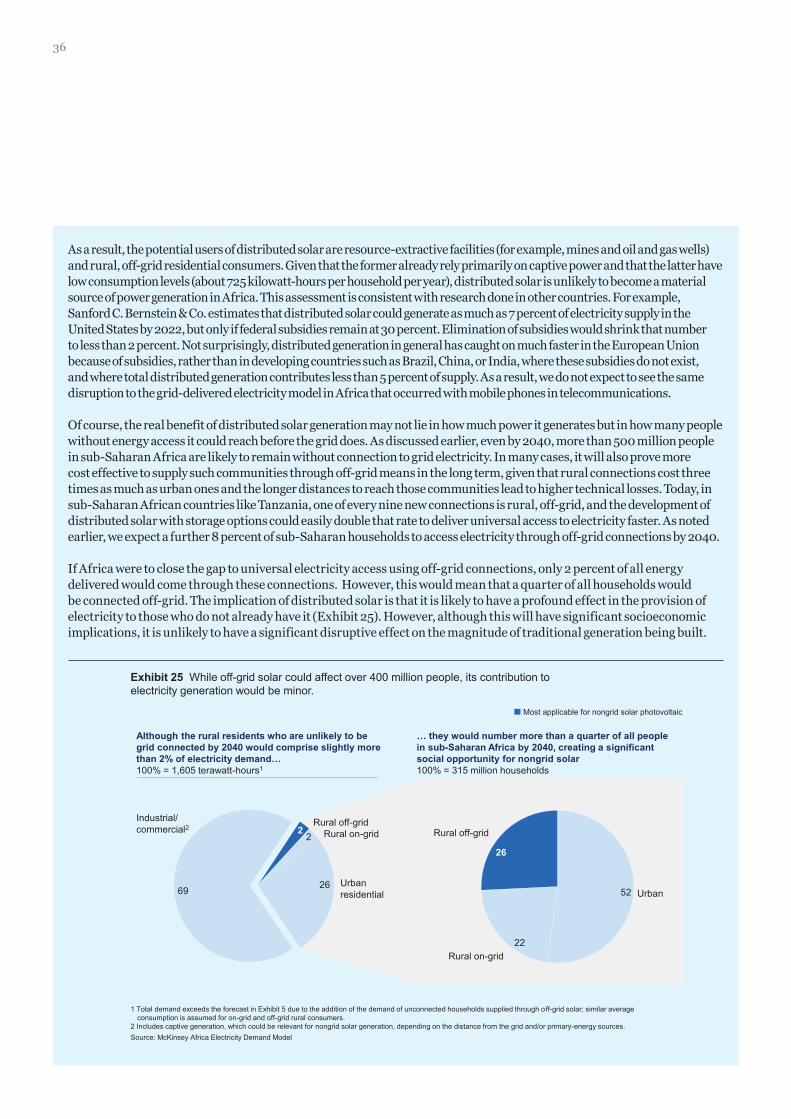
36
As a result, the potential users of distributed solar are resource-extractive facilities (for example, mines and oil and gas wells) and rural, off-grid residential consumers. Given that the former already rely primarily on captive power and that the latter have low consumption levels (about 725 kilowatt-hours per household per year), distributed solar is unlikely to become a material source of power generation in Africa. This assessment is consistent with research done in other countries. For example, Sanford C. Bernstein & Co. estimates that distributed solar could generate as much as 7 percent of electricity supply in the United States by 2022, but only if federal subsidies remain at 30 percent. Elimination of subsidies would shrink that number to less than 2 percent. Not surprisingly, distributed generation in general has caught on much faster in the European Union because of subsidies, rather than in developing countries such as Brazil, China, or India, where these subsidies do not exist, and where total distributed generation contributes less than 5 percent of supply. As a result, we do not expect to see the same disruption to the grid-delivered electricity model in Africa that occurred with mobile phones in telecommunications.
Of course, the real benefit of distributed solar generation may not lie in how much power it generates but in how many people without energy access it could reach before the grid does. As discussed earlier, even by 2040, more than 500 million people in sub-Saharan Africa are likely to remain without connection to grid electricity. In many cases, it will also prove more cost effective to supply such communities through off-grid means in the long term, given that rural connections cost three times as much as urban ones and the longer distances to reach those communities lead to higher technical losses. Today, in sub-Saharan African countries like Tanzania, one of every nine new connections is rural, off-grid, and the development of distributed solar with storage options could easily double that rate to deliver universal access to electricity faster. As noted earlier, we expect a further 8 percent of sub-Saharan households to access electricity through off-grid connections by 2040.
If Africa were to close the gap to universal electricity access using off-grid connections, only 2 percent of all energy delivered would come through these connections. However, this would mean that a quarter of all households would be connected off-grid. The implication of distributed solar is that it is likely to have a profound effect in the provision of electricity to those who do not already have it (Exhibit 25). However, although this will have significant socioeconomic implications, it is unlikely to have a significant disruptive effect on the magnitude of traditional generation being built.
… they would number more than a quarter of all people in sub-Saharan Africa by 2040, creating a significant social opportunity for nongrid solar 100% = 315 million households
Although the rural residents who are unlikely to be grid connected by 2040 would comprise slightly more than 2% of electricity demand… 100% = 1,605 terawatt-hours1
Exhibit 25 While off-grid solar could affect over 400 million people, its contribution to electricity generation would be minor.
1 Total demand exceeds the forecast in Exhibit 5 due to the addition of the demand of unconnected households supplied through off-grid solar; similar average consumption is assumed for on-grid and off-grid rural consumers.
2 Includes captive generation, which could be relevant for nongrid solar generation, depending on the distance from the grid and/or primary-energy sources. Source: McKinsey Africa Electricity Demand Model
Most applicable for nongrid solar photovoltaic
Industrial/ commercial2
Rural on-grid Rural off-grid
Urban residential
Rural off-grid
Rural on-grid
Urban
26
22
52
2
69 26
2
37
It is up to Africa to fulfill its potential. International players can intervene, convene, or otherwise try to lead the sector forward, but it is the responsibility of Africa’s governments to enable the development of the power industry. Power sectors that have advanced over the past few decades have pursued three important elements that we will explore in this section:
� Ensuring the financial viability of the power sector
� Creating an environment that will attract a broad range of funding sources, with particular focus on the private sector
� Demonstrating political will
Success in this sector will require accomplishing all three aims. There are cases where countries have moved ahead in the power sector without creating a financially viable sector, or by using purely state funds, but they are rare and generally result in less efficient execution. When a partial solution is adopted, a country will generally reach a point where the national budget cannot sustain the subsidies required to keep the sector afloat.
Ensuring financial viabilityMost important, the economics of the sector must work. Investors must be assured that there is sufficient money flowing into the sector to cover the costs plus appropriate returns across the full value chain. Financial flows and costs must be transparent.
This is the single biggest challenge, as many sub-Saharan African countries are faced with a loss-making power sector that needs to grow at unprecedented rates. A combination of tariff subsidies, high losses, and very poor collections means that this cost is borne by government and the few paying end users. In most cases, this drain, together with the required capital spending in the power sector, is an unbearable financial burden for government budgets.
Cost-reflective tariff: The central principle that we adopt is that the cost of not having electricity is much greater than the cost associated with putting the right mechanisms in place. The clearest example of this principle is the issue of cost-reflective tariffs. Governments often resist imposing them because they are concerned about angering citizens. We see, however, that the general population and industrial consumers would be willing to pay significantly higher grid-based prices if that allows them access to power that they otherwise wouldn’t have, or to avoid paying even higher amounts for power from diesel generators.47
Given this starting point, the first factor to ensure the financial viability of the sector is to impose a cost-reflective tariff. For investors to enter the market, or even for the government to come up with a long-term plan to build the sector, the final price that all end users pay needs to cover the sector’s costs. This does not mean that every user need pay a cost-reflective price. In fact, it may make sense to differentiate prices based on the size of the consumer and the time of day the electricity is consumed. The key is that the end revenue reflects the full costs to the sector. These include all capital, operating, and fuel costs, as well as an appropriate return on capital. Governments can make a decision to fund all of the capital themselves and ask for no return on that capital, but this is not sustainable, nor is it the optimal use of national resources.
Cost transparency: For private investors to participate in the sector, cost-reflective tariffs provide a good start. But without an understanding of where the embedded subsidies are, and without a clear understanding of how costs are split across the value chain, it becomes more difficult for the investors to monitor changes in the cost base, and how this affects their investments. There are many examples of cross-subsidization in the electricity sector, where poorer consumers have some sort of life-line tariff (for example, the Free Basic Electricity arrangement in South Africa). The total energy consumed by these arrangements is typically small; the higher-end consumers recognize (and are generally comfortable with the fact) that they are financing these life-line tariffs. Their main request, however, is transparency about the existence of cross-subsidization arrangements.
Make the most of what you already have: The biggest and easiest way to improve the financial viability of the sector is to ensure that you are getting the most out of it. Once the assets are built, the more electricity that can be delivered to the consumer, from the same set of assets, the more revenue can be collected to finance the sector.
To illustrate, let us compare two power systems: one that functions relatively well, with base-load plants running at an 85 percent load factor, 10 percent transmission and distribution losses, and a 99 percent collection rate, and one that functions similarly to an average African power system, with base loads running at a 65 percent load factor, 25 percent transmission and distribution losses, and a 90 percent collection rate. Both of the systems described above would bear the same cost. The total revenue collection for the well-functioning system is 72 percent higher than the poorly functioning system; put another way, prices in the poorly functioning system should be 72 percent
Pursuing a new approach to achieving Africa’s energy potential
47 Musiliu O. Oseni, “Power outages and the costs of unsupplied electricity: Evidence from backup generation among firms in Africa,” Cambridge Working Papers in Economics, Judge Business School, University of Cambridge, December 2013, cam.ac.uk; Paying the Price for Unreliable Power Supplies: In-house Generation of Electricity by Firms in Africa, World Bank Group, 2008, worldbank.org; Cost of Infrastructure Deficiencies in Manufacturing in Indonesia, Nigeria, and Thailand, World Bank Group, 1996, worldbank.org.
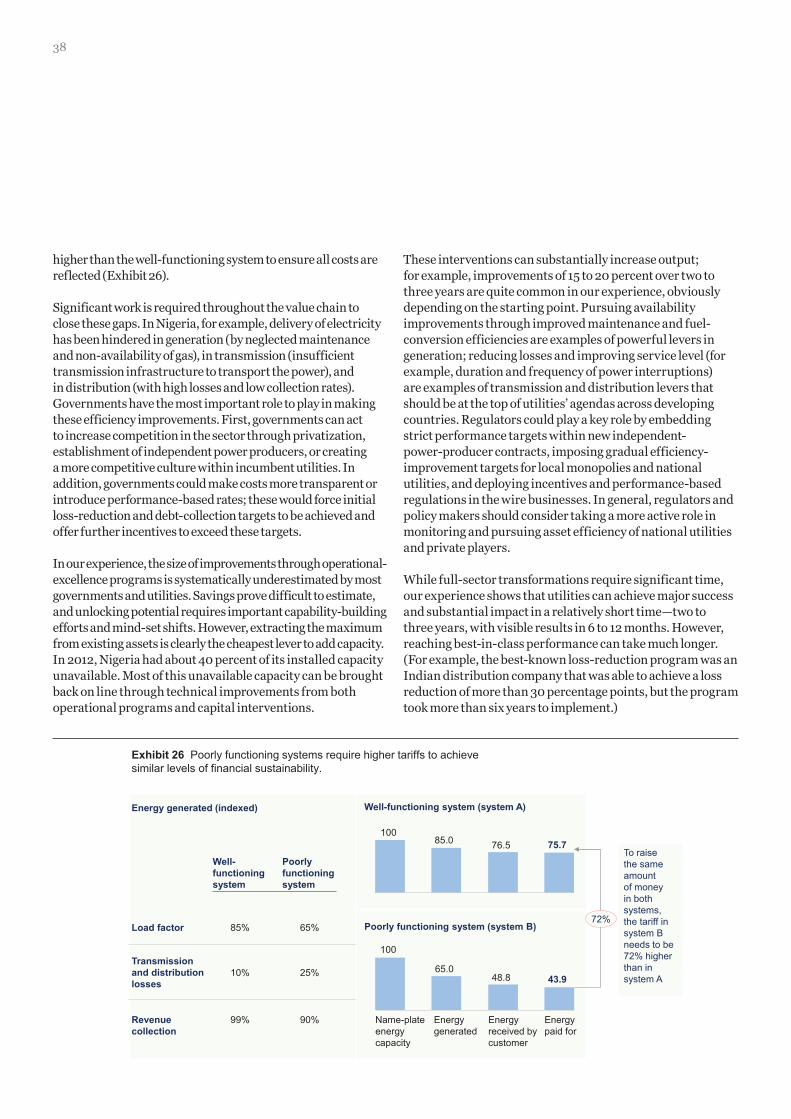
38
higher than the well-functioning system to ensure all costs are reflected (Exhibit 26).
Significant work is required throughout the value chain to close these gaps. In Nigeria, for example, delivery of electricity has been hindered in generation (by neglected maintenance and non-availability of gas), in transmission (insufficient transmission infrastructure to transport the power), and in distribution (with high losses and low collection rates). Governments have the most important role to play in making these efficiency improvements. First, governments can act to increase competition in the sector through privatization, establishment of independent power producers, or creating a more competitive culture within incumbent utilities. In addition, governments could make costs more transparent or introduce performance-based rates; these would force initial loss-reduction and debt-collection targets to be achieved and offer further incentives to exceed these targets.
In our experience, the size of improvements through operational-excellence programs is systematically underestimated by most governments and utilities. Savings prove difficult to estimate, and unlocking potential requires important capability-building efforts and mind-set shifts. However, extracting the maximum from existing assets is clearly the cheapest lever to add capacity. In 2012, Nigeria had about 40 percent of its installed capacity unavailable. Most of this unavailable capacity can be brought back on line through technical improvements from both operational programs and capital interventions.
These interventions can substantially increase output; for example, improvements of 15 to 20 percent over two to three years are quite common in our experience, obviously depending on the starting point. Pursuing availability improvements through improved maintenance and fuel-conversion efficiencies are examples of powerful levers in generation; reducing losses and improving service level (for example, duration and frequency of power interruptions) are examples of transmission and distribution levers that should be at the top of utilities’ agendas across developing countries. Regulators could play a key role by embedding strict performance targets within new independent-power-producer contracts, imposing gradual efficiency-improvement targets for local monopolies and national utilities, and deploying incentives and performance-based regulations in the wire businesses. In general, regulators and policy makers should consider taking a more active role in monitoring and pursuing asset efficiency of national utilities and private players.
While full-sector transformations require significant time, our experience shows that utilities can achieve major success and substantial impact in a relatively short time—two to three years, with visible results in 6 to 12 months. However, reaching best-in-class performance can take much longer. (For example, the best-known loss-reduction program was an Indian distribution company that was able to achieve a loss reduction of more than 30 percentage points, but the program took more than six years to implement.)
Exhibit 26 Poorly functioning systems require higher tariffs to achieve similar levels of financial sustainability.
Well-functioning system (system A)
Poorly functioning system (system B)
Well- functioning system
Poorly functioning system
Load factor 85% 65%
Transmission and distribution losses
10% 25%
Revenue collection
99% 90%
Energy generated (indexed)
75.7 76.5 85.0 100
43.9 48.8 65.0
Energy paid for
Energy received by customer
Energy generated
Name-plate energy capacity
100
To raise the same amount of money in both systems, the tariff in system B needs to be 72% higher than in system A
72%
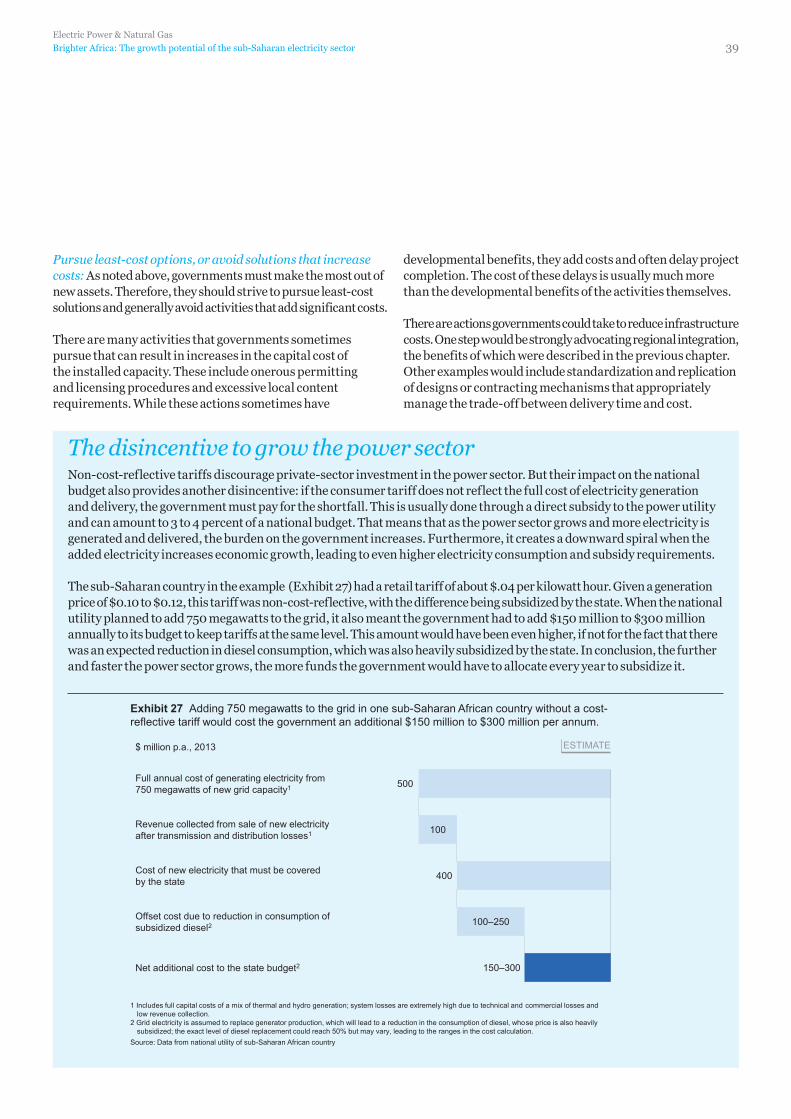
Electric Power & Natural Gas
Brighter Africa: The growth potential of the sub-Saharan electricity sector 39
Pursue least-cost options, or avoid solutions that increase costs: As noted above, governments must make the most out of new assets. Therefore, they should strive to pursue least-cost solutions and generally avoid activities that add significant costs.
There are many activities that governments sometimes pursue that can result in increases in the capital cost of the installed capacity. These include onerous permitting and licensing procedures and excessive local content requirements. While these actions sometimes have
developmental benefits, they add costs and often delay project completion. The cost of these delays is usually much more than the developmental benefits of the activities themselves.
There are actions governments could take to reduce infrastructure costs. One step would be strongly advocating regional integration, the benefits of which were described in the previous chapter. Other examples would include standardization and replication of designs or contracting mechanisms that appropriately manage the trade-off between delivery time and cost.
The disincentive to grow the power sectorNon-cost-reflective tariffs discourage private-sector investment in the power sector. But their impact on the national budget also provides another disincentive: if the consumer tariff does not reflect the full cost of electricity generation and delivery, the government must pay for the shortfall. This is usually done through a direct subsidy to the power utility and can amount to 3 to 4 percent of a national budget. That means that as the power sector grows and more electricity is generated and delivered, the burden on the government increases. Furthermore, it creates a downward spiral when the added electricity increases economic growth, leading to even higher electricity consumption and subsidy requirements.
The sub-Saharan country in the example (Exhibit 27) had a retail tariff of about $.04 per kilowatt hour. Given a generation price of $0.10 to $0.12, this tariff was non-cost-reflective, with the difference being subsidized by the state. When the national utility planned to add 750 megawatts to the grid, it also meant the government had to add $150 million to $300 million annually to its budget to keep tariffs at the same level. This amount would have been even higher, if not for the fact that there was an expected reduction in diesel consumption, which was also heavily subsidized by the state. In conclusion, the further and faster the power sector grows, the more funds the government would have to allocate every year to subsidize it.
ESTIMATE
Exhibit 27 Adding 750 megawatts to the grid in one sub-Saharan African country without a cost- reflective tariff would cost the government an additional $150 million to $300 million per annum.
$ million p.a., 2013
Offset cost due to reduction in consumption of subsidized diesel2 100–250
Full annual cost of generating electricity from 750 megawatts of new grid capacity1 500
Revenue collected from sale of new electricity after transmission and distribution losses1 100
Net additional cost to the state budget2 150–300
400 Cost of new electricity that must be covered by the state
1 Includes full capital costs of a mix of thermal and hydro generation; system losses are extremely high due to technical and commercial losses and low revenue collection.
2 Grid electricity is assumed to replace generator production, which will lead to a reduction in the consumption of diesel, whose price is also heavily subsidized; the exact level of diesel replacement could reach 50% but may vary, leading to the ranges in the cost calculation.
Source: Data from national utility of sub-Saharan African country
40
Creating an attractive environment for different sources of fundingOver the past 25 years, many countries around the world have added significant capacity to their grids. In all but a small number of cases, the sector has grown and developed using private-sector financing.48 In general, four models have been employed:
� Public–private partnerships: Public–private partnerships (PPPs) are used in power-sector deals where a government wants to retain some ownership in the country’s electricity assets. In Abu Dhabi, for example, new projects were structured such that no private-sector entity could hold more than 40 percent in a power plant. For the private sector, the advantage of this arrangement is that the government bears some of the risk; the disadvantage is the reliance on government to supply its share of capital, often a time-consuming process. Several PPPs are under consideration or are being pursued in sub-Saharan Africa—for example, the Kinyerezi III and IV gas-fed power plants in Tanzania.
� Incumbent corporatization: Incumbent corporatization is an approach aimed at raising private-sector funds using existing assets as equity. There are several examples of how this could work, including simple infrastructure bonds, and asset sales on equity markets, or through auctions to private-sector players. Kenya’s initial public offering of KenGen resulted in floating 30 percent of the utility on the equity markets, while Nigeria went through partial privatization of its generation and distribution assets. In many cases, privatization is pursued more to bring in private-sector management than to raise capital.
� Independent power producers: Independent power producers (IPPs) are plants constructed entirely by the private sector, and the energy they generate is sold to the market through a power-purchase agreement. The agreement is generally structured so that there is a combination of capacity payments (typically covering capital costs, return on investment, and a broad range of risks) and energy payments (covering the plant’s marginal operating costs). There are more and more examples of IPPs on the continent, including the Renewable Energy Independent Power Producer Programme in South Africa
and the Azura-Edo Power West Africa power plant under construction in Nigeria.
� Market liberalization: This model is effectively the one adopted in Western Europe and the United States, where market signals and wholesale prices provide sufficient incentive for the private sector to build. None of the sub-Saharan African markets are in a condition to embark on full market liberalization since this cannot work in a supply-constrained situation.
In sub-Saharan Africa, several countries have pursued a combination of these approaches. Kenya, for example, has IPPs in place, such as OrPower 4, a subsidiary of Ormat Technologies. In addition, both KenGen and Kenya Power have been floated on the stock exchange. Finally, the Kenyan government’s new construction program is structured around a series of public–private partnerships.
Over the past 20 years, private capacity in sub-Saharan Africa has doubled every five years, with 50 percent of total IPP capacity added to the grid since 2009 alone (Exhibit 28). While this is a positive story, the scale—about 6,300 megawatts of private capacity has been added since 1992—is insignificant compared with the total new capacity needed.
No matter which approach is pursued, there are some rules of thumb to attract the private sector:
� Provide clear, consistent, and transparent regulations: Nothing makes the private sector more nervous than uncertainty, which is why long-term transparency, a track record of following through on commitments, and sticking to policy decisions are so critical. Regularly changing regulations that are difficult to understand in the first place result in process delays and will likely prevent long-term investment. Nigeria’s privatization program was well received because the government, through the Bureau of Public Enterprises (BPE), spent time and effort clarifying how the off-take agreements would work, how the tariff was structured, and what would be the overall mechanisms for privatization. The BPE and the Ministry of Power went so far as to publish a detailed Excel file with the tariff structure and calculations online so that potential investors could see exactly what they were dealing with.
48 The only countries that have been able to build significant amounts of generation capacity with no involvement from the private sector are Iran, Saudi Arabia, and South Africa—although the latter two now have programs to attract private capacity.
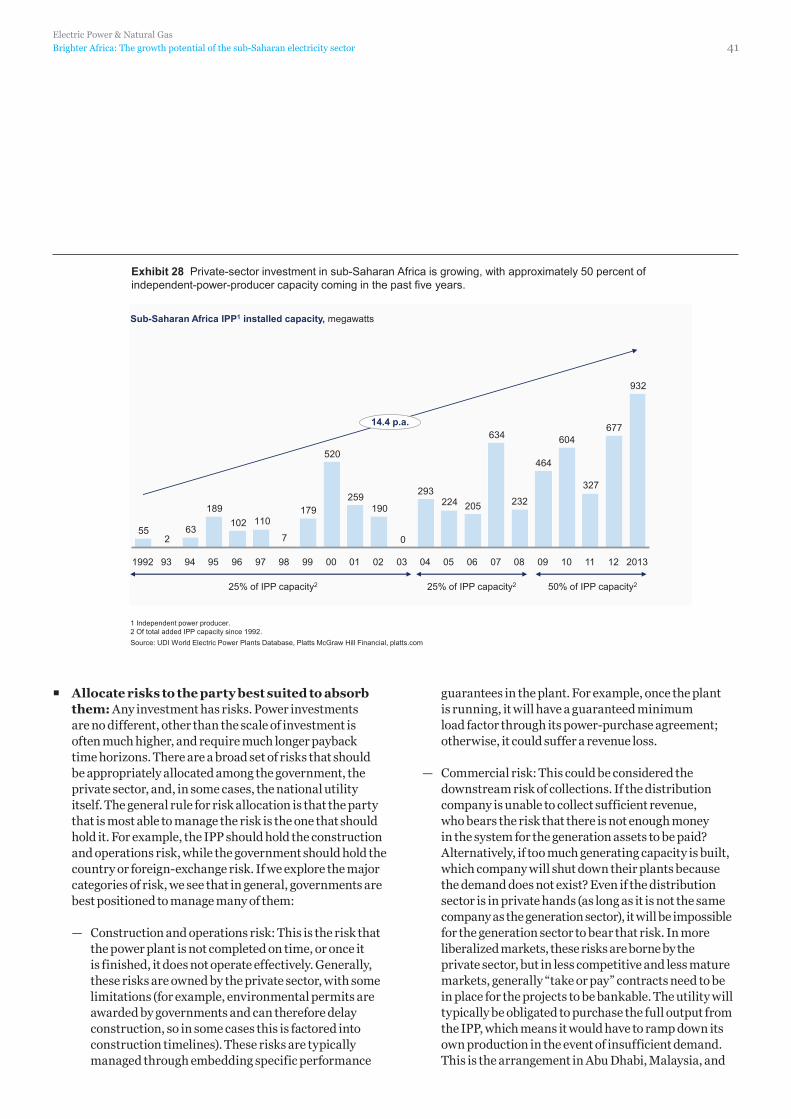
Electric Power & Natural Gas
Brighter Africa: The growth potential of the sub-Saharan electricity sector 41
� Allocate risks to the party best suited to absorb them: Any investment has risks. Power investments are no different, other than the scale of investment is often much higher, and require much longer payback time horizons. There are a broad set of risks that should be appropriately allocated among the government, the private sector, and, in some cases, the national utility itself. The general rule for risk allocation is that the party that is most able to manage the risk is the one that should hold it. For example, the IPP should hold the construction and operations risk, while the government should hold the country or foreign-exchange risk. If we explore the major categories of risk, we see that in general, governments are best positioned to manage many of them:
— Construction and operations risk: This is the risk that the power plant is not completed on time, or once it is finished, it does not operate effectively. Generally, these risks are owned by the private sector, with some limitations (for example, environmental permits are awarded by governments and can therefore delay construction, so in some cases this is factored into construction timelines). These risks are typically managed through embedding specific performance
guarantees in the plant. For example, once the plant is running, it will have a guaranteed minimum load factor through its power-purchase agreement; otherwise, it could suffer a revenue loss.
— Commercial risk: This could be considered the downstream risk of collections. If the distribution company is unable to collect sufficient revenue, who bears the risk that there is not enough money in the system for the generation assets to be paid? Alternatively, if too much generating capacity is built, which company will shut down their plants because the demand does not exist? Even if the distribution sector is in private hands (as long as it is not the same company as the generation sector), it will be impossible for the generation sector to bear that risk. In more liberalized markets, these risks are borne by the private sector, but in less competitive and less mature markets, generally “take or pay” contracts need to be in place for the projects to be bankable. The utility will typically be obligated to purchase the full output from the IPP, which means it would have to ramp down its own production in the event of insufficient demand. This is the arrangement in Abu Dhabi, Malaysia, and
Exhibit 28 Private-sector investment in sub-Saharan Africa is growing, with approximately 50 percent of independent-power-producer capacity coming in the past five years.
932
677
327
604
464
232
634
205224293
0
190259
520
179
7
110102189
632
55
2013
14.4 p.a.
12 11 10 09 08 07 06 05 04 03 02 01 00 99 98 97 96 95 94 93 1992
25% of IPP capacity2 25% of IPP capacity2 50% of IPP capacity2
1 Independent power producer. 2 Of total added IPP capacity since 1992. Source: UDI World Electric Power Plants Database, Platts McGraw Hill Financial, platts.com
Sub-Saharan Africa IPP1 installed capacity, megawatts
42
Thailand. Alternative methods include a fixed “capacity charge,” which is paid to the IPP regardless of how much power it ends up producing (this can also mitigate some of the other risks discussed below).
— Fuel risk: In situations where government has a controlling stake in the fuel sector (as in the case of Nigeria, with gas supply), it should own the fuel risk, including both the fuel supply and fuel price risks. In the past, there have been situations where governments have asked companies to guarantee supply of electricity, but the governments have been unwilling to guarantee supply or the price of the fuel. Such a deal would not be bankable.
— Foreign exchange risk: The debt for IPPs is often dollar- or euro-denominated. For banks to be comfortable, it would be necessary to assure them that they will be paid in the same currency. Countries are sometimes able to circumvent this risk by getting local financing institutions involved. However, in Africa, there are few countries that have sufficient local financing to be able to invest in power plants. Multilateral lenders, such as the International Finance Corporation, are introducing local currency financing options, though these may come at a cost premium and are still to be proven. As such, governments typically need to provide a guarantee that the private sector can repatriate funds.
— Country risk: This is the risk that the plants will be nationalized after their construction. In riskier countries, this risk is owned by the government, accompanied by explicit termination payment guarantees or buyout clauses embedded in contracts. For less risky countries, where the likelihood of nationalization is negligible, the private sector generally bears (and mostly ignores) these risks.
For the private sector, these risks (and others not mentioned above) ultimately will fall into two categories: risks that can be priced into the contract but will demand higher required returns, and risks that will make the project unbankable. In situations where governments have been effective at mitigating and managing risks, they are able to obtain projects with lower returns, because the private sector just needs to earn its capital and debt requirements. Where the private sector is expected to own much of the risk, it will need to price this into contracts, and the resulting costs will make the projects that much more expensive.
� Provide a credible off-taker: To whom will I be selling my electricity, and do they have the balance sheet to buy it? These are straightforward questions that are often difficult to answer. In Nigeria’s privatization, it was necessary to set up a new entity—the Nigerian Bulk Electricity Trader (NBET)—to buy the electricity from the generation companies. More important were the guarantees that the government provided to ensure that NBET was sufficiently capitalized. South Africa’s IPP program faced slightly different concerns, but still focused on the credibility of the off-taker. In that situation, the system operator is embedded in the utility Eskom, with the IPP procurement costs passed to the end user as part of the regulated tariff.
� Seek support from external institutions to help guarantee the risks: It is sometimes difficult for governments to accept that the private sector may not see them as credible counterparties. Seeking support from multilateral institutions seems to suggest that the private sector does not trust their word or their contracts. Experience suggests that the private sector’s concerns are well founded. One important mechanism for governments to strengthen their position and increase their credibility is to obtain a partial risk guarantee from multilateral institutions such as the African Development Bank or the Multilateral Investment Guarantee Agency, and, in some cases, through private-sector institutions. These guarantees are rarely called, but their existence gives the private sector more confidence to proceed.
Demonstrating political willThe last critical success criterion is government commitment to making reform and change happen. A demonstration of commitment offers the private-sector assurance that the government will not default on the project and helps build excitement to pursue it. Three factors must come together for a country to demonstrate the political will to undertake power-related projects. In addition, a government’s efforts can be enhanced by the creation of “delivery units,” small groups of dedicated individuals focused exclusively on achieving impact and improving outcomes:
� Prioritize efforts: A common challenge in the power sector is trying to do too much at once. Many countries face skill shortages and developing local project-delivery capacity is time consuming. A faster route is to focus that limited capacity on selected projects and complete them more quickly. The Tanzanian government undertook a prioritization process in its Big Results Now program, which focused efforts on a smaller number of generation projects (from more than 20 to 7).
Electric Power & Natural Gas
Brighter Africa: The growth potential of the sub-Saharan electricity sector 43
� Do not lose sight of the long term: The power sector is a critical tool in politics. Ensuring power is delivered can help win elections. This may invite counterproductive behavior, where short-term decisions are made that can cost the country in the longer term. One example is the use of emergency power producers (EPPs). While there are situations when EPPs are the least-damaging option in a power crisis, they are usually not long-term solutions. These plants run on diesel and generate electricity at double or triple the price of grid power. In some countries, for example, the fuel and capacity cost of running a 100-megawatt diesel plant for one year costs more than building a gas power plant of the same size. The difference is that EPPs can be constructed quickly, even in a couple of months, delivering immediate power supply to the voting public, but at the same time committing the country to higher-cost power, draining cash in the short term, and delaying long-term sector development.
� Focus not just on plants and infrastructure, but also on capabilities and regulations: Long-term success requires paying attention not only to the hard infrastructure (power plants and transmission networks) but also to the softer side of execution. This includes building skills and capabilities in the sector as well as an
appropriate and stable regulatory environment. When Kenya announced its PPP program, it also committed to training public-sector leaders on how to run a PPP. Countries such as Nigeria and South Africa that are now attracting power-sector investments have gone through years of rigorous regulatory development and continue to refine their frameworks to appropriately balance the requirements of investors, power-sector operators, government stakeholders, and electricity end users.
The countries of sub-Saharan Africa desperately want economic growth, and many people are frustrated by the lack of power. As we have noted, there is enough support, international attention, and focus to start making progress. Sub-Saharan Africa has vast electricity capacity. To tap those resources, national governments can focus on three areas: ensuring the financial viability of the power sector, creating an environment that will attract a broad range of funding mechanisms, and demonstrating real political will. These steps will encourage private and multilateral investors to look more seriously at the region’s power opportunity. Now is the time for action, and the governments of sub-Saharan Africa have a big role to play.
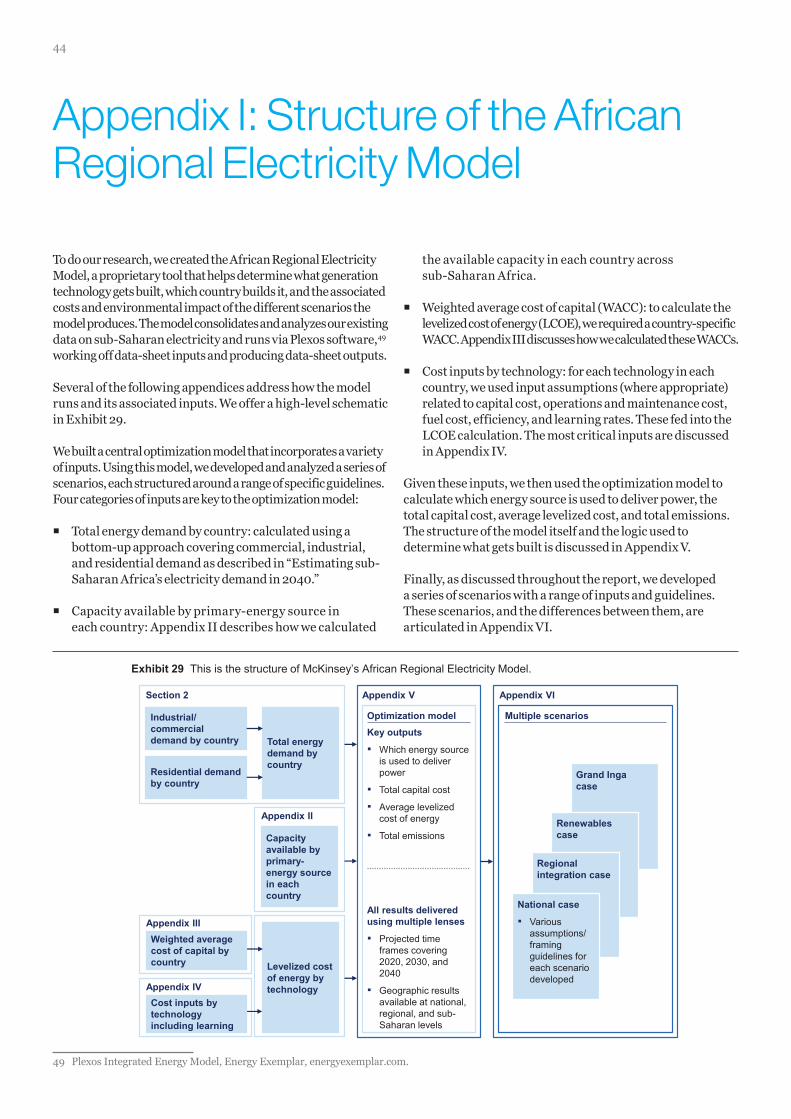
44
To do our research, we created the African Regional Electricity Model, a proprietary tool that helps determine what generation technology gets built, which country builds it, and the associated costs and environmental impact of the different scenarios the model produces. The model consolidates and analyzes our existing data on sub-Saharan electricity and runs via Plexos software,49 working off data-sheet inputs and producing data-sheet outputs.
Several of the following appendices address how the model runs and its associated inputs. We offer a high-level schematic in Exhibit 29.
We built a central optimization model that incorporates a variety of inputs. Using this model, we developed and analyzed a series of scenarios, each structured around a range of specific guidelines. Four categories of inputs are key to the optimization model:
� Total energy demand by country: calculated using a bottom-up approach covering commercial, industrial, and residential demand as described in “Estimating sub-Saharan Africa’s electricity demand in 2040.”
� Capacity available by primary-energy source in each country: Appendix II describes how we calculated
the available capacity in each country across sub-Saharan Africa.
� Weighted average cost of capital (WACC): to calculate the levelized cost of energy (LCOE), we required a country-specific WACC. Appendix III discusses how we calculated these WACCs.
� Cost inputs by technology: for each technology in each country, we used input assumptions (where appropriate) related to capital cost, operations and maintenance cost, fuel cost, efficiency, and learning rates. These fed into the LCOE calculation. The most critical inputs are discussed in Appendix IV.
Given these inputs, we then used the optimization model to calculate which energy source is used to deliver power, the total capital cost, average levelized cost, and total emissions. The structure of the model itself and the logic used to determine what gets built is discussed in Appendix V.
Finally, as discussed throughout the report, we developed a series of scenarios with a range of inputs and guidelines. These scenarios, and the differences between them, are articulated in Appendix VI.
Appendix I: Structure of the African Regional Electricity Model
Exhibit 29 This is the structure of McKinsey’s African Regional Electricity Model.
Section 2
Industrial/ commercial demand by country
Residential demand by country
Total energy demand by country
Capacity available by primary- energy source in each country
Appendix II
Levelized cost of energy by technology
Cost inputs by technology including learning
Appendix IV
Appendix V
Optimization model
Appendix VI
Multiple scenarios
Grand Inga case
Renewables case
Regional integration case
National case
▪ Various assumptions/ framing guidelines for each scenario developed
Weighted average cost of capital by country
Appendix III
Key outputs
▪ Which energy source is used to deliver power
▪ Total capital cost
▪ Average levelized cost of energy
▪ Total emissions
All results delivered using multiple lenses
▪ Projected time frames covering 2020, 2030, and 2040
▪ Geographic results available at national, regional, and sub-Saharan levels
49 Plexos Integrated Energy Model, Energy Exemplar, energyexemplar.com.
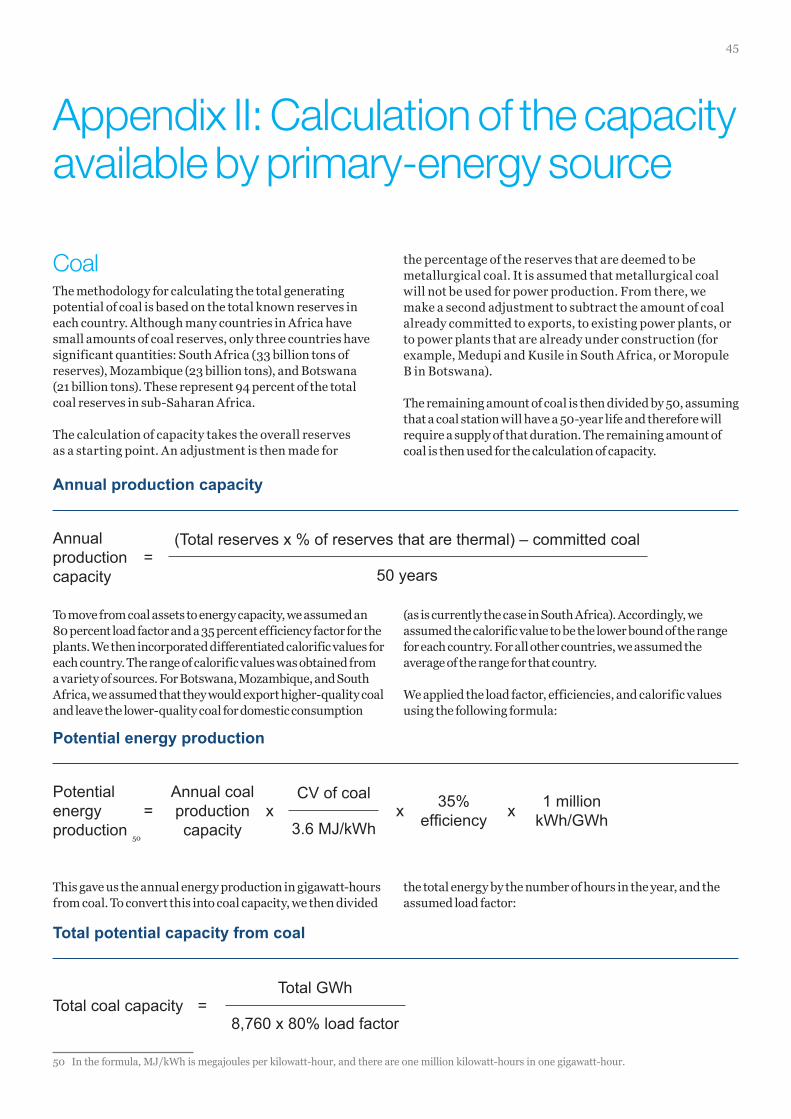
45
CoalThe methodology for calculating the total generating potential of coal is based on the total known reserves in each country. Although many countries in Africa have small amounts of coal reserves, only three countries have significant quantities: South Africa (33 billion tons of reserves), Mozambique (23 billion tons), and Botswana (21 billion tons). These represent 94 percent of the total coal reserves in sub-Saharan Africa.
The calculation of capacity takes the overall reserves as a starting point. An adjustment is then made for
the percentage of the reserves that are deemed to be metallurgical coal. It is assumed that metallurgical coal will not be used for power production. From there, we make a second adjustment to subtract the amount of coal already committed to exports, to existing power plants, or to power plants that are already under construction (for example, Medupi and Kusile in South Africa, or Moropule B in Botswana).
The remaining amount of coal is then divided by 50, assuming that a coal station will have a 50-year life and therefore will require a supply of that duration. The remaining amount of coal is then used for the calculation of capacity.
To move from coal assets to energy capacity, we assumed an 80 percent load factor and a 35 percent efficiency factor for the plants. We then incorporated differentiated calorific values for each country. The range of calorific values was obtained from a variety of sources. For Botswana, Mozambique, and South Africa, we assumed that they would export higher-quality coal and leave the lower-quality coal for domestic consumption
(as is currently the case in South Africa). Accordingly, we assumed the calorific value to be the lower bound of the range for each country. For all other countries, we assumed the average of the range for that country.
We applied the load factor, efficiencies, and calorific values using the following formula:
This gave us the annual energy production in gigawatt-hours from coal. To convert this into coal capacity, we then divided
the total energy by the number of hours in the year, and the assumed load factor:
Appendix II: Calculation of the capacity available by primary-energy source
50 In the formula, MJ/kWh is megajoules per kilowatt-hour, and there are one million kilowatt-hours in one gigawatt-hour.
Annual production capacity
Annual production capacity
(Total reserves x % of reserves that are thermal) – committed coal
50 years=
Total potential capacity from coal
Total coal capacityTotal GWh
8,760 x 80% load factor=
50
Potential energy production
Potential energy production
Annual coal production capacity
35% efficiency
1 million kWh/GWh= x xx
CV of coal
3.6 MJ/kWh
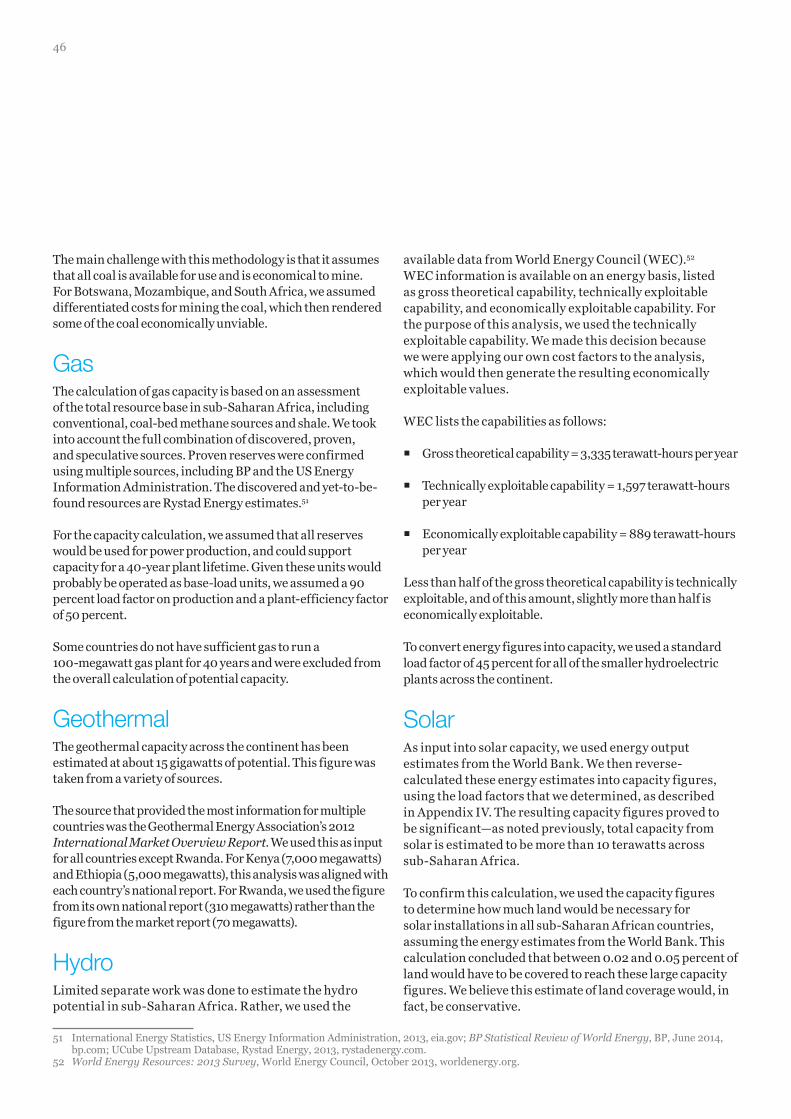
46
The main challenge with this methodology is that it assumes that all coal is available for use and is economical to mine. For Botswana, Mozambique, and South Africa, we assumed differentiated costs for mining the coal, which then rendered some of the coal economically unviable.
GasThe calculation of gas capacity is based on an assessment of the total resource base in sub-Saharan Africa, including conventional, coal-bed methane sources and shale. We took into account the full combination of discovered, proven, and speculative sources. Proven reserves were confirmed using multiple sources, including BP and the US Energy Information Administration. The discovered and yet-to-be-found resources are Rystad Energy estimates.51
For the capacity calculation, we assumed that all reserves would be used for power production, and could support capacity for a 40-year plant lifetime. Given these units would probably be operated as base-load units, we assumed a 90 percent load factor on production and a plant-efficiency factor of 50 percent.
Some countries do not have sufficient gas to run a 100-megawatt gas plant for 40 years and were excluded from the overall calculation of potential capacity.
GeothermalThe geothermal capacity across the continent has been estimated at about 15 gigawatts of potential. This figure was taken from a variety of sources.
The source that provided the most information for multiple countries was the Geothermal Energy Association’s 2012 International Market Overview Report. We used this as input for all countries except Rwanda. For Kenya (7,000 megawatts) and Ethiopia (5,000 megawatts), this analysis was aligned with each country’s national report. For Rwanda, we used the figure from its own national report (310 megawatts) rather than the figure from the market report (70 megawatts).
HydroLimited separate work was done to estimate the hydro potential in sub-Saharan Africa. Rather, we used the
available data from World Energy Council (WEC).52 WEC information is available on an energy basis, listed as gross theoretical capability, technically exploitable capability, and economically exploitable capability. For the purpose of this analysis, we used the technically exploitable capability. We made this decision because we were applying our own cost factors to the analysis, which would then generate the resulting economically exploitable values.
WEC lists the capabilities as follows:
� Gross theoretical capability = 3,335 terawatt-hours per year
� Technically exploitable capability = 1,597 terawatt-hours per year
� Economically exploitable capability = 889 terawatt-hours per year
Less than half of the gross theoretical capability is technically exploitable, and of this amount, slightly more than half is economically exploitable.
To convert energy figures into capacity, we used a standard load factor of 45 percent for all of the smaller hydroelectric plants across the continent.
SolarAs input into solar capacity, we used energy output estimates from the World Bank. We then reverse-calculated these energy estimates into capacity figures, using the load factors that we determined, as described in Appendix IV. The resulting capacity figures proved to be significant—as noted previously, total capacity from solar is estimated to be more than 10 terawatts across sub-Saharan Africa.
To confirm this calculation, we used the capacity figures to determine how much land would be necessary for solar installations in all sub-Saharan African countries, assuming the energy estimates from the World Bank. This calculation concluded that between 0.02 and 0.05 percent of land would have to be covered to reach these large capacity figures. We believe this estimate of land coverage would, in fact, be conservative.
51 International Energy Statistics, US Energy Information Administration, 2013, eia.gov; BP Statistical Review of World Energy, BP, June 2014, bp.com; UCube Upstream Database, Rystad Energy, 2013, rystadenergy.com.
52 World Energy Resources: 2013 Survey, World Energy Council, October 2013, worldenergy.org.
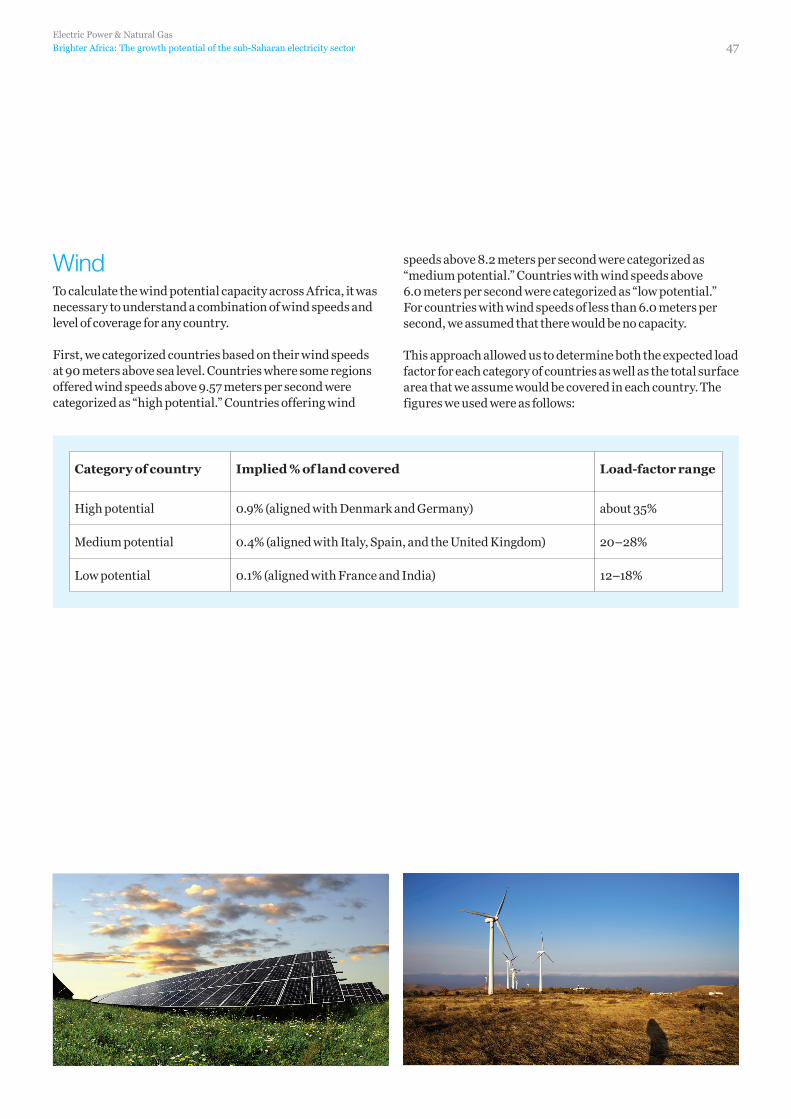
Electric Power & Natural Gas
Brighter Africa: The growth potential of the sub-Saharan electricity sector 47
WindTo calculate the wind potential capacity across Africa, it was necessary to understand a combination of wind speeds and level of coverage for any country.
First, we categorized countries based on their wind speeds at 90 meters above sea level. Countries where some regions offered wind speeds above 9.57 meters per second were categorized as “high potential.” Countries offering wind
speeds above 8.2 meters per second were categorized as “medium potential.” Countries with wind speeds above 6.0 meters per second were categorized as “low potential.” For countries with wind speeds of less than 6.0 meters per second, we assumed that there would be no capacity.
This approach allowed us to determine both the expected load factor for each category of countries as well as the total surface area that we assume would be covered in each country. The figures we used were as follows:
Category of country Implied % of land covered Load-factor range
High potential 0.9% (aligned with Denmark and Germany) about 35%
Medium potential 0.4% (aligned with Italy, Spain, and the United Kingdom) 20–28%
Low potential 0.1% (aligned with France and India) 12–18%
48
The weighted average cost of capital (WACC) is an intergral component in calculating the levelized cost of energy (LCOE). In fact, it is one of the largest drivers of the
investment cost, along with the principal amount of capital-spending investment and country-risk premium (CRP).
In calculating WACC for all the sub-Saharan African countries, we assumed a common investor profile, specifically a utility from a developed country, with costs denominated in US dollars. Nearly all major investments in sub-Saharan Africa continue to be funded in US dollars, with domestic capital markets limited and rates for local currency high (although organizations such as the International Finance Corporation are ramping up their domestic-currency debt offerings). The key assumptions for that investor are a cost of equity of about 8.9 percent and a 70:30 equity-to-debt ratio. We base the cost of equity on that found in typical electric-power utilities (in this case, a specific European utility), but this is expected to be the same for the sector regardless of geography. The 70:30 weighting assumption is based on the market value of a generation-power project in Africa. While the project-financing structure is typically more levered (as low as 25:75),53 the market value of the project should be higher because successful projects will have positive net present values (otherwise, there would be no investment). As a result, the true value of equity typically ends up being higher, supporting at least a 70:30 equity-to-debt weighting assumption.
As a result, we assume that the only major differences in WACC among geographical locations are driven by country risk and, to a lesser degree, the domestic tax rate (based
on 2010 rates). Country risk affects both the cost of equity and the cost of debt for a project. The impact on the cost of equity is lower than on debt because a company invests its equity over many projects and geographies (both new and existing), lessening (or diversifying) the impact of any single country risk. The impact of country risk on debt is much greater then on equity (we have assumed 2.5 times), since the debt is usually issued for a more specific investment purpose (either a specific project or a specific set of investments). Even after accounting for weighting, the country risk comes across strongest in its impact on debt rather than equity (Exhibit 30).
Country-risk premiums and ratings compared with developed countries are not readily available for all sub-Saharan countries. As a result, we used four sources— Dagong Global, PwC, Standard & Poor’s (S&P), and the World Economic Forum—to assign a risk rating to each sub-Saharan country. Likewise, we used the risk rating to create a variation factor to be able to compare countries’ relative riskiness and assign relative risk premiums for riskier countries. The variation factor is merely a numerical assignment that corresponds to the letter rating system used by S&P. This approach allowed us to determine that the risk premium for a “C”-rated country, such as Somalia, is more than triple that of an “A”-rated country, such as Rwanda.
Appendix III: Weighted average cost of capital
53 We are assuming a private-sector investor, as governments can secure more leveraged terms, with equity contributions as low as 15 percent.
Σt
0LCOE =
(investment expenditure + O&M expenditure + fuel cost)in year t x (1+WACC)-t
Electricity generated in year t x (1+WACC)-t
With: O&M = operations and maintenance costst = life span of plant + construction time
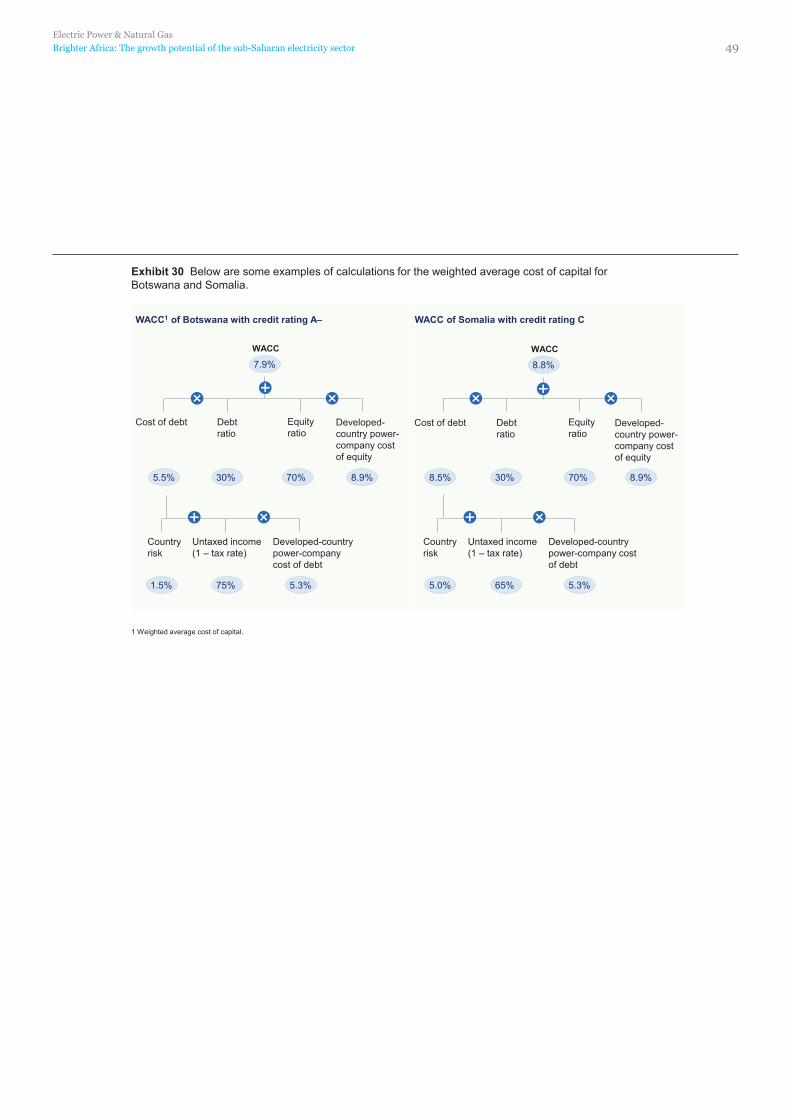
Electric Power & Natural Gas
Brighter Africa: The growth potential of the sub-Saharan electricity sector 49
Exhibit 30 Below are some examples of calculations for the weighted average cost of capital for Botswana and Somalia.
WACC
1 Weighted average cost of capital.
WACC1 of Botswana with credit rating A– WACC of Somalia with credit rating C
8.9% 70% 30% 5.5%
5.3% 75% 1.5%
7.9%
Cost of debt Debt ratio
Equity ratio
Developed- country power- company cost of equity
Country risk
Untaxed income (1 – tax rate)
Developed-country power-company cost of debt
WACC
8.9% 70% 30% 8.5%
5.3% 65% 5.0%
8.8%
Cost of debt Debt ratio
Equity ratio
Developed- country power- company cost of equity
Country risk
Untaxed income (1 – tax rate)
Developed-country power-company cost of debt
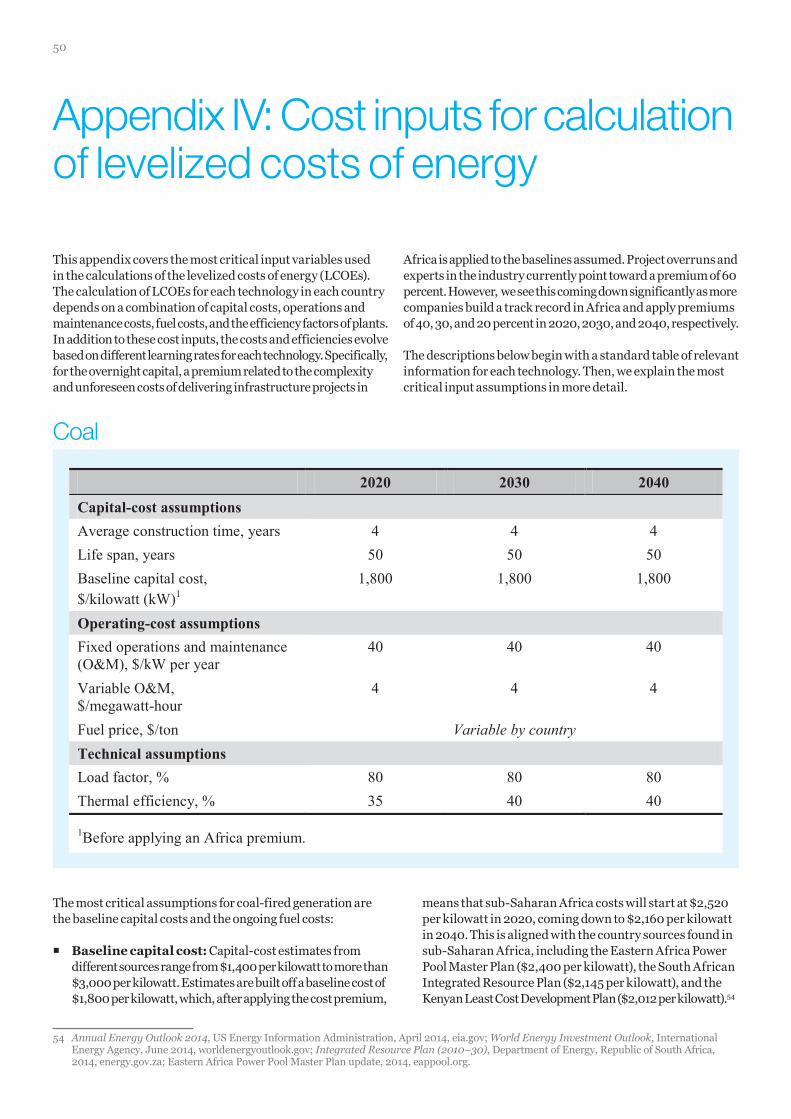
50
This appendix covers the most critical input variables used in the calculations of the levelized costs of energy (LCOEs). The calculation of LCOEs for each technology in each country depends on a combination of capital costs, operations and maintenance costs, fuel costs, and the efficiency factors of plants. In addition to these cost inputs, the costs and efficiencies evolve based on different learning rates for each technology. Specifically, for the overnight capital, a premium related to the complexity and unforeseen costs of delivering infrastructure projects in
Africa is applied to the baselines assumed. Project overruns and experts in the industry currently point toward a premium of 60 percent. However, we see this coming down significantly as more companies build a track record in Africa and apply premiums of 40, 30, and 20 percent in 2020, 2030, and 2040, respectively.
The descriptions below begin with a standard table of relevant information for each technology. Then, we explain the most critical input assumptions in more detail.
The most critical assumptions for coal-fired generation are the baseline capital costs and the ongoing fuel costs:
� Baseline capital cost: Capital-cost estimates from different sources range from $1,400 per kilowatt to more than $3,000 per kilowatt. Estimates are built off a baseline cost of $1,800 per kilowatt, which, after applying the cost premium,
means that sub-Saharan Africa costs will start at $2,520 per kilowatt in 2020, coming down to $2,160 per kilowatt in 2040. This is aligned with the country sources found in sub-Saharan Africa, including the Eastern Africa Power Pool Master Plan ($2,400 per kilowatt), the South African Integrated Resource Plan ($2,145 per kilowatt), and the Kenyan Least Cost Development Plan ($2,012 per kilowatt).54
Appendix IV: Cost inputs for calculation of levelized costs of energy
Coal
2020 2030 2040 Capital-cost assumptions Average construction time, years 4 4 4 Life span, years 50 50 50 Baseline capital cost, $/kilowatt (kW)1
1,800 1,800 1,800
Operating-cost assumptions Fixed operations and maintenance (O&M), $/kW per year
40 40 40
Variable O&M, $/megawatt-hour
4 4 4
Fuel price, $/ton Variable by country Technical assumptions Load factor, % 80 80 80 Thermal efficiency, % 35 40 40
1Before applying an Africa premium.
2020 2030 2040 Capital-cost assumptions Average construction time, years 3 3 3 Life span, years 40 40 40 Baseline capital cost, $/kilowatt (kW)1
1,000 1,000 1,000
Operating-cost assumptions Fixed operations and maintenance (O&M), $/kW per year
20 20 20
Variable O&M, $/megawatt-hour
3 3 3
Fuel price, $/ton Variable by country Technical assumptions Load factor, % 85 85 85 Thermal efficiency, % 57 59 61
1Before applying an Africa premium.
54 Annual Energy Outlook 2014, US Energy Information Administration, April 2014, eia.gov; World Energy Investment Outlook, International Energy Agency, June 2014, worldenergyoutlook.gov; Integrated Resource Plan (2010–30), Department of Energy, Republic of South Africa, 2014, energy.gov.za; Eastern Africa Power Pool Master Plan update, 2014, eappool.org.
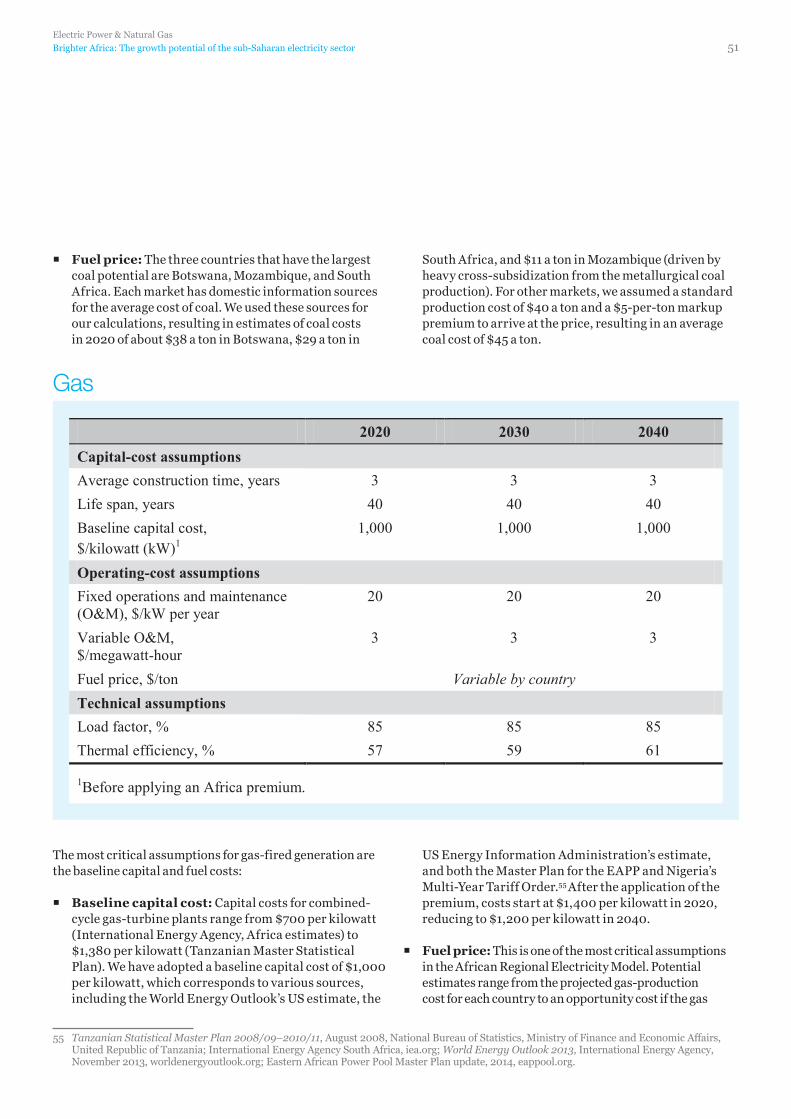
Electric Power & Natural Gas
Brighter Africa: The growth potential of the sub-Saharan electricity sector 51
� Fuel price: The three countries that have the largest coal potential are Botswana, Mozambique, and South Africa. Each market has domestic information sources for the average cost of coal. We used these sources for our calculations, resulting in estimates of coal costs in 2020 of about $38 a ton in Botswana, $29 a ton in
South Africa, and $11 a ton in Mozambique (driven by heavy cross-subsidization from the metallurgical coal production). For other markets, we assumed a standard production cost of $40 a ton and a $5-per-ton markup premium to arrive at the price, resulting in an average coal cost of $45 a ton.
The most critical assumptions for gas-fired generation are the baseline capital and fuel costs:
� Baseline capital cost: Capital costs for combined-cycle gas-turbine plants range from $700 per kilowatt (International Energy Agency, Africa estimates) to $1,380 per kilowatt (Tanzanian Master Statistical Plan). We have adopted a baseline capital cost of $1,000 per kilowatt, which corresponds to various sources, including the World Energy Outlook’s US estimate, the
US Energy Information Administration’s estimate, and both the Master Plan for the EAPP and Nigeria’s Multi-Year Tariff Order.55 After the application of the premium, costs start at $1,400 per kilowatt in 2020, reducing to $1,200 per kilowatt in 2040.
� Fuel price: This is one of the most critical assumptions in the African Regional Electricity Model. Potential estimates range from the projected gas-production cost for each country to an opportunity cost if the gas
55 Tanzanian Statistical Master Plan 2008/09–2010/11, August 2008, National Bureau of Statistics, Ministry of Finance and Economic Affairs, United Republic of Tanzania; International Energy Agency South Africa, iea.org; World Energy Outlook 2013, International Energy Agency, November 2013, worldenergyoutlook.org; Eastern African Power Pool Master Plan update, 2014, eappool.org.
Gas
2020 2030 2040 Capital-cost assumptions Average construction time, years 4 4 4 Life span, years 50 50 50 Baseline capital cost, $/kilowatt (kW)1
1,800 1,800 1,800
Operating-cost assumptions Fixed operations and maintenance (O&M), $/kW per year
40 40 40
Variable O&M, $/megawatt-hour
4 4 4
Fuel price, $/ton Variable by country Technical assumptions Load factor, % 80 80 80 Thermal efficiency, % 35 40 40
1Before applying an Africa premium.
2020 2030 2040 Capital-cost assumptions Average construction time, years 3 3 3 Life span, years 40 40 40 Baseline capital cost, $/kilowatt (kW)1
1,000 1,000 1,000
Operating-cost assumptions Fixed operations and maintenance (O&M), $/kW per year
20 20 20
Variable O&M, $/megawatt-hour
3 3 3
Fuel price, $/ton Variable by country Technical assumptions Load factor, % 85 85 85 Thermal efficiency, % 57 59 61
1Before applying an Africa premium.
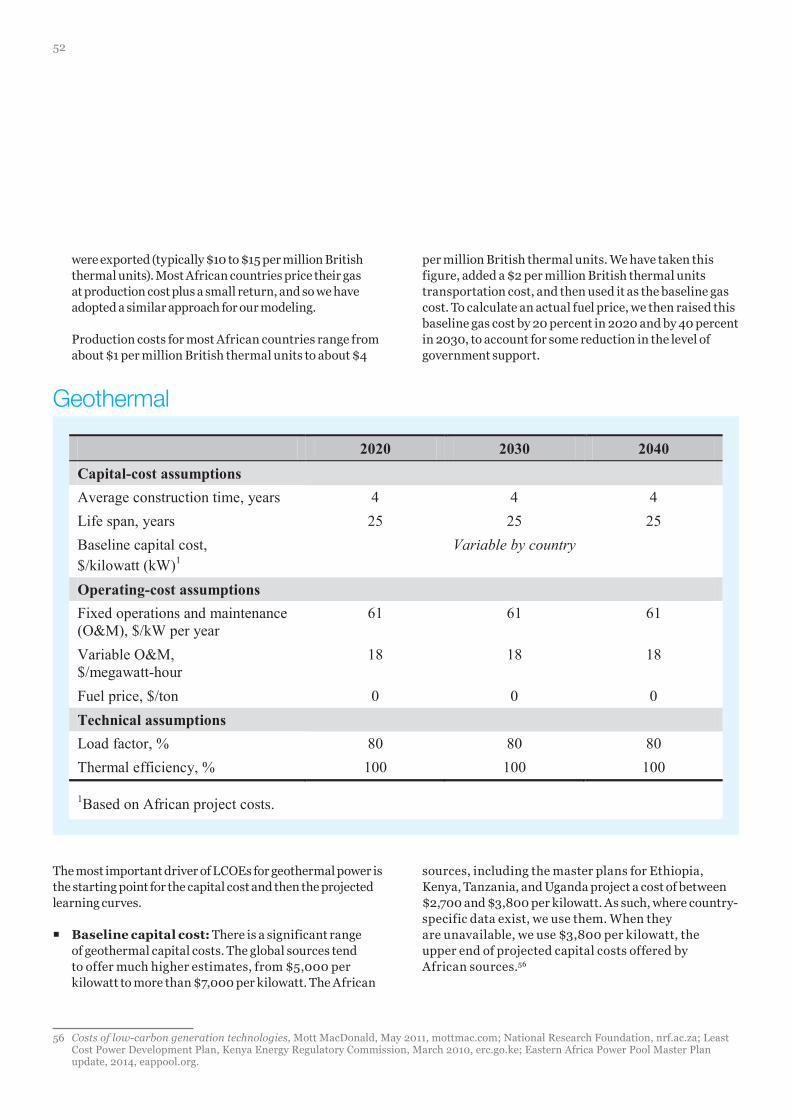
52
The most important driver of LCOEs for geothermal power is the starting point for the capital cost and then the projected learning curves.
� Baseline capital cost: There is a significant range of geothermal capital costs. The global sources tend to offer much higher estimates, from $5,000 per kilowatt to more than $7,000 per kilowatt. The African
sources, including the master plans for Ethiopia, Kenya, Tanzania, and Uganda project a cost of between $2,700 and $3,800 per kilowatt. As such, where country-specific data exist, we use them. When they are unavailable, we use $3,800 per kilowatt, the upper end of projected capital costs offered by African sources.56
were exported (typically $10 to $15 per million British thermal units). Most African countries price their gas at production cost plus a small return, and so we have adopted a similar approach for our modeling.
Production costs for most African countries range from about $1 per million British thermal units to about $4
per million British thermal units. We have taken this figure, added a $2 per million British thermal units transportation cost, and then used it as the baseline gas cost. To calculate an actual fuel price, we then raised this baseline gas cost by 20 percent in 2020 and by 40 percent in 2030, to account for some reduction in the level of government support.
56 Costs of low-carbon generation technologies, Mott MacDonald, May 2011, mottmac.com; National Research Foundation, nrf.ac.za; Least Cost Power Development Plan, Kenya Energy Regulatory Commission, March 2010, erc.go.ke; Eastern Africa Power Pool Master Plan update, 2014, eappool.org.
Geothermal
2020 2030 2040 Capital-cost assumptions Average construction time, years 4 4 4 Life span, years 25 25 25 Baseline capital cost, $/kilowatt (kW)1
Variable by country
Operating-cost assumptions Fixed operations and maintenance (O&M), $/kW per year
61 61 61
Variable O&M, $/megawatt-hour
18 18 18
Fuel price, $/ton 0 0 0 Technical assumptions Load factor, % 80 80 80 Thermal efficiency, % 100 100 100
1Based on African project costs.
2020 2030 2040 Capital-cost assumptions Average construction time, years 4 4 4 Life span, years 60 60 60 Baseline capital cost, $/kilowatt (kW)1
Variable by country
Operating-cost assumptions Fixed operations and maintenance (O&M), $/kW per year
9 9 9
Variable O&M, $/megawatt-hour
2 2 2
Fuel price, $/ton 0 0 0 Technical assumptions Load factor, % Variable by country
1Based on African project costs.
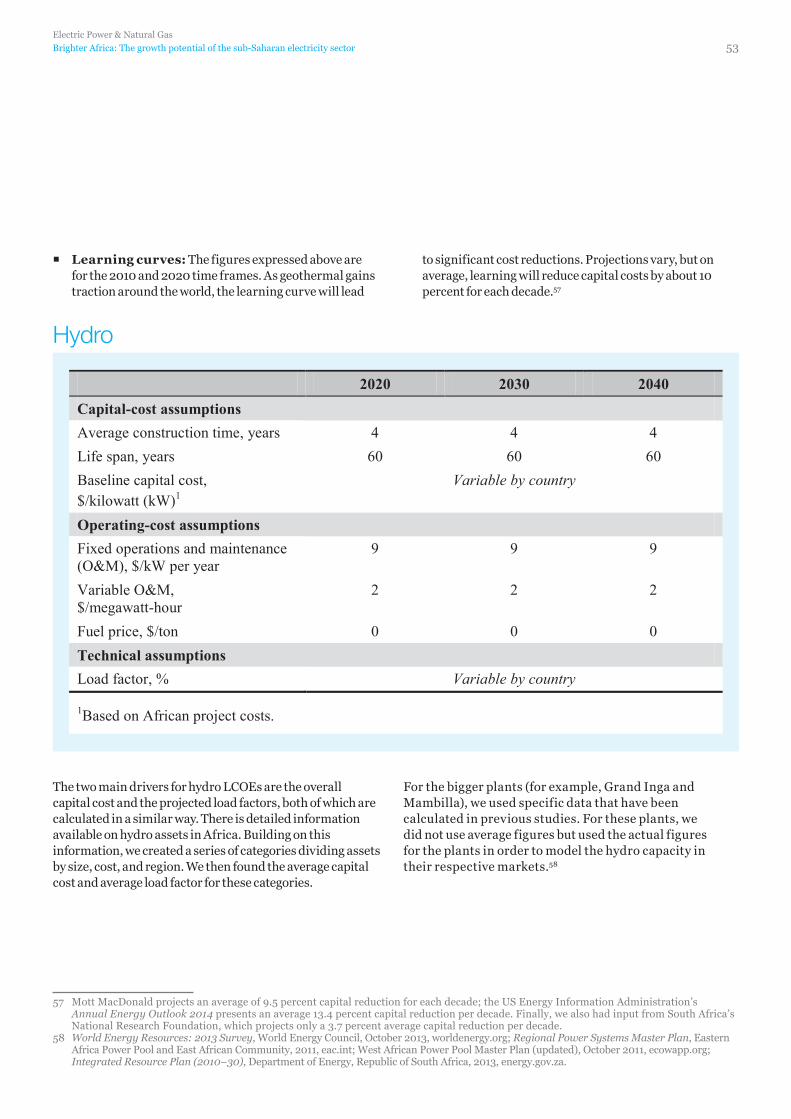
Electric Power & Natural Gas
Brighter Africa: The growth potential of the sub-Saharan electricity sector 53
The two main drivers for hydro LCOEs are the overall capital cost and the projected load factors, both of which are calculated in a similar way. There is detailed information available on hydro assets in Africa. Building on this information, we created a series of categories dividing assets by size, cost, and region. We then found the average capital cost and average load factor for these categories.
For the bigger plants (for example, Grand Inga and Mambilla), we used specific data that have been calculated in previous studies. For these plants, we did not use average figures but used the actual figures for the plants in order to model the hydro capacity in their respective markets.58
� Learning curves: The figures expressed above are for the 2010 and 2020 time frames. As geothermal gains traction around the world, the learning curve will lead
to significant cost reductions. Projections vary, but on average, learning will reduce capital costs by about 10 percent for each decade.57
57 Mott MacDonald projects an average of 9.5 percent capital reduction for each decade; the US Energy Information Administration’s Annual Energy Outlook 2014 presents an average 13.4 percent capital reduction per decade. Finally, we also had input from South Africa’s National Research Foundation, which projects only a 3.7 percent average capital reduction per decade.
58 World Energy Resources: 2013 Survey, World Energy Council, October 2013, worldenergy.org; Regional Power Systems Master Plan, Eastern Africa Power Pool and East African Community, 2011, eac.int; West African Power Pool Master Plan (updated), October 2011, ecowapp.org; Integrated Resource Plan (2010–30), Department of Energy, Republic of South Africa, 2013, energy.gov.za.
Hydro
2020 2030 2040 Capital-cost assumptions Average construction time, years 4 4 4 Life span, years 25 25 25 Baseline capital cost, $/kilowatt (kW)1
Variable by country
Operating-cost assumptions Fixed operations and maintenance (O&M), $/kW per year
61 61 61
Variable O&M, $/megawatt-hour
18 18 18
Fuel price, $/ton 0 0 0 Technical assumptions Load factor, % 80 80 80 Thermal efficiency, % 100 100 100
1Based on African project costs.
2020 2030 2040 Capital-cost assumptions Average construction time, years 4 4 4 Life span, years 60 60 60 Baseline capital cost, $/kilowatt (kW)1
Variable by country
Operating-cost assumptions Fixed operations and maintenance (O&M), $/kW per year
9 9 9
Variable O&M, $/megawatt-hour
2 2 2
Fuel price, $/ton 0 0 0 Technical assumptions Load factor, % Variable by country
1Based on African project costs.
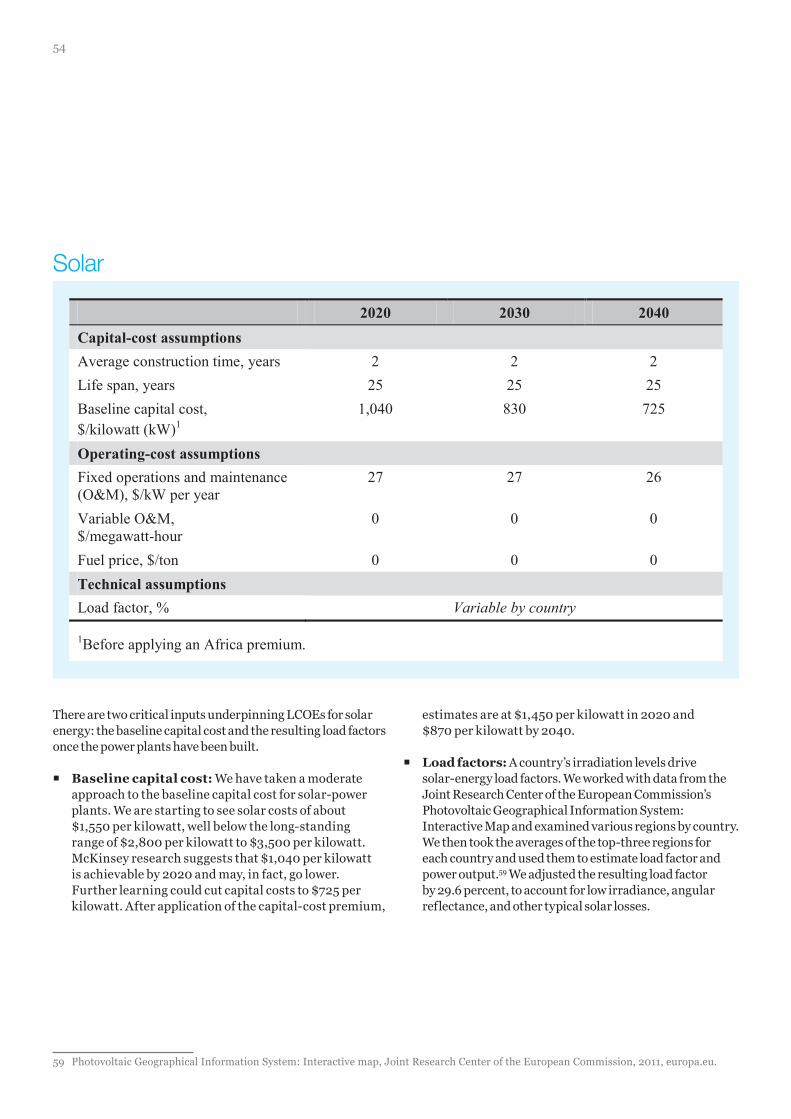
54
There are two critical inputs underpinning LCOEs for solar energy: the baseline capital cost and the resulting load factors once the power plants have been built.
� Baseline capital cost: We have taken a moderate approach to the baseline capital cost for solar-power plants. We are starting to see solar costs of about $1,550 per kilowatt, well below the long-standing range of $2,800 per kilowatt to $3,500 per kilowatt. McKinsey research suggests that $1,040 per kilowatt is achievable by 2020 and may, in fact, go lower. Further learning could cut capital costs to $725 per kilowatt. After application of the capital-cost premium,
estimates are at $1,450 per kilowatt in 2020 and $870 per kilowatt by 2040.
� Load factors: A country’s irradiation levels drive solar-energy load factors. We worked with data from the Joint Research Center of the European Commission’s Photovoltaic Geographical Information System: Interactive Map and examined various regions by country. We then took the averages of the top-three regions for each country and used them to estimate load factor and power output.59 We adjusted the resulting load factor by 29.6 percent, to account for low irradiance, angular reflectance, and other typical solar losses.
Solar
59 Photovoltaic Geographical Information System: Interactive map, Joint Research Center of the European Commission, 2011, europa.eu.
2020 2030 2040 Capital-cost assumptions Average construction time, years 2 2 2 Life span, years 25 25 25 Baseline capital cost, $/kilowatt (kW)1
1,040 830 725
Operating-cost assumptions Fixed operations and maintenance (O&M), $/kW per year
27 27 26
Variable O&M, $/megawatt-hour
0 0 0
Fuel price, $/ton 0 0 0 Technical assumptions Load factor, % Variable by country
1Before applying an Africa premium.
2020 2030 2040 Capital-cost assumptions Average construction time, years 1.75 1.5 1.5 Life span, years 20 20 20 Baseline capital cost, $/kilowatt (kW)1
1,400 1,350 1,325
Operating-cost assumptions Fixed operations and maintenance (O&M), $/kW per year
36 35 34
Variable O&M, $/megawatt-hour
4 4 4
Fuel price, $/ton 0 0 0 Technical assumptions Load factor, % Variable by country
1Before applying an Africa premium.
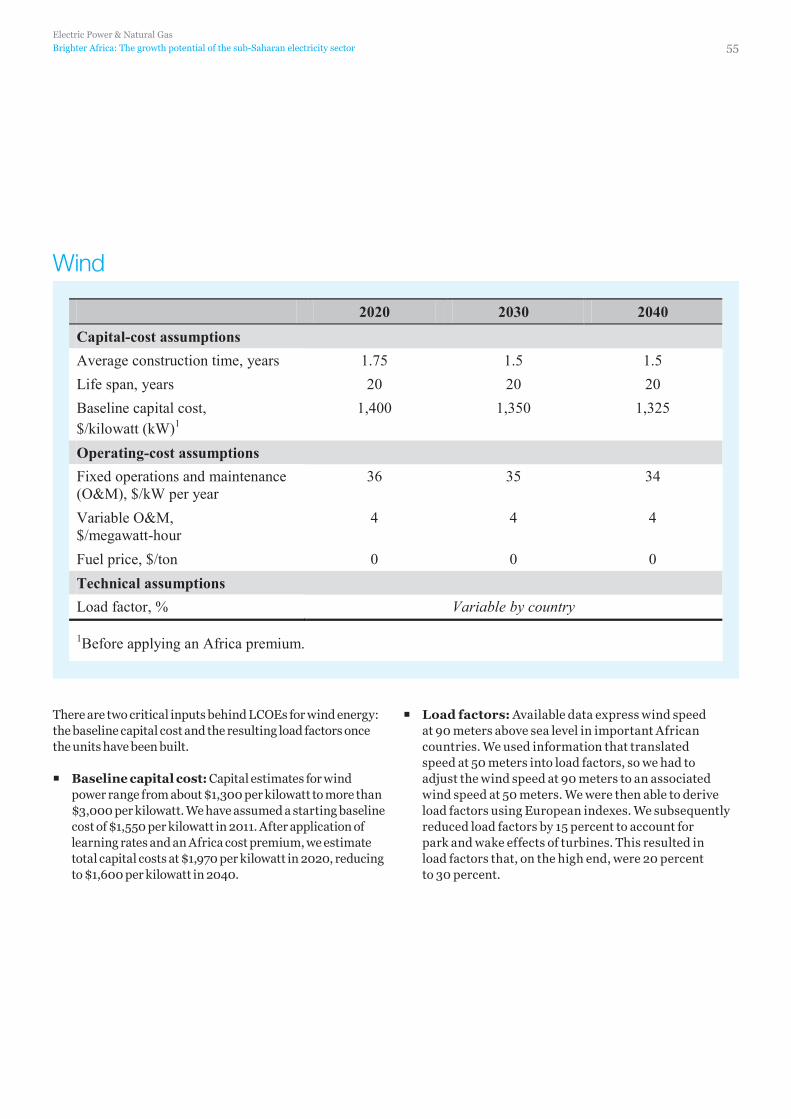
Electric Power & Natural Gas
Brighter Africa: The growth potential of the sub-Saharan electricity sector 55
There are two critical inputs behind LCOEs for wind energy: the baseline capital cost and the resulting load factors once the units have been built.
� Baseline capital cost: Capital estimates for wind power range from about $1,300 per kilowatt to more than $3,000 per kilowatt. We have assumed a starting baseline cost of $1,550 per kilowatt in 2011. After application of learning rates and an Africa cost premium, we estimate total capital costs at $1,970 per kilowatt in 2020, reducing to $1,600 per kilowatt in 2040.
� Load factors: Available data express wind speed at 90 meters above sea level in important African countries. We used information that translated speed at 50 meters into load factors, so we had to adjust the wind speed at 90 meters to an associated wind speed at 50 meters. We were then able to derive load factors using European indexes. We subsequently reduced load factors by 15 percent to account for park and wake effects of turbines. This resulted in load factors that, on the high end, were 20 percent to 30 percent.
Wind
2020 2030 2040 Capital-cost assumptions Average construction time, years 2 2 2 Life span, years 25 25 25 Baseline capital cost, $/kilowatt (kW)1
1,040 830 725
Operating-cost assumptions Fixed operations and maintenance (O&M), $/kW per year
27 27 26
Variable O&M, $/megawatt-hour
0 0 0
Fuel price, $/ton 0 0 0 Technical assumptions Load factor, % Variable by country
1Before applying an Africa premium.
2020 2030 2040 Capital-cost assumptions Average construction time, years 1.75 1.5 1.5 Life span, years 20 20 20 Baseline capital cost, $/kilowatt (kW)1
1,400 1,350 1,325
Operating-cost assumptions Fixed operations and maintenance (O&M), $/kW per year
36 35 34
Variable O&M, $/megawatt-hour
4 4 4
Fuel price, $/ton 0 0 0 Technical assumptions Load factor, % Variable by country
1Before applying an Africa premium.

56
As described earlier, our optimization model relies on a number of important inputs. To summarize, these include the following:
� projections for commercial and industrial demand, and also residential demand for each country, projected to 2040 (as described in chapter 2 of this report)
� available capacity by technology for each country (covered in Appendix II)
� levelized cost of energy (LCOE) for each technology in each country, calculated based on a consistent set of inputs (Appendix IV) and a standard approach to calculate weighted average cost of capital for each country (Appendix III); these LCOEs are projected to 2040, incorporating a range of learning curves, which differ for each technology, and an overnight capital-cost premium for Africa, which reduces over time (covered in more detail in the opening paragraphs of Appendix IV)
The overall modeling exercise used the above data as inputs. The objective of the modeling was to determine the optimal energy mix, given various assumptions and scenarios. Once we developed the full supply-and-demand picture as inputs, the final modeling to determine what actually gets built was straightforward and guided by the following modeling rules. The rules describe what we refer to as the national case:
� Supply-and-demand matching is done on a national basis and is calculated for years 2020, 2030, and 2040.
� All capacity under construction will be completed according to the proposed schedule for each project, bearing in mind expected time overruns.
� The decision about which type of capacity to build is driven by a comparison of the levelized cost of energy of each technology in each country. No consideration of factors such as absolute capital-cost levels or environmental emissions are taken into account.
� In the 2020 period, we assume that all the power needs in any country can be delivered by a single source (assuming there is sufficient capacity from that source). In the 2030 and 2040 periods, we assume some diversification; so for all countries, we require at least two technologies to be built. In 2030, we limit the cheapest source of power (on a levelized cost basis) to 80 percent of the energy delivered; while in 2040, we limit the cheapest source to 70 percent of energy delivered.
� To convert energy to capacity, we apply a standard set of load factors, adjusted for each technology.
� Once a source has run out of capacity in that particular country, the next-cheapest sources are used to fulfill the demand.
� We limit cross-border power trading to existing levels, implying that there will be no incremental transfer of electricity across international borders.
� The modeling technique ignores the challenge associated with dispatch and assumes that all energy can be predictably dispatched. We recognize this shortcoming but decided that a model differentiating between dispatchable and nondispatchable power would offer only limited insights when projecting forward 20 years.
Appendix V: How the optimization model works
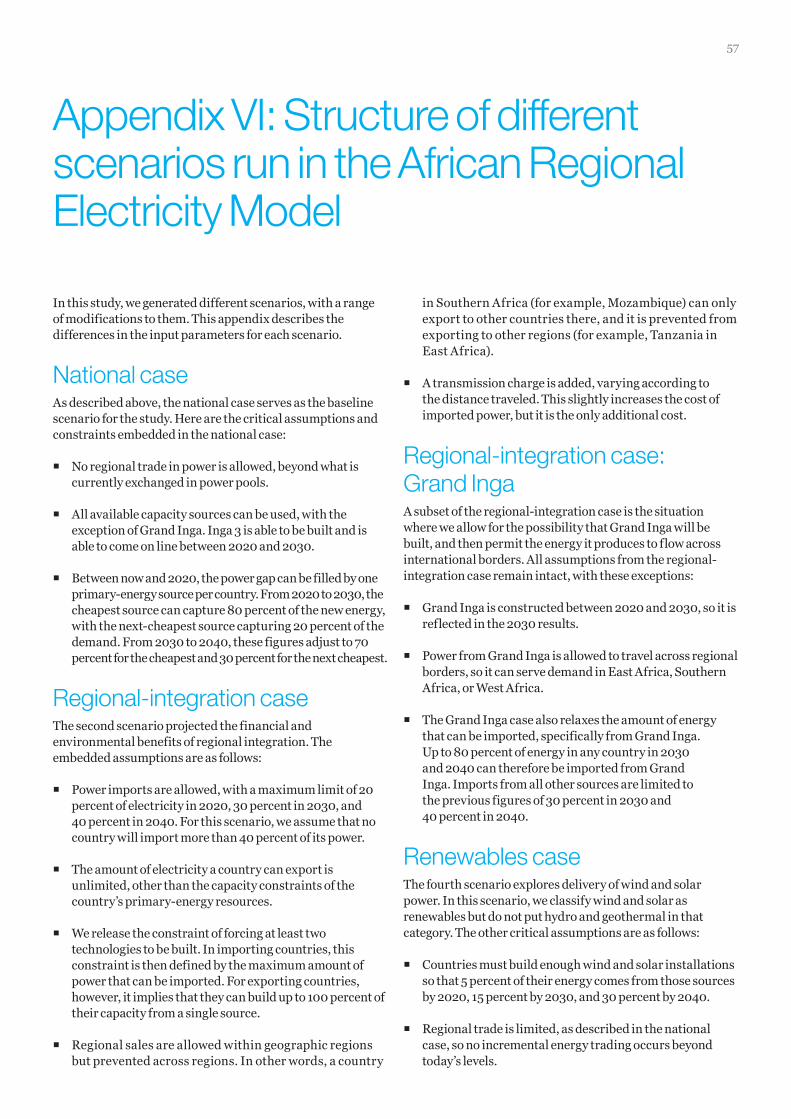
57
In this study, we generated different scenarios, with a range of modifications to them. This appendix describes the differences in the input parameters for each scenario.
National caseAs described above, the national case serves as the baseline scenario for the study. Here are the critical assumptions and constraints embedded in the national case:
� No regional trade in power is allowed, beyond what is currently exchanged in power pools.
� All available capacity sources can be used, with the exception of Grand Inga. Inga 3 is able to be built and is able to come on line between 2020 and 2030.
� Between now and 2020, the power gap can be filled by one primary-energy source per country. From 2020 to 2030, the cheapest source can capture 80 percent of the new energy, with the next-cheapest source capturing 20 percent of the demand. From 2030 to 2040, these figures adjust to 70 percent for the cheapest and 30 percent for the next cheapest.
Regional-integration caseThe second scenario projected the financial and environmental benefits of regional integration. The embedded assumptions are as follows:
� Power imports are allowed, with a maximum limit of 20 percent of electricity in 2020, 30 percent in 2030, and 40 percent in 2040. For this scenario, we assume that no country will import more than 40 percent of its power.
� The amount of electricity a country can export is unlimited, other than the capacity constraints of the country’s primary-energy resources.
� We release the constraint of forcing at least two technologies to be built. In importing countries, this constraint is then defined by the maximum amount of power that can be imported. For exporting countries, however, it implies that they can build up to 100 percent of their capacity from a single source.
� Regional sales are allowed within geographic regions but prevented across regions. In other words, a country
in Southern Africa (for example, Mozambique) can only export to other countries there, and it is prevented from exporting to other regions (for example, Tanzania in East Africa).
� A transmission charge is added, varying according to the distance traveled. This slightly increases the cost of imported power, but it is the only additional cost.
Regional-integration case: Grand IngaA subset of the regional-integration case is the situation where we allow for the possibility that Grand Inga will be built, and then permit the energy it produces to flow across international borders. All assumptions from the regional-integration case remain intact, with these exceptions:
� Grand Inga is constructed between 2020 and 2030, so it is reflected in the 2030 results.
� Power from Grand Inga is allowed to travel across regional borders, so it can serve demand in East Africa, Southern Africa, or West Africa.
� The Grand Inga case also relaxes the amount of energy that can be imported, specifically from Grand Inga. Up to 80 percent of energy in any country in 2030 and 2040 can therefore be imported from Grand Inga. Imports from all other sources are limited to the previous figures of 30 percent in 2030 and 40 percent in 2040.
Renewables caseThe fourth scenario explores delivery of wind and solar power. In this scenario, we classify wind and solar as renewables but do not put hydro and geothermal in that category. The other critical assumptions are as follows:
� Countries must build enough wind and solar installations so that 5 percent of their energy comes from those sources by 2020, 15 percent by 2030, and 30 percent by 2040.
� Regional trade is limited, as described in the national case, so no incremental energy trading occurs beyond today’s levels.
Appendix VI: Structure of different scenarios run in the African Regional Electricity Model
58
The model’s purpose was not to predict the future but to provide insights about potential pathways, their differences, and their implications. Accurate 25-year forecasts are
impossible when dealing with a region as geopolitically and economically fluid as sub-Saharan Africa. We preferred to focus on the potential, and on a few select (and in some cases, extreme) outcomes. These allowed us to examine how the energy sector in sub-Saharan African countries could evolve.
The authors wish to thank the following McKinsey colleagues for their contributions to this report: Mayowa Alli, Miriam Alvarez, Henrik Arwidi, Nischal Baijnath, Konrad Bauer, Adele Boadzo, Rodolphe della Faille, Scott Desmarais, Peter de Wit, Khethinkosi Dlamini, Armando Dominioni, Norbert Dorr, Helene Drouilly, David Fine, Katharina Frunzetti, Allan Gold, Anuj Gupta, Mauricio Jaramillo, Johanna Jochim, Michael Kloss, Kgotso Koete, Kartik Jayaram, Kannan Lakmeeharan, Hugues Lavandier, Acha Leke, Tlhologelo Mabelane, Mulanga Maphada, Marlynie Moodley, Xolile Msimanga, Scott Nyquist, Martin Pergler, Poonam Rao, Ricardo Reina, Jens Riese, Occo Roelofsen, Xavier Rousseau, Bill Russo, Eivind Samseth, Sunil Sanghvi, Nuno Santos, Joao Segorbe, Namit Sharma, Sheeba Soin, Martin Stuchtey, Mera Thompson, Thomas Vahlenkamp, Arend van Wamelen, Bart Vereecke, Antonio Volpin, Alexander Weiss, and Raffael Winter.
The authors would also like to thank external contributors Robert Ashdown, Brian Dames, Hiroyuki Hino, Steve Lennon, Lisa Pinsley, and Jason van der Poel.
Antonio Castellano is a senior expert in McKinsey’s Electric Power & Natural Gas Practice and is based in the Milan office. He has worked mostly in emerging markets, serving governments and utilities in Africa, the Middle East, and Southeast Asia.
Adam Kendall, a principal and location manager in McKinsey’s Casablanca office, leads the Electric Power & Natural Gas Practice in Africa. He has worked extensively across Africa on topics ranging from power-sector reform and regulation to electrification to operational improvement.
Mikhail Nikomarov is a consultant in McKinsey’s Johannesburg office. He specialiizes in electricity and energy across Africa, serving national governments, utilities, and global equipment manufacturers on Africa entry and growth strategies, capital-project delivery, and operational improvement.
Tarryn Swemmer is a specialist in McKinsey’s Johannesburg office and leads the Africa research and information team. Her primary focus is on electricity in Africa and other emerging markets.
Contact for distribution: Tarryn Swemmer Phone: +27 (11) 506-8214 E-mail: [email protected]


Electric Power & Natural GasFebruary 2015 Designed by Global Editorial Services Copyright © McKinsey & Company