Bright Trading, LLC - SEC
51
Bright Trading, LLC Professional Equities Trading 4850 Harrison Drive Las Vegas, NV 89121 www.stocktrading.com Tel: 702-739-1393 Fax: 702-739-1398 March 24, 2010 Robert W. Cook Director, Division of Trading and Markets Securities and Exchange Commission 100 F Street, NE Washington, DC 20549-1090 Re: Meeting with Bright Trading, LLC on Equity Market Structure Dear Mr. Cook: We appreciate the opportunity to provide our comments, and address the Division of Trading and Markets, on File No. S7-02-10, the Commission’s Concept Release on Equity Market Structure. We commend the Commission for taking the initiative to evaluate the current equity market structure. Bright Trading, LLC is one of the largest professional stock trading firms in the United States with hundreds of traders trading from offices and connected remotely from their homes. Bright has been registered in the US as a broker dealer with the Securities and Exchange Commission since 1992 and is also a member of the Chicago Stock Exchange. Bright is in the business solely for trading its own members’ accounts and does not solicit nor accept orders from customers. All transactions are executed through our clearing broker, Goldman Sachs Execution and Clearing. In order to become a trader at Bright, each individual must become a Class B member of the limited liability company and must successfully complete the Series 7 general securities representative qualification examination as well as be registered with the Chicago Stock Exchange. Bright Trading has noticed a number of changes in the equity market structure over the past few years. While some of these changes have benefited the overall markets, other changes have raised significant concerns for us. We have outlined a number of our concerns with the current market structure below. Underlying Problem: Undisplayed Trading Centers Compromising the NBBO through Sub-Penny Trading
Transcript of Bright Trading, LLC - SEC
Bright Trading, LLC Professional Equities Trading 4850 Harrison Drive Las Vegas, NV 89121 www.stocktrading.com Tel: 702-739-1393 Fax: 702-739-1398
March 24, 2010
Robert W. Cook Director, Division of Trading and Markets Securities and Exchange Commission 100 F Street, NE Washington, DC 20549-1090
Re: Meeting with Bright Trading, LLC on Equity Market Structure
Dear Mr. Cook:
We appreciate the opportunity to provide our comments, and address the Division of Trading and Markets, on File No. S7-02-10, the Commission’s Concept Release on Equity Market Structure. We commend the Commission for taking the initiative to evaluate the current equity market structure.
Bright Trading, LLC is one of the largest professional stock trading firms in the United States with hundreds of traders trading from offices and connected remotely from their homes. Bright has been registered in the US as a broker dealer with the Securities and Exchange Commission since 1992 and is also a member of the Chicago Stock Exchange. Bright is in the business solely for trading its own members’ accounts and does not solicit nor accept orders from customers. All transactions are executed through our clearing broker, Goldman Sachs Execution and Clearing. In order to become a trader at Bright, each individual must become a Class B member of the limited liability company and must successfully complete the Series 7 general securities representative qualification examination as well as be registered with the Chicago Stock Exchange.
Bright Trading has noticed a number of changes in the equity market structure over the past few years. While some of these changes have benefited the overall markets, other changes have raised significant concerns for us. We have outlined a number of our concerns with the current market structure below.
Underlying Problem: Undisplayed Trading Centers Compromising the NBBO through Sub-Penny Trading
Sub-pennying
An abusive strategy that has been occurring with increased frequency is a practice called “subpennying”. It is the practice of a market participant stepping in front of a displayed limit order by a fraction of a cent.
The explicit purpose of this strategy is to preempt the NBBO.
Evidence: Appendix A, B, C, D, E, F, G, H, I.
SEC rule 612 prohibits market participants from displaying orders in a sub-penny increment. Most broker-dealers will not even accept these sub-penny orders from their customers.
Broker-Dealer Internalization
However under SEC Rule 612, broker-dealers themselves are allowed to provide “price improvement” to their customers. When an investor places a market order from their retail brokerage account, their broker-dealer routes this order to their OTC market maker. The market maker then decides if they want to trade against their customer, by taking the opposite side of the order. If the market maker believes they can make money by trading against their customer, they will fill the order from their own inventory. In this case, the market order never makes it to the public exchange. This practice is known as broker-dealer internalization.
Statistics from the Commission’s Concept Release on Equity Market Structure, state that 17.5% of all trades are internalized by broker-dealers. A more alarming statistic from page 21 of the release states that, “a review of the order routing disclosures required by Rule 606 of Regulation NMS of eight broker-dealers with significant retail customer accounts reveals that nearly 100% of their customer market orders are routed to OTC market makers.” This means that almost every single market order placed in these retail brokerage accounts, is checked by the brokerdealer’s OTC market maker to decide if they can make money by trading against their customer. They can legally trade against their customers as long as they match or beat the National Best Bid and Offer (“NBBO”).
Nominal Price Improvement
Broker-dealers will often beat the NBBO, by a nominal amount, often as little as 1/100th of a penny. This gives them justification for internalizing the trade, because they saved their customer a fraction of a cent. But this savings does not justify the cost to the true liquidity provider that was left unfilled. To put this into perspective, consider a stock offered at $25.00 on the public exchange, the best posted ask price. An investor buying 100 shares of this stock would pay $2,500.00. When the broker-dealer internalizes the fill, and beats the NBBO by 1/100ths of a penny, the investor only pays $2,499.99, a savings of 1 cent. This nominal price improvement of 1 cent, does not justify the unquantifiable loss of the lost trading opportunity, to the person who was publicly offering the stock at $25.00. This person, the true liquidity provider, is left holding the stock.
Evidence: Appendix J.
Dark Pools Being Used To Hide in Front of the NBBO
If the broker-dealer decides to pass on the opportunity to trade against its customer, the order is routed to the exchange. Many broker dealers use smart routers that check “dark pools” of liquidity for a better price. A dark pool is an execution venue that provides liquidity, but does not provide public quotations. In other words, it is a place where a trader can place hidden orders. Algorithmic programs can place hidden orders that automatically sub-penny the NBBO. This can be easily done by pegging the order to the NBBO, with a sub-penny offset.
For example, the NBBO offer from the above example was $25.00. An algorithmic program can be created to peg a sell short order to the NBBO offer with a -.0001 offset, and be sent to a dark pool. Even though the public NBBO offer is $25.00, the algorithm has a hidden sell short order at $24.9999. If the public offer were to move down to $24.99, the algorithmic program automatically adjusts its offer to $24.9899. In essence, the algorithmic program is always hiding in front of the NBBO. This sub-penny order does not violate SEC rule 612, because the $24.9899 order is not displayed.
A market order that was sent via the smart router searches out the better price and is executed at the hidden $24.9999 price. Again, the displayed liquidity provider is not filled.
Evidence: Appendix H, Appendix I.
Discouraging Liquidity Providers
The only time the displayed order on the NBBO is filled from an incoming retail market order, is when the OTC market maker of the broker-dealer passes on the chance to trade against its customer’s order, and there are no undisplayed orders hiding in dark pools in front of the NBBO order. As a result the only retail orders getting through to the publicly displayed NBBO, are the orders that the first two market participants have passed on. If the first two participants have passed on the opportunity to trade against the order, there is a good chance that the incoming market order is on the right side of the market (in the short-term). Hence, the only NBBO orders that are filled are those that are more likely wrong (in the short-term). The displayed liquidity provider is “sub-pennied” when they’re right, filled when they’re wrong. As liquidity providers become discouraged, they will place fewer passive limit orders in the short term and ultimately leave the trading markets. This will lead to less depth in the market and larger spreads, both increasing the cost to investors in the long term.
Algorithmic systems being used to Preempt NBBO in displayed market centers
Another predatory practice that is extremely prevalent in our current market structure, is displayed “pennying”, where an algorithmic system automatically steps in front of a displayed order by a full cent. The reason for this practice, is to be first in line for execution. While this practice is an annoyance to active investors, and active traders, it is not as damaging as the “subpennying” that goes on in the undisplayed market centers. This is a predatory practice that is extremely prevalent in thinner issues, as the typical bid-ask spreads are much wider than 1 cent. This problem does not exist in the most actively traded issues. This could however become a serious problem, if the public exchanges are allowed to quote in sub-pennies as well.
Sub-Pennies for Everyone – Not the Answer
The public exchanges have recently disclosed their interest to quote in sub-pennies. They need a level playing field to compete with the undisplayed market centers (broker-dealer internalization, and dark pools), so they are proposing a move to displayed quotes in 1/10th of a penny increments. This is simply not the answer to the sub-pennying issues.
While we agree that a move to sub-pennies in the displayed market centers, would solve the subpennying problems in the most highly liquid securities, it would have a damaging effect in more illiquid securities.
If the Commission were to adopt a 1/10th of a penny increment, as the minimum pricing increment for everyone, it would further compromise the NBBO in illiquid securities.
If a market participant places an order at $24.951, the broker-dealer will still be able to internalize ahead of them at $24.952. The dark pool will still be able to hide in front of the $24.951 order at $24.952.
But now an even bigger problem is created. All the algorithmic systems can now step in front of your order by as little as 1/10th of a penny in the displayed market centers as well. Currently displayed algorithmic systems can only step in front of your order by a full cent. This increases the number of prices that a displayed algorithmic system can step in front of the NBBO by a product of ten.
So the displayed liquidity providing order will not only be stepped in front of by the internalized broker-dealer orders, and the hidden dark pool orders, it will now be stepped in front of by every computer system capable of pegging an order $0.001 in front of the NBBO. The problem will be magnified.
Possible Solutions:
1) Ban Sub-penny trading
It is our belief that a better solution, is to not change the minimum pricing increment of publicly displayed market centers to sub-pennies, but to remove any exemption permitted under section c, of Rule 612, including those applicable to broker-dealers, so as to not allow sub-penny trades to occur in the undisplayed market centers. This would level the playing field.
2) Regulate Sub-Penny Trading
If an outright ban is not possible, then sub-penny trading must be regulated. The broker-dealer price improvement process must be better regulated, to make sure they are not internalizing trades to simply preempt the NBBO.
Dark pools must also be investigated to stop algorithmic systems from hiding sub-penny orders in front of the NBBO. It is of utmost importance to make sure the displayed liquidity provider is not disadvantaged by the sub-penny trade.
Perhaps imposing a minimum size criterion for trading in sub-pennies, is a better solution. If an institution wants to cross a trade with another institution, then they would still be able to do so. These sub-penny institutional trades should only be allowed at mid-point. This would eliminate the small sub-penny trades, and help to significantly reduce instances of sub-pennying.
3) SEC Concept Trade-At Rule
Another possible solution to the sub-pennying issues is the Commission’s concept “Trade-At” rule.
In the Commission's concept release on equity market structure, the Commission outlines the concept of a "trade-at" rule. Quoted from the concept release on page 70, the "trade-at" rule "would prohibit any trading center from executing a trade at the price of the NBBO unless the trading center was displaying that price at the time it received the incoming contra-side order. Under this type of rule, for example, a trading center that was not displaying the NBBO at the time it received an incoming marketable order could either: (1) execute the order with significant price improvement (such as the minimum allowable quoting increment (generally one cent)); or (2) route ISOs to full displayed size of NBBO quotations and then execute the balance of the order at the NBBO price."
This rule would solve the problem of market participants stepping in front of the NBBO for fractions of a cent. There would be a minimum amount of acceptable price improvement, for broker-dealers to internalize the trade. If a one cent increment was imposed, this would mean a retail customer placing a market order for 100 shares, would save $1.00 on their market order, a more acceptable amount than the one cent they currently receive when the broker-dealer sub-pennies the NBBO by 1/100th of cent.
Secondly, and more importantly, it puts the NBBO back to a "first-come, first-served basis". If a market order was placed to buy 2000 shares, and the NBBO was displaying 1000 shares on the offer, the 1000 shares offered on the NBBO would get filled, and then the broker-dealer could fill the remaining 1000 shares from their own inventory. This would be a much more satisfactory result to the liquidity provider displaying the offer.
In regards to the practice of hiding orders in front of the NBBO via dark pools, the sub-penny order hidden in front of the NBBO is not displayed. If the "trade-at" rule is carefully designed to include dark pool trading venues in the trading center definition, then market participants hiding in dark pools should fall under the same restrictions. They would have to better the NBBO by a full cent, or stand in line behind the displayed liquidity provider.
The "trade-at" rule would increase marketable order flow to the NBBO. By increasing the amount of orders going to the publicly displayed market, the issues discouraging liquidity providers are relieved.
The proposal would also force the broker-dealers, and dark pool liquidity providers to come out of their undisplayed markets, and into the publicly displayed market. This would increase the number of participants in the displayed market, and should increase competition in the displayed market. Market participants would be able to display quotations in greater size, with more aggressive pricing, which should in turn lower spreads and increase the depth of the publicly displayed market.
The "trade-at" rule is an excellent solution to our sub-pennying problems on liquid securities. The sub-pennying problem would become a pennying problem on thinner, illiquid issues.
Which brings us to another concern in which we envision, on stocks that have wide spreads, (for example 15-20 cents or greater), should the minimum price improvement amount be increased? If a stock has a 50 cent spread, the displayed orders will not be protected by the trade-at rule. Broker-dealer internalization practices will step in front of the NBBO by a penny, hence discouraging liquidity providers. Therefore, we believe the minimum price improvement offered by broker-dealers should be a function of the bid-ask spread. A general guideline could be a minimum of 10% of the average bid-ask spread. For example, if a stock has an average bid-ask spread of 50 cents, then the minimum price improvement for a broker-dealer to internalize would be 5 cents. If a stock has a 10 cent spread or less than 1 cent price improvements should suffice.
Alternatively, the minimum displayed pricing increment could be increased for less liquid, or more highly priced securities. A move to nickels would eliminate “pennying” in these illiquid securities.
SEC Questions on concept of “Trade-At” rule
The Commission asked a number of questions in its concept release. Five of these questions pertained to the trade-at rule. We have answered these questions below.
1) Would it help promote pre-trade public price discovery by preventing the diversion of a significant volume of highly valuable marketable order flow away from the displayed trading centers and to undisplayed trading centers?
Statistics in the concept release show that 17.5% of all trades are internalized by the Broker-dealer. An additional 7.9% of all trades were executed in dark pools. In addition the release indicates that a review of the order routing disclosures required by Rule 606 of Regulation NMS discloses that nearly 100% of the customer order flow of eight broker-dealers with significant retail customer accounts are routed to OTC market makers. It appears from our own review of Rule 606 reports for the fourth quarter 2009 that this practice is still in effect. This means that almost every single market order placed in these retail brokerage accounts, is checked by the broker-dealer’s OTC market maker to decide if they can make money by trading against their customer. They can legally trade against their customer as long as they match or beat the NBBO. If the broker-dealer believes they can make money by trading against their customer, they will fill the order from their own inventory.
This action compromises the NBBO, as many market orders do not make it to the public exchange. The publicly displayed order on the NBBO is only filled by the incoming retail market order, when the OTC market maker, passes on the chance to trade against their customer. This discourages liquidity providers, as many passive orders are not filled. This forces liquidity providers to place more active, liquidity taking orders which further reduces displayed liquidity. Fewer displayed orders causes public price discovery to suffer.
2) If so, to what extent would the increased routing of this marketable order flow to displayed trading centers create significantly greater incentives for market participants to display quotations in greater size or with more aggressive prices?
As previously discussed, the only time the displayed order on the NBBO is filled by an incoming retail order, is when the OTC market maker of the broker-dealer passes on the chance to trade against their customer’s order, and there are no undisplayed orders hiding in dark pools in front of the NBBO order. The only retail orders getting through to the publicly displayed NBBO, are the orders that the first two market participants passed on. If the first two participants have passed on the opportunity to trade against the order, there is a good chance that the order is on the right side of the market (in the short-term). The only NBBO orders that are filled are those that are possibly wrong (in the short-term). You are sub-pennied when you’re right, filled when you’re wrong. Therefore, there is no point to displaying liquidity. This has created a two-tiered market structure of displayed vs. undisplayed orders. Every market participant should have their equal and fair chance to trade against incoming market orders.
The proposed rule would make the broker-dealers, and dark pool liquidity providers, come out of their undisplayed markets, and into the publicly displayed market. The increased number of participants in the displayed market should increase competition. This should lead market participants to display quotations in greater size, and more aggressive pricing, which should lower spreads and increase the depth of the publicly displayed market.
3) Given the order-routing and trading system technologies currently in place to prevent tradethroughs, would it be feasible for market participants to comply with a trade-at rule at reasonable cost?
Costs should be minimal, as compliance with the trade-at rule would just be a matter of adjusting the trading system technologies that prevent trade-throughs, to include the applicable displayed bid or offer on the NBBO in the execution.
4) Should a trade-at rule apply to all types of trading centers (e.g., exchanges, ECNs, OTC market makers, and dark pools) or only to some of them?
The trade-at rule should apply to all trading centers. By providing an exemption for a certain market center the opportunity will still exist for a continuation of a two tiered market system.
As mentioned above, on less liquid stocks, it may be necessary to make the minimum price improvement amount a function of the bid-ask spread, to avoid turning the sub-pennying issue, into a pennying issue.
5) In addition, if the Commission were to consider such a rule, how should it treat the issue of displayed markets that charge access fees? Should it, for example, condition the “trade-at” protection of a displayed quotation on there being no access fee or an access fee that is much smaller than the current 0.3 cent per share cap in Rule 610(c) of Regulation NMS?
The bigger question here is, would a displayed market center be willing to drop their access fee in order to have their displayed quotations protected by the “trade-at” rule?
It is important to include the exchanges, and ECNs, in the discussion of this “trade-at” concept. Perhaps they would be willing to drop their access fees for a chance to have increased order flow from the undisplayed trading centers. Statistics from the concept release state that 25.4% of
orders are being executed in undisplayed trading centers. There is great incentive for displayed trading centers to drop their access fees in order to regain some of this order flow.
As proprietary traders, with no customers, our greatest incentive in choosing the venue to place our orders, is not the liquidity rebate offered, but the best chance for us to receive the execution. If for example, the NYSE was willing to waive their access fee, so their order quotations would be protected by the “trade-at” rule, the majority of our traders would place all of their passive limit orders on the NYSE to receive this protection. We believe many other liquidity providers that are discouraged from placing passive orders because of lack of execution, would send their order flow to the NYSE as well. This would drive order flow out of the ECNs and back onto the NYSE. The ECNs may actually have to drop their access fees in order to compete.
The NYSE could still participate in collecting fees generated from high frequency rebate trading through their NYSE ARCA venue. Therefore, we believe the NYSE would be a prime candidate to drop their access fee, to participate in the “trade-at” rule protection.
Another possible solution, that would not require exchange co-operation, is to have the liquidity provider seeking the protection of the “trade-at” rule, pay the access fee themselves. We have discussed this concept with a number of traders in our firm, and almost all of them would be willing to absorb this fee to have a better chance of having their orders executed.
This could be simply implemented by created a new order type “TAP” (trade-at protection). Any order marked “TAP” would be protected by the trade-at rule. In exchange for that protection any liquidity provider marking their order “TAP” would pay the access fee.
The liquidity provider would still receive the liquidity rebate for posting the order, but would also pay the access fee. Their net payment to the exchange would be the difference between the liquidity rebate offered by the exchange for providing liquidity, and the access fee charged by the exchange for taking liquidity. This is a small price to pay for having your passive limit orders protected.
Access Fees May Lead to Sub-pennying
A third solution would be to ban access fees altogether. These access fees are an incentive for broker-dealers to internalize trades.
The make-or-take model is a deterrent for broker-dealers to route orders to the publicly displayed market, as outlined in a study by Professor James Angel, “Equity Trading in the 21st Century”.
Many retail brokerage houses charge a flat commission rate to their customers. So when their customer takes liquidity the brokerage house absorbs this access fee.
Therefore these brokerage houses have an incentive to route order flow to venues that do not charge these fees. In order to avoid the fee, the brokerage house can internalize the order, route the order to an OTC market maker or it can route the order to a dark pool.
Consider the following example. A trader places a passive limit order to sell 500 shares of stock XYZ at $25.00. Another trader from a retail brokerage house decides to buy the 500 shares, and
places a $25.00 buy order. The brokerage house of the buy-side customer charges a flat fee on their order, so they will have to absorb the access fee for their customer. Therefore, they route the order to a dark pool, where a hidden predatory algorithm is hiding in front of the displayed $25.00 sell order.
The order is executed at $24.9999, and the brokerage house avoids the access fee. The displayed seller is “sub-pennied”, and left unfilled. If the access fee didn’t exist, the brokerage house may have routed the order to the displayed $25.00 sell order.
Access fees discourage brokerage houses from routing to the publicly displayed exchanges which in turn causes liquidity providers to display fewer limit orders as fewer of their displayed limit orders are filled. This practice reduces displayed liquidity, and over time will lead to larger bid-ask spreads.
Flash Trading should not be allowed in options market
While the Concept Release focuses on equities and doesn’t discuss the listed options market, the options market is intertwined with the equities market and needs to be addressed. Approximately 15 million calls and puts are traded on a daily basis with each contract representing 100 shares of the underlying security. Many option contracts are directly associated with underlying equity trades. When you add the approximately 20% of options converted to stock you have a significant number of equity transactions.
If what you are trying to address is the entire process of algorithmic trading that causes reduced transparency and reduced liquidity you must include the options market.
When the public, market makers, or even Broker-Dealers place limit option orders, whether opening or closing, they deserve the same benefits as anyone else in the markets. We would like single tier executions. When thousands of orders are flashed within the options matrix and step ahead of the options limit orders this practice seems multi-tiered to us. This practice will cause, and has caused, liquidity providers to leave in droves.
Points to consider:
1. Forming of a Oligopoly via the continuing of consolidation of market players. 2. Deterioration of NBBO, causing wider spreads on options and equities, due to the
Multi-tier structure that has been developed. 3. Conversions and Reverse Conversions regarding “Call, Put, Stock” trades. Getting a
partial penny edge on any of the 3 sides can lock in a profit, but only for tier 1 traders. See reference below.
4. Main emphasis is Tier 2 will be squeezed out without regulation change – causing less liquidity and loss of Transparency of NBBO.
Definitions from theoptionsguide.com
A conversion is an arbitrage strategy in options trading that can be performed for a riskless profit when options are overpriced relative to the underlying stock. To do a conversion, the trader buys the underlying stock and offset it with an equivalent synthetic short stock (long put + short call) position
A reversal, or reverse conversion, is an arbitrage strategy in options trading that can be performed for a riskless profit when options are underpriced
relative to the underlying stock. To do a reversal, the trader short sell the underlying stock and offset it with an equivalent synthetic long stock (long
call + short put) position.
Proponents of Flash trading argue that Flash has two specific benefits for investors.
1) It gives the ability of the market participant using Flash, to save the customer an access fee.
2) It gives the ability of the market participant using Flash, to give price improvement to the customer’s order.
While we agree that flashed orders in the options markets, gives the ability of the market participant using Flash, to possibly save the customer from paying an access fee, and offer some type of price improvement, we do not believe that this nominal benefit outweighs the costs to the overall market.
If the market participant using flash, has the ability to step in front of a displayed liquidity provider, when their order is about to be executed, we believe that this will undoubtedly discourage the public display of orders. What is the point to providing liquidity, if “flash traders” can step in front of the order when somebody tries to execute against it? This practice has an unquantifiable loss (from the missed trading opportunity) to the displayed liquidity provider. This discourages liquidity providers, and is not fair to displayed liquidity. This will lead to less liquidity, and wider spreads.
Additionally, statistics from the SEC rule 605 reports, show that the average price improvement is nominal at best. We again do not believe that the nominal price improvement savings to the customer outweigh the costs to the displayed liquidity provider. Liquidity providers who are posting their bids and offers publicly, provide important information and help price indication and discovery for the exchange. As more and more of their orders are stepped in front of by market participants using Flash, these liquidity providers become discouraged from lack of execution. This will lead them to display less orders, and price discovery will suffer.
Conclusion:
In conclusion, we believe that there are significant problems with our current market structure. The NBBO is compromised on a continuous basis by sub-penny trades. Flash trading only compromises the NBBO further. These actions discourage displayed liquidity providers, who are imperative to the price discovery mechanisms of our public markets.
It is our recommendation that the Commission make the necessary regulatory changes to discourage participants from abusing the NBBO, and once again level the playing field for all market participants.
Sincerely,
Bob Bright Diane Anderson Dennis Dick, CFA Chief Executive Officer Compliance Officer Trading Member Bright Trading LLC Bright Trading LLC Bright Trading LLC [email protected] [email protected] [email protected]
cc: Mr. Daniel Gray, Market Structure Counsel, Division of Trading and Markets Mr. David Shillman, Associate Director, Division of Trading and Markets Mr. Michael Gaw, Assistant Director, Division of Trading and Markets
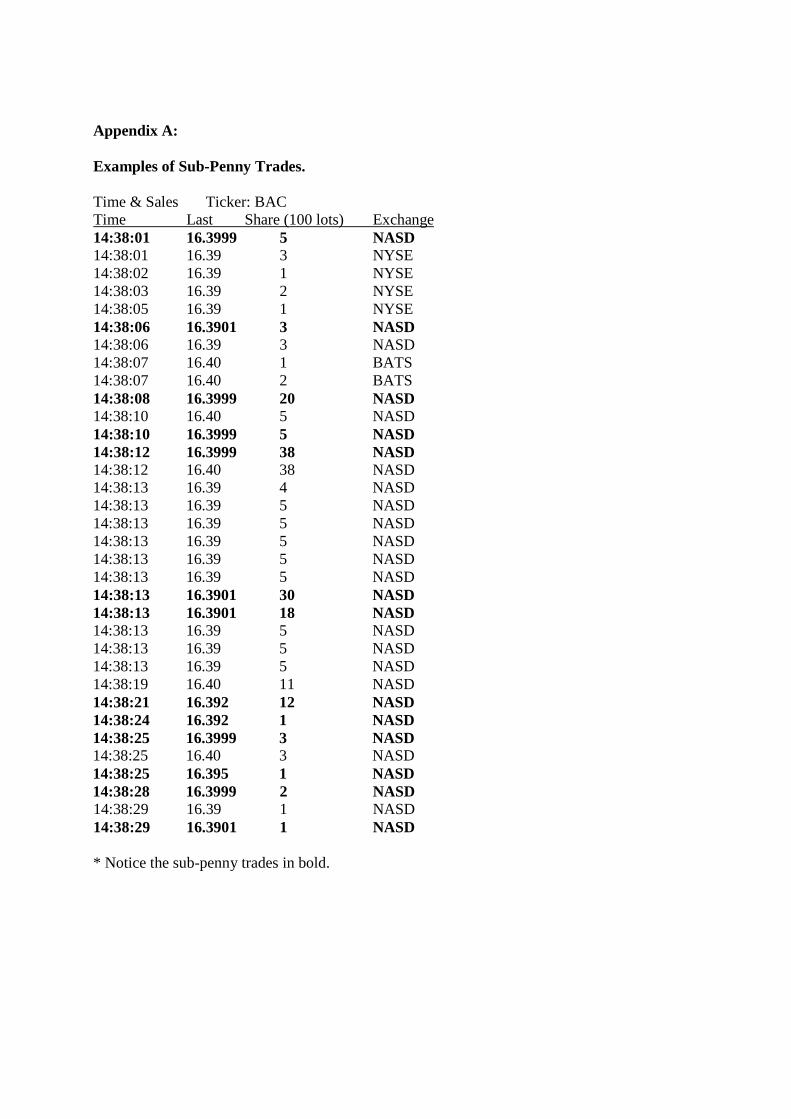
Appendix A:
Examples of Sub-Penny Trades.
Time & Sales Ticker: BAC Time Last Share (100 lots) Exchange 14:38:01 16.3999 5 NASD 14:38:01 16.39 3 NYSE 14:38:02 16.39 1 NYSE 14:38:03 16.39 2 NYSE 14:38:05 16.39 1 NYSE 14:38:06 16.3901 3 NASD 14:38:06 16.39 3 NASD 14:38:07 16.40 1 BATS 14:38:07 16.40 2 BATS 14:38:08 16.3999 20 NASD 14:38:10 16.40 5 NASD 14:38:10 16.3999 5 NASD 14:38:12 16.3999 38 NASD 14:38:12 16.40 38 NASD 14:38:13 16.39 4 NASD 14:38:13 16.39 5 NASD 14:38:13 16.39 5 NASD 14:38:13 16.39 5 NASD 14:38:13 16.39 5 NASD 14:38:13 16.39 5 NASD 14:38:13 16.3901 30 NASD 14:38:13 16.3901 18 NASD 14:38:13 16.39 5 NASD 14:38:13 16.39 5 NASD 14:38:13 16.39 5 NASD 14:38:19 16.40 11 NASD 14:38:21 16.392 12 NASD 14:38:24 16.392 1 NASD 14:38:25 16.3999 3 NASD 14:38:25 16.40 3 NASD 14:38:25 16.395 1 NASD 14:38:28 16.3999 2 NASD 14:38:29 16.39 1 NASD 14:38:29 16.3901 1 NASD
* Notice the sub-penny trades in bold.
Appendix B:
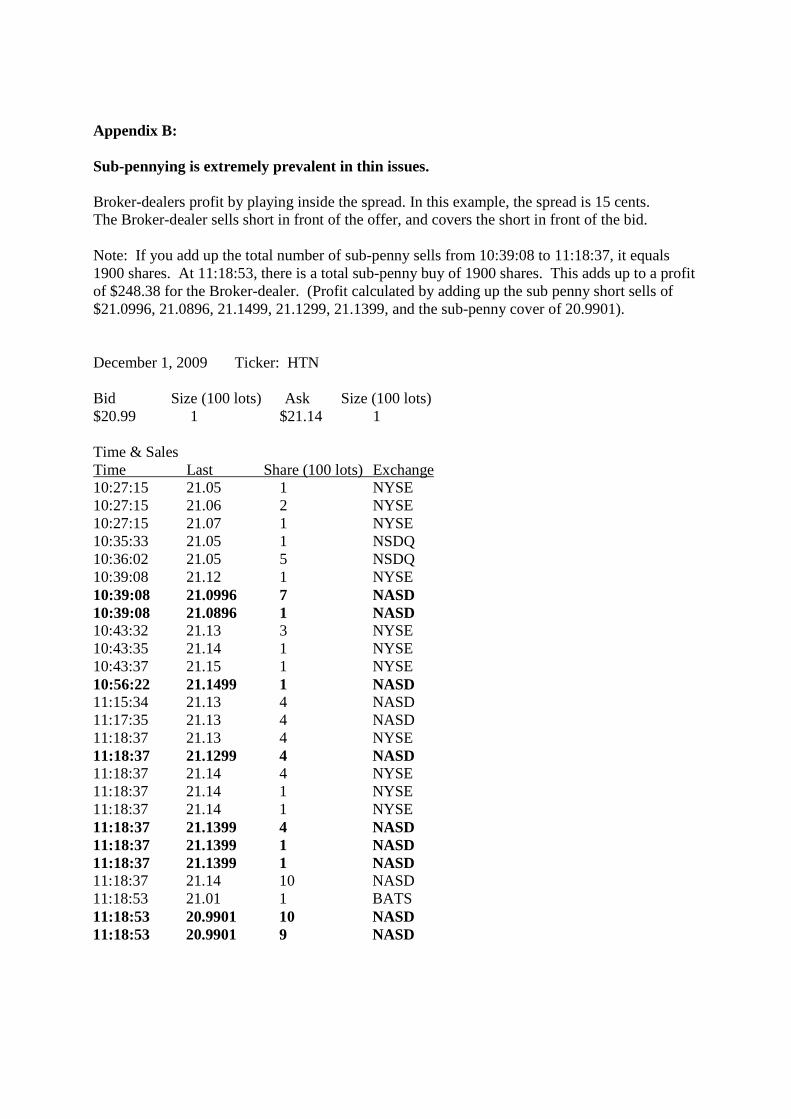
Sub-pennying is extremely prevalent in thin issues.
Broker-dealers profit by playing inside the spread. In this example, the spread is 15 cents. The Broker-dealer sells short in front of the offer, and covers the short in front of the bid.
Note: If you add up the total number of sub-penny sells from 10:39:08 to 11:18:37, it equals 1900 shares. At 11:18:53, there is a total sub-penny buy of 1900 shares. This adds up to a profit of $248.38 for the Broker-dealer. (Profit calculated by adding up the sub penny short sells of $21.0996, 21.0896, 21.1499, 21.1299, 21.1399, and the sub-penny cover of 20.9901).
December 1, 2009 Ticker: HTN
Bid Size (100 lots) Ask Size (100 lots) $20.99 1 $21.14 1
Time & Sales Time Last Share (100 lots) Exchange 10:27:15 21.05 1 NYSE 10:27:15 21.06 2 NYSE 10:27:15 21.07 1 NYSE 10:35:33 21.05 1 NSDQ 10:36:02 21.05 5 NSDQ 10:39:08 21.12 1 NYSE 10:39:08 21.0996 7 NASD 10:39:08 21.0896 1 NASD 10:43:32 21.13 3 NYSE 10:43:35 21.14 1 NYSE 10:43:37 21.15 1 NYSE 10:56:22 21.1499 1 NASD 11:15:34 21.13 4 NASD 11:17:35 21.13 4 NASD 11:18:37 21.13 4 NYSE 11:18:37 21.1299 4 NASD 11:18:37 21.14 4 NYSE 11:18:37 21.14 1 NYSE 11:18:37 21.14 1 NYSE 11:18:37 21.1399 4 NASD 11:18:37 21.1399 1 NASD 11:18:37 21.1399 1 NASD 11:18:37 21.14 10 NASD 11:18:53 21.01 1 BATS 11:18:53 20.9901 10 NASD 11:18:53 20.9901 9 NASD
Appendix C:
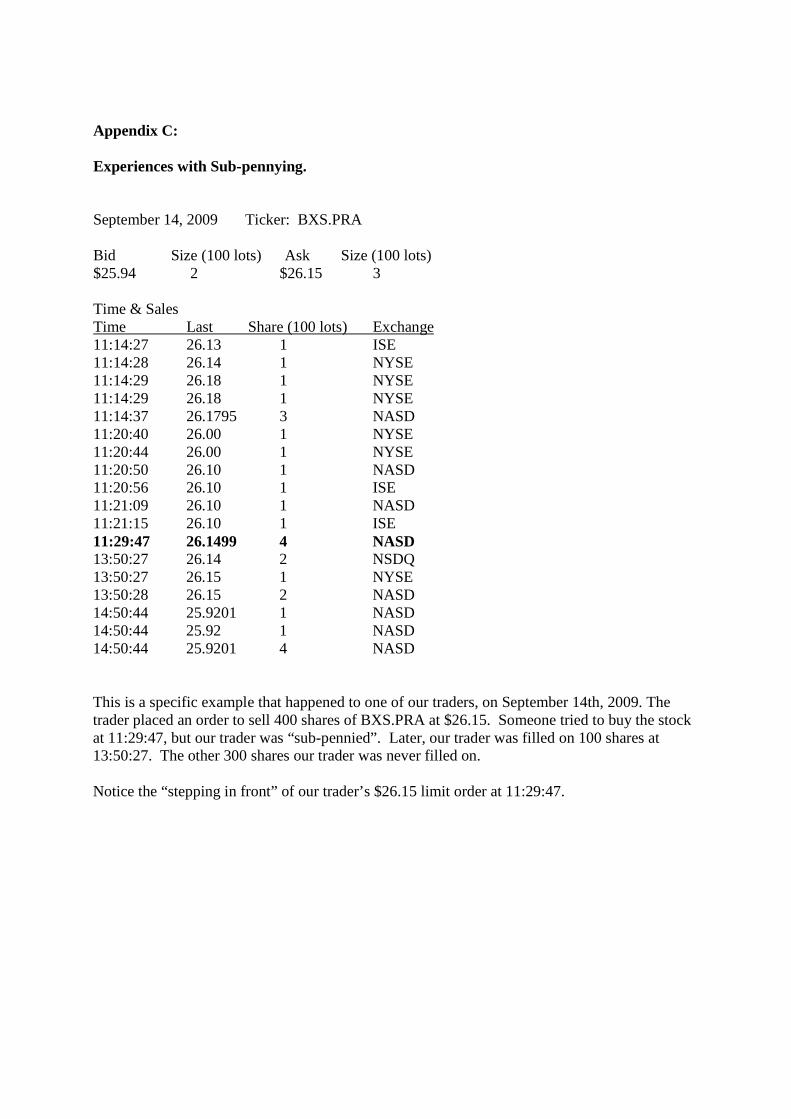
Experiences with Sub-pennying.
September 14, 2009 Ticker: BXS.PRA
Bid Size (100 lots) Ask Size (100 lots) $25.94 2 $26.15 3
Time & Sales Time Last Share (100 lots) Exchange 11:14:27 26.13 1 ISE 11:14:28 26.14 1 NYSE 11:14:29 26.18 1 NYSE 11:14:29 26.18 1 NYSE 11:14:37 26.1795 3 NASD 11:20:40 26.00 1 NYSE 11:20:44 26.00 1 NYSE 11:20:50 26.10 1 NASD 11:20:56 26.10 1 ISE 11:21:09 26.10 1 NASD 11:21:15 26.10 1 ISE 11:29:47 26.1499 4 NASD 13:50:27 26.14 2 NSDQ 13:50:27 26.15 1 NYSE 13:50:28 26.15 2 NASD 14:50:44 25.9201 1 NASD 14:50:44 25.92 1 NASD 14:50:44 25.9201 4 NASD
This is a specific example that happened to one of our traders, on September 14th, 2009. The trader placed an order to sell 400 shares of BXS.PRA at $26.15. Someone tried to buy the stock at 11:29:47, but our trader was “sub-pennied”. Later, our trader was filled on 100 shares at 13:50:27. The other 300 shares our trader was never filled on.
Notice the “stepping in front” of our trader’s $26.15 limit order at 11:29:47.
Appendix D:
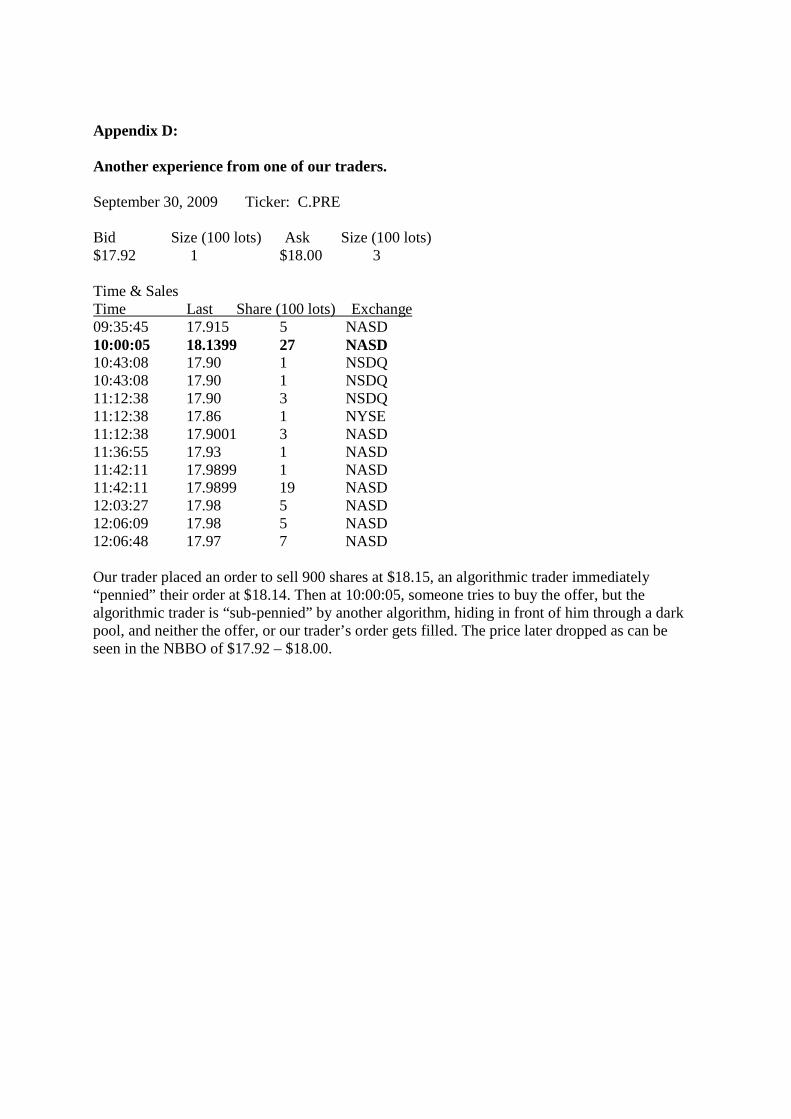
Another experience from one of our traders.
September 30, 2009 Ticker: C.PRE
Bid Size (100 lots) Ask Size (100 lots) $17.92 1 $18.00 3
Time & Sales Time Last Share (100 lots) Exchange 09:35:45 17.915 5 NASD 10:00:05 18.1399 27 NASD 10:43:08 17.90 1 NSDQ 10:43:08 17.90 1 NSDQ 11:12:38 17.90 3 NSDQ 11:12:38 17.86 1 NYSE 11:12:38 17.9001 3 NASD 11:36:55 17.93 1 NASD 11:42:11 17.9899 1 NASD 11:42:11 17.9899 19 NASD 12:03:27 17.98 5 NASD 12:06:09 17.98 5 NASD 12:06:48 17.97 7 NASD
Our trader placed an order to sell 900 shares at $18.15, an algorithmic trader immediately “pennied” their order at $18.14. Then at 10:00:05, someone tries to buy the offer, but the algorithmic trader is “sub-pennied” by another algorithm, hiding in front of him through a dark pool, and neither the offer, or our trader’s order gets filled. The price later dropped as can be seen in the NBBO of $17.92 – $18.00.
Appendix E:
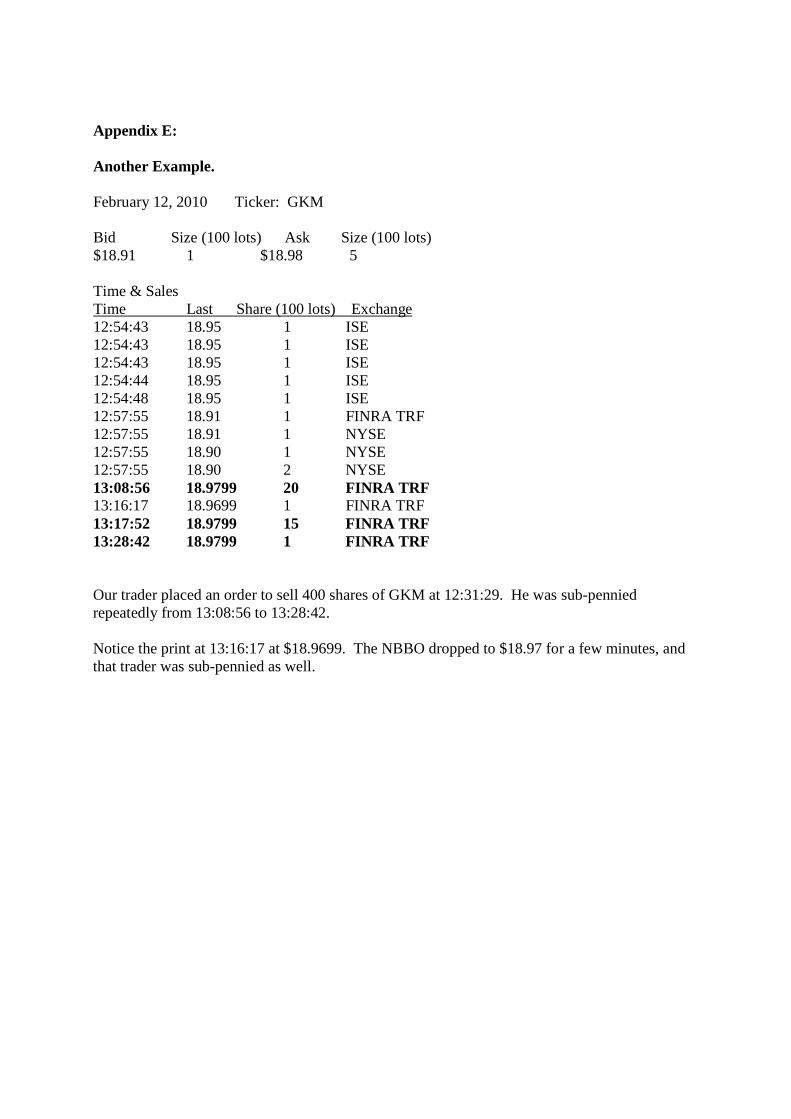
Another Example.
February 12, 2010 Ticker: GKM
Bid Size (100 lots) Ask Size (100 lots) $18.91 1 $18.98 5
Time & Sales Time Last Share (100 lots) Exchange 12:54:43 18.95 1 ISE 12:54:43 18.95 1 ISE 12:54:43 18.95 1 ISE 12:54:44 18.95 1 ISE 12:54:48 18.95 1 ISE 12:57:55 18.91 1 FINRA TRF 12:57:55 18.91 1 NYSE 12:57:55 18.90 1 NYSE 12:57:55 18.90 2 NYSE 13:08:56 18.9799 20 FINRA TRF 13:16:17 18.9699 1 FINRA TRF 13:17:52 18.9799 15 FINRA TRF 13:28:42 18.9799 1 FINRA TRF
Our trader placed an order to sell 400 shares of GKM at 12:31:29. He was sub-pennied repeatedly from 13:08:56 to 13:28:42.
Notice the print at 13:16:17 at $18.9699. The NBBO dropped to $18.97 for a few minutes, and that trader was sub-pennied as well.
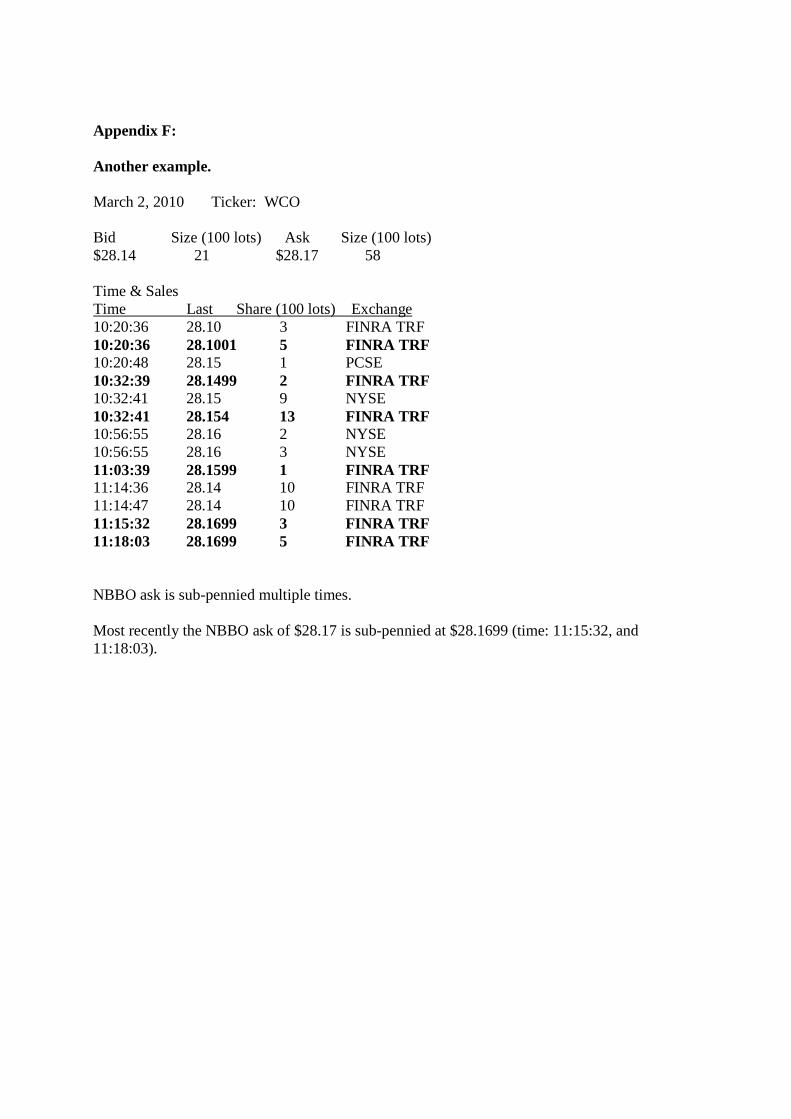
Appendix F:
Another example.
March 2, 2010 Ticker: WCO
Bid Size (100 lots) Ask Size (100 lots) $28.14 21 $28.17 58
Time & Sales Time Last Share (100 lots) Exchange 10:20:36 28.10 3 FINRA TRF 10:20:36 28.1001 5 FINRA TRF 10:20:48 28.15 1 PCSE 10:32:39 28.1499 2 FINRA TRF 10:32:41 28.15 9 NYSE 10:32:41 28.154 13 FINRA TRF 10:56:55 28.16 2 NYSE 10:56:55 28.16 3 NYSE 11:03:39 28.1599 1 FINRA TRF 11:14:36 28.14 10 FINRA TRF 11:14:47 28.14 10 FINRA TRF 11:15:32 28.1699 3 FINRA TRF 11:18:03 28.1699 5 FINRA TRF
NBBO ask is sub-pennied multiple times.
Most recently the NBBO ask of $28.17 is sub-pennied at $28.1699 (time: 11:15:32, and 11:18:03).
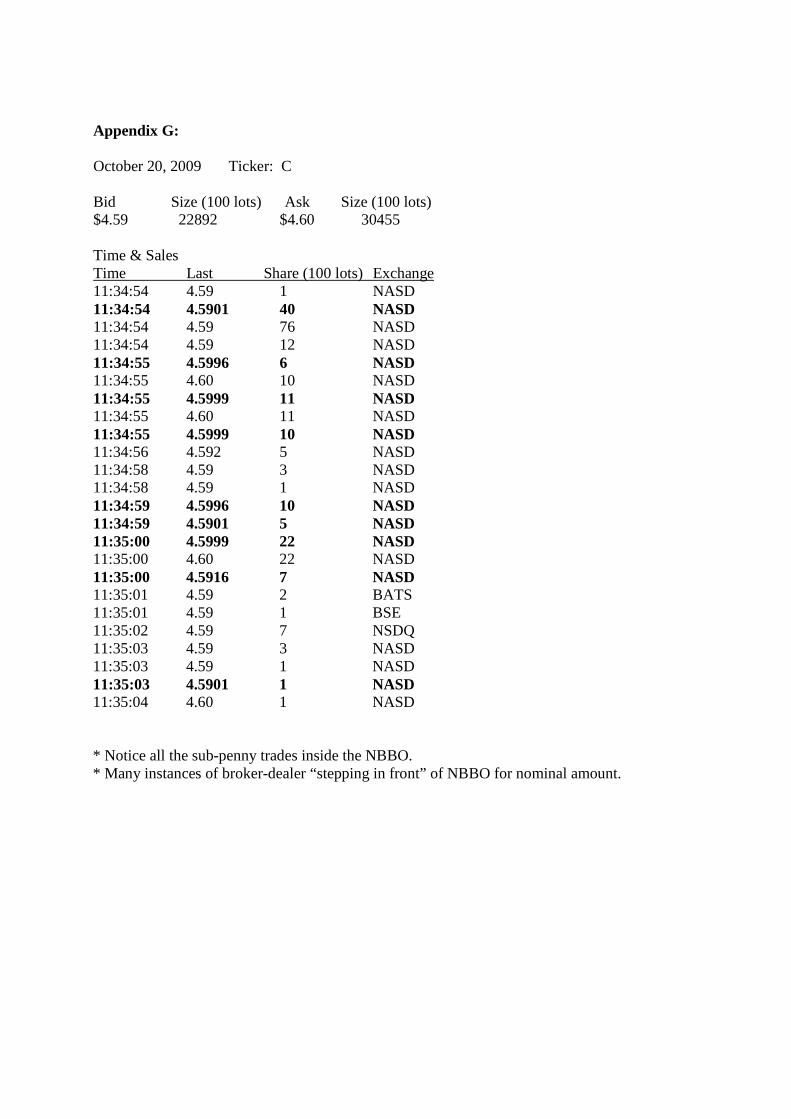
Appendix G:
October 20, 2009 Ticker: C
Bid Size (100 lots) Ask Size (100 lots) $4.59 22892 $4.60 30455
Time & Sales Time Last Share (100 lots) Exchange 11:34:54 4.59 1 NASD 11:34:54 4.5901 40 NASD 11:34:54 4.59 76 NASD 11:34:54 4.59 12 NASD 11:34:55 4.5996 6 NASD 11:34:55 4.60 10 NASD 11:34:55 4.5999 11 NASD 11:34:55 4.60 11 NASD 11:34:55 4.5999 10 NASD 11:34:56 4.592 5 NASD 11:34:58 4.59 3 NASD 11:34:58 4.59 1 NASD 11:34:59 4.5996 10 NASD 11:34:59 4.5901 5 NASD 11:35:00 4.5999 22 NASD 11:35:00 4.60 22 NASD 11:35:00 4.5916 7 NASD 11:35:01 4.59 2 BATS 11:35:01 4.59 1 BSE 11:35:02 4.59 7 NSDQ 11:35:03 4.59 3 NASD 11:35:03 4.59 1 NASD 11:35:03 4.5901 1 NASD 11:35:04 4.60 1 NASD
* Notice all the sub-penny trades inside the NBBO. * Many instances of broker-dealer “stepping in front” of NBBO for nominal amount.
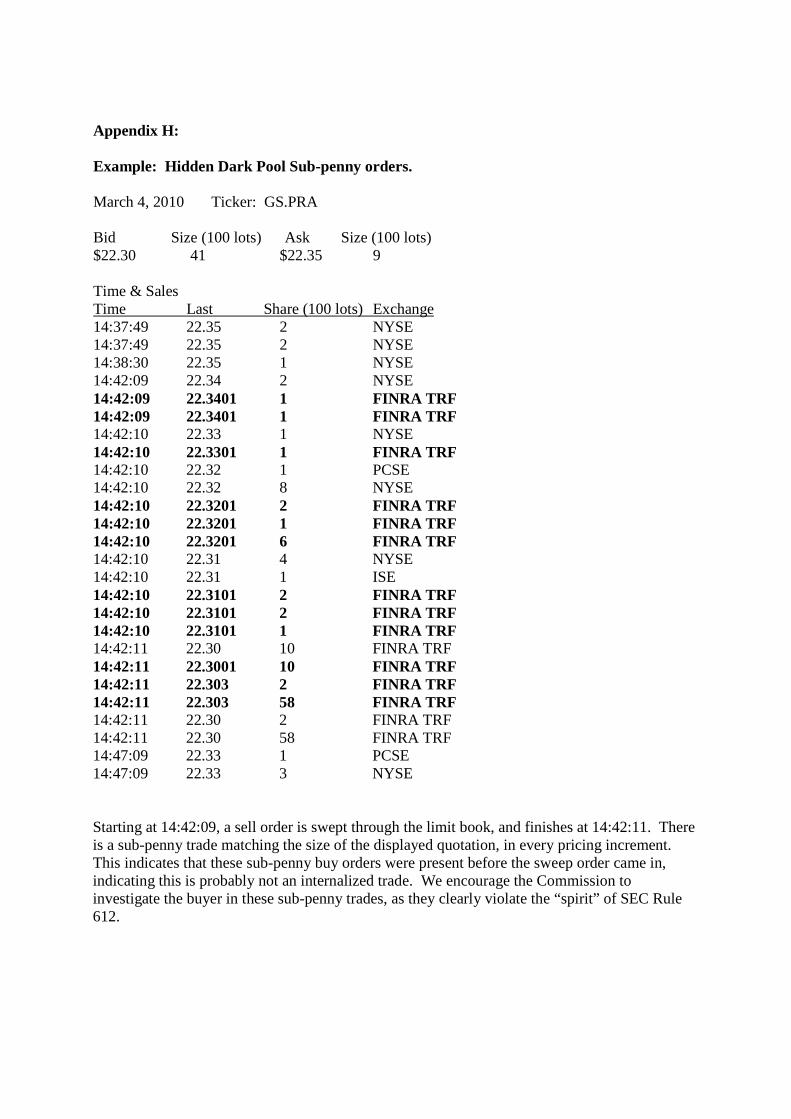
Appendix H:
Example: Hidden Dark Pool Sub-penny orders.
March 4, 2010 Ticker: GS.PRA
Bid Size (100 lots) Ask Size (100 lots) $22.30 41 $22.35 9
Time & Sales Time Last Share (100 lots) Exchange 14:37:49 22.35 2 NYSE 14:37:49 22.35 2 NYSE 14:38:30 22.35 1 NYSE 14:42:09 22.34 2 NYSE 14:42:09 22.3401 1 FINRA TRF 14:42:09 22.3401 1 FINRA TRF 14:42:10 22.33 1 NYSE 14:42:10 22.3301 1 FINRA TRF 14:42:10 22.32 1 PCSE 14:42:10 22.32 8 NYSE 14:42:10 22.3201 2 FINRA TRF 14:42:10 22.3201 1 FINRA TRF 14:42:10 22.3201 6 FINRA TRF 14:42:10 22.31 4 NYSE 14:42:10 22.31 1 ISE 14:42:10 22.3101 2 FINRA TRF 14:42:10 22.3101 2 FINRA TRF 14:42:10 22.3101 1 FINRA TRF 14:42:11 22.30 10 FINRA TRF 14:42:11 22.3001 10 FINRA TRF 14:42:11 22.303 2 FINRA TRF 14:42:11 22.303 58 FINRA TRF 14:42:11 22.30 2 FINRA TRF 14:42:11 22.30 58 FINRA TRF 14:47:09 22.33 1 PCSE 14:47:09 22.33 3 NYSE
Starting at 14:42:09, a sell order is swept through the limit book, and finishes at 14:42:11. There is a sub-penny trade matching the size of the displayed quotation, in every pricing increment. This indicates that these sub-penny buy orders were present before the sweep order came in, indicating this is probably not an internalized trade. We encourage the Commission to investigate the buyer in these sub-penny trades, as they clearly violate the “spirit” of SEC Rule 612.
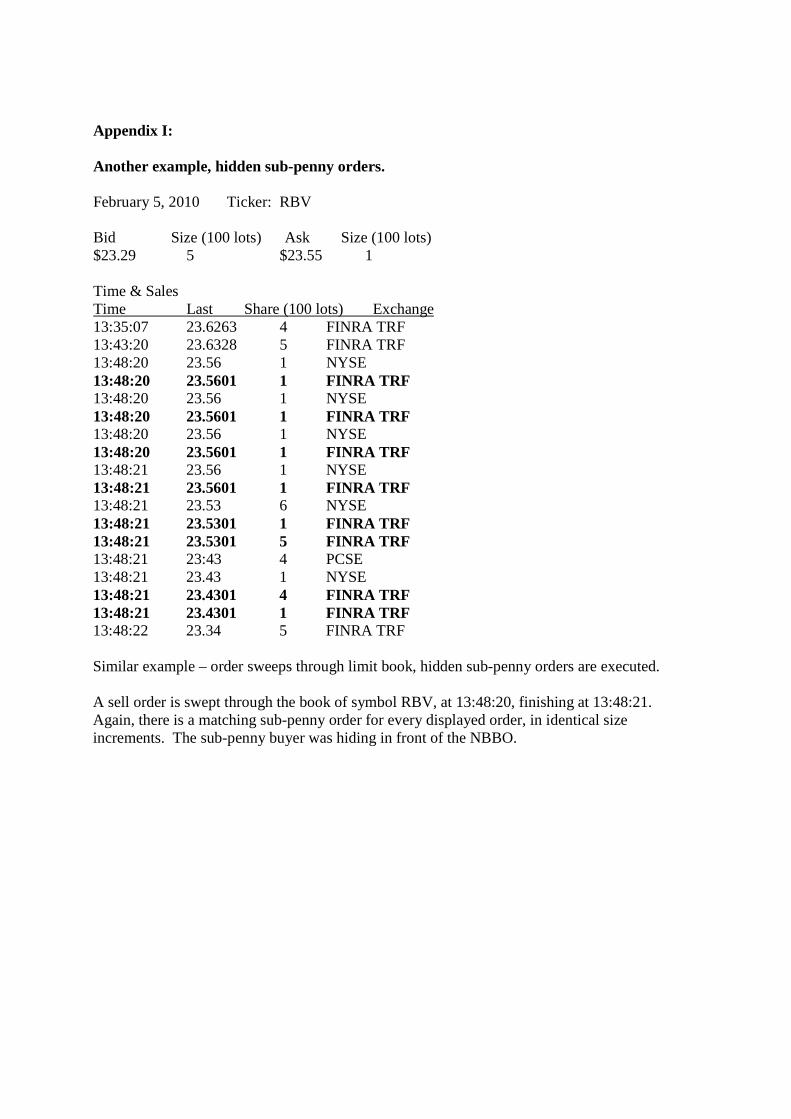
Appendix I:
Another example, hidden sub-penny orders.
February 5, 2010 Ticker: RBV
Bid Size (100 lots) Ask Size (100 lots) $23.29 5 $23.55 1
Time & Sales Time Last Share (100 lots) Exchange 13:35:07 23.6263 4 FINRA TRF 13:43:20 23.6328 5 FINRA TRF 13:48:20 23.56 1 NYSE 13:48:20 23.5601 1 FINRA TRF 13:48:20 23.56 1 NYSE 13:48:20 23.5601 1 FINRA TRF 13:48:20 23.56 1 NYSE 13:48:20 23.5601 1 FINRA TRF 13:48:21 23.56 1 NYSE 13:48:21 23.5601 1 FINRA TRF 13:48:21 23.53 6 NYSE 13:48:21 23.5301 1 FINRA TRF 13:48:21 23.5301 5 FINRA TRF 13:48:21 23:43 4 PCSE 13:48:21 23.43 1 NYSE 13:48:21 23.4301 4 FINRA TRF 13:48:21 23.4301 1 FINRA TRF 13:48:22 23.34 5 FINRA TRF
Similar example – order sweeps through limit book, hidden sub-penny orders are executed.
A sell order is swept through the book of symbol RBV, at 13:48:20, finishing at 13:48:21. Again, there is a matching sub-penny order for every displayed order, in identical size increments. The sub-penny buyer was hiding in front of the NBBO.
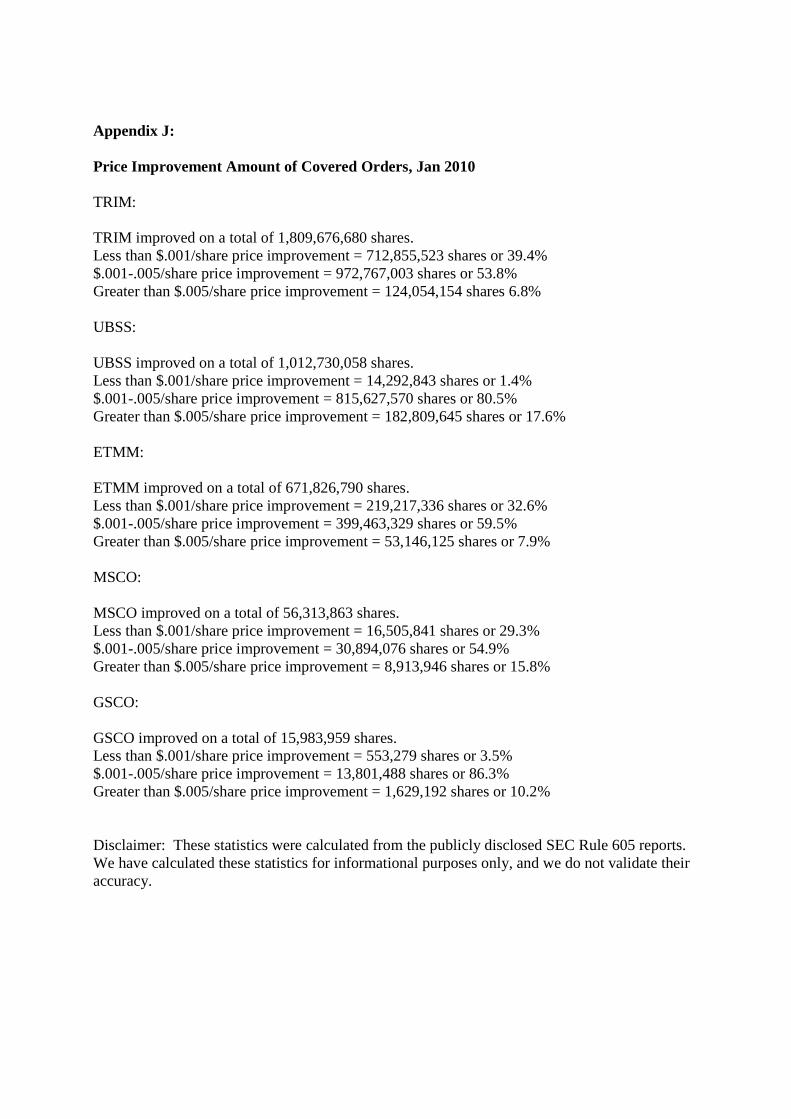
Appendix J:
Price Improvement Amount of Covered Orders, Jan 2010
TRIM:
TRIM improved on a total of 1,809,676,680 shares. Less than $.001/share price improvement = 712,855,523 shares or 39.4% $.001-.005/share price improvement = 972,767,003 shares or 53.8% Greater than $.005/share price improvement = 124,054,154 shares 6.8%
UBSS:
UBSS improved on a total of 1,012,730,058 shares. Less than $.001/share price improvement = 14,292,843 shares or 1.4% $.001-.005/share price improvement = 815,627,570 shares or 80.5% Greater than $.005/share price improvement = 182,809,645 shares or 17.6%
ETMM:
ETMM improved on a total of 671,826,790 shares. Less than $.001/share price improvement = 219,217,336 shares or 32.6% $.001-.005/share price improvement = 399,463,329 shares or 59.5% Greater than $.005/share price improvement = 53,146,125 shares or 7.9%
MSCO:
MSCO improved on a total of 56,313,863 shares. Less than $.001/share price improvement = 16,505,841 shares or 29.3% $.001-.005/share price improvement = 30,894,076 shares or 54.9% Greater than $.005/share price improvement = 8,913,946 shares or 15.8%
GSCO:
GSCO improved on a total of 15,983,959 shares. Less than $.001/share price improvement = 553,279 shares or 3.5% $.001-.005/share price improvement = 13,801,488 shares or 86.3% Greater than $.005/share price improvement = 1,629,192 shares or 10.2%
Disclaimer: These statistics were calculated from the publicly disclosed SEC Rule 605 reports. We have calculated these statistics for informational purposes only, and we do not validate their accuracy.

Undisplayed Trading Centers Compromising the NBBO.
Presented by:
Dennis Dick, CFA Trader Member of Bright Trading LLC Email: [email protected] Phone: Will provide through email
correspondence.
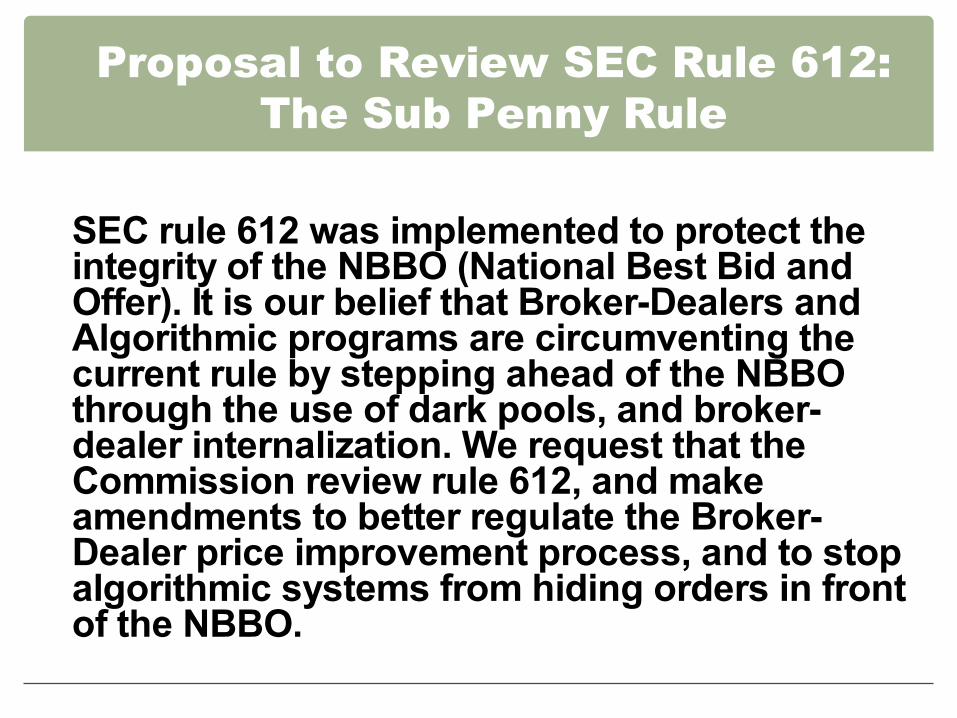
Proposal to Review SEC Rule 612: The Sub Penny Rule
SEC rule 612 was implemented to protect theintegrity of the NBBO (National Best Bid andOffer). It is our belief that Broker-Dealers andAlgorithmic programs are circumventing thecurrent rule by stepping ahead of the NBBOthrough the use of dark pools, and broker-dealer internalization. We request that theCommission review rule 612, and makeamendments to better regulate the Broker-Dealer price improvement process, and to stopalgorithmic systems from hiding orders in frontof the NBBO.
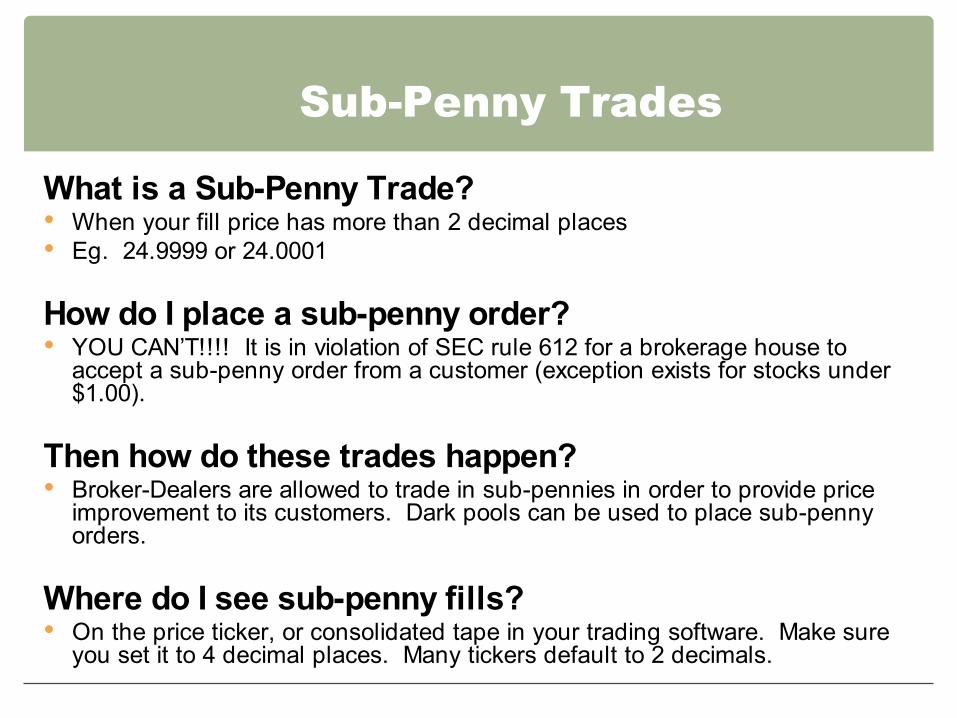
Sub-Penny Trades
What is a Sub-Penny Trade? When your fill price has more than 2 decimal places Eg. 24.9999 or 24.0001
How do I place a sub-penny order? YOU CAN’T!!!! It is in violation of SEC rule 612 for a brokerage house to
accept a sub-penny order from a customer (exception exists for stocks under$1.00).
Then how do these trades happen? Broker-Dealers are allowed to trade in sub-pennies in order to provide price
improvement to its customers. Dark pools can be used to place sub-penny orders.
Where do I see sub-penny fills? On the price ticker, or consolidated tape in your trading software. Make sure
you set it to 4 decimal places. Many tickers default to 2 decimals.
Sub-Pennying
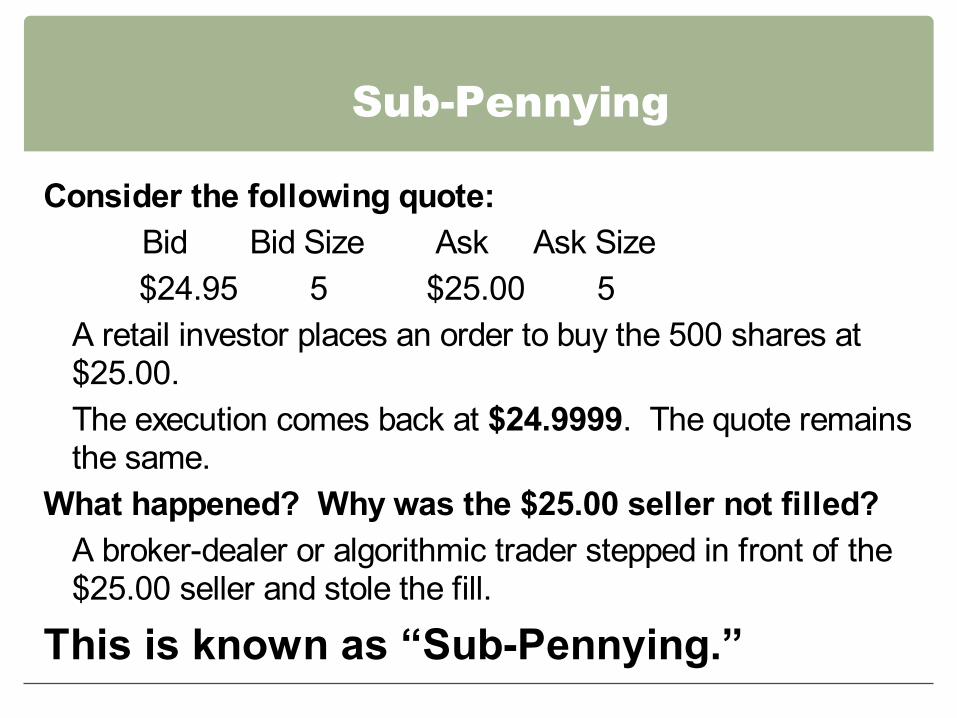
Consider the following quote: Bid Bid Size Ask Ask Size $24.95 5 $25.00 5
A retail investor places an order to buy the 500 shares at $25.00. The execution comes back at $24.9999. The quote remains the same.
What happened? Why was the $25.00 seller not filled? A broker-dealer or algorithmic trader stepped in front of the $25.00 seller and stole the fill.
This is known as “Sub-Pennying.”
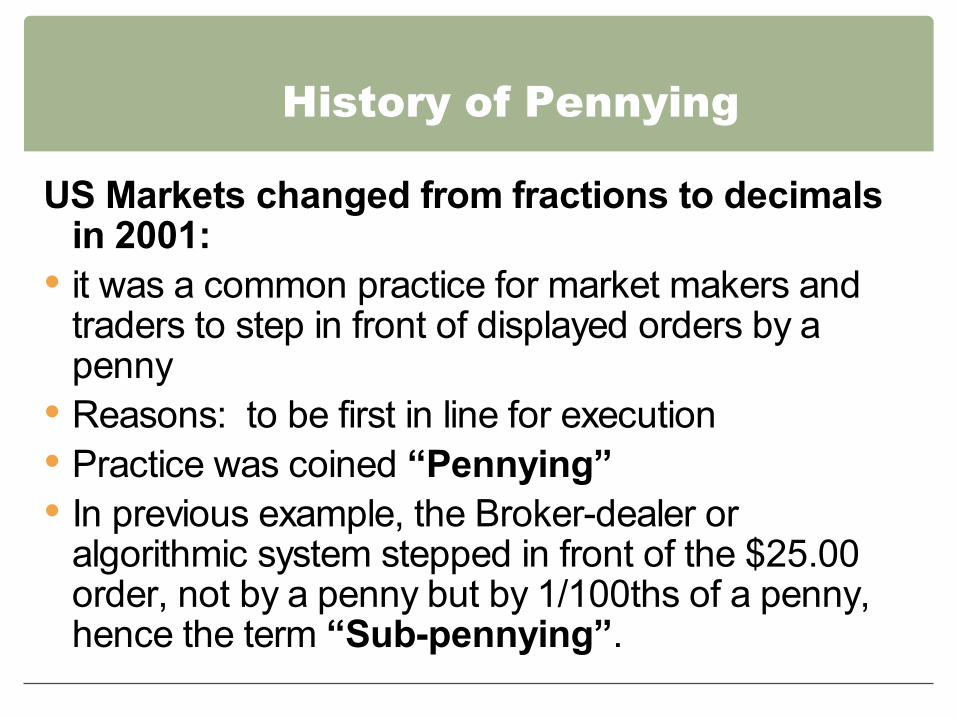
History of Pennying
US Markets changed from fractions to decimalsin 2001:
it was a common practice for market makers andtraders to step in front of displayed orders by a penny
Reasons: to be first in line for execution Practice was coined “Pennying” In previous example, the Broker-dealer or
algorithmic system stepped in front of the $25.00order, not by a penny but by 1/100ths of a penny,hence the term “Sub-pennying”.
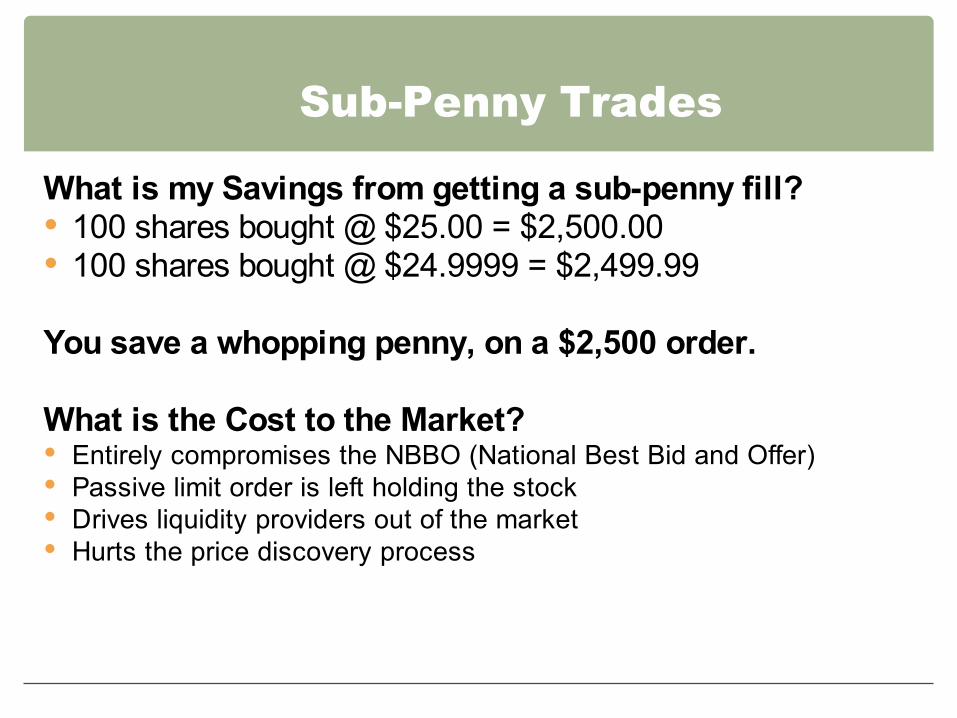
Sub-Penny Trades
What is my Savings from getting a sub-penny fill?� 100 shares bought @ $25.00 = $2,500.00 100 shares bought @ $24.9999 = $2,499.99
You save a whopping penny, on a $2,500 order.
What is the Cost to the Market? Entirely compromises the NBBO (National Best Bid and Offer) Passive limit order is left holding the stock Drives liquidity providers out of the market Hurts the price discovery process
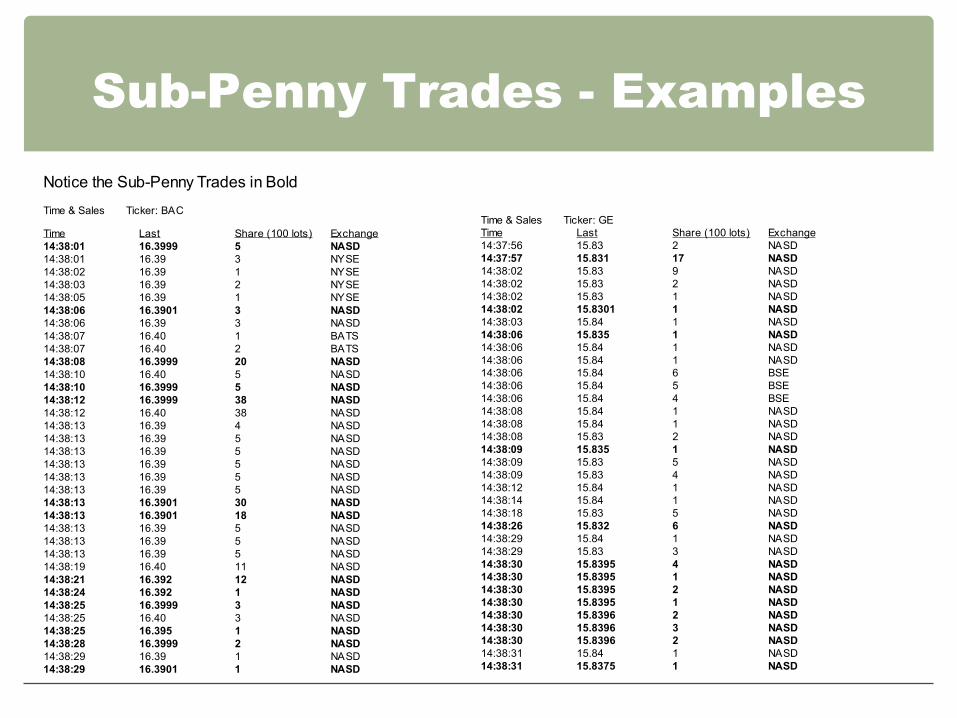
Sub-Penny Trades - Examples Notice the Sub-Penny Trades in Bold
Time & Sales Ticker: BAC Time & Sales Ticker: GE
Time 14:38:01
Last 16.3999
Share (100 lots) 5
Exchange NASD
Time 14:37:56
Last 15.83
Share (100 lots) 2
Exchange NASD
14:38:01 16.39 3 NYSE 14:37:57 15.831 17 NASD 14:38:02 16.39 1 NYSE 14:38:02 15.83 9 NASD 14:38:03 16.39 2 NYSE 14:38:02 15.83 2 NASD 14:38:05 16.39 1 NYSE 14:38:02 15.83 1 NASD 14:38:06 16.3901 3 NASD 14:38:02 15.8301 1 NASD 14:38:06 16.39 3 NASD 14:38:03 15.84 1 NASD 14:38:07 16.40 1 BATS 14:38:06 15.835 1 NASD 14:38:07 16.40 2 BATS 14:38:06 15.84 1 NASD 14:38:08 16.3999 20 NASD 14:38:06 15.84 1 NASD 14:38:10 16.40 5 NASD 14:38:06 15.84 6 BSE 14:38:10 16.3999 5 NASD 14:38:06 15.84 5 BSE 14:38:12 16.3999 38 NASD 14:38:06 15.84 4 BSE 14:38:12 16.40 38 NASD 14:38:08 15.84 1 NASD 14:38:13 16.39 4 NASD 14:38:08 15.84 1 NASD 14:38:13 16.39 5 NASD 14:38:08 15.83 2 NASD 14:38:13 16.39 5 NASD 14:38:09 15.835 1 NASD 14:38:13 16.39 5 NASD 14:38:09 15.83 5 NASD 14:38:13 16.39 5 NASD 14:38:09 15.83 4 NASD 14:38:13 16.39 5 NASD 14:38:12 15.84 1 NASD 14:38:13 16.3901 30 NASD 14:38:14 15.84 1 NASD 14:38:13 16.3901 18 NASD 14:38:18 15.83 5 NASD 14:38:13 16.39 5 NASD 14:38:26 15.832 6 NASD 14:38:13 16.39 5 NASD 14:38:29 15.84 1 NASD 14:38:13 16.39 5 NASD 14:38:29 15.83 3 NASD 14:38:19 16.40 11 NASD 14:38:30 15.8395 4 NASD 14:38:21 16.392 12 NASD 14:38:30 15.8395 1 NASD 14:38:24 16.392 1 NASD 14:38:30 15.8395 2 NASD 14:38:25 16.3999 3 NASD 14:38:30 15.8395 1 NASD 14:38:25 16.40 3 NASD 14:38:30 15.8396 2 NASD 14:38:25 16.395 1 NASD 14:38:30 15.8396 3 NASD 14:38:28 16.3999 2 NASD 14:38:30 15.8396 2 NASD 14:38:29 16.39 1 NASD 14:38:31 15.84 1 NASD 14:38:29 16.3901 1 NASD 14:38:31 15.8375 1 NASD
Sub-pennying in Thin Issues
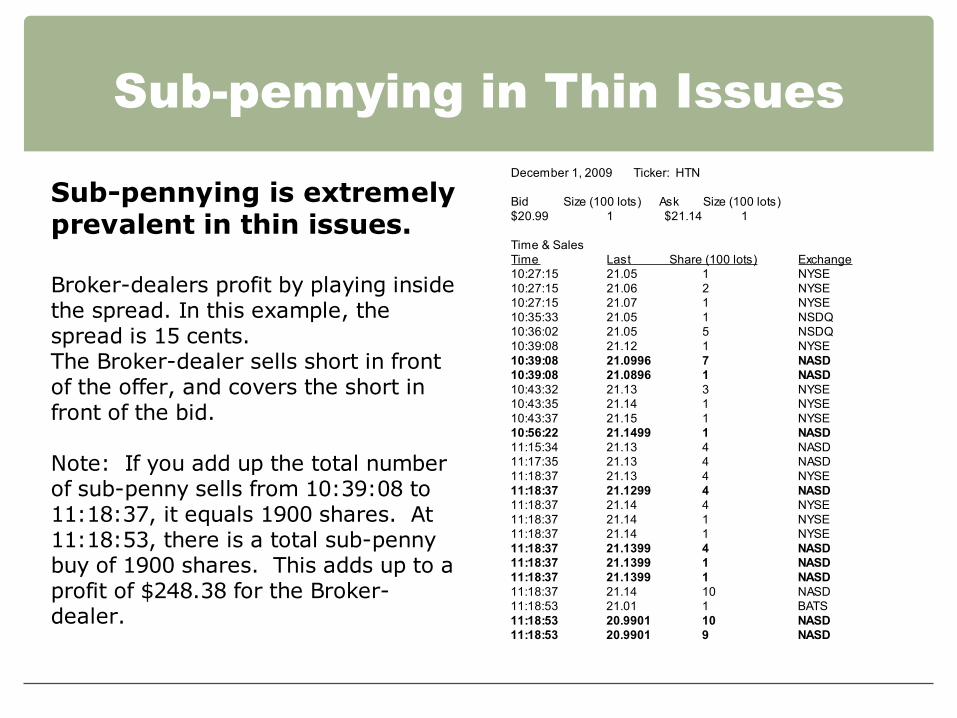
Sub-pennying is extremely prevalent in thin issues.
Broker-dealers profit by playing inside the spread. In this example, the spread is 15 cents. The Broker-dealer sells short in front of the offer, and covers the short in front of the bid.
Note: If you add up the total number of sub-penny sells from 10:39:08 to 11:18:37, it equals 1900 shares. At 11:18:53, there is a total sub-penny buy of 1900 shares. This adds up to a profit of $248.38 for the Broker-dealer.
December 1, 2009 Ticker: HTN
Bid Size (100 lots) Ask Size (100 lots) $20.99 1 $21.14 1
Time & Sales Time Last Share (100 lots) Exchange 10:27:15 21.05 1 NYSE 10:27:15 21.06 2 NYSE 10:27:15 21.07 1 NYSE 10:35:33 21.05 1 NSDQ 10:36:02 21.05 5 NSDQ 10:39:08 21.12 1 NYSE 10:39:08 21.0996 7 NASD 10:39:08 21.0896 1 NASD 10:43:32 21.13 3 NYSE 10:43:35 21.14 1 NYSE 10:43:37 21.15 1 NYSE 10:56:22 21.1499 1 NASD 11:15:34 21.13 4 NASD 11:17:35 21.13 4 NASD 11:18:37 21.13 4 NYSE 11:18:37 21.1299 4 NASD 11:18:37 21.14 4 NYSE 11:18:37 21.14 1 NYSE 11:18:37 21.14 1 NYSE 11:18:37 21.1399 4 NASD 11:18:37 21.1399 1 NASD 11:18:37 21.1399 1 NASD 11:18:37 21.14 10 NASD 11:18:53 21.01 1 BATS 11:18:53 20.9901 10 NASD 11:18:53 20.9901 9 NASD
Experiences with Sub-pennying
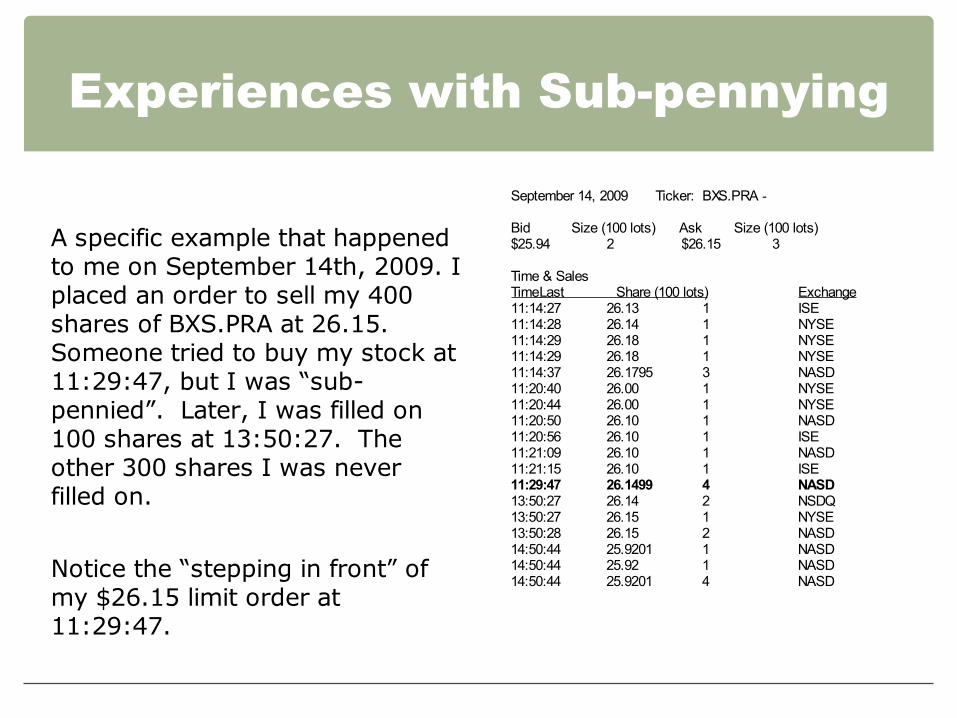
A specific example that happened to me on September 14th, 2009. I placed an order to sell my 400 shares of BXS.PRA at 26.15. Someone tried to buy my stock at 11:29:47, but I was “sub-pennied”. Later, I was filled on 100 shares at 13:50:27. The other 300 shares I was never filled on.
Notice the “stepping in front” of my $26.15 limit order at 11:29:47.
September 14, 2009 Ticker: BXS.PRA
Bid Size (100 lots) Ask Size (100 lots) $25.94 2 $26.15 3
Time & Sales TimeLast Share (100 lots) Exchange 11:14:27 26.13 1 ISE 11:14:28 26.14 1 NYSE 11:14:29 26.18 1 NYSE 11:14:29 26.18 1 NYSE 11:14:37 26.1795 3 NASD 11:20:40 26.00 1 NYSE 11:20:44 26.00 1 NYSE 11:20:50 26.10 1 NASD 11:20:56 26.10 1 ISE 11:21:09 26.10 1 NASD 11:21:15 26.10 1 ISE 11:29:47 26.1499 4 NASD 13:50:27 26.14 2 NSDQ 13:50:27 26.15 1 NYSE 13:50:28 26.15 2 NASD 14:50:44 25.9201 1 NASD 14:50:44 25.92 1 NASD 14:50:44 25.9201 4 NASD
Another example
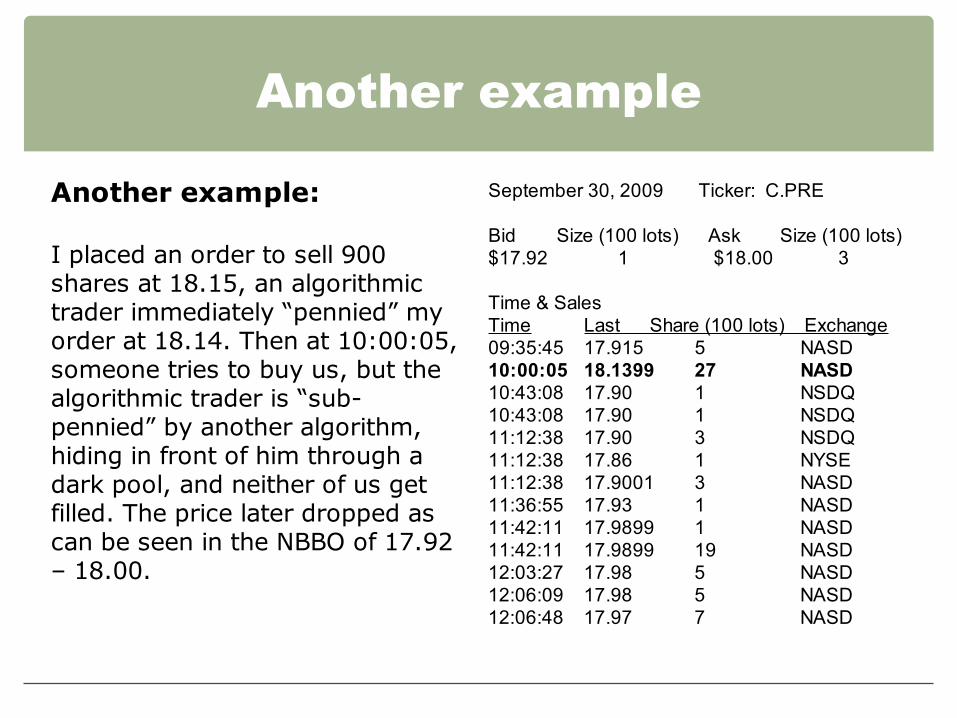
Another example:
I placed an order to sell 900 shares at 18.15, an algorithmic trader immediately “pennied” my order at 18.14. Then at 10:00:05, someone tries to buy us, but the algorithmic trader is “sub-pennied” by another algorithm, hiding in front of him through a dark pool, and neither of us get filled. The price later dropped as can be seen in the NBBO of 17.92 – 18.00.
September 30, 2009 Ticker: C.PRE
Bid Size (100 lots) Ask Size (100 lots) $17.92 1 $18.00 3
Time & Sales Time Last Share (100 lots) Exchange 09:35:45 17.915 5 NASD 10:00:05 18.1399 27 NASD 10:43:08 17.90 1 NSDQ 10:43:08 17.90 1 NSDQ 11:12:38 17.90 3 NSDQ 11:12:38 17.86 1 NYSE 11:12:38 17.9001 3 NASD 11:36:55 17.93 1 NASD 11:42:11 17.9899 1 NASD 11:42:11 17.9899 19 NASD 12:03:27 17.98 5 NASD 12:06:09 17.98 5 NASD 12:06:48 17.97 7 NASD
More examples
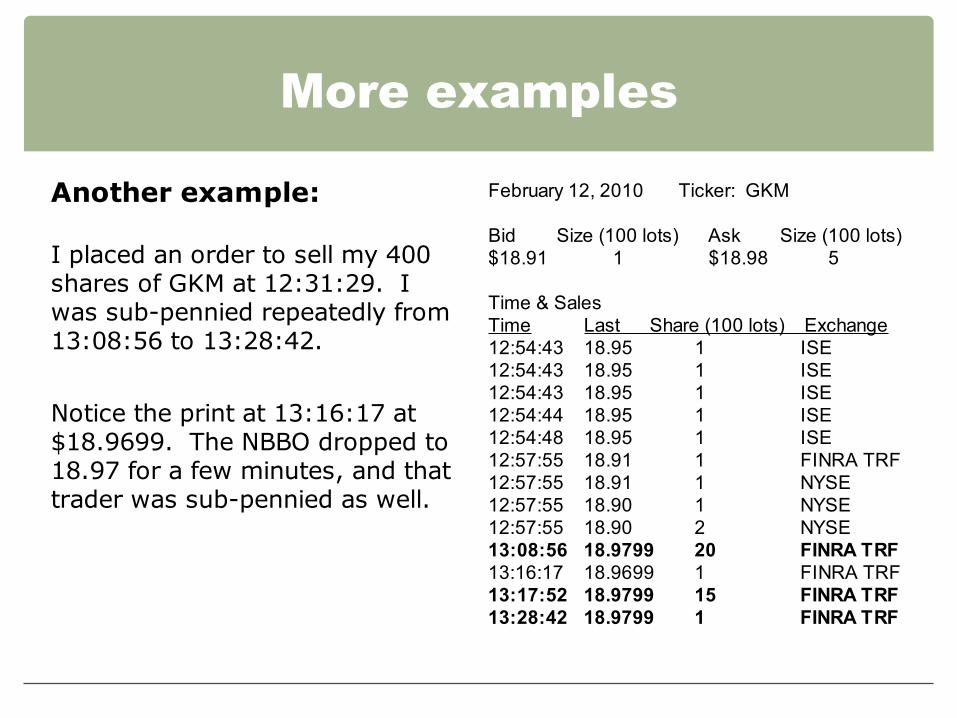
Another example:
I placed an order to sell my 400 shares of GKM at 12:31:29. I was sub-pennied repeatedly from 13:08:56 to 13:28:42.
Notice the print at 13:16:17 at $18.9699. The NBBO dropped to 18.97 for a few minutes, and that trader was sub-pennied as well.
February 12, 2010 Ticker: GKM
Bid Size (100 lots) Ask Size (100 lots) $18.91 1 $18.98 5
Time & Sales Time Last Share (100 lots) Exchange 12:54:43 18.95 1 ISE 12:54:43 18.95 1 ISE 12:54:43 18.95 1 ISE 12:54:44 18.95 1 ISE 12:54:48 18.95 1 ISE 12:57:55 18.91 1 FINRA TRF 12:57:55 18.91 1 NYSE 12:57:55 18.90 1 NYSE 12:57:55 18.90 2 NYSE 13:08:56 18.9799 20 FINRA TRF 13:16:17 18.9699 1 FINRA TRF 13:17:52 18.9799 15 FINRA TRF 13:28:42 18.9799 1 FINRA TRF
More examples
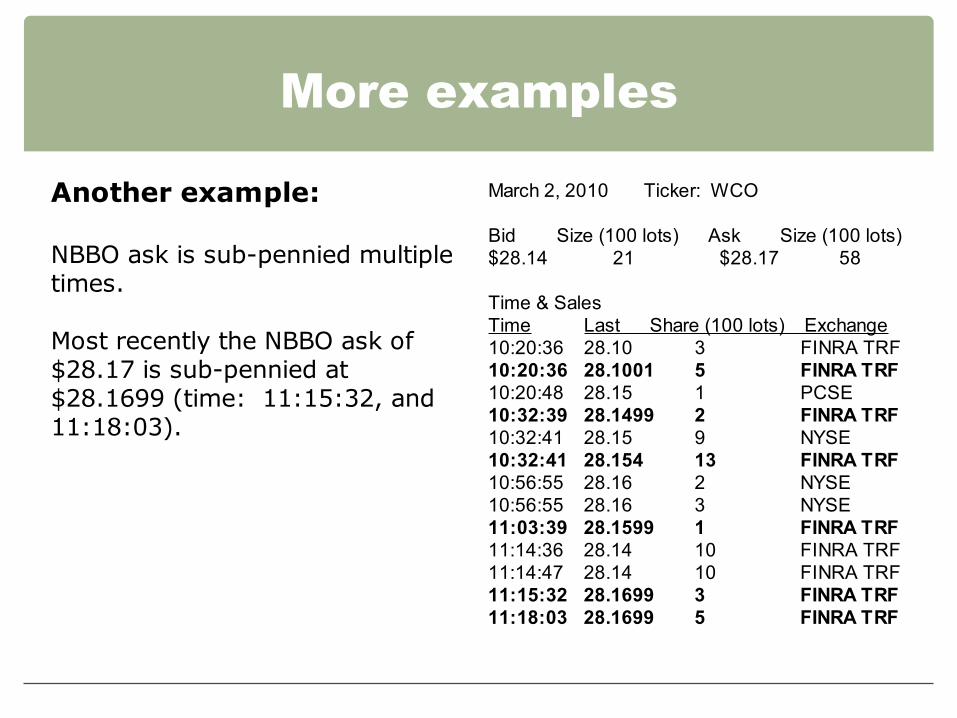
Another example:
NBBO ask is sub-pennied multiple times.
Most recently the NBBO ask of $28.17 is sub-pennied at $28.1699 (time: 11:15:32, and 11:18:03).
March 2, 2010 Ticker: WCO
Bid Size (100 lots) Ask Size (100 lots) $28.14 21 $28.17 58
Time & Sales Time Last Share (100 lots) Exchange 10:20:36 28.10 3 FINRA TRF 10:20:36 28.1001 5 FINRA TRF 10:20:48 28.15 1 PCSE 10:32:39 28.1499 2 FINRA TRF 10:32:41 28.15 9 NYSE 10:32:41 28.154 13 FINRA TRF 10:56:55 28.16 2 NYSE 10:56:55 28.16 3 NYSE 11:03:39 28.1599 1 FINRA TRF 11:14:36 28.14 10 FINRA TRF 11:14:47 28.14 10 FINRA TRF 11:15:32 28.1699 3 FINRA TRF 11:18:03 28.1699 5 FINRA TRF
Broker-Dealers Profit by Capturing the Spread
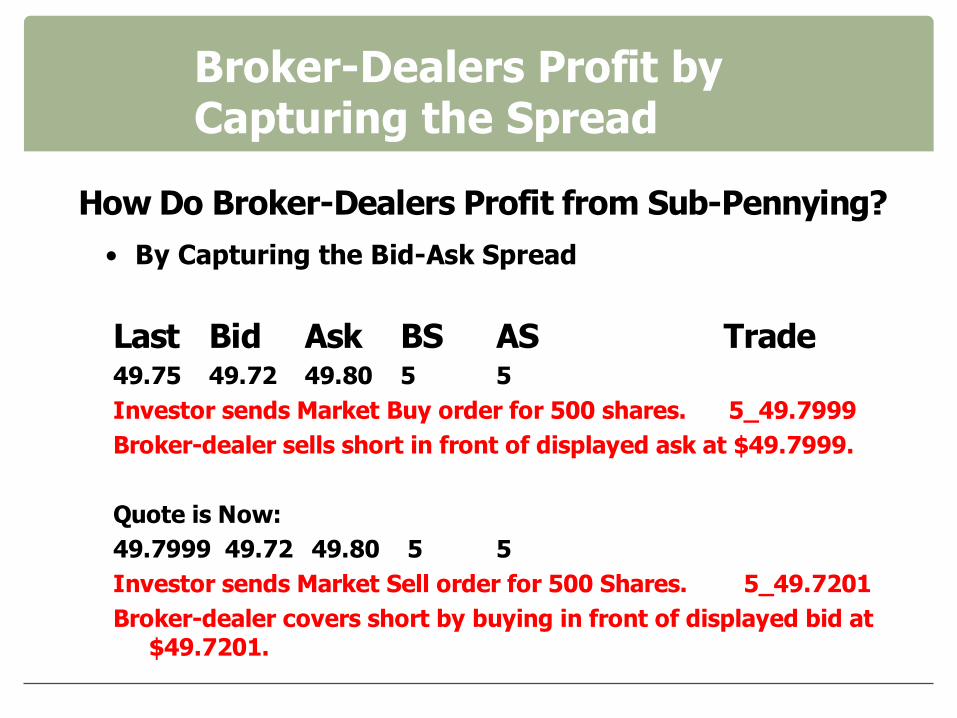
How Do Broker-Dealers Profit from Sub-Pennying?�
• By Capturing the Bid-Ask Spread
Last Bid Ask BS AS Trade 49.75 49.72 49.80 5 5 Investor sends Market Buy order for 500 shares. 5_49.7999�
Broker-dealer sells short in front of displayed ask at $49.7999.�
Quote is Now:�49.7999 49.72 49.80 5 5�
Investor sends Market Sell order for 500 Shares. 5_49.7201 Broker-dealer covers short by buying in front of displayed bid at
$49.7201.
Profit to Broker-Dealer
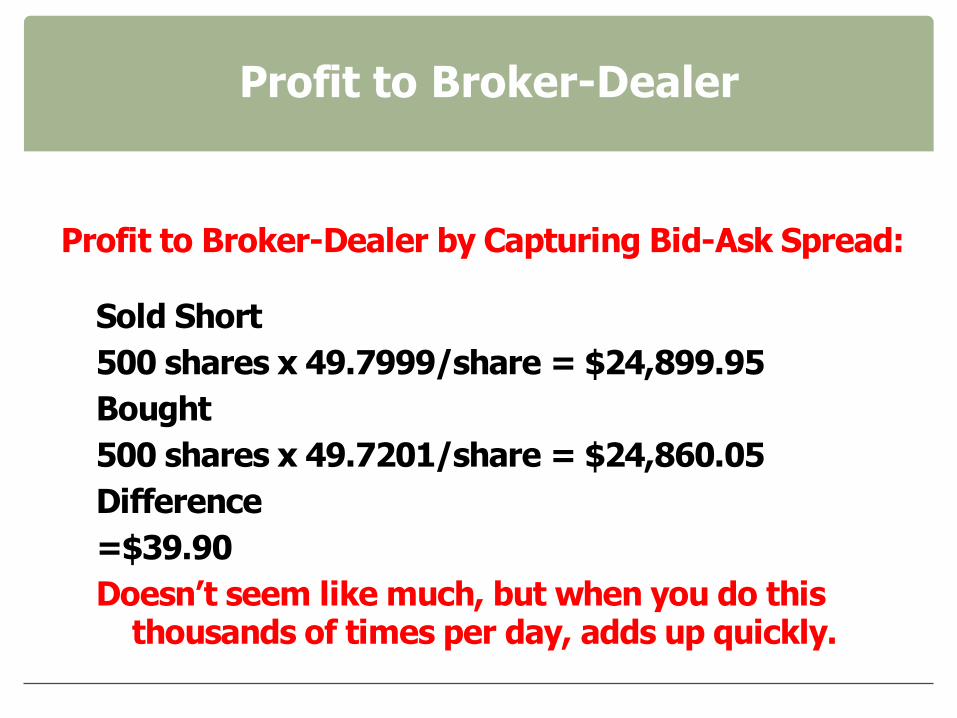
Profit to Broker-Dealer by Capturing Bid-Ask Spread:�
Sold Short�
500 shares x 49.7999/share = $24,899.95�Bought�
500 shares x 49.7201/share = $24,860.05�
Difference�
=$39.90�
Doesn’t seem like much, but when you do this thousands of times per day, adds up quickly.
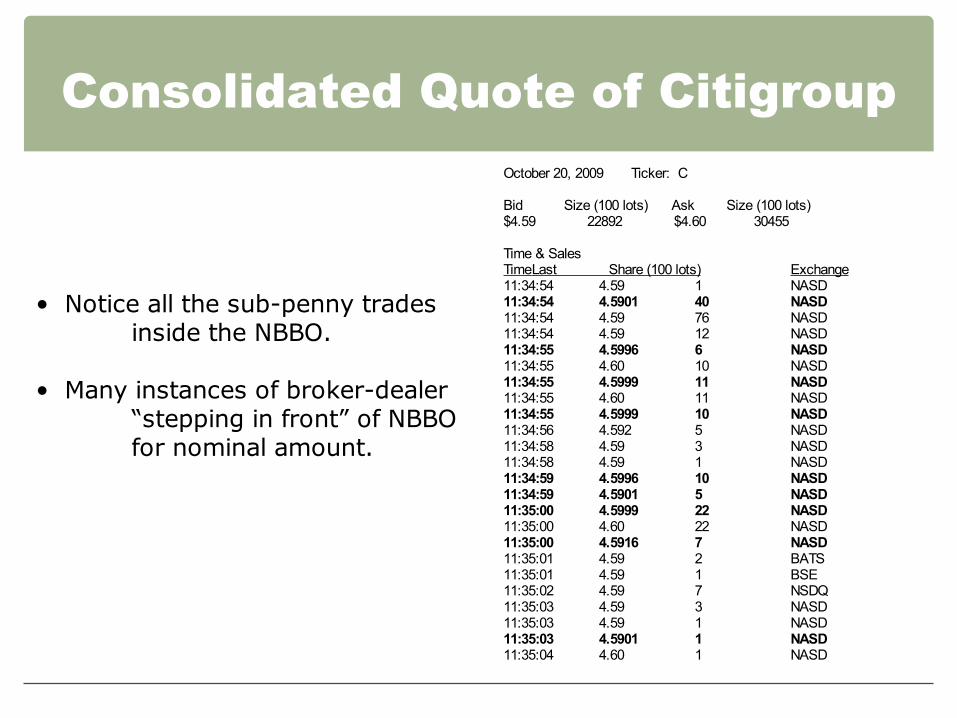
Consolidated Quote of Citigroup October 20, 2009 Ticker: C
Bid Size (100 lots) Ask Size (100 lots) $4.59 22892 $4.60 30455
Time & Sales TimeLast Share (100 lots) Exchange 11:34:54 4.59 1 NASD 11:34:54 4.5901 40 NASD • Notice all the sub-penny trades 11:34:54 4.59 76 NASD
inside the NBBO. 11:34:54 4.59 12 NASD 11:34:55 4.5996 6 NASD 11:34:55 4.60 10 NASD 11:34:55 4.5999 11 NASD • Many instances of broker-dealer 11:34:55 4.60 11 NASD 11:34:55 4.5999 10 NASD “stepping in front” of NBBO 11:34:56 4.592 5 NASD 11:34:58 4.59 3 NASD for nominal amount. 11:34:58 4.59 1 NASD 11:34:59 4.5996 10 NASD 11:34:59 4.5901 5 NASD 11:35:00 4.5999 22 NASD 11:35:00 4.60 22 NASD 11:35:00 4.5916 7 NASD 11:35:01 4.59 2 BATS 11:35:01 4.59 1 BSE 11:35:02 4.59 7 NSDQ 11:35:03 4.59 3 NASD 11:35:03 4.59 1 NASD 11:35:03 4.5901 1 NASD 11:35:04 4.60 1 NASD
Citigroup Sub-Penny Profits
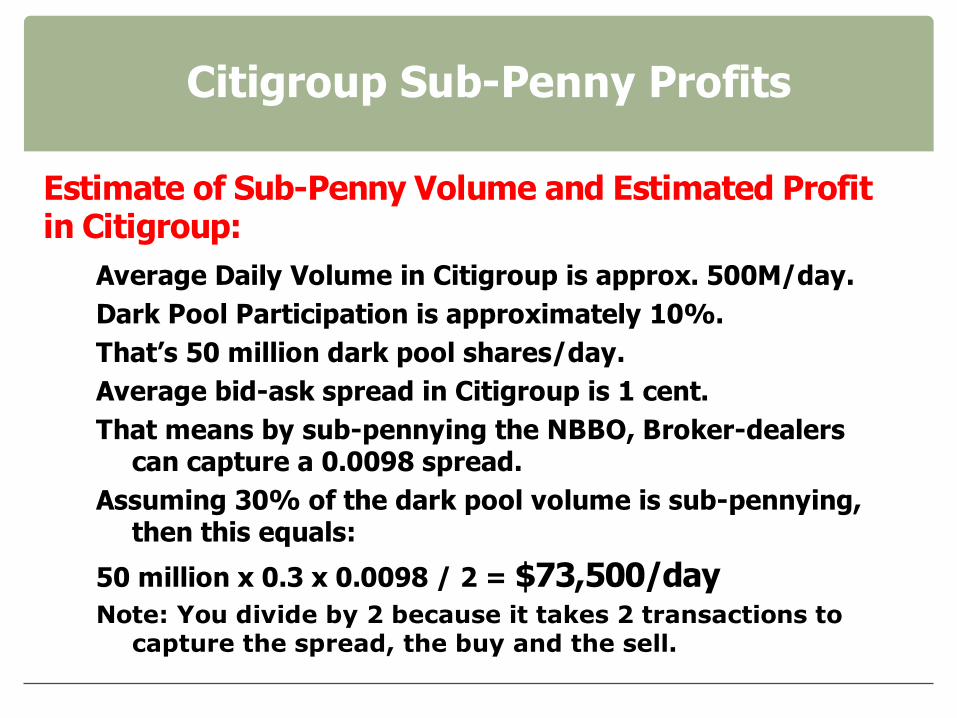
Estimate of Sub-Penny Volume and Estimated Profit in Citigroup:
Average Daily Volume in Citigroup is approx. 500M/day.�Dark Pool Participation is approximately 10%.�That’s 50 million dark pool shares/day.�Average bid-ask spread in Citigroup is 1 cent.�That means by sub-pennying the NBBO, Broker-dealers�
can capture a 0.0098 spread. Assuming 30% of the dark pool volume is sub-pennying,
then this equals:
50 million x 0.3 x 0.0098 / 2 = $73,500/day Note: You divide by 2 because it takes 2 transactions to
capture the spread, the buy and the sell.
A Multi-Billion Dollar Scandal!!
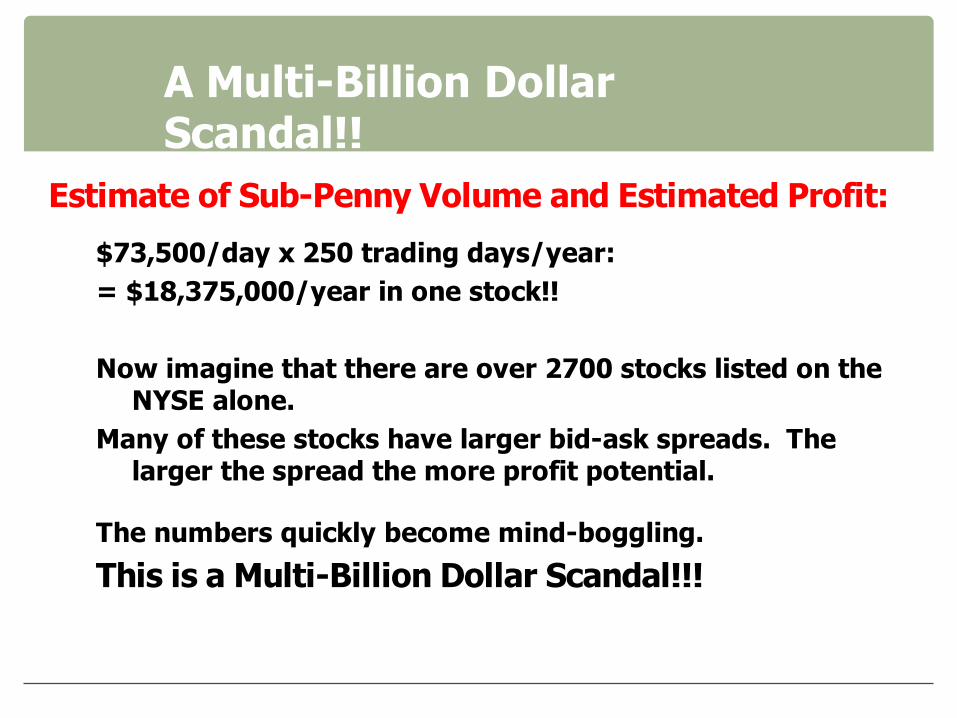
Estimate of Sub-Penny Volume and Estimated Profit:�
$73,500/day x 250 trading days/year:�= $18,375,000/year in one stock!!�
Now imagine that there are over 2700 stocks listed on the NYSE alone.
Many of these stocks have larger bid-ask spreads. The larger the spread the more profit potential.
The numbers quickly become mind-boggling.�
This is a Multi-Billion Dollar Scandal!!!�

You are the Victim!
Multi-Billion Dollar Scandal, Who Loses?
When a broker-dealer is allowed to intentionally step in front of the NBBO for a nominal amount and take a fill away from the displayed liquidity provider, the victim is the person who was displaying the liquidity, the person who was on the NBBO (National Best Bid and Offer).
This is money stolen from the NBBO. It is investors and traders that make up the NBBO. So this money is stolen from YOU!!!
SEC Intervention
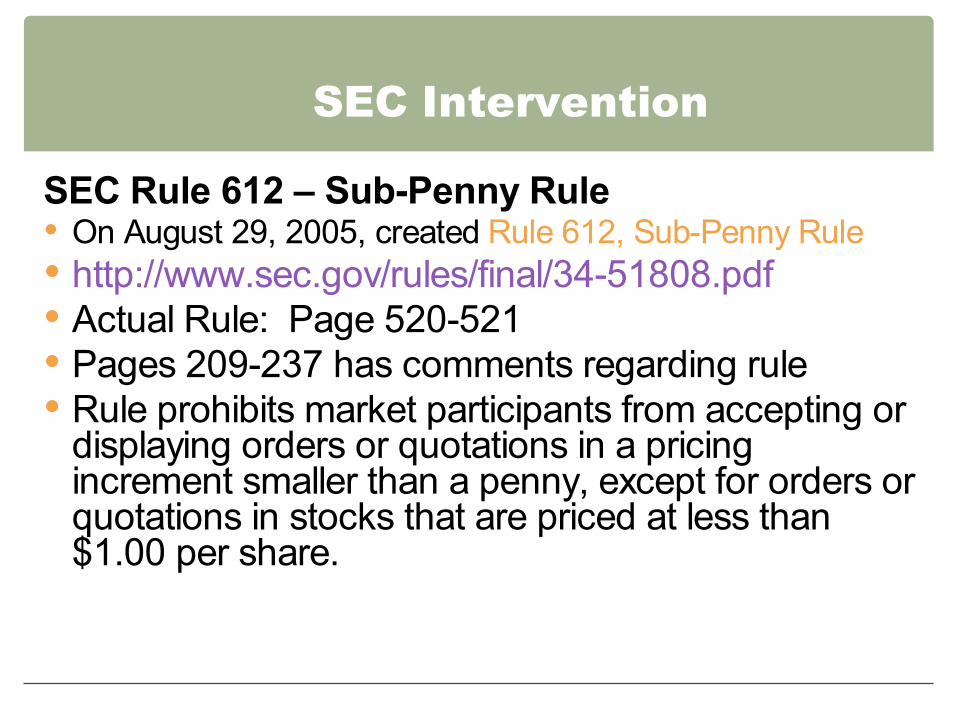
SEC Rule 612 – Sub-Penny Rule On August 29, 2005, created Rule 612, Sub-Penny Rule http://www.sec.gov/rules/final/34-51808.pdf Actual Rule: Page 520-521 Pages 209-237 has comments regarding rule Rule prohibits market participants from accepting or
displaying orders or quotations in a pricingincrement smaller than a penny, except for orders orquotations in stocks that are priced at less than$1.00 per share.
SEC Intervention
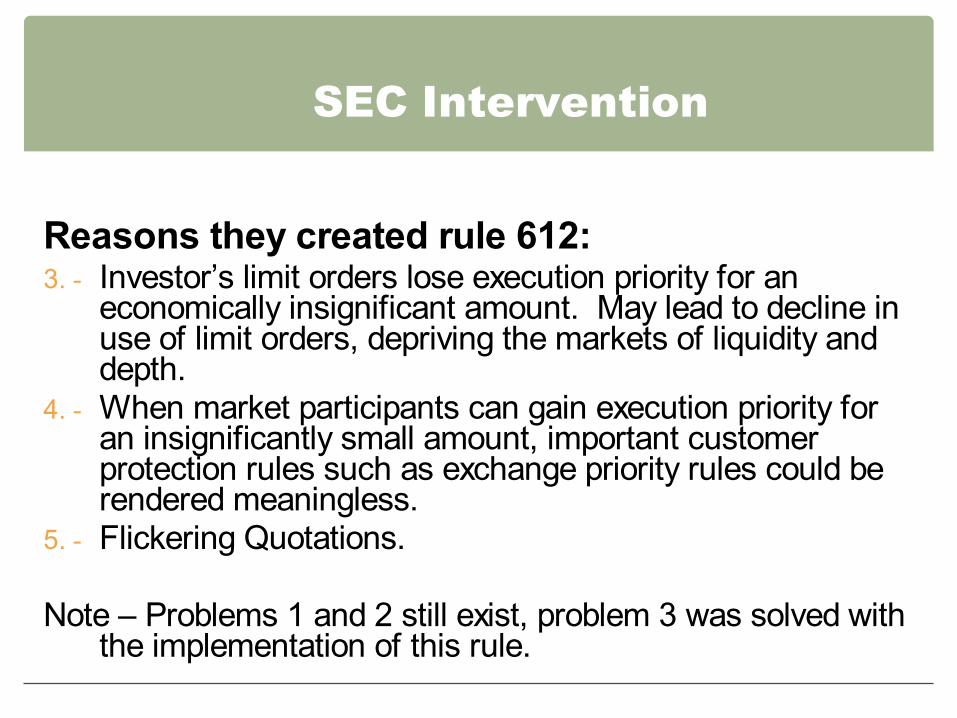
Reasons they created rule 612: 3. Investor’s limit orders lose execution priority for an
economically insignificant amount. May lead to decline inuse of limit orders, depriving the markets of liquidity anddepth.
4. When market participants can gain execution priority foran insignificantly small amount, important customerprotection rules such as exchange priority rules could berendered meaningless.
5. Flickering Quotations.
Note – Problems 1 and 2 still exist, problem 3 was solved withthe implementation of this rule.
Problems with Rule 612
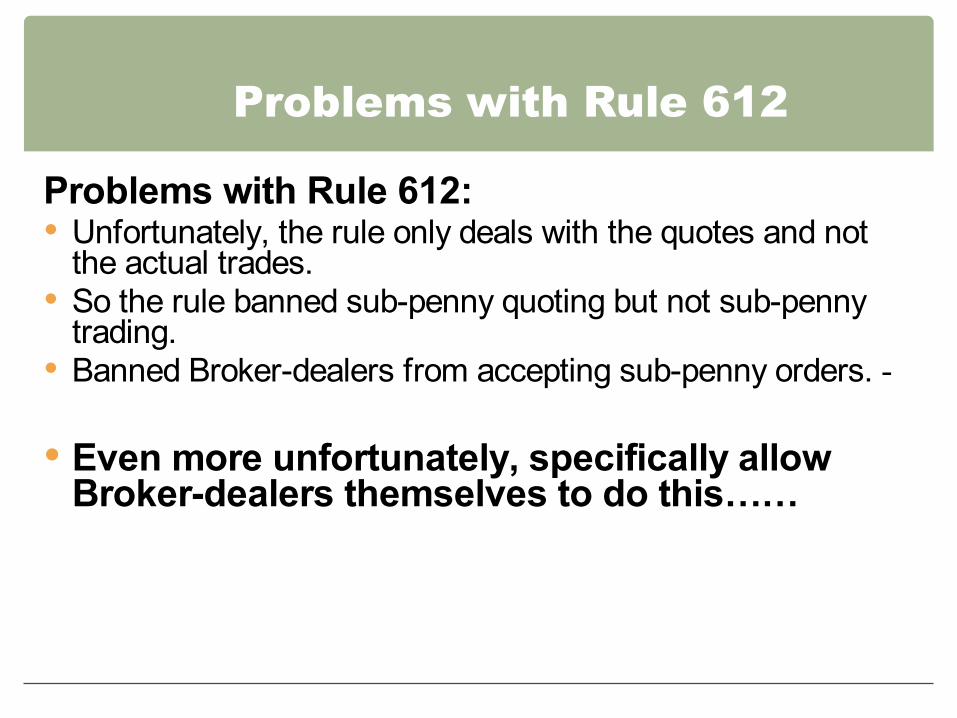
Problems with Rule 612: Unfortunately, the rule only deals with the quotes and not
the actual trades. So the rule banned sub-penny quoting but not sub-penny
trading. Banned Broker-dealers from accepting sub-penny orders.
Even more unfortunately, specifically allowBroker-dealers themselves to do this……�
SEC rule 612 – SEC comments
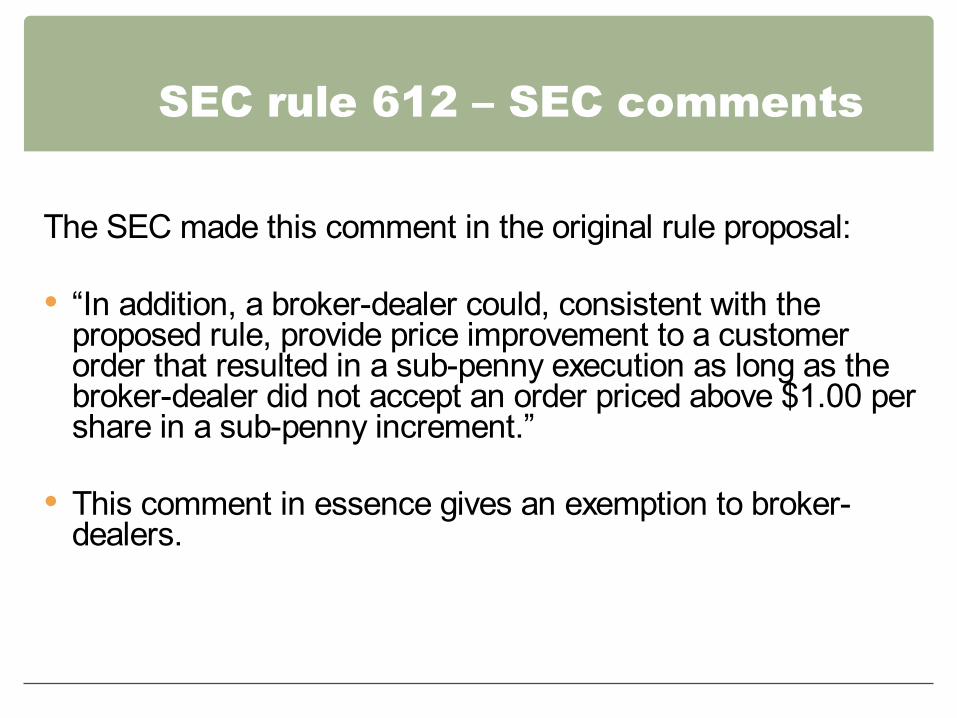
The SEC made this comment in the original rule proposal:
“In addition, a broker-dealer could, consistent with theproposed rule, provide price improvement to a customerorder that resulted in a sub-penny execution as long as thebroker-dealer did not accept an order priced above $1.00 pershare in a sub-penny increment.”
This comment in essence gives an exemption to broker-dealers.
Hiding in Dark Pools
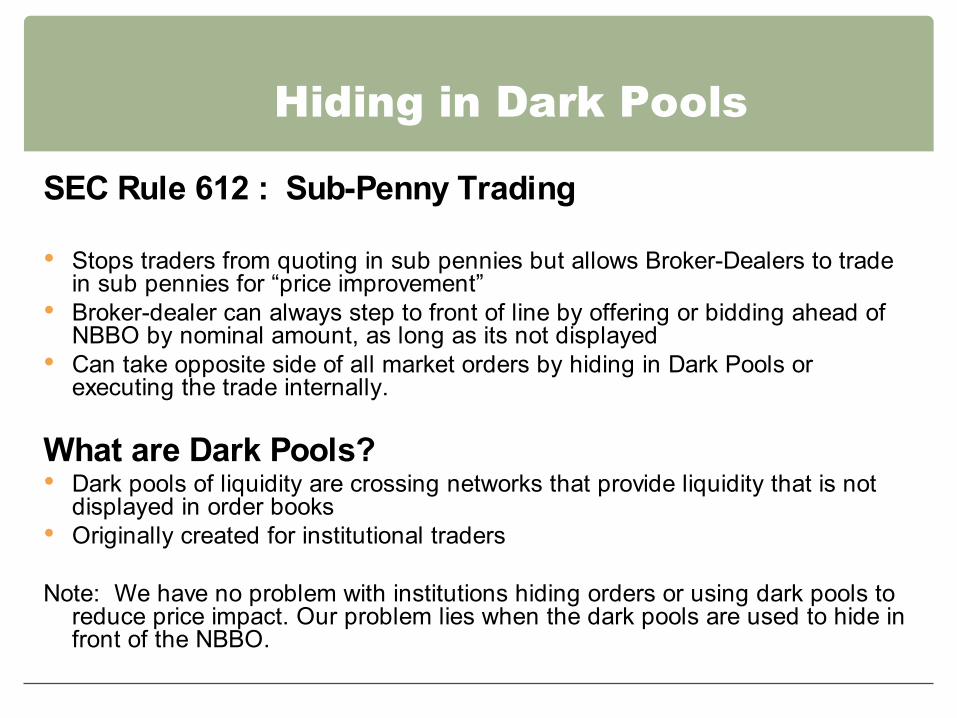
SEC Rule 612 : Sub-Penny Trading
Stops traders from quoting in sub pennies but allows Broker-Dealers to tradein sub pennies for “price improvement”
Broker-dealer can always step to front of line by offering or bidding ahead ofNBBO by nominal amount, as long as its not displayed
Can take opposite side of all market orders by hiding in Dark Pools orexecuting the trade internally.
What are Dark Pools? Dark pools of liquidity are crossing networks that provide liquidity that is not
displayed in order books Originally created for institutional traders
Note: We have no problem with institutions hiding orders or using dark pools toreduce price impact. Our problem lies when the dark pools are used to hide infront of the NBBO.
Pegged Orders with Sub-penny�Offset�
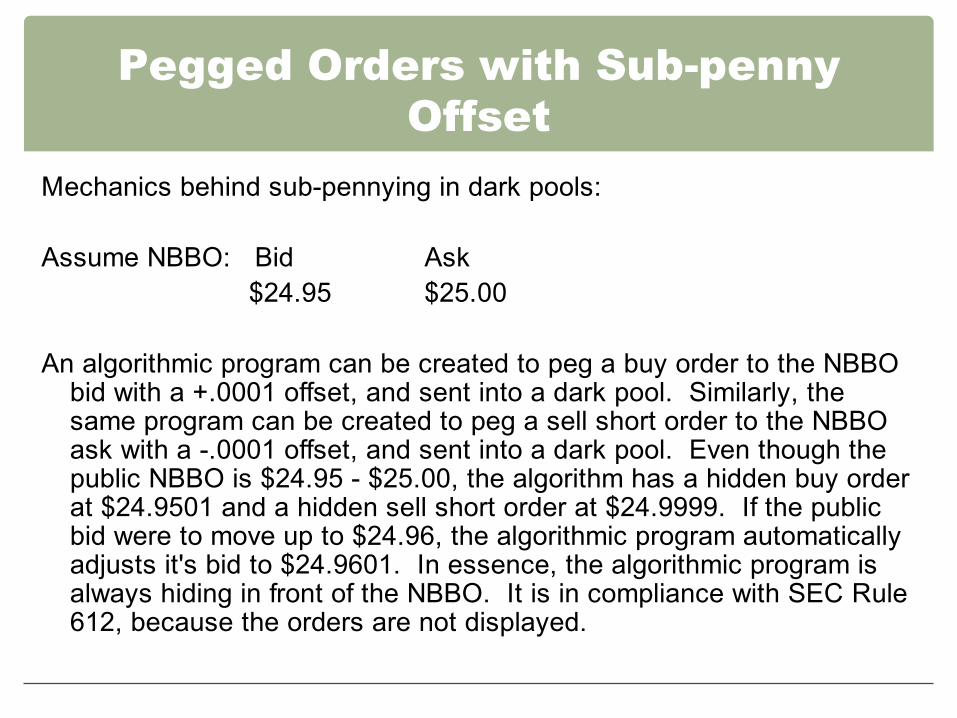
Mechanics behind sub-pennying in dark pools:
Assume NBBO: Bid Ask $24.95 $25.00
An algorithmic program can be created to peg a buy order to the NBBObid with a +.0001 offset, and sent into a dark pool. Similarly, thesame program can be created to peg a sell short order to the NBBOask with a -.0001 offset, and sent into a dark pool. Even though thepublic NBBO is $24.95 - $25.00, the algorithm has a hidden buy orderat $24.9501 and a hidden sell short order at $24.9999. If the publicbid were to move up to $24.96, the algorithmic program automaticallyadjusts it's bid to $24.9601. In essence, the algorithmic program isalways hiding in front of the NBBO. It is in compliance with SEC Rule612, because the orders are not displayed.
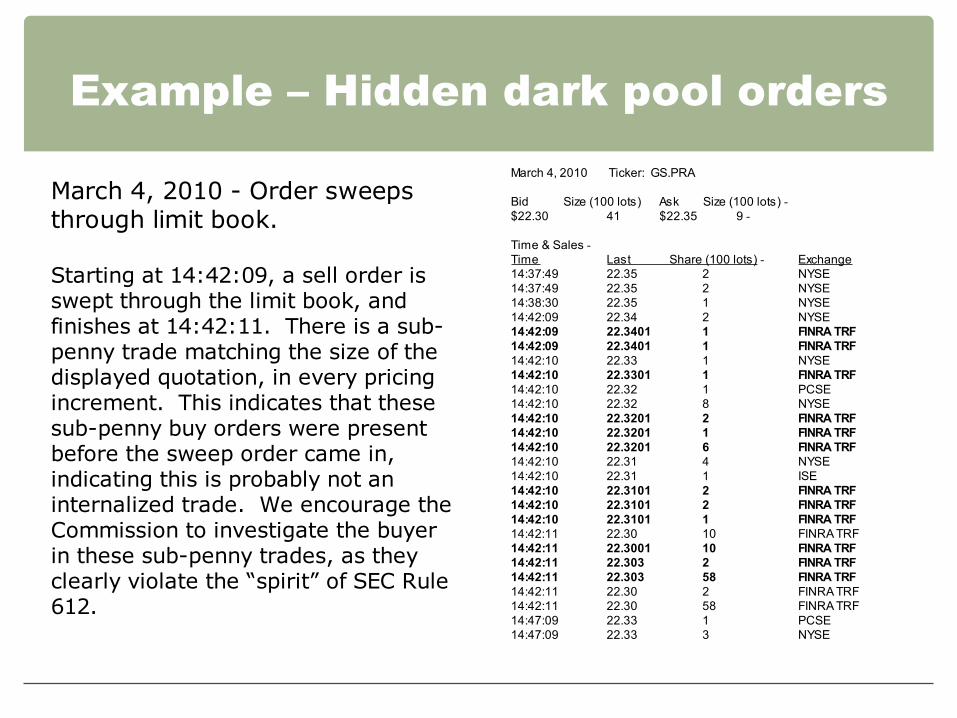
Example – Hidden dark pool orders
March 4, 2010 - Order sweeps through limit book.
Starting at 14:42:09, a sell order is swept through the limit book, and finishes at 14:42:11. There is a sub-penny trade matching the size of the displayed quotation, in every pricing increment. This indicates that these sub-penny buy orders were present before the sweep order came in, indicating this is probably not an internalized trade. We encourage the Commission to investigate the buyer in these sub-penny trades, as they clearly violate the “spirit” of SEC Rule 612.
March 4, 2010 Ticker: GS.PRA
Bid Size (100 lots) Ask Size (100 lots)$22.30 41 $22.35 9
Time & SalesTime Last Share (100 lots)14:37:49 22.35 2 14:37:49 22.35 2 14:38:30 22.35 1 14:42:09 22.34 2 14:42:09 22.3401 1 14:42:09 22.3401 1 14:42:10 22.33 1 14:42:10 22.3301 1 14:42:10 22.32 1 14:42:10 22.32 8 14:42:10 22.3201 2 14:42:10 22.3201 1 14:42:10 22.3201 6 14:42:10 22.31 4 14:42:10 22.31 1 14:42:10 22.3101 2 14:42:10 22.3101 2 14:42:10 22.3101 1 14:42:11 22.30 10 14:42:11 22.3001 10 14:42:11 22.303 2 14:42:11 22.303 58 14:42:11 22.30 2 14:42:11 22.30 58 14:47:09 22.33 1 14:47:09 22.33 3
Exchange NYSE NYSE NYSE NYSE FINRA TRF FINRA TRF NYSE FINRA TRF PCSE NYSE FINRA TRF FINRA TRF FINRA TRF NYSE ISE FINRA TRF FINRA TRF FINRA TRF FINRA TRF FINRA TRF FINRA TRF FINRA TRF FINRA TRF FINRA TRF PCSE NYSE
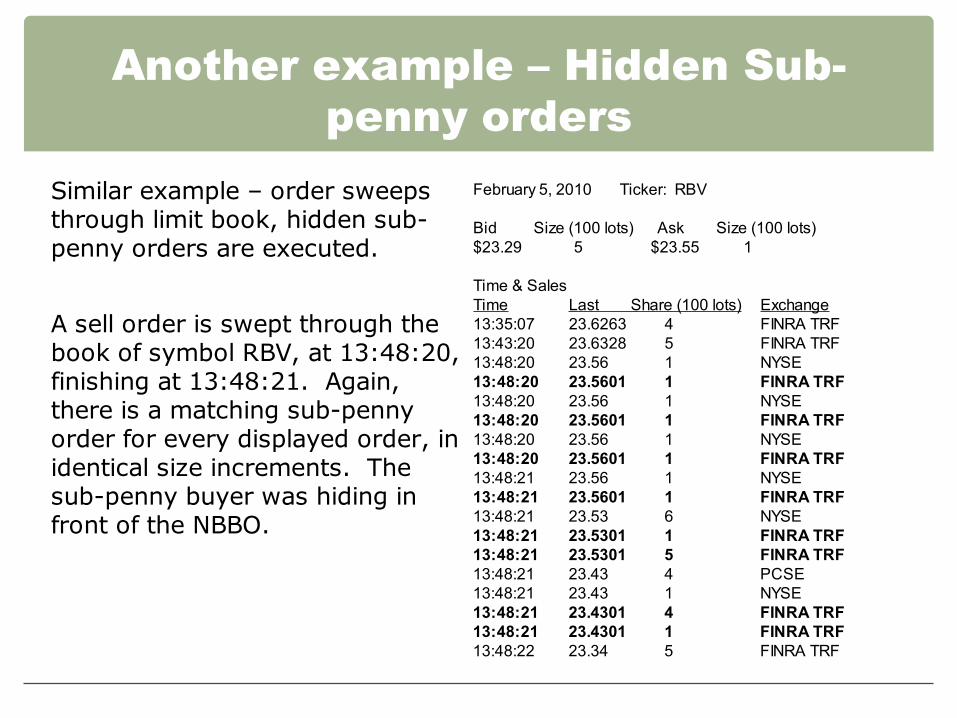
Another example – Hidden Sub-penny orders
Similar example – order sweeps through limit book, hidden sub-penny orders are executed.
A sell order is swept through the book of symbol RBV, at 13:48:20, finishing at 13:48:21. Again, there is a matching sub-penny order for every displayed order, in identical size increments. The sub-penny buyer was hiding in front of the NBBO.
February 5, 2010 Ticker: RBV
Bid Size (100 lots) Ask Size (100 lots) $23.29 5 $23.55 1
Time & Sales Time Last Share (100 lots) Exchange 13:35:07 23.6263 4 FINRA TRF 13:43:20 23.6328 5 FINRA TRF 13:48:20 23.56 1 NYSE 13:48:20 23.5601 1 FINRA TRF 13:48:20 23.56 1 NYSE 13:48:20 23.5601 1 FINRA TRF 13:48:20 23.56 1 NYSE 13:48:20 23.5601 1 FINRA TRF 13:48:21 23.56 1 NYSE 13:48:21 23.5601 1 FINRA TRF 13:48:21 23.53 6 NYSE 13:48:21 23.5301 1 FINRA TRF 13:48:21 23.5301 5 FINRA TRF 13:48:21 23.43 4 PCSE 13:48:21 23.43 1 NYSE 13:48:21 23.4301 4 FINRA TRF 13:48:21 23.4301 1 FINRA TRF 13:48:22 23.34 5 FINRA TRF
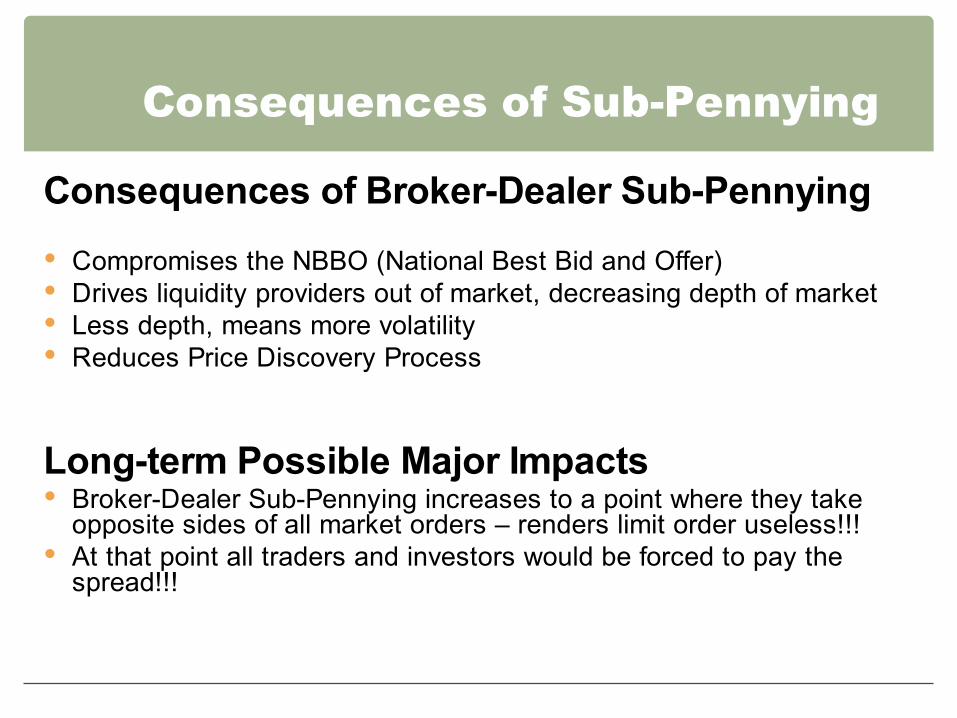
Consequences of Sub-Pennying
Consequences of Broker-Dealer Sub-Pennying�
Compromises the NBBO (National Best Bid and Offer) Drives liquidity providers out of market, decreasing depth of market Less depth, means more volatility Reduces Price Discovery Process
Long-term Possible Major Impacts Broker-Dealer Sub-Pennying increases to a point where they take
opposite sides of all market orders – renders limit order useless!!! At that point all traders and investors would be forced to pay the
spread!!!
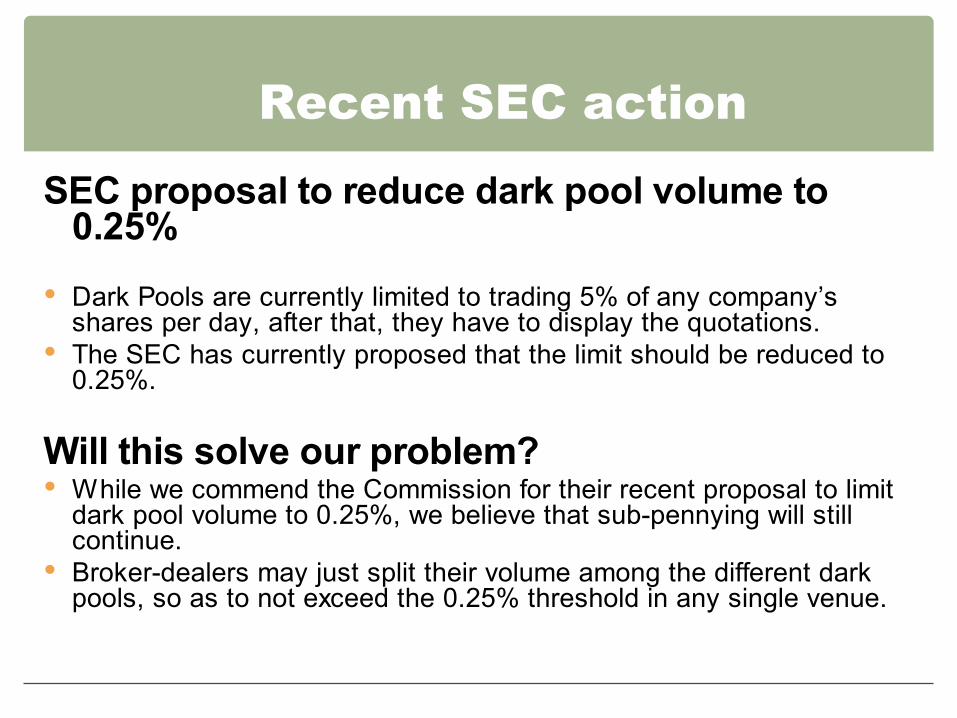
Recent SEC action
SEC proposal to reduce dark pool volume to0.25%
Dark Pools are currently limited to trading 5% of any company’sshares per day, after that, they have to display the quotations.
The SEC has currently proposed that the limit should be reduced to0.25%.
Will this solve our problem? While we commend the Commission for their recent proposal to limit
dark pool volume to 0.25%, we believe that sub-pennying will stillcontinue.
Broker-dealers may just split their volume among the different darkpools, so as to not exceed the 0.25% threshold in any single venue.
Proposed Solution How do we Stop Sub-Pennying?
Investigate Dark Pools, and stop Broker-Dealers and Algorithmicsystems from hiding in front of the NBBO. Investigate the use of“Pegged” orders, and do not allow orders to be pegged in sub-pennyincrements.
Regulate the Broker-Dealer Price Improvement Process, and investigatebroker-dealer internalization, making sure they are not stepping in frontof the NBBO for only a nominal amount.
Review SEC Rule 612, and open it up for Public Comment. This section should be reviewed and opened up for public comments,specifically to comment upon at what point is “price improvement” actuallyprice improvement and truly beneficial to retail investors .
Regulate Sub-Penny trading, and make sure the liquidity provider isnot being disadvantaged by the Sub-Penny fill.