Briefing to the Legislative Council Panel on Financial … 1 . HONG KONG MONETARY AUTHORITY Briefing...
35
Slide 1 HONG KONG MONETARY AUTHORITY Briefing to the Legislative Council Panel on Financial Affairs 2 November 2015 [ Translation ]
-
Upload
trinhthuan -
Category
Documents
-
view
219 -
download
4
Transcript of Briefing to the Legislative Council Panel on Financial … 1 . HONG KONG MONETARY AUTHORITY Briefing...

Slide 1
HONG KONG MONETARY AUTHORITY
Briefing to the Legislative CouncilPanel on Financial Affairs
2 November 2015
[ Translation ]
Slide 2
2
1. Assessment of Risk to Hong Kong’s Financial Stability
2. Banking Supervision
3. Development of Financial Market
4. Hong Kong as an Offshore Renminbi Centre
5. Investment Performance of the Exchange Fund

Slide 3
THE US DOLLAR HAS NOTICEABLE “CYCLICALITY”
The US dollar index is a weighted average of the foreign exchange values of the US dollar against thecurrencies of the euro area, Japan, UK, Canada, Switzerland, Sweden and Australia (March 1973=100).Source: US Federal Reserve. 3
• This chart shows a noticeable “cyclicality” in the US dollar exchange rate. • Since the Bretton Woods System was abandoned by the US in 1970s, the
US dollar has undergone three major upcycles as shown by the arrows in the chart:
• The first upcycle lasted between the end of the 1970s and mid-1980s, during which the US dollar exchange rate rose by an accumulative 67%.
• The second upcycle lasted between mid-1990s and early 2000s, with an accumulative growth of 43%.
• The third upcycle began in 2011 and has continued so far.

Slide 4
WHEN THE US DOLLAR STRENGTHENSCOMMODITY PRICES TEND TO FALL
*The US dollar index is a weighted average of the foreign exchange values of the US dollar against thecurrencies of the euro area, Japan, UK, Canada, Switzerland, Sweden and Australia (March 1973=100).** Oil prices are in US dollar per barrel.Source: Bloomberg. 4
• Volatilities in US dollar exchange rates have a high correlation with major commodity prices.
• Experience shows when the US dollar strengthened, commodity prices tended to fall.
• The chart indicates whenever the US dollar rose (blue line, upward arrows), crude oil prices (red line, downward arrows) went down.

Slide 5
WHEN THE US DOLLAR STRENGTHENSCOMMODITY PRICES TEND TO FALL
*The US dollar index is a weighted average of the foreign exchange values of the US dollar against thecurrencies of the euro area, Japan, UK, Canada, Switzerland, Sweden and Australia (March 1973=100).** Gold prices are in US dollar per troy ounce.Source: Bloomberg. 5
• Gold prices followed a similar pattern. • The chart indicates when the US dollar rose (blue line, upward arrows),
gold prices (red line, downward arrows) fell.
Slide 6
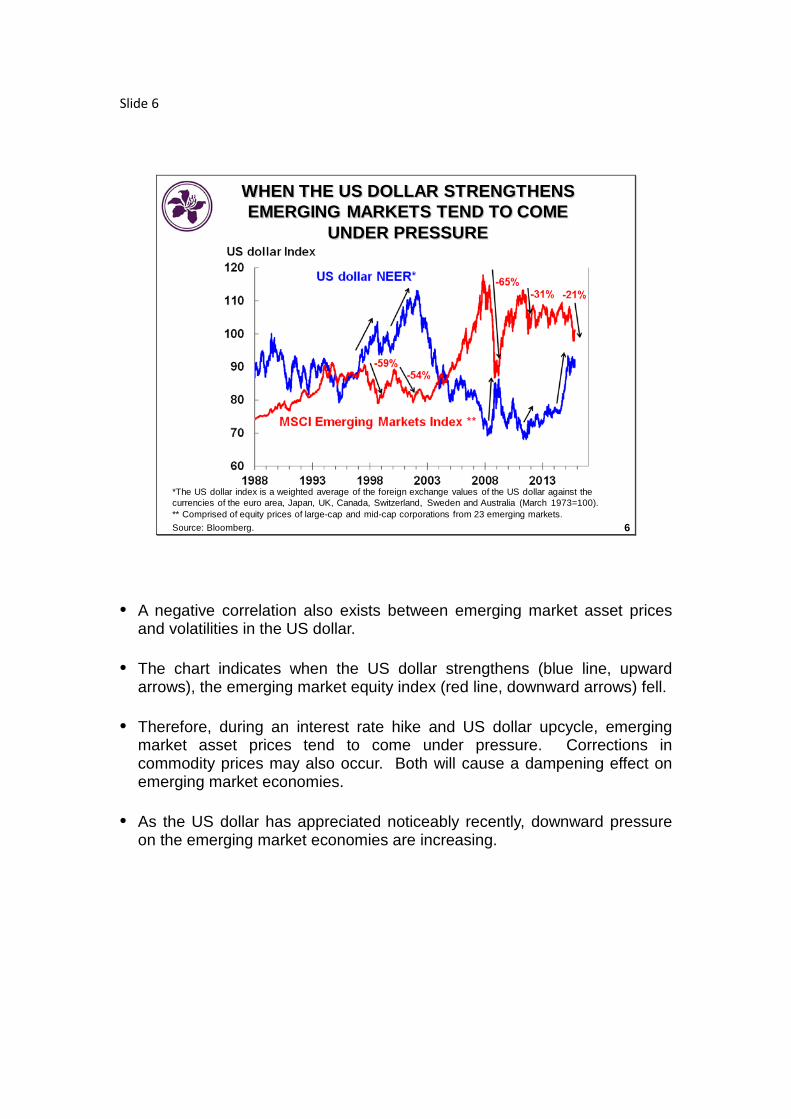
WHEN THE US DOLLAR STRENGTHENS EMERGING MARKETS TEND TO COME
UNDER PRESSURE
6
*The US dollar index is a weighted average of the foreign exchange values of the US dollar against thecurrencies of the euro area, Japan, UK, Canada, Switzerland, Sweden and Australia (March 1973=100). ** Comprised of equity prices of large-cap and mid-cap corporations from 23 emerging markets.Source: Bloomberg.
• A negative correlation also exists between emerging market asset prices and volatilities in the US dollar.
• The chart indicates when the US dollar strengthens (blue line, upward
arrows), the emerging market equity index (red line, downward arrows) fell. • Therefore, during an interest rate hike and US dollar upcycle, emerging
market asset prices tend to come under pressure. Corrections in commodity prices may also occur. Both will cause a dampening effect on emerging market economies.
• As the US dollar has appreciated noticeably recently, downward pressure
on the emerging market economies are increasing.

Slide 7
7
AS THE US DOLLAR STRENGTHENS EMERGING ASIAN CURRENCIES ARE
UNDER PRESSURE
Source: Bloomberg.
• With abundant global liquidity as a result of quantitative easing in the US (from the first quarter of 2009 to the fourth quarter of 2014), large amount of capital in search of higher yields flew into Asia’s emerging markets. At the peak in the third quarter of 2014, cumulative inflows into Asian emerging economies amounted to about US$1,600 billion.
• As the US dollar has started strengthening noticeably since mid-2014, emerging markets are facing pressure of fund outflows. The chart shows exchange rates in Asian and other emerging market currencies started to come under pressure since mid-2014. The light blue bars represent depreciation of the various emerging market currencies against the US dollar since the second half of 2014, while the dark blue bars represent their depreciation from early 2015 to the end of October.

Slide 8
8
ASSESSMENT OF RISKS TO GLOBAL FINANCIAL STABILITY
• US dollar would likely remain strong for a period ahead
• In the face of US interest rate normalisation and strong USdollar, emerging market economies would come underpressure from different directions: Reversal in capital flows Depreciation of exchange rates Slowdown in economic growth Downward pressure on asset prices
• Economies reliant on commodities exports would be moreaffected
• Global economy and financial markets would become evenmore volatile
Slide 9
9
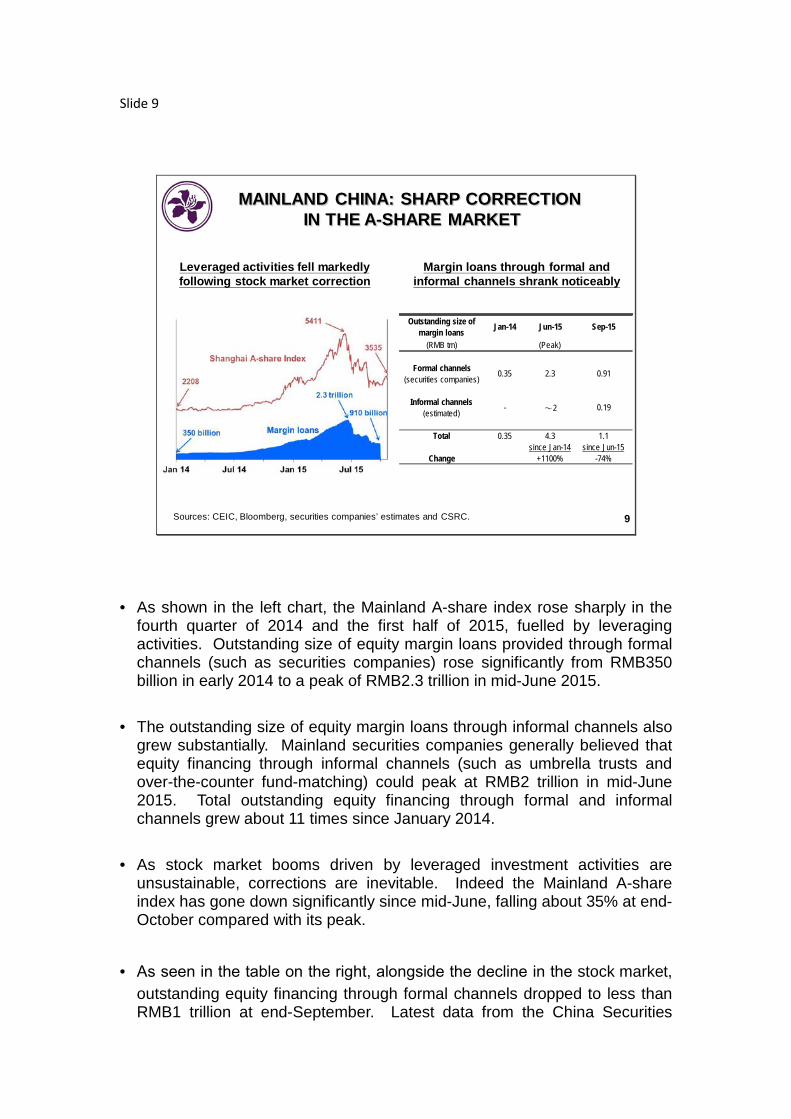
MAINLAND CHINA: SHARP CORRECTIONIN THE A-SHARE MARKET
Sources: CEIC, Bloomberg, securities companies’ estimates and CSRC.
Leveraged activities fell markedly following stock market correction
Margin loans through formal and informal channels shrank noticeably
Outstanding size ofmargin loans Jan-14 Jun-15 Sep-15
(RMB trn) (Peak)
Formal channels(securities companies) 0.35 2.3 0.91
Informal channels(estimated) - ~2 0.19
Total 0.35 4.3 1.1since Jan-14 since Jun-15
Change +1100% -74%
• As shown in the left chart, the Mainland A-share index rose sharply in the fourth quarter of 2014 and the first half of 2015, fuelled by leveraging activities. Outstanding size of equity margin loans provided through formal channels (such as securities companies) rose significantly from RMB350 billion in early 2014 to a peak of RMB2.3 trillion in mid-June 2015.
• The outstanding size of equity margin loans through informal channels also
grew substantially. Mainland securities companies generally believed that equity financing through informal channels (such as umbrella trusts and over-the-counter fund-matching) could peak at RMB2 trillion in mid-June 2015. Total outstanding equity financing through formal and informal channels grew about 11 times since January 2014.
• As stock market booms driven by leveraged investment activities are
unsustainable, corrections are inevitable. Indeed the Mainland A-share index has gone down significantly since mid-June, falling about 35% at end-October compared with its peak.
• As seen in the table on the right, alongside the decline in the stock market,
outstanding equity financing through formal channels dropped to less than RMB1 trillion at end-September. Latest data from the China Securities
Regulatory Commission show equity financing through informal channels also dropped to about RMB190 billion in mid-September. Total outstanding equity financing through formal and informal channels decreased by about 74% compared with their peak in June.

Slide 10
10
RENMINBI EXCHANGE RATE HAS BECOME MORE MARKET DRIVEN
Source: Reuters.
Recent renminbi depreciation is small compared with its appreciation in the past
• Renminbi exchange rate movements have aroused market concern recently. The renminbi fell by 2.4% against the US dollar as at 28 October 2015 since the refinement of its central parity rate fixing mechanism by the People's Bank of China on 11 August. However, the extent of the depreciation is still small compared to its previous appreciations.
• The adjustment of the renminbi central parity rate fixing mechanism is a
major step in financial market reform on the Mainland by adopting a more market-based renminbi exchange rate fixing mechanism.

Slide 11
11
NO BASIS FOR SHARP AND SUSTAINED DEPRECIATION OF RENMINBI
Source: CEIC.
Trade balance remains in surplus with ample foreign reserves
Year
• The renminbi exchange rate may be volatile in the short term, but there is no basis for any sharp or sustained depreciation in the currency.
• A sustained trade and current account surplus on the Mainland can help
maintain stability of the renminbi exchange rate. Despite a slowdown in Mainland’s growth in recent years, it has performed quite well compared with many other countries, providing support for the renminbi.
• Besides, Mainland’s huge foreign reserves act as a potent stabiliser for the
renminbi exchange rate. Foreign reserves have dropped by about US$300 billion since the start of 2015 but remain abundant. They amounted to US$3.5 trillion at the end of September.
• With progress in financial market reform and gradual liberalisation of the
capital account on the Mainland, cross-border fund flows are expected to grow. Changes in foreign reserves are normal.

Slide 12
12
MAINLAND ECONOMIC GROWTH IS MODERATINGBUT RISK OF A HARD LANDING IS NOT HIGH
• While the Mainland economy is facing downward pressure,some economic fundamentals remain sound: Solid growth in the service sector Trade balance remaining in surplus Stabilisation of the property market
• The Mainland economy is slowing, but still manages to grow atclose to 7%
• The Mainland authorities have sufficient fiscal and monetarypolicy space to support stable economic growth
• The Mainland economy can cope with outflow pressure with itsample foreign reserves

Slide 13
13Sources: Land Registry, Rating and Valuation Department and Centaline Property Agency Limited.
Sentiment in the property market weakened, while transaction volume fell
ASSESSMENT OF RISKS TO HONG KONG’S FINANCIAL STABILITY: PROPERTY MARKET
0
2
4
6
8
10
12
14
16
2010 2011 2012 2013 2014 2015
S&P agreements ('000)
Primary markettransaction volume
Secondary market transaction volume
(Jan-Sep)
7th round ofprudential measures
90
95
100
105
110
115
120
125
130
90
95
100
105
110
115
120
125
130
2014 2015
7th round of prudential measures
Index (Jan 2014 = 100)
Centa-City leading index
Jan Apr Jul Oct Jan Apr Jul Oct
R&VD's housing prices (overall)
• Financial markets underwent intense volatilities between June and August. Subsequently housing market sentiment weakened and transaction volume fell.
• As can be seen in the left chart, data from Land Registry show that average
transactions in August and September dropped by almost 25% compared with that in July.
• In the right chart, while secondary market housing prices rose by a
cumulative 9.6% between January and August, growth in recent months has reduced markedly. The Centa-City Leading Index shows secondary market housing prices have faced downward pressure in recent weeks.

Slide 14
14
• Housing affordability has become highly stretched relative to household income
• Factors supporting the property market may change:
US interest rate normalisation will soon begin and interest rates in Hong Kong will rise eventually
Economic growth in Hong Kong is softening Housing supply is increasing Purchasing power of Mainland Chinese for Hong Kong
property has diminished• Prospective homebuyers should avoid overstretching and
assess their repayment ability, taking into account the risk of a possible downturn
ASSESSMENT OF RISKS TO HONG KONG’S FINANCIAL STABILITY: PROPERTY MARKET

Slide 15
Note: * Q2 figure is used for 2015’s classified loan ratio.Source: Hong Kong Monetary Authority.
28.6
20.2
9.6
16.012.7
5.2
0.0
0.5
1.0
1.5
2.0
2.5
3.0
0
5
10
15
20
25
30
2010 2011 2012 2013 2014 2015
Total loans and advances (lhs)
Classified loans* (rhs)
Annualised growth rate (%) % of total loans
(Jan- Sep)
ASSESSMENT OF RISKS TO HONG KONG’S FINANCIAL STABILITY: CREDIT GROWTH
AND ASSET QUALITY
15
Credit growth slowed; asset quality is satisfactory but there are signs of deterioration
• Total loans rose by an annualised 5.2% in the first nine months this year, much slower than the growth of 12.7% for 2014. Growth in both local loans and those for use outside Hong Kong has dropped substantially.

Slide 16
16
ASSESSMENT OF RISKS TO HONG KONG’S FINANCIAL STABILITY: FUND FLOWSInflows into the Hong Kong dollar re-emerged
Inflows into the HKD totalling around US$130 billion
Source: Hong Kong Monetary Authority.
0100200300400500600700800900
1,0001,1001,2001,300
2008 2009 2010 2011 2012 2013 2014 2015
HK$bn
Aggregate Balance
Exchange Fund Bills and Notes
+$153.7bn
+$642.2 bn
+$107.2 bn+$75.3 bn
+$71.5 bn
• Inflows into the Hong Kong dollar re-appeared in September and October following an earlier episode in April this year. Despite currency fluctuations within the region earlier, the Hong Kong dollar exchange rate has remained stable and close to the strong-side Convertibility Undertaking. Between 1 September and 28 October, the strong-side Convertibility Undertaking was triggered repeatedly, causing the Aggregate Balance to expand by HK$153.7 billion (equivalent to US$19.84 billion) (see chart).
• Recent inflows were partly related to the unwinding of renminbi positions
and conversion into Hong Kong dollar.

Slide 17
17
• Once the process of US interest rate hikes begins, the HongKong dollar-US dollar interest rate spread will widen, leadingto outflows from the Hong Kong dollar to the US dollar andtriggering of the weak-side Convertibility Undertaking at 7.85
• It is expected to see outflows from the Hong Kong dollar.Monetary conditions will tighten as a result and the Hong Kongdollar interest rates will rise to a level close to the US dollarinterest rates
• A strong US dollar and rising US interest rates will weigh onemerging markets. The local economy and asset markets willalso face downward pressure
ASSESSMENT OF RISKS TO HONG KONG’S FINANCIAL STABILITY: FUND FLOWS

Slide 18
18
1. Assessment of Risk to Hong Kong’s Financial Stability
2. Banking Supervision
3. Development of Financial Market
4. Hong Kong as an Offshore Renminbi Centre
5. Investment Performance of the Exchange Fund

Slide 19
CREDIT GROWTH CONTINUED TO MODERATE
19

Slide 20
ASSET QUALITY IS SATISFACTORY BUT THERE ARE SIGNS OF DETERIORATION
20
• The Hong Kong banking sector’s asset quality remains good, but has shown some signs of deterioration since late 2014. Specifically, the overall classified loan ratio of retail banks has bottomed out from the historical low of 0.43% in September 2014 to 0.49% in June 2015, with deterioration in quality of Mainland-related lending contributing partly to the increase.
• Despite only small increase in the classified loan ratio, the HKMA has been mindful of the possible adverse impact of the uncertain economic outlook for the global economy, including Mainland China, and the interest rate normalisation in the US on Hong Kong banks’ credit and liquidity risks. Thus, the HKMA has been stepping up substantial supervisory efforts to ensure that banks are managing their credit risk properly, especially risks associated with Mainland-related lending business.
• The HKMA will remain vigilant to market developments and take prompt supervisory actions where necessary to ensure the stability and resilience of the Hong Kong banking system in a possible downturn in the credit cycle.

Slide 21
BASEL STANDARDS IMPLEMENTATION
Legislative amendments in 2015
• Banking (Capital) (Amendment) Rules 2015 (BCAR 2015)to address Basel Committee's Regulatory ConsistencyAssessment Programme (RCAP) findings
Legislative amendments in 2016
• Amendments to Banking (Capital) Rules (BCR) to reflectrevised capital treatment of counterparty credit riskexposures and equity investments in funds
• Amendments to Banking (Disclosure) Rules (BDR) toimplement Pillar 3 revised disclosure package
21
Our plan for legislative amendments for the rest of this year and next year relating to Basel standards implementation is as follow: BCAR 2015 • A draft set of BCAR 2015 have been prepared to address a few technical
differences between the text of the Banking (Capital) Rules and the underlying Basel standards that were identified in the 2014 RCAP assessment on Hong Kong conducted by the Basel Committee. All of the differences were assessed as having no or immaterial impact on the capital ratios of banks but it is a good practice to make the proposed amendments to closely align with the Basel standards.
• The amendment Rules were gazetted on 23 October and tabled at LegCo on 28 October for negative vetting, with target commencement starting next year.
2016 amendments to BCR and BDR • Policy development is underway in relation to the implementation of a
number of Basel revised standards scheduled to take effect internationally from 2017.

Slide 22
CROSS-SECTOR RESOLUTION REGIME FOR FINANCIAL INSTITUTIONS IN HONG KONG
• To meet international standards: Financial Stability Board(FSB)’s “Key Attributes of Effective Resolution Regimesfor Financial Institutions”
• Cross-sectoral approach covering entities from banking,insurance as well as securities and futures sectors
• Response to comments on second consultation(January – April 2015) was issued on 9 October
• Aim to introduce a Bill into LegCo by the end of 2015
22

Slide 23
23
1. Assessment of Risk to Hong Kong’s Financial Stability
2. Banking Supervision
3. Development of Financial Market
4. Hong Kong as an Offshore Renminbi Centre
5. Investment Performance of the Exchange Fund

Slide 24
To attract multinational and Mainland enterprises to establishcorporate treasury centres (“CTCs”) in Hong Kong, HKMAhas been working closely with the Government to implementthe 2015-16 Budget proposal to allow deductions of CTCs’eligible interest expenses under profits tax, and reduce profitstax for specified treasury activities by 50%.
Industry consultation on proposed legislative changes hascommenced in September 2015. The Government aims tointroduce the Inland Revenue (Amendment) Bill into LegCoaround the end of 2015.
HKMA will continue to engage the industry and step upmarketing effort to promote Hong Kong as a preferredregional location for CTCs.
DEVELOPING HONG KONG AS A CTC HUB
24

Slide 25
FINANCIAL INFRASTRUCTURE DEVELOPMENT: PROGRESS UPDATE
• Legislative framework for Stored Value Facilities (SVF) andRetail Payment Systems (RPS)
– The Bills Committee of the LegCo had completed clause-by-clause scrutiny of the Clearing and SettlementSystems (Amendment) Bill 2015 in June 2015. SecondReading of the Bill will resume on 4 November 2015
– A number of SVF issuing companies have approachedthe HKMA indicating interest in applying for SVF licencesduring the 12 month transitional period after thecommencement of the new legislation
– The HKMA will consider designating important RPS foroversight after commencement of the new legislation
25

Slide 26
RETAIL PAYMENT DEVELOPMENT: PROGRESS UPDATE
• Electronic Bill Presentment and Payment (EBPP)service– The Water Supplies Department and the Rating and
Valuation Department have joined the platform inSeptember 2015, bringing the total number of EBPPparticipating merchants to 140
• e-Cheque– 9 banks have planned to roll out e-Cheque issuance
service on 7 December 2015 and another 9 bankshave expressed interest to do so later
– The public can issue and present e-Cheque throughtheir Internet and mobile banking accounts using thedesktop computer, tablet or smartphone
26

Slide 27
27
1. Assessment of Risk to Hong Kong’s Financial Stability
2. Banking Supervision
3. Development of Financial Market
4. Hong Kong as an Offshore RenminbiCentre
5. Investment Performance of the Exchange Fund

Slide 28
HONG KONG OFFSHORE RMB BUSINESS
• Contraction of Hong Kong’s offshore RMB deposit pool recently
• Growth in both RMB trade settlement and RMB bank lending, moderation in dim sum bond issuance
• Daily turnover of Hong Kong RMB Real Time Gross Settlement (RTGS) system exceeds RMB1,000 billion
• Continue to enhance RMB business collaboration between Hong Kong and other offshore markets
28

Slide 29
29
1. Assessment of Risk to Hong Kong’s Financial Stability
2. Banking Supervision
3. Development of Financial Market
4. Hong Kong as an Offshore Renminbi Centre
5. Investment Performance of the Exchange Fund

Slide 30
CURRENCY MARKETS IN Q1-Q3 2015
30

Slide 31
EQUITY MARKETS IN Q1-Q3 2015
31
Slide 32
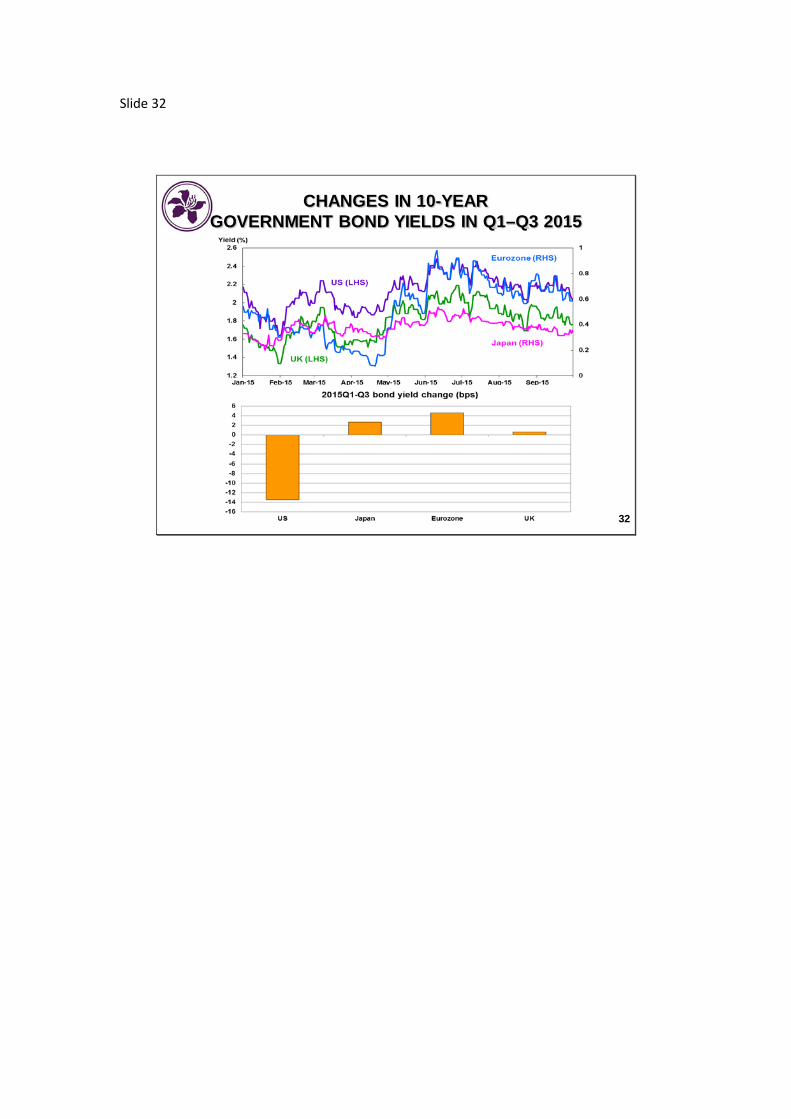
CHANGES IN 10-YEAR GOVERNMENT BOND YIELDS IN Q1–Q3 2015
32
Slide 33
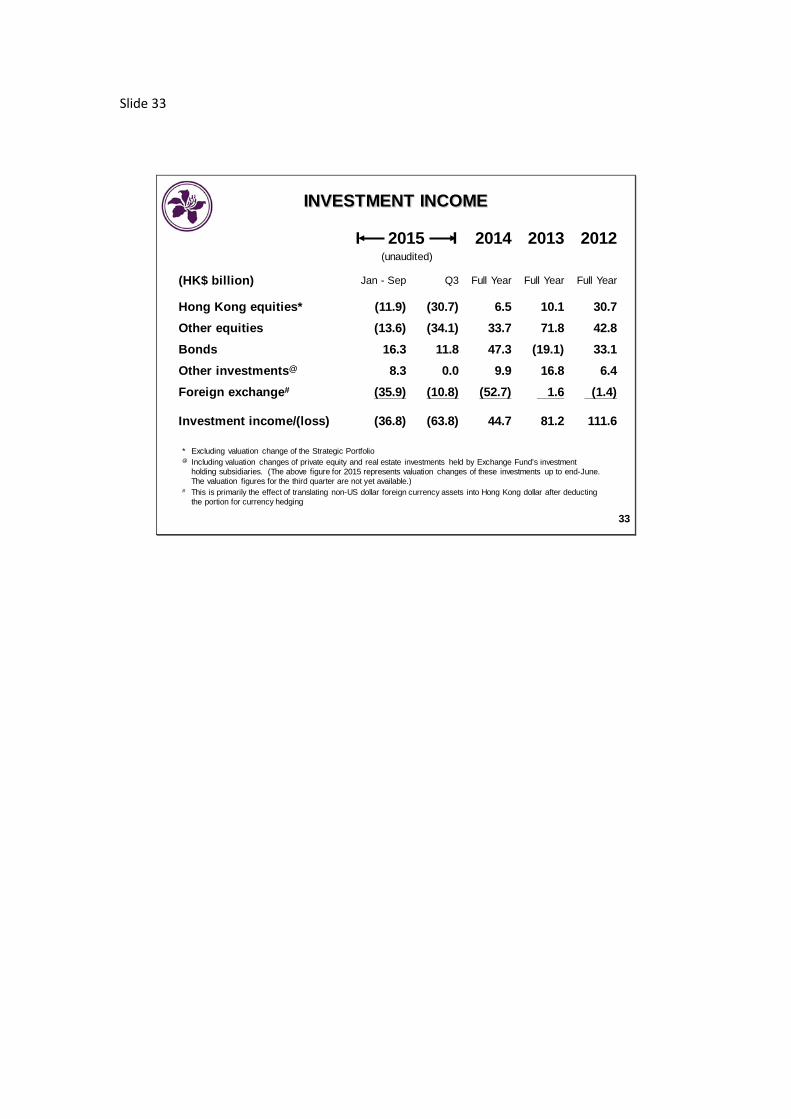
INVESTMENT INCOME
I 2015 I(unaudited)
2014 2013 2012
(HK$ billion) Jan - Sep Q3 Full Year Full Year Full Year
Hong Kong equities* (11.9) (30.7) 6.5 10.1 30.7Other equities (13.6) (34.1) 33.7 71.8 42.8Bonds 16.3 11.8 47.3 (19.1) 33.1Other investments@ 8.3 0.0 9.9 16.8 6.4Foreign exchange# (35.9) (10.8) (52.7) 1.6 (1.4)
Investment income/(loss) (36.8) (63.8) 44.7 81.2 111.6
* Excluding valuation change of the Strategic Portfolio@ Including valuation changes of private equity and real estate investments held by Exchange Fund’s investment
holding subsidiaries. (The above figure for 2015 represents valuation changes of these investments up to end-June. The valuation figures for the third quarter are not yet available.)
# This is primarily the effect of translating non-US dollar foreign currency assets into Hong Kong dollar after deducting the portion for currency hedging
33

Slide 34
INCOME AND EXPENDITURE
I 2015 I(unaudited)
2014
(HK$ billion) Jan – Sep Q3 Q2 Q1 Full year
Investment income/(loss) (36.8) (63.8) 18.7 8.3 44.7
Other income 0.1 0.0 0.1 0.0 0.2
Interest and other expenses (3.7) (1.0) (1.7) (1.0) (5.2)
Net income/(loss) (40.4) (64.8) 17.1 7.3 39.7Fee payable to Fiscal
Reserves* 33.9 11.1 11.4 11.4 27.5Fee payable to HKSAR
Government funds andstatutory bodies* 10.9 3.7 3.7 3.5 8.6
* The fixed rate of fee payment is 5.5% for 2015 and 3.6% for 2014
34


![Briefing to the Legislative Council Panel on Financial Affairs · 2019-02-19 · Briefing to the Legislative Council Panel on Financial Affairs 19 February 2019 [ Translation ] 2](https://static.fdocuments.in/doc/165x107/5ecc6172392dc70435597eb2/briefing-to-the-legislative-council-panel-on-financial-affairs-2019-02-19-briefing.jpg)