Briefing Note Findings for Cambridge for IMD Index 2015 · 1 Briefing Note. Findings for Cambridge...
49
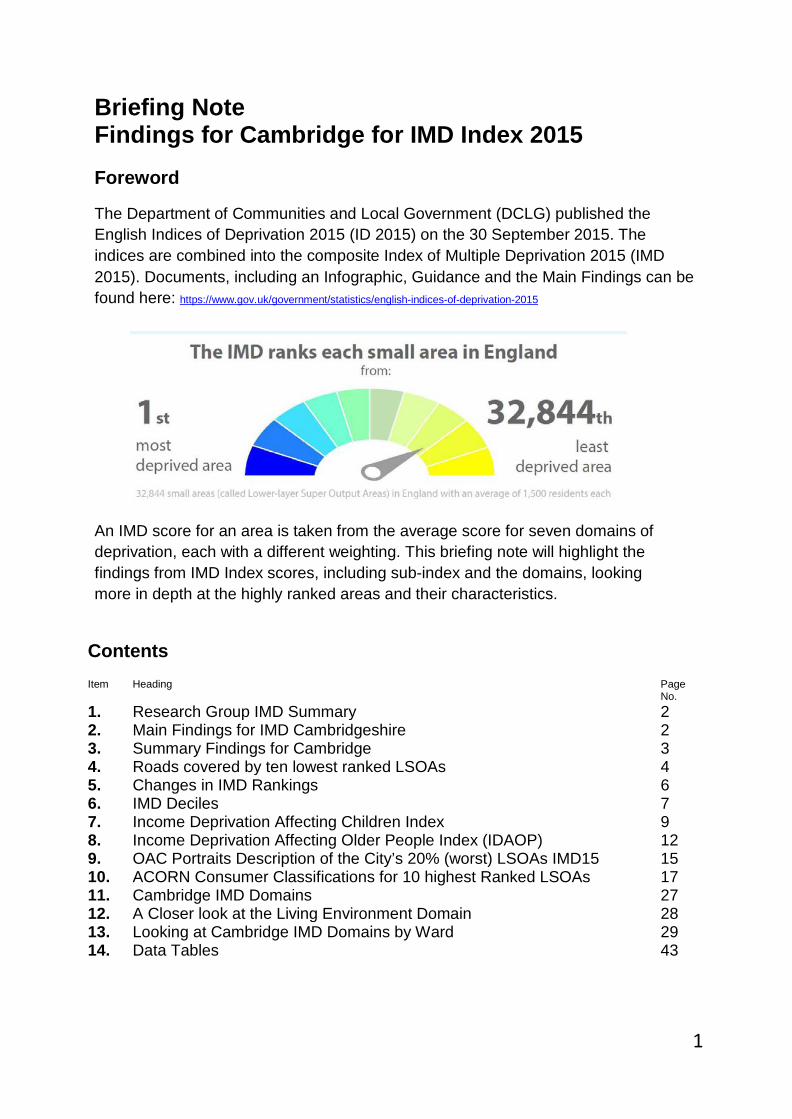
1 Briefing Note Findings for Cambridge for IMD Index 2015 Foreword The Department of Communities and Local Government (DCLG) published the English Indices of Deprivation 2015 (ID 2015) on the 30 September 2015. The indices are combined into the composite Index of Multiple Deprivation 2015 (IMD 2015). Documents, including an Infographic, Guidance and the Main Findings can be found here: https://www.gov.uk/government/statistics/english-indices-of-deprivation-2015 An IMD score for an area is taken from the average score for seven domains of deprivation, each with a different weighting. This briefing note will highlight the findings from IMD Index scores, including sub-index and the domains, looking more in depth at the highly ranked areas and their characteristics. Contents Item Heading Page No. 1. Research Group IMD Summary 2 2. Main Findings for IMD Cambridgeshire 2 3. Summary Findings for Cambridge 3 4. Roads covered by ten lowest ranked LSOAs 4 5. Changes in IMD Rankings 6 6. IMD Deciles 7 7. Income Deprivation Affecting Children Index 9 8. Income Deprivation Affecting Older People Index (IDAOP) 12 9. OAC Portraits Description of the City’s 20% (worst) LSOAs IMD15 15 10. ACORN Consumer Classifications for 10 highest Ranked LSOAs 17 11. Cambridge IMD Domains 27 12. A Closer look at the Living Environment Domain 28 13. Looking at Cambridge IMD Domains by Ward 29 14. Data Tables 43
-
Upload
phunghuong -
Category
Documents
-
view
219 -
download
0
Transcript of Briefing Note Findings for Cambridge for IMD Index 2015 · 1 Briefing Note. Findings for Cambridge...
1
Briefing Note Findings for Cambridge for IMD Index 2015 Foreword
The Department of Communities and Local Government (DCLG) published the English Indices of Deprivation 2015 (ID 2015) on the 30 September 2015. The indices are combined into the composite Index of Multiple Deprivation 2015 (IMD 2015). Documents, including an Infographic, Guidance and the Main Findings can be found here: https://www.gov.uk/government/statistics/english-indices-of-deprivation-2015 An IMD score for an area is taken from the average score for seven domains of deprivation, each with a different weighting. This briefing note will highlight the findings from IMD Index scores, including sub-index and the domains, looking more in depth at the highly ranked areas and their characteristics.
Contents Item Heading Page
No. 1. Research Group IMD Summary 2 2. Main Findings for IMD Cambridgeshire 2 3. Summary Findings for Cambridge 3 4. Roads covered by ten lowest ranked LSOAs 4 5. Changes in IMD Rankings 6 6. IMD Deciles 7 7. Income Deprivation Affecting Children Index 9 8. Income Deprivation Affecting Older People Index (IDAOP) 12 9. OAC Portraits Description of the City’s 20% (worst) LSOAs IMD15 15 10. ACORN Consumer Classifications for 10 highest Ranked LSOAs 17 11. Cambridge IMD Domains 27 12. A Closer look at the Living Environment Domain 28 13. Looking at Cambridge IMD Domains by Ward 29 14. Data Tables 43

2
1. Research Group IMD Summary Cambridgeshire Research Group has provided a Summary Report looking at IMD data for Cambridgeshire and comparing the differences in national and local ranks and deciles from IMD 2010 to IMD 2015. It can be found here:
http://www.cambridgeshireinsight.org.uk/deprivation-0
It highlights caveats in using the historical data that include:
• LSOA definitions have changed between the 2015 and 2010 releases. As
such, some locations will not be comparable at all. • The variables used to define each indices of deprivation have been updated
with each publication. As such, changes in apparent deprivation may reflect these changes in methodology rather than actual changes in local circumstance.
2. Main Findings for IMD Cambridgeshire
• Compared to 2010, Fenland and East Cambridgeshire now rank as more
deprived in national terms than previously - Cambridge City ranks as less deprived. The movement of South Cambridgeshire and Huntingdonshire is not significant.
• Cambridgeshire now has 16 LSOAs in the 20% most deprived nationally – this is compared to 9 in 2010. Two are in Cambridge City, two are in Huntingdonshire and 12 are in Fenland.
• Four of the LSOAs in Fenland are in the 10% most deprived nationally, all of which are in Wisbech.Eight of the top 10 most deprived LSOAs in Cambridgeshire are in Fenland. Two are in Cambridge City.
• 49% of LSOAs in Cambridgeshire have remained in the same national decile (group of 10%) from 2010 to 2015.Overall 56% (198) of LSOAs in Cambridgeshire have increased in national ranks (are measured as being relatively less deprived) since 2010. Within this, 28 LSOAs have increased (improved) by 4000 – 8000 positions, out of 32,844
Additionally the Research Group has included the statistical release in Cambridgeshire Atlas, an interactive mapping tool, which can be used across all of the domains. Some of these maps have been used in this briefing. http://www.cambridgeshireinsight.org.uk/deprivation-0
The national indices of deprivation explorer also allows an investigation of IMD scores in more depth. It can be found here: http://dclgapps.communities.gov.uk/imd/idmap.html

3
3. Summary of findings for Cambridge
• Overall Cambridge’s Average IMD Rank has increased by 39 places since 2010, from 188 to 227 in 2015, with 1 being the most deprived.
• The ten most deprived LSOAs in Cambridge are in the North and North East of the City. Three of the ten have a lower national IMD 2015 ranking than in 210. The other seven have higher national IMD 2015 rankings than 2010. Please refer to Map 1 and Table 1.
Map 1: Ten Lowest IMD 2015 Ranked LSOAs in Cambridge
Table 1: Ten lowest IMD 2015 ranked LSOAs in Cambridge
Ward LSOA code (2011) City Rank 2015 1 2 3
4
5 6 7
8
9
10
City Rank 2010
Cambs Rank
IMD Rank 2015
IMD Rank 2010
Change in IMD Rank
Abbey E01017948 3 9 5,578 6769 -1,191 Abbey E01017946 4 10 5,861 6925 -1,064 Kings Hedges E01017975 5 23 8,245 7111 1,134
Kings Hedges E01017977 8 24 8,340 9208 -868
Arbury E01017952 7 26 8,539 7977 562 Abbey E01017944 10 65 8,888 9636 -748 East Chesterton
E01017971 6 33 9,078 7949 1,129
Kings Hedges E01017978 2 34 9,123 6152 2,971
Kings Hedges E01017979 1 37 9,579 5942 3,637
Arbury E01017953 18 50 12,426 11556 870

4
4. Roads covered by ten lowest ranked LSOAs The following maps show the roads covered by the ten lowest IMD 2015 ranked LSOAs in Cambridge, to help identify disadvantaged communities. Map 2: Arbury LSOAs in Cambridge 10 lowest IMD Scores
Map 3: Kings Hedges LSOAs in Cambridge 10 lowest IMD Scores

5
Map 4: Arbury LSOAs in Cambridge 10 lowest IMD Scores
Map 5: East Chesterton LSOAs in Cambridge 10 lowest IMD Scores
6
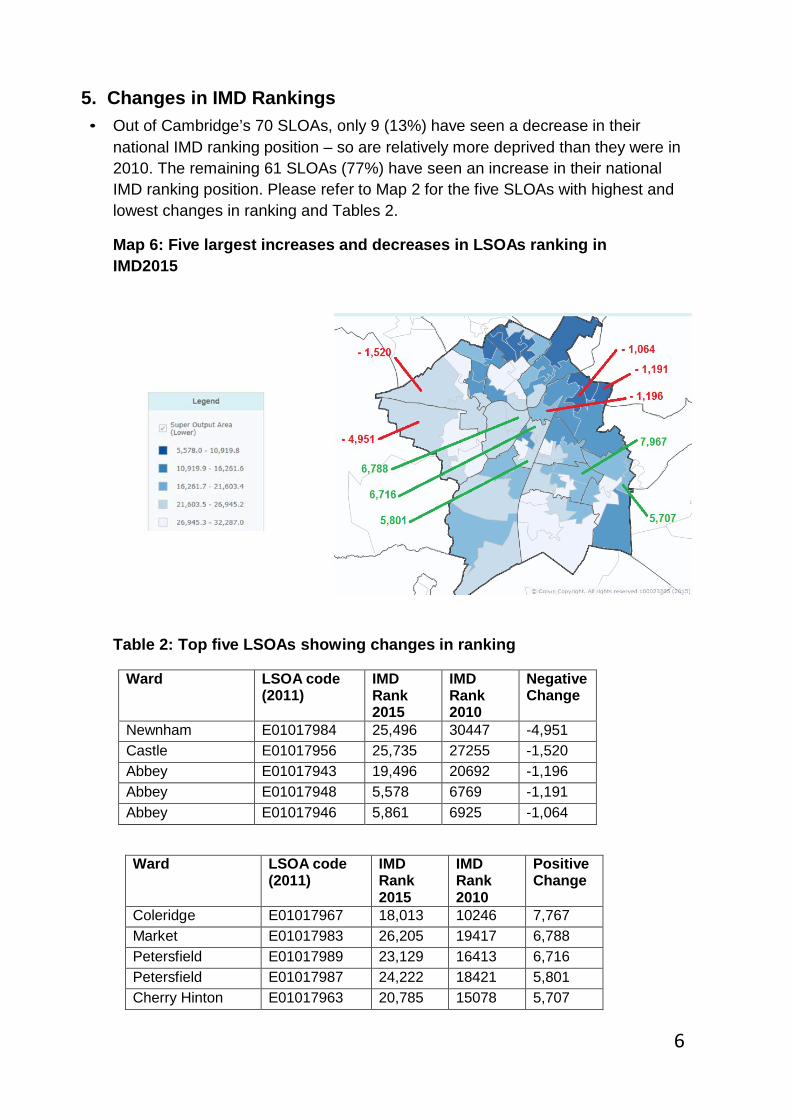
5. Changes in IMD Rankings • Out of Cambridge’s 70 SLOAs, only 9 (13%) have seen a decrease in their
national IMD ranking position – so are relatively more deprived than they were in 2010. The remaining 61 SLOAs (77%) have seen an increase in their national IMD ranking position. Please refer to Map 2 for the five SLOAs with highest and lowest changes in ranking and Tables 2.
Map 6: Five largest increases and decreases in LSOAs ranking in IMD2015
Table 2: Top five LSOAs showing changes in ranking
Ward LSOA code (2011)
IMD Rank 2015
IMD Rank 2010
Negative Change
Newnham E01017984 25,496 30447 -4,951 Castle E01017956 25,735 27255 -1,520 Abbey E01017943 19,496 20692 -1,196 Abbey E01017948 5,578 6769 -1,191 Abbey E01017946 5,861 6925 -1,064
Ward LSOA code (2011)
IMD Rank 2015
IMD Rank 2010
Positive Change
Coleridge E01017967 18,013 10246 7,767 Market E01017983 26,205 19417 6,788 Petersfield E01017989 23,129 16413 6,716 Petersfield E01017987 24,222 18421 5,801 Cherry Hinton E01017963 20,785 15078 5,707
7
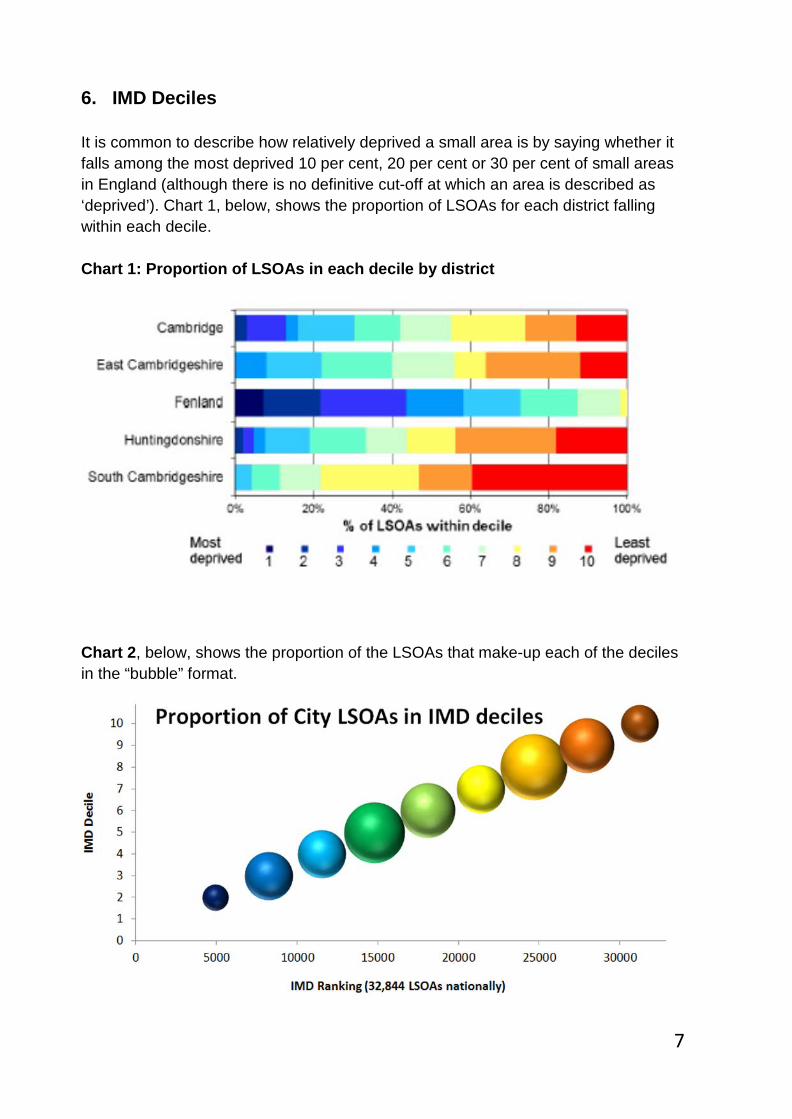
6. IMD Deciles It is common to describe how relatively deprived a small area is by saying whether it falls among the most deprived 10 per cent, 20 per cent or 30 per cent of small areas in England (although there is no definitive cut-off at which an area is described as ‘deprived’). Chart 1, below, shows the proportion of LSOAs for each district falling within each decile. Chart 1: Proportion of LSOAs in each decile by district
Chart 2, below, shows the proportion of the LSOAs that make-up each of the deciles in the “bubble” format.

8
• Fenland has just over two 40% of its population living in the 30% most deprived deciles and in contrast South Cambridgeshire has 40% of its population living in the least deprived 10% decile. The Cambridge spread of LSOAs across the deciles is more even than for the other districts, although the city has no LSOA’s in the most deprived 10%.
• Nearly 40% of residents in the city live in the 8,9,10 least deprived deciles.
• Two LSOAs in Abbey ward appear in the 2nd decile (lowest 20% IMD score nationally) in IMD 2015. Previously two LSOAs in Kings Hedges were in the 2nd quintile (20% most deprived nationally). Please refer to Table 3 below.
Table 3: Decile position for ten lowest LSOAs in Cambridge
Ward LSOA code (2011)
City Decile 2015
Cambs Decile 2015
National Decile 2015
National Quintile 2010
Abbey E01017948 1 2 2 Abbey E01017946 1 2 2
Kings Hedges E01017975 1 3 2 Kings Hedges E01017977 1 3 2 Arbury E01017952 1 3 2 Abbey E01017944 1 3 2 East Chesterton E01017971 1 3 2 Kings Hedges E01017978 1 3 1 (20% most deprived) Kings Hedges E01017979 1 3 1 Arbury E01017953 2 4 2

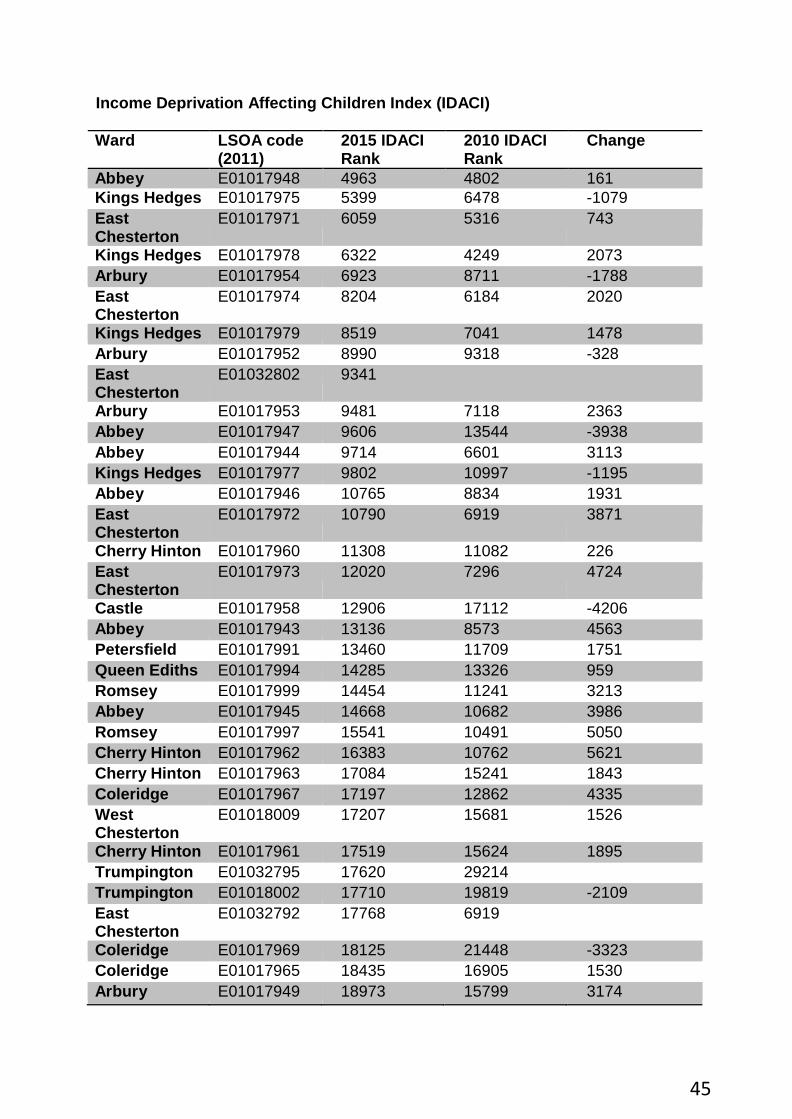
7. Income Deprivation Affecting Children Index
9
The IDACI measures the proportion of all children aged 0 to 15 living in income deprived families. The definition of low income includes both those people that are out of work and those that are in work but who have low earnings.
Main findings for IDACI in Cambridge
• Cambridge’s Rank of Average Scores for IDACI in 2015 was 201 out of the
326 district local authorities, with 1st being the most deprived. In comparison Fenland had a Rank of Average Score of 83 for IDACI 2015.
• Four of Cambridge’s 70 SLOAs fall within the worst 20% of LSOAs in the country in the Income Deprivation Affecting Children Index.
• 14 LSOAs (20%) saw a deterioration in their national ranking positions in the IDACI whilst 56 (80%) LSOAs improved their position, since 2010.
• The LSOA in Abbey with the lowest ranking position in the IDACI was close to its previous point in 2010. An LSOA in Arbury has moved into the lowest ranking ten LSOAs in Cambridge for the first time (E01017952).
• Six LSOAs, covering a part of Arbury and Kings Hedges ward form a cluster of lower ranking IDACI LSOAs.
• One LSOA in West Chesterton moved 6,863 places or just over 20% of national ranking places in the five years since IMD 2010.
• The lowest ranking LOSA had just over a third of children that were income deprived.
• One fifth of all LSOAs in Cambridge contain between 24% and 34% of children living in income deprived families.
Map 7: Ten Lowest IDACI LSOA Scores in Cambridge

Table 3: Ten lowest IDACI Ranked LSOAs in Cambridge
10
Ward LSOA code
(2011) 2015 IDACI Cambridge Rank
2010 IDACI Cambridge Rank
National decile (10%)
Proportion of children in LSOA income deprived
Abbey E01017948 1 2 2 34% Kings Hedges
E01017975 2 5 2 33%
East Chesterton
E01017971 3 3 2 31%
Kings Hedges
E01017978 4 1 2 31%
Arbury E01017954 5 3 30% East Chesterton
E01017974 6 4 3 27%
Kings Hedges
E01017979 7 8 3 26%
Arbury E01017952 8 14 3 25% East Chesterton
E01032802 9 - 3 25%
Arbury E01017953 10 9 3 25%
Map 8: Five largest increases and decreases in IDACI rankings in IMD2015

11
Table 4: Top five IDACI LSOAs showing changes in rankings
Ward LSOA code (2011)
2015 IDACI Rank
2010 IDACI Rank
Negative Change
West Chesterton
E01018010 25356 32219 -6863
Castle E01017958 12906 17112 -4206 Abbey E01017947 9606 13544 -3938 Coleridge E01017969 18125 21448 -3323 Kings Hedges E01017987 17976 24453 -2752
Ward LSOA code (2011)
2015 IDACI Rank
2010 IDACI Rank
Positive Change
Market E01017983 30773 21684 9089 Newnham E01017985 30006 21680 8326 Petersfield E01017989 23181 15818 7363 Arbury E01017950 30405 23500 6905 Petersfield E01017987 25285 18418 6867

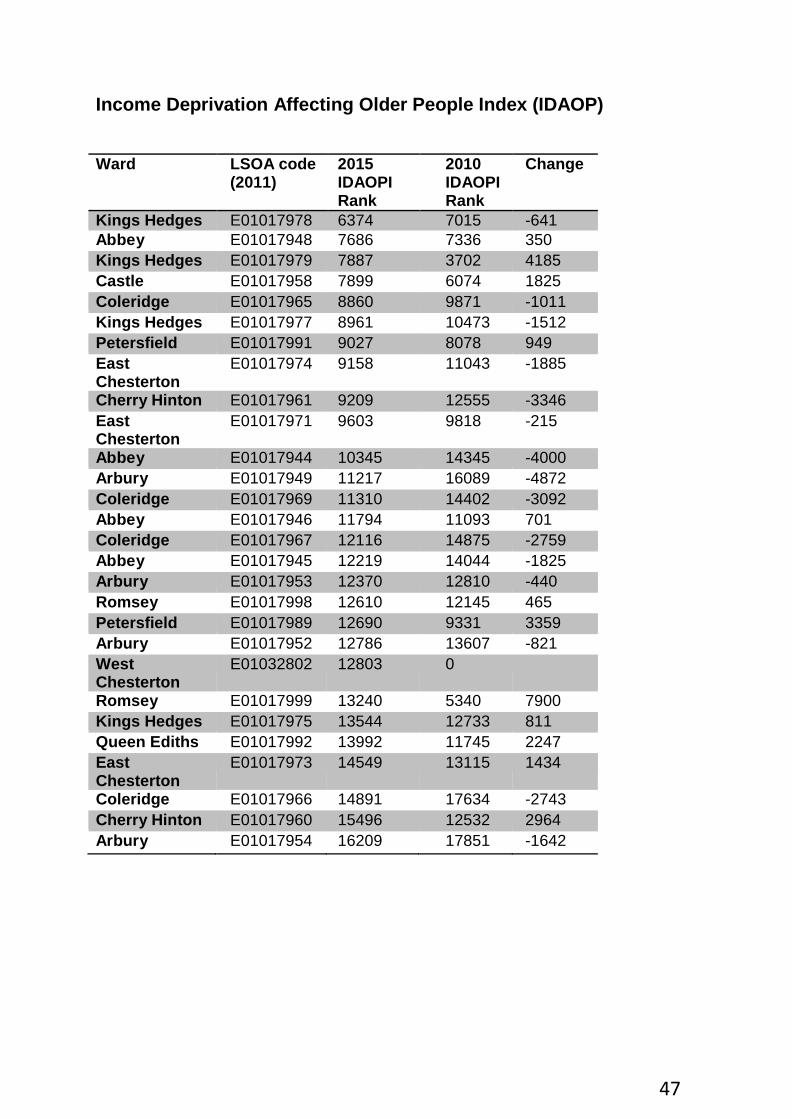
8. Income Deprivation Affecting Older People Index (IDAOP)
12
The Income Deprivation Affecting Older People Index (IDAOP) measures the proportion of all those aged 60 and over who experience income deprivation.
Main findings for IDAOP in Cambridge
• Cambridge’s Rank of Average Scores for IDAOP in 2015 was 182 out of the
326 district local authorities, with 1st being the most deprived. In comparison Fenland had a Rank of Average Score of 83 for IDAOP 2015.
• One of Cambridge’s 70 LSOAs fell within the worst 20% of LSOAs in the country in the Income Deprivation Affecting Older People Index (IDAOP).
• 22 LSOAs (31%) had a lower national ranking position in the IDAOP for 2015 compared to 2010 whilst 48 (69%) had improved their position.
• The lowest ranked LSOA in Cambridge for IDAOP was 1,300 places lower than the next ranked LSOA and contained just under a third of income deprived older people.
• The lower ranked IDAOP LSOAs have a greater distribution across the City and aren’t clustered in the North in the way that deprivation affecting children is.
• An LSOA in Romsey improved by 7,900 places in the national ranking for IDAOP between 2010 and 2015.
• One fifth of all LSOAs in Cambridge contain between 21% and 29% of older income deprived people over sixty years of age.
Map 9: Ten Lowest IDAOP LSOA Scores in Cambridge
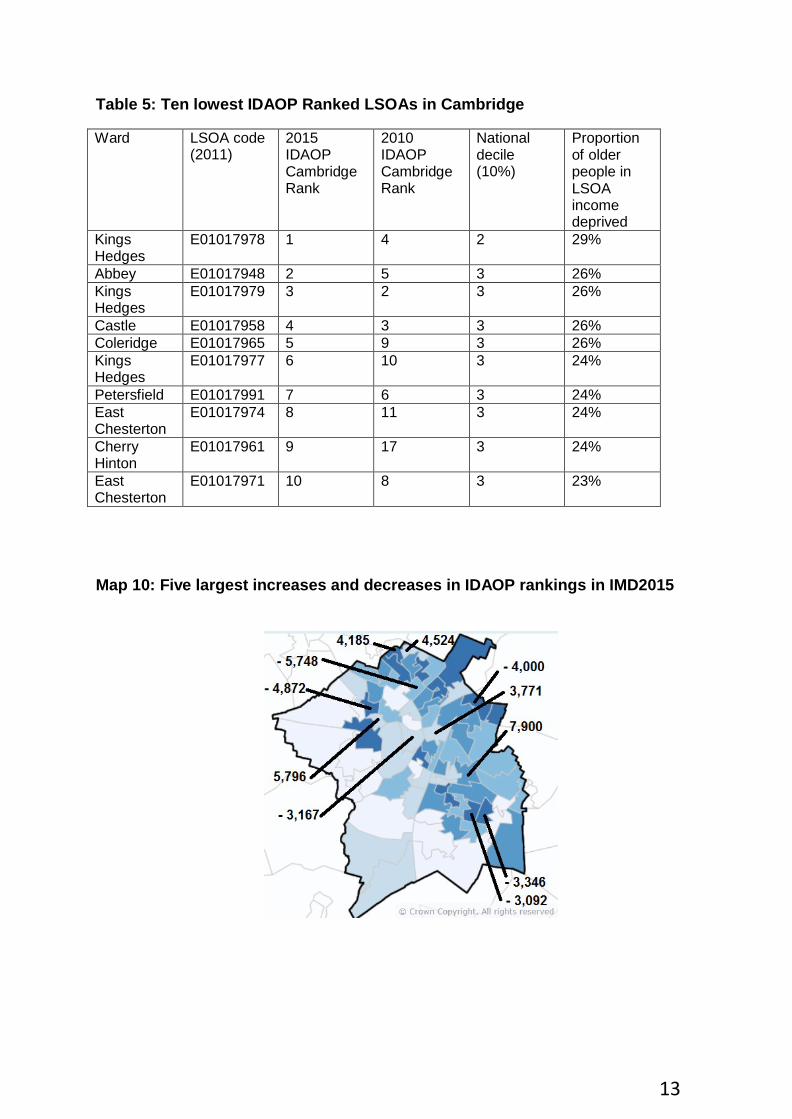
Table 5: Ten lowest IDAOP Ranked LSOAs in Cambridge
13
Ward LSOA code
(2011) 2015 IDAOP Cambridge Rank
2010 IDAOP Cambridge Rank
National decile (10%)
Proportion of older people in LSOA income deprived
Kings Hedges
E01017978 1 4 2 29%
Abbey E01017948 2 5 3 26% Kings Hedges
E01017979 3 2 3 26%
Castle E01017958 4 3 3 26% Coleridge E01017965 5 9 3 26% Kings Hedges
E01017977 6 10 3 24%
Petersfield E01017991 7 6 3 24% East Chesterton
E01017974 8 11 3 24%
Cherry Hinton
E01017961 9 17 3 24%
East Chesterton
E01017971 10 8 3 23%
Map 10: Five largest increases and decreases in IDAOP rankings in IMD2015

14
Table 6: Top five LSOAs showing changes in rankings
Ward LSOA code (2011)
2015 IDAOP Rank
2010 IDAOP Rank
Negative Change
West Chesterton
E01018006 19600 25348 -5748
Arbury E01017949 11217 16089 -4872 Abbey E01017944 10345 14345 -4000 Cherry Hinton E01017961 9209 12555 -3346 Market E01017983 23552 26719 -3167 Coleridge E01017969 11310 14402 -3092
Ward LSOA code (2011)
2015 IDAOP Rank
2010 IDAOP Rank
Positive Change
Romsey E01017999 13240 5340 7900 Trumpington E01018003 27986 21717 6269 Arbury E01017950 28546 22750 5796 Kings Hedges E01017980 25369 20845 4524 Kings Hedges E01017979 7887 3702 4185 Abbey E01017943 26212 22441 3771
15
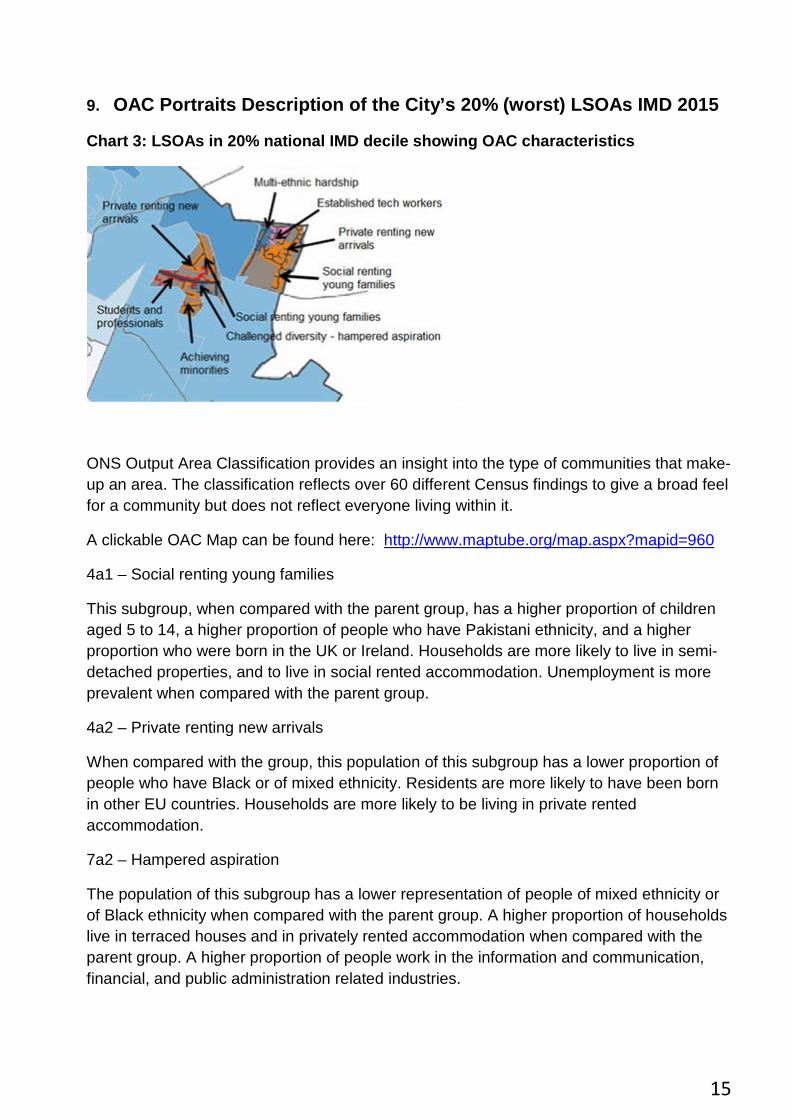
9. OAC Portraits Description of the City’s 20% (worst) LSOAs IMD 2015
Chart 3: LSOAs in 20% national IMD decile showing OAC characteristics
ONS Output Area Classification provides an insight into the type of communities that make-up an area. The classification reflects over 60 different Census findings to give a broad feel for a community but does not reflect everyone living within it.
A clickable OAC Map can be found here: http://www.maptube.org/map.aspx?mapid=960
4a1 – Social renting young families
This subgroup, when compared with the parent group, has a higher proportion of children aged 5 to 14, a higher proportion of people who have Pakistani ethnicity, and a higher proportion who were born in the UK or Ireland. Households are more likely to live in semi-detached properties, and to live in social rented accommodation. Unemployment is more prevalent when compared with the parent group.
4a2 – Private renting new arrivals
When compared with the group, this population of this subgroup has a lower proportion of people who have Black or of mixed ethnicity. Residents are more likely to have been born in other EU countries. Households are more likely to be living in private rented accommodation.
7a2 – Hampered aspiration
The population of this subgroup has a lower representation of people of mixed ethnicity or of Black ethnicity when compared with the parent group. A higher proportion of households live in terraced houses and in privately rented accommodation when compared with the parent group. A higher proportion of people work in the information and communication, financial, and public administration related industries.

16
7a3 – Multi-ethnic hardship
The age make-up of this subgroup is higher in the 5 to 14 age group when compared with the parent group. Whilst there are higher proportions of people of mixed or Black ethnicity, all ethnic groups are well represented, though a lower proportion of people were born in other EU countries. Households were more likely to live in semi-detached properties and were more likely to live in socially rented accommodation. Workers were more likely to be employed in transport or storage industries.
4c1 – Achieving minorities
The population of this subgroup has a higher proportion of people who have Pakistani ethnicity, and lower proportions with Chinese and Black ethnicity than the parent group. A lower proportion of residents were born in other EU countries. Households are more likely to live in detached and semi-detached properties, and to own their own property. Households are also less likely to live in overcrowded conditions.
3d2 – Established tech workers
The population of this subgroup is slightly more likely to have Black ethnicity and more likely to be born in the UK or Ireland, and to have non-dependent children. There is a higher proportion of households who live in terraced housing, and a higher proportion living in socially rented accommodation. Households are also less likely to live in overcrowded conditions.
2a3 – Students and professionals
The population in this subgroup contains higher proportions of children aged 0 to 14, and adults aged 25 and over than the parent group. The subgroup has a lower proportion of people living in communal establishments than the parent group, with higher proportions of people who are married or separated.

17
10. ACORN Consumer Classifications for 10 highest Ranked LSOAs
Acorn is a geodemographic segmentation of the UK's population. It segments households, postcodes and neighbourhoods into 6 categories, 18 groups and 62 types. By analysing significant social factors and population behaviour, it provides precise information and an in-depth understanding of the different types of people.
The User Guide (available to download at www.caci.co.uk/acorn) looks at each Acorn type across a wide range of demographic, behavioural and attitudinal attributes. The descriptions of each category, group and type provide an overview of the wider range of topics for which information is available.
Chart 4: E01017948 Profile

18
Chart 5: E01017946 Profile

19
Chart 6: E01017975 Profile

20
Chart 7: E01017977 Profile

21
Chart 8: E01017952 Profile

22
Chart 9: E01017944 Profile

23
Chart 10: E01017971 Profile

24
Chart 11: E01017978 Profile

25
Chart 12: E01017979 Profile

26
Chart 13: E01017953
27
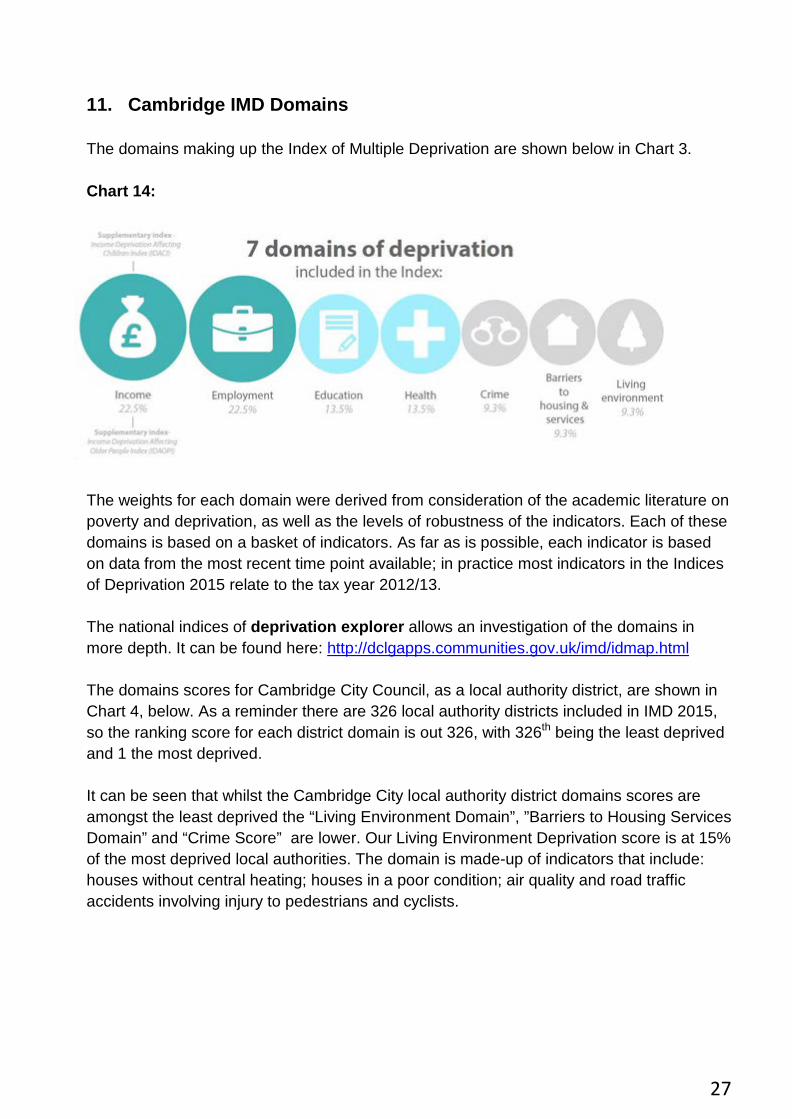
11. Cambridge IMD Domains The domains making up the Index of Multiple Deprivation are shown below in Chart 3. Chart 14:
The weights for each domain were derived from consideration of the academic literature on poverty and deprivation, as well as the levels of robustness of the indicators. Each of these domains is based on a basket of indicators. As far as is possible, each indicator is based on data from the most recent time point available; in practice most indicators in the Indices of Deprivation 2015 relate to the tax year 2012/13. The national indices of deprivation explorer allows an investigation of the domains in more depth. It can be found here: http://dclgapps.communities.gov.uk/imd/idmap.html The domains scores for Cambridge City Council, as a local authority district, are shown in Chart 4, below. As a reminder there are 326 local authority districts included in IMD 2015, so the ranking score for each district domain is out 326, with 326th being the least deprived and 1 the most deprived. It can be seen that whilst the Cambridge City local authority district domains scores are amongst the least deprived the “Living Environment Domain”, ”Barriers to Housing Services Domain” and “Crime Score” are lower. Our Living Environment Deprivation score is at 15% of the most deprived local authorities. The domain is made-up of indicators that include: houses without central heating; houses in a poor condition; air quality and road traffic accidents involving injury to pedestrians and cyclists.

28
Chart 15: Scores for Cambridge Domains of Deprivation 12. A Closer look at the Living Environment Domain (Worst City Domain) Map 11, below, extracted from the deprivation explorer, shows that we have six LSOAs (purple) that are in the worst 10% nationally for the “Living Environment Domain”. The worst scoring indicators that make-up the domain are pointing towards the LSOAs with the lowest rankings for these indicators. It seems that the “Outdoor Living” component of the domain, which consists of air quality and road traffic indicators are pushing this domain higher because these indicators have a greater comparative ranking.
• Air quality is an estimate of the concentration of four pollutants and is based on 2012 figures. The score for the LSOA is 1.24 with the worst nationally at 2.301
• Road traffic accidents are based on accidents that involve death or personal injury to a pedestrian or cyclist and is a rate per 1,000. The score is 2.55 for the LSOA with the worst nationally at 7.204. Housing without central heating is a measure of houses that are expensive to heat and is 0.054 for the LSOA with the worst nationally at 0.338.
• Housing in a poor condition is a modelled estimate of the proportion of social and private homes that fail to meet the Decent Homes standard. The score for the LSOA is 0.441 with the worst nationally 0.955.

29
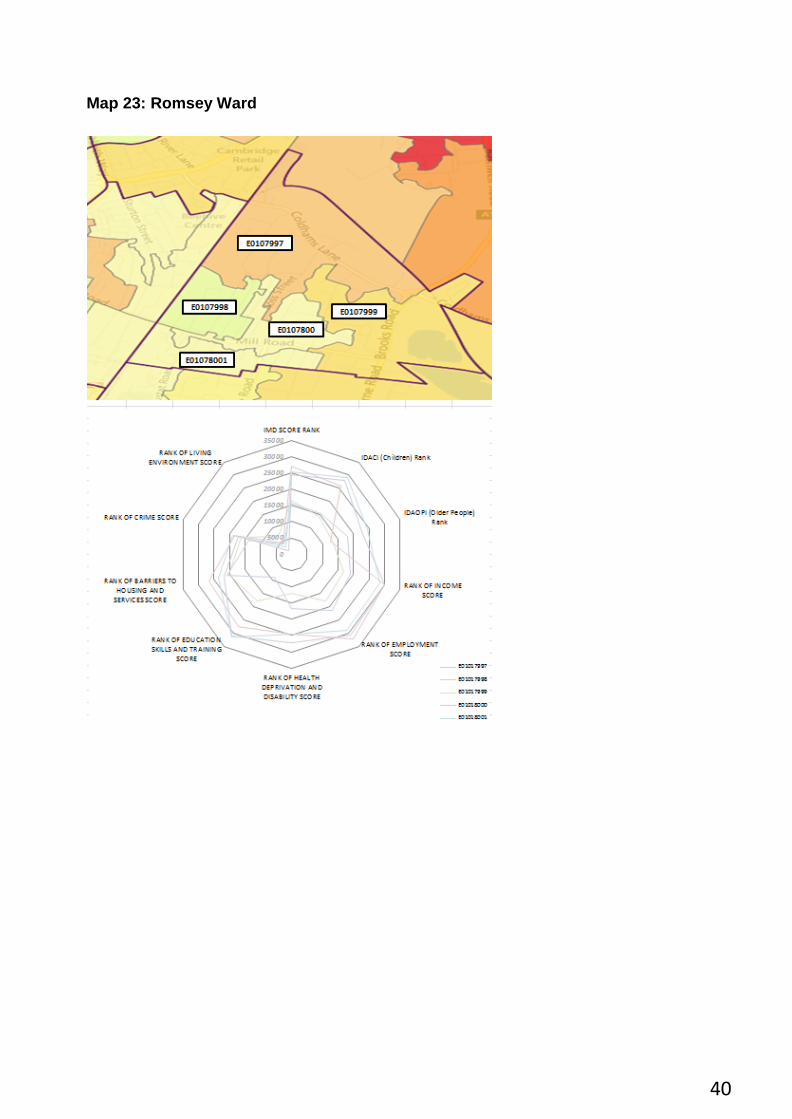
13. Looking at Cambridge IMD Domains by Ward There are usually six LSOAs in each ward with an average of roughly 1,500 residents and 650 households in an LSOA. The following maps (12 – 26) show the location of each LSOA in a ward, with its identifying number, and the charts show, in the form of a “spider diagram”, how each LSOA scores across 10 domains. Map 12: Abbey Ward

30
Map 13: Arbury Ward

31
Map 14: Castle Ward

32
Map 15: Cherry Hinton Ward

33
Map 16: Coleridge Ward

34
Map 17: East Chesterton Ward

35
Map 18: Kings Hedges Ward

36
Map 19: Market Ward

37
Map 20: Newnham Ward

38
Map 21: Petersfield Ward

39
Map 22: Queen Ediths Ward
40
Map 23: Romsey Ward

41
Map 24: Trumpington Ward

42
Map 25: West Chesterton

43
14. Data Tables
Cambridge LSOA IMD Rankings
Ward LSOA code (2011) IMD Rank 2015 IMD Rank 2010 Change Abbey E01017948 5,578 6769 -1,191 Abbey E01017946 5,861 6925 -1,064 Kings Hedges E01017975 8,245 7111 1,134 Kings Hedges E01017977 8,340 9208 -868 Arbury E01017952 8,539 7977 562 Abbey E01017944 8,888 9636 -748 East Chesterton E01017971 9,078 7949 1,129 Kings Hedges E01017978 9,123 6152 2,971 Kings Hedges E01017979 9,579 5942 3,637 Arbury E01017953 12,426 11556 870 Abbey E01017947 12,959 11503 1,456 Petersfield E01017991 13,158 11253 1,905 East Chesterton E01017974 14,030 9506 4,524 West Chesterton E01018009 14,056 10498 3,558 Abbey E01017945 14,080 11119 2,961 East Chesterton E01017972 14,219 10979 3,240 Arbury E01017954 15,381 15118 263 Cherry Hinton E01017960 15,598 13691 1,907 Romsey E01017997 15,748 16080 -332 Arbury E01017949 16,011 12769 3,242 Arbury E01017951 16,500 14468 2,032 Romsey E01017999 16,611 11108 5,503 Cherry Hinton E01017961 16,734 16082 652 Trumpington E01018005 16,831 12815 4,016 East Chesterton E01017973 17,080 13611 3,469 Coleridge E01017967 18,013 10246 7,767 Abbey E01017943 19,496 20692 -1,196 Cherry Hinton E01017962 19,566 16391 3,175 Coleridge E01017969 20,164 21058 -894 Queen Ediths E01017994 20,169 18939 1,230 Coleridge E01017965 20,736 20554 182 Cherry Hinton E01017963 20,785 15078 5,707 Kings Hedges E01017976 20,829 18333 2,496 Trumpington E01018002 21,114 20817 297 Kings Hedges E01017980 21,713 17835 3,878 Petersfield E01017989 23,129 16413 6,716 Trumpington E01018003 23,284 22708 576 Coleridge E01017966 23,555 22690 865 Petersfield E01017987 24,222 18421 5,801 Romsey E01018000 24,340 23642 698 Queen Ediths E01017992 24,659 21542 3,117

44
Romsey E01018001 25,197 20743 4,454 Newnham E01017984 25,496 30447 -4,951 Arbury E01017950 25,722 22015 3,707 Castle E01017956 25,735 27255 -1,520 Petersfield E01017990 26,147 22103 4,044 Market E01017983 26,205 19417 6,788 Castle E01017958 26,649 25032 1,617 West Chesterton E01018010 26,716 23859 2,857 Romsey E01017998 27,039 24694 2,345 West Chesterton E01018008 27,751 23189 4,562 Queen Ediths E01017993 28,013 26425 1,588 Petersfield E01017988 28,276 24070 4,206 Coleridge E01017968 28,403 24617 3,786 West Chesterton E01018006 28,502 26820 1,682 Castle E01017957 29,806 29403 403 Newnham E01017986 30,254 27504 2,750 Newnham E01017985 31,020 29978 1,042 Queen Ediths E01017996 31,094 29496 1,598 Cherry Hinton E01017959 31,096 27598 3,498 Castle E01017955 31,229 29850 1,379 West Chesterton E01018007 31,434 29124 2,310 Queen Ediths E01017995 31,931 31041 890 Cherry Hinton E01017964 32,287 30360 1,927
45
Income Deprivation Affecting Children Index (IDACI)
Ward LSOA code (2011)
2015 IDACI Rank
2010 IDACI Rank
Change
Abbey E01017948 4963 4802 161 Kings Hedges E01017975 5399 6478 -1079 East Chesterton
E01017971 6059 5316 743
Kings Hedges E01017978 6322 4249 2073 Arbury E01017954 6923 8711 -1788 East Chesterton
E01017974 8204 6184 2020
Kings Hedges E01017979 8519 7041 1478 Arbury E01017952 8990 9318 -328 East Chesterton
E01032802 9341
Arbury E01017953 9481 7118 2363 Abbey E01017947 9606 13544 -3938 Abbey E01017944 9714 6601 3113 Kings Hedges E01017977 9802 10997 -1195 Abbey E01017946 10765 8834 1931 East Chesterton
E01017972 10790 6919 3871
Cherry Hinton E01017960 11308 11082 226 East Chesterton
E01017973 12020 7296 4724
Castle E01017958 12906 17112 -4206 Abbey E01017943 13136 8573 4563 Petersfield E01017991 13460 11709 1751 Queen Ediths E01017994 14285 13326 959 Romsey E01017999 14454 11241 3213 Abbey E01017945 14668 10682 3986 Romsey E01017997 15541 10491 5050 Cherry Hinton E01017962 16383 10762 5621 Cherry Hinton E01017963 17084 15241 1843 Coleridge E01017967 17197 12862 4335 West Chesterton
E01018009 17207 15681 1526
Cherry Hinton E01017961 17519 15624 1895 Trumpington E01032795 17620 29214 Trumpington E01018002 17710 19819 -2109 East Chesterton
E01032792 17768 6919
Coleridge E01017969 18125 21448 -3323 Coleridge E01017965 18435 16905 1530 Arbury E01017949 18973 15799 3174

46
Kings Hedges E01017980 19248 14421 4827 Trumpington E01018003 20072 16783 3289 Arbury E01017951 20621 18136 2485 Kings Hedges E01017976 21701 24453 -2752 Queen Ediths E01017992 21954 18686 3268 Queen Ediths E01017993 22438 23189 -751 Petersfield E01017989 23181 15818 7363 Castle E01017955 24746 24393 353 Coleridge E01017966 25073 19062 6011 Trumpington E01018005 25097 18860 6237 Petersfield E01017987 25285 18418 6867 West Chesterton
E01018010 25356 32219 -6863
Romsey E01017998 25821 25612 209 Trumpington E01032794 26011 31402 Romsey E01018000 27992 24251 3741 Market E01032797 28155 20815 Cherry Hinton E01017959 28486 24677 3809 Romsey E01018001 29064 26805 2259 Petersfield E01017990 29119 22555 6564 Newnham E01017986 29364 29348 16 Queen Ediths E01017995 29607 30967 -1360 Newnham E01017985 30006 21680 8326 Cherry Hinton E01017964 30345 27078 3267 Arbury E01017950 30405 23500 6905 West Chesterton
E01018008 30533 27953 2580
Market E01017983 30773 21684 9089 Newnham E01017984 31239 28898 2341 Coleridge E01017968 31370 27922 3448 Petersfield E01017988 31376 32098 -722 West Chesterton
E01018006 31552 27172 4380
West Chesterton
E01018007 31777 31872 -95
Queen Ediths E01017996 31812 32266 -454 Castle E01017957 32372 32056 316 Castle E01017956 32547 32157 390
47
Income Deprivation Affecting Older People Index (IDAOP)
Ward LSOA code (2011)
2015 IDAOPI Rank
2010 IDAOPI Rank
Change
Kings Hedges E01017978 6374 7015 -641 Abbey E01017948 7686 7336 350 Kings Hedges E01017979 7887 3702 4185 Castle E01017958 7899 6074 1825 Coleridge E01017965 8860 9871 -1011 Kings Hedges E01017977 8961 10473 -1512 Petersfield E01017991 9027 8078 949 East Chesterton
E01017974 9158 11043 -1885
Cherry Hinton E01017961 9209 12555 -3346 East Chesterton
E01017971 9603 9818 -215
Abbey E01017944 10345 14345 -4000 Arbury E01017949 11217 16089 -4872 Coleridge E01017969 11310 14402 -3092 Abbey E01017946 11794 11093 701 Coleridge E01017967 12116 14875 -2759 Abbey E01017945 12219 14044 -1825 Arbury E01017953 12370 12810 -440 Romsey E01017998 12610 12145 465 Petersfield E01017989 12690 9331 3359 Arbury E01017952 12786 13607 -821 West Chesterton
E01032802 12803 0
Romsey E01017999 13240 5340 7900 Kings Hedges E01017975 13544 12733 811 Queen Ediths E01017992 13992 11745 2247 East Chesterton
E01017973 14549 13115 1434
Coleridge E01017966 14891 17634 -2743 Cherry Hinton E01017960 15496 12532 2964 Arbury E01017954 16209 17851 -1642

48
Coleridge E01017968 17359 17681 -322 East Chesterton
E01032792 17381 0
West E01018009 17809 17635 174 Chesterton Romsey E01017997 17990 16472 1518 Cherry Hinton E01017963 18195 15706 2489 Cherry Hinton E01017962 19454 20207 -753 West E01018006 19600 25348 -5748 Chesterton Arbury E01017951 19646 20452 -806 Trumpington E01018005 20436 17046 3390 Queen Ediths E01017994 20590 19424 1166 Abbey E01017947 20622 17144 3478 Kings Hedges E01017976 21097 20497 600 Petersfield E01017990 21394 18313 3081 Trumpington E01018002 21656 20100 1556 Trumpington E01032795 22105 0 East E01017972 22290 18642 3648 Chesterton Romsey E01018000 22743 24960 -2217 Market E01017983 23552 26719 -3167 Romsey E01018001 24397 21119 3278 Market E01032797 24476 0 Petersfield E01017987 25238 23909 1329 Kings Hedges E01017980 25369 20845 4524 Abbey E01017943 26212 22441 3771 Trumpington E01018003 27986 21717 6269 Castle E01017955 28127 28967 -840 Arbury E01017950 28546 22750 5796 West E01018008 29564 26568 2996 Chesterton Trumpington E01032794 29861 0 Newnham E01017985 30228 29219 1009 Cherry Hinton E01017964 31069 30354 715 Petersfield E01017988 31614 31569 45 West E01018010 31780 29624 2156 Chesterton Castle E01017957 31953 31075 878 Queen Ediths E01017993 32015 31632 383 Castle E01017956 32023 31886 137 Cherry Hinton E01017959 32034 31685 349 Newnham E01017986 32307 31751 556 Queen Ediths E01017995 32659 32144 515 West E01018007 32714 32308 406 Chesterton

49
Queen Ediths E01017996 32789 31500 1289 Newnham E01017984 32816 32432 384