
Brief Industrial Profile of Morena District Madhya Pradesh Morena.pdfPage 1 Government of India...
12
Page 1 Government of India Ministry of MSME Brief Industrial Profile of Morena District Madhya Pradesh Carried out by Br.MSME-Development Institute-Gwalior (Ministry of MSME, Govt. of India,) Phone/Fax 0751-2422590 e-mail: [email protected] Web- msmeindore.nic.in
Transcript of Brief Industrial Profile of Morena District Madhya Pradesh Morena.pdfPage 1 Government of India...

Page 1
Go v ern men t o f Ind i a
Min i s t ry o f MSME
Brief Industrial Profile of Morena District
Madhya Pradesh
Carried out by
B r .M S M E - D ev e lo p me n t I n s t i tu t e - Gw a l ior (Ministry of MSME, Govt. of India,)
Phone/Fax 0751-2422590
e-mail: [email protected]
Web- msmeindore.nic.in

Page 2
Contents
S. No. Topic Page No.
1. General Characteristics of the District 3
1.1 Location & Geographical Area 4
1.2 Topography 4
1.3 Availability of Minerals. 4
1.4 Forest 4
1.5 Administrative set up 4
2. District at a glance 5-6
2.1 Existing Status of Industrial Area in the District Morena 7
3. Industrial Scenario Of Morena 8
3.1 Industry at a Glance 8-9
3.2 Year Wise Trend Of Units Registered 9-10
3.3 Details Of Existing Micro & Small Enterprises & Artisan Units In
The District
10
3.4 Large Scale Industries / Public Sector undertakings 10
3.5 Major Exportable Item 10
3.6 Growth Trend 10
3.7 Vendorisation / Ancillarisation of the Industry 10
3.8 Medium Scale Enterprises 11
3.8.1 List of the units in Morena & near by Area 11
3.8.2 Major Exportable Item 11
3.9 Service Enterprises 11
3.9.2 Potentials areas for service industry 11
3.10 Potential for new MSMEs 11
4. Existing Clusters of Micro & Small Enterprise 11
5. General issues raised by industry association during the course of
meeting
11
6 12 Steps to set up MSMEs
Page 3
Brief Industrial Profile of Morena District
1.General Characteristics of the District
Morena district (Hindi: मुरैना जिला) is one of the 50 districts of the central Indian state of
Madhya Pradesh. The name, Morena is derived from the mor + raina means the place
where peacock is enormously found. Morena, which has an identity of being home to
perhaps the largest number of peacocks in the India. The district is part of Chambal
Division. The town of Morena is the district and divisional headquarters. The district has
a widely dispersed population of 1,965,137 as of 2011. Morena is fifth district in state in
density of population after Bhopal, Indore, Jabalpur, Gwalior. The district is mostly
farmland, and trains are a popular form of transportation, although they connect only
about 15% of the villages within Morena. Morena is famous for its mustard production.
1.1 Location & Geographical Area
Morena is located at 26°18′N 78°00′E & 26.30°N 78.00°E. Geographically Morena is an
interesting place as Madhya Pradesh touches two neighbouring states i.e. Rajasthan and
Uttar Pradesh here. Morena touches Dholpur (Rajasthan) in North-West and Pinahat
(Agra, Uttar Pradesh) in North-East. The neighbouring districts are Bhind, Gwalior,
Shivpuri and Sheopur.
1.2 Topography
The district is undergoing development in several stages. Under the Chambal Ayacut
Development project, a considerable part of Morena district’s topography is being
gradually ch The district is undergoing development in several stages. Under the
Chambal Ayacut Development anged with the reclamation of the ravines for agricultural
purposes. It is hoped that with this change, the district will be one of the most prolific and
developed district in the whole of Madhya Pradesh.

Page 4
1.3 Availability of Minerals.
PRODUCTION OF MINERAL 2010-11
S.NO. NAME OF MINERAL PRODUCTION in tones
2010-2011
MAJOR MINERAL
1.
2.
Lime Stone
Murum
1883 MT
17271 Cu. Metre
MINOR
1. .Clay 15034 Cu. Metre
2. Sand 10330 Cu. Metre
3. Flag Stone 43245 Cu. Metre
4. Dhoka stone 5356 Cu. Metre
5. Stone Gitti 25556 Cu. Metre
SOURCE:- DEPT. OF MINES & GEOLOGY.,
1.4 Forest:- The forest cover land is approx. 50666 hactarres.
1.5 Administrative set up.
Divisions Tehsils Blocks Nagarpalikas/ Nagar Panchayats
1.Morena 1.Morena 1.Morena 1.Morena
2.Banmore
2.Ambah 1.Amabh 1.Ambah 1.Ambah
2.Porsa 2.Porsa 2.Porsa
3.Joura 3.Joura 1.Joura
1.Joura 2.Pahadgarh
4.Sabalgarh
1.Sabalgarh 1.Sabalgarh 1.Sabalgarh
2.Kailaras 2.Kailars 2.Kailaras
3.Jhundpura

Page 5
2. District at a glance
S.No Particular Year Unit Statistics
1 Geographical features
(A) Geographical Data
i) Latitude 23° 45' 50'' and 25°
2' 55'' North
ii) Longitude 74° 42' 30'' and 75°
50' 20'' East
iii) Geographical Area Hectares
(B) Administrative Units
i) Sub divisions 2011 Nos. 4
ii) Tehsils 2011 Nos. 6
iii) Sub-Tehsil 2011 Nos. 7
iv) Patwar Circle 2011 Nos. 72
v) Panchayat Simitis 2011 Nos. 475
vi)Nagar nigam 2011 Nos. 0
vii) Nagar Palika 2011 Nos. 8
viii) Gram Panchayats 2011 Nos. 475
xi) Revenue villages 2011 Nos. 245
x) Assembly Area 2011 Nos. 6
2. Population
(A) Sex-wise
i) Male 2011 Nos. 10,68,364
ii) Female 2011 Nos. 8,96773
(B) Rural Population 2011 Nos. 9,90,490
3. Agriculture
A. Land utilization
i) Total Area 2010-11 Hectare 501700
ii) Forest cover 2010-11 “ 50666
iii) Non Agriculture Land 2010-11 “ 361434
v) Cultivable Barren land 2010-11 “ 89600
4. Forest
(i) Forest 2010-11 Ha. 50666
5. Livestock & Poultry
A. Cattle
i) Cows 2007 Nos. 176300
ii) Buffaloes 2007 Nos. 323700
B. Other livestock
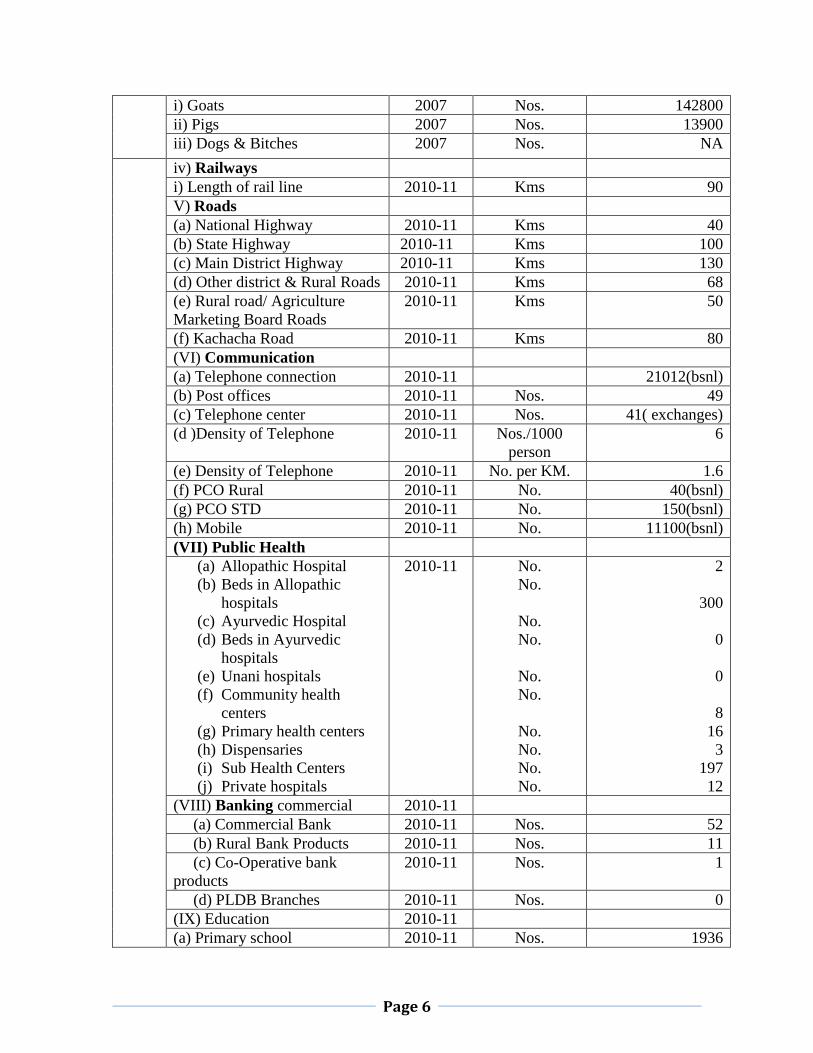
Page 6
i) Goats 2007 Nos. 142800
ii) Pigs 2007 Nos. 13900
iii) Dogs & Bitches 2007 Nos. NA
iv) Railways
i) Length of rail line 2010-11 Kms 90
V) Roads
(a) National Highway 2010-11 Kms 40
(b) State Highway 2010-11 Kms 100
(c) Main District Highway 2010-11 Kms 130
(d) Other district & Rural Roads 2010-11 Kms 68
(e) Rural road/ Agriculture
Marketing Board Roads
2010-11 Kms 50
(f) Kachacha Road 2010-11 Kms 80
(VI) Communication
(a) Telephone connection 2010-11 21012(bsnl)
(b) Post offices 2010-11 Nos. 49
(c) Telephone center 2010-11 Nos. 41( exchanges)
(d )Density of Telephone 2010-11 Nos./1000
person
6
(e) Density of Telephone 2010-11 No. per KM. 1.6
(f) PCO Rural 2010-11 No. 40(bsnl)
(g) PCO STD 2010-11 No. 150(bsnl)
(h) Mobile 2010-11 No. 11100(bsnl)
(VII) Public Health
(a) Allopathic Hospital
(b) Beds in Allopathic
hospitals
(c) Ayurvedic Hospital
(d) Beds in Ayurvedic
hospitals
(e) Unani hospitals
(f) Community health
centers
(g) Primary health centers
(h) Dispensaries
(i) Sub Health Centers
(j) Private hospitals
2010-11 No.
No.
No.
No.
No.
No.
No.
No.
No.
No.
2
300
0
0
8
16
3
197
12
(VIII) Banking commercial 2010-11
(a) Commercial Bank 2010-11 Nos. 52
(b) Rural Bank Products 2010-11 Nos. 11
(c) Co-Operative bank
products
2010-11 Nos. 1
(d) PLDB Branches 2010-11 Nos. 0
(IX) Education 2010-11
(a) Primary school 2010-11 Nos. 1936

Page 7
(b) Middle schools 2010-11 Nos. 552
(c) Secondary & senior
secondary schools
2010-11 Nos. 211
(d) Colleges 2010-11 Nos. 9
(e) Technical University 2010-11 Nos. 0
2.1 Existing Status of Industrial Areas in the District Morena
S.
No.
Name of
Ind. Area
Land
acquired
(In
hectare
Land
developed
(In
hectare)
Prevailing
Rate Per
Sqm
(In Rs.)
No
of
Plots
No of
allotted
Plots
No of
Vacant
Plots
No. of
Units in
Production
1 Industrial
Area,
Banmore
289 239.66 200/sq.
metre
-----
N.A. N.A. 127
2 Industrial
Area,
Morena
23.18 15.8 20/-
42 42 Nil 42
3 Industrial
Area,
kutravali
12.955 12.955
------do---
-
90 67 23 Nil
4 Industrial
Area,
Hingona
khurd
44.99 --------
-------- ------ ------- ------- -------
5 Total 370.125 268.415 --- 132 109 -- 169 Source:- DTIC Morena

Page 8
3. Industrial Scenario of Morena
3.1 Industry at a Glance
Sr
No
Head Unit Particulars
1. Registered Industrial Unit No. 12707
2. Total Industrial Unit No. 12707
3. Registered Medium & Large Unit No. 8
4. Estimated Avg. No. Of Daily Worker
Employed In Small Scale Industries
No. 31450
5. Employment In Large And Medium
Industries
No. 3458
6. No. Of Industrial Area No. 4
7. Turnover Of Small Scale Ind. In Lacs N.A.
8. Turnover Of Medium & Large Scale
Industries
In Lacs N.A.
3.2 Year Wise Trend of Units Registered
YEAR NUMBER OF
REGISTERED
UNITS
EMPLOYMENT INVESTMENT
(lakh Rs.)
Up to 1984-85 1739 6847 440.38
1985-86 239 769 99.54
1986-87 271 741 11.77
1987-88 353 981 176.44
1988-89 546 1185 94.54
1989-90 486 1045 154.44
1990-91 520 798 59.25
1991-92 623 1469 55.16
1992-93 590 1350 90.60
1993-94 384 896 185.37
1994-95 396 835 121.29
1995-96 413 876 71.71
1996-97 460 1048 97.68
1997-98 469 1251 480.45

Page 9
1998-99 470 1020 191.71
1999-2000 325 693 77.02
2000-01 329 642 240.45
2001-2002 329 643 206.78
2002-03 325 823 119.12
2003-04 403 765 214.88
2004-05 402 996 447.79
2005-06 406 878 423.31
2006-07 404 926 83.38
2007-08 408 1146 24.19
2008-09 528 997 710.27
2009-10 434 926 498.20
2010-11 450 904 900.88
Total 12702 31450 8324.68
Source: DTIC, Morena
3.3 Details of Existing Micro & Small Enterprises and Artisan Units in
the District
NIC
CODE
NO.
TYPE OF
INDUSTRY
NUMBER
OF UNITS
INVESTMENT
(Lakh Rs.)
EMPLOYMENT
20 Agro based 1413 2681.42 3650
22 Soda water Nil
23 Cotton textile 04 90.81 53
24. Woolen, silk & artificial Thread
based clothes.
Nil
25. Jute & jute based Nil
26. Ready-made garments &
embroidery
1428 133.15 2989
27. Wood/wooden based furniture 909 224.55 2066
28. Paper & Paper products 333 267.52 949
29. Leather based 852 118.96 2068
31. Chemical/Chemical based 148 289.71 518
30. Rubber, Plastic & petro based 102 449.67 285

Page 10
32. Mineral based 462 998.65 954
33. Metal based (Steel Fab.) 496 952.36 1848
35. Engineering units 434 467.58 1093
36. Electrical machinery and transport
equipment
Nil
97. Repairing & servicing 3191 864.22 7714
01. Others 2956 786.89 7263
Source: DTIC Morena
3.4 Large Scale Industries / Public Sector undertakings
List of the units in Morena & Near By Area
1. M/s JK Industries, Banmore
2. M/s Gwalior sahkari dugdha sangh maryadit , Banmore
3. M/s Trupti Alcohal Brew. Ltd. Mehtoli Near Banmore
4. M/s K.S. Oils ltd. Morena
3.5 Major Exportable Item
Tyre, Edible oil, Stone tiles.
3.6 Growth Trend
Based on the agricultural and minerals resources the district will grow faster. There is a
positive growth has been noticed.
3.7 Vendorisation/ Ancillarisation of the Industry:- Nil
3.8. Medium Scale Enterprises
3.8.1 List of the units in Morena & Near By Area
1/ M/s Punj Llyod Ltd. Banmore
2/ M/s Farseen Rubber Industries, Banmore
Page 11
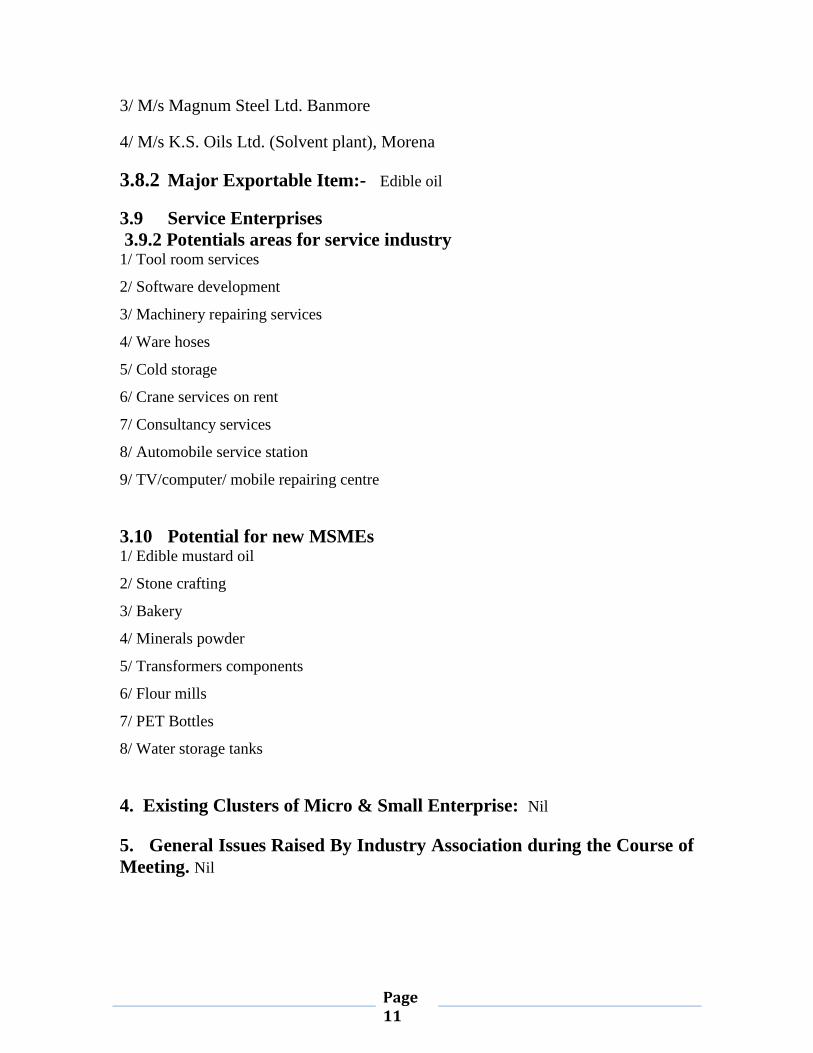
3/ M/s Magnum Steel Ltd. Banmore
4/ M/s K.S. Oils Ltd. (Solvent plant), Morena
3.8.2 Major Exportable Item:- Edible oil
3.9 Service Enterprises
3.9.2 Potentials areas for service industry 1/ Tool room services
2/ Software development
3/ Machinery repairing services
4/ Ware hoses
5/ Cold storage
6/ Crane services on rent
7/ Consultancy services
8/ Automobile service station
9/ TV/computer/ mobile repairing centre
3.10 Potential for new MSMEs 1/ Edible mustard oil
2/ Stone crafting
3/ Bakery
4/ Minerals powder
5/ Transformers components
6/ Flour mills
7/ PET Bottles
8/ Water storage tanks
4. Existing Clusters of Micro & Small Enterprise: Nil
5. General Issues Raised By Industry Association during the Course of
Meeting. Nil
Page 12
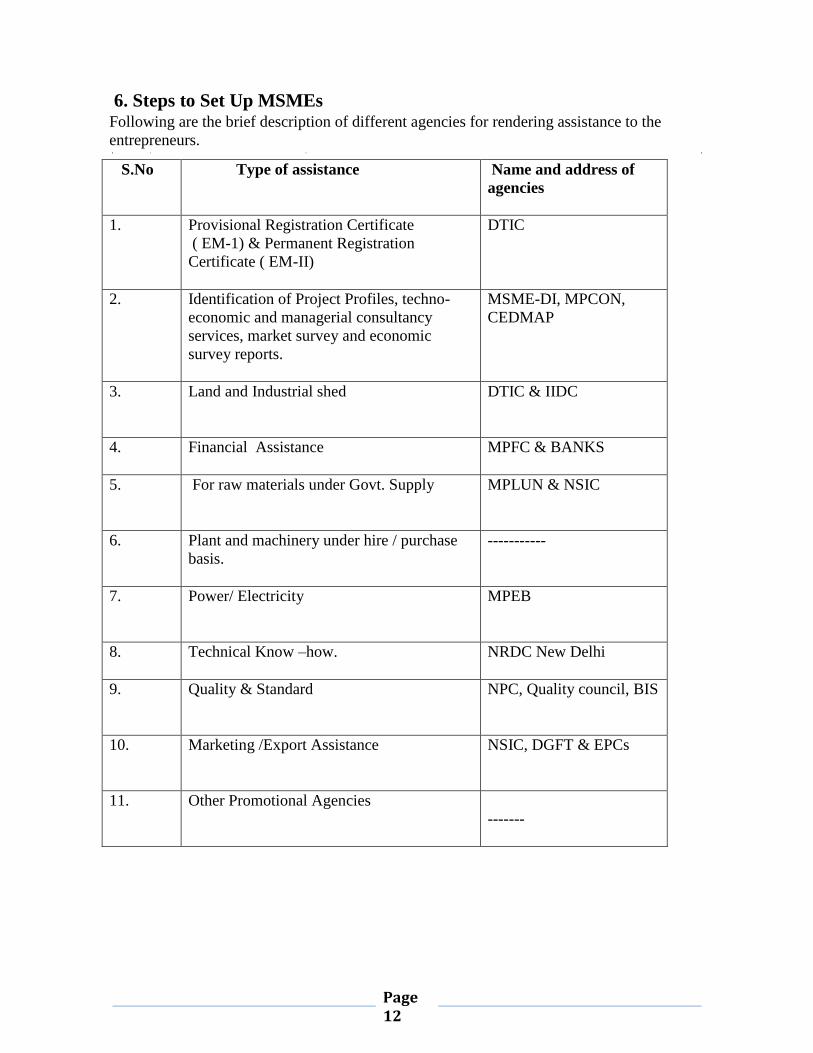
6. Steps to Set Up MSMEs Following are the brief description of different agencies for rendering assistance to the
entrepreneurs.
S.No
Type of assistance Name and address of
agencies
1. Provisional Registration Certificate
( EM-1) & Permanent Registration
Certificate ( EM-II)
DTIC
2. Identification of Project Profiles, techno-
economic and managerial consultancy
services, market survey and economic
survey reports.
MSME-DI, MPCON,
CEDMAP
3. Land and Industrial shed
DTIC & IIDC
4. Financial Assistance
MPFC & BANKS
5. For raw materials under Govt. Supply
MPLUN & NSIC
6. Plant and machinery under hire / purchase
basis.
-----------
7. Power/ Electricity
MPEB
8. Technical Know –how.
NRDC New Delhi
9. Quality & Standard
NPC, Quality council, BIS
10. Marketing /Export Assistance
NSIC, DGFT & EPCs
11. Other Promotional Agencies
-------


