Brief daily binocular vision prevents monocular deprivation effects in
11
Brief daily binocular vision prevents monocular deprivation effects in visual cortex D. Samuel Schwarzkopf, 1 Vasily Vorobyov, 1 Donald E. Mitchell 2 and Frank Sengpiel 1 1 Cardiff School of Biosciences, Cardiff University, Cardiff CF10 3US, UK 2 Department of Psychology, Dalhousie University, Halifax NS, B3H 4J1, Canada Keywords: cat, developmental plasticity, ocular dominance, optical imaging, V1, visually evoked potentials Abstract Even short periods of early monocular deprivation result in reduced cortical representation and visual acuity of the deprived eye. However, we have shown recently that the dramatic deprivation effects on vision can be prevented entirely if the animal receives a brief period of concordant binocular vision each day. We examine here the extent to which the cortical deprivation effects can be counteracted by daily periods of normal experience. Cats received variable daily regimens of monocular deprivation (by wearing a mask) and binocular vision. We subsequently assessed visual cortex function with optical imaging of intrinsic signals and visually evoked potential recordings. Regardless of the overall length of visual experience, daily binocular vision for as little as 30 min, but no less, allowed normal ocular dominance and visual responses to be maintained despite several times longer periods of deprivation. Thus, the absolute amount of daily binocular vision rather than its relative share of the daily exposure determined the outcome. When 30 min of binocular exposure was broken up into two 15-min blocks flanking the deprivation period, ocular dominance resembled that of animals with only 15 min of binocular vision, suggesting that binocular experience must be continuous to be most effective. Our results demonstrate that normal experience is clearly more efficacious in maintaining normal functional architecture of the visual cortex than abnormal experience is in altering it. The beneficial effects of very short periods of binocular vision may prevent any long- term effects (amblyopia) from brief periods of compromised vision through injury or infection during development. Introduction The mammalian cerebral cortex displays remarkable experience- dependent plasticity, in particular during a critical period early in life. Wiesel and Hubel showed in their classic experiments (Wiesel & Hubel, 1963, 1965) that an early period of monocular deprivation (MD) causes neurons in the primary visual cortex (V1) to become driven almost exclusively by the open, non-deprived eye. This physiological effect is mirrored anatomically by shrinkage of the deprived eye’s ocular dominance (OD) columns (Shatz & Stryker, 1978). Vision through the deprived eye is severely degraded or lost altogether (Giffin & Mitchell, 1978; Mitchell, 1988) in this animal model of deprivation amblyopia (Mitchell, 1989). Although it is economical to allot more of the available neuronal resources to the processing of information from the good eye instead of wasting half on the deprived one, such dramatic changes to cortical function and visual capability after only transient periods of MD would appear to be maladaptive. Transient conditions such as injury or infections of lid margins or conjunctiva could have disastrous consequences, effectively rendering one eye useless. Although even periods of deprivation as short as 6 h can cause significant shifts in ocular dominance (Frank et al., 2001), we and others have recently shown that following a period of continuous monocular exposure, recovery is rapid (within a few days) and substantial, if the deprived eye is simply re-opened and the subsequent binocular experience is concordant (Mitchell & Gingras, 1998; Mitchell et al., 2001; Kind et al., 2002). Here we investigated how successive periods of monocular and binocular vision each day are weighted in terms of their influence on visual cortical function. If all types of visual experience were equally instructive, then one would expect to observe cortical deprivation effects of graded severity proportional to the ratios of monocular and binocular visual exposure. A recent behavioural study indicated that this might not be the case. Mitchell et al. (2003) found that 2 h of binocular experience per day allowed kittens to develop normal grating acuity for both eyes despite the animals receiving 5 h of monocular vision each day. In this context, it made no difference whether the period of daily mixed monocular and binocular experience followed a month of dark-rearing from birth, or whether it was preceded by a month of normal binocular visual experience, which presumably led to the establishment of a normal, predominantly binocular V1. The intriguing behavioural consequences of mixed normal and abnormal experience pose questions concerning its neural basis and, in particular, the role of visually driven activity in development of the visual cortex. In an earlier single-cell study (Olson & Freeman, 1980), kittens that had experienced daily regimens of 4 h of monocular and 14 h of normal binocular vision exhibited, perhaps unsurprisingly, normal ocular dominance distributions. We set out to determine the minimum requirements for maintaining normal V1 function. Kittens were reared with various regimens of daily periods of monocular and binocular exposure. The V1 ocular dominance architecture was assessed through optical imaging of intrinsic signals, a technique that gathers information from a very large number of cells and thus overcomes the problem of sampling bias inherent to single-cell recordings (Bonhoeffer & Grinvald, 1996; Zepeda et al., 2004). We Correspondence: Dr F. Sengpiel, as above. E-mail: [email protected] Received 20 September 2006, revised 25 October 2006, accepted 31 October 2006 European Journal of Neuroscience, Vol. 25, pp. 270–280, 2007 doi:10.1111/j.1460-9568.2006.05273.x ª The Authors (2007). Journal Compilation ª Federation of European Neuroscience Societies and Blackwell Publishing Ltd
Transcript of Brief daily binocular vision prevents monocular deprivation effects in

Brief daily binocular vision prevents monoculardeprivation effects in visual cortex
D. Samuel Schwarzkopf,1 Vasily Vorobyov,1 Donald E. Mitchell2 and Frank Sengpiel11Cardiff School of Biosciences, Cardiff University, Cardiff CF10 3US, UK2Department of Psychology, Dalhousie University, Halifax NS, B3H 4J1, Canada
Keywords: cat, developmental plasticity, ocular dominance, optical imaging, V1, visually evoked potentials
Abstract
Even short periods of early monocular deprivation result in reduced cortical representation and visual acuity of the deprived eye.However, we have shown recently that the dramatic deprivation effects on vision can be prevented entirely if the animal receives abrief period of concordant binocular vision each day. We examine here the extent to which the cortical deprivation effects can becounteracted by daily periods of normal experience. Cats received variable daily regimens of monocular deprivation (by wearing amask) and binocular vision. We subsequently assessed visual cortex function with optical imaging of intrinsic signals and visuallyevoked potential recordings. Regardless of the overall length of visual experience, daily binocular vision for as little as 30 min, but noless, allowed normal ocular dominance and visual responses to be maintained despite several times longer periods of deprivation.Thus, the absolute amount of daily binocular vision rather than its relative share of the daily exposure determined the outcome. When30 min of binocular exposure was broken up into two 15-min blocks flanking the deprivation period, ocular dominance resembled thatof animals with only 15 min of binocular vision, suggesting that binocular experience must be continuous to be most effective. Ourresults demonstrate that normal experience is clearly more efficacious in maintaining normal functional architecture of the visualcortex than abnormal experience is in altering it. The beneficial effects of very short periods of binocular vision may prevent any long-term effects (amblyopia) from brief periods of compromised vision through injury or infection during development.
Introduction
The mammalian cerebral cortex displays remarkable experience-dependent plasticity, in particular during a critical period early in life.Wiesel and Hubel showed in their classic experiments (Wiesel &Hubel, 1963, 1965) that an early period of monocular deprivation(MD) causes neurons in the primary visual cortex (V1) to becomedriven almost exclusively by the open, non-deprived eye. Thisphysiological effect is mirrored anatomically by shrinkage of thedeprived eye’s ocular dominance (OD) columns (Shatz & Stryker,1978). Vision through the deprived eye is severely degraded or lostaltogether (Giffin & Mitchell, 1978; Mitchell, 1988) in this animalmodel of deprivation amblyopia (Mitchell, 1989).Although it is economical to allot more of the available neuronal
resources to the processing of information from the good eye insteadof wasting half on the deprived one, such dramatic changes to corticalfunction and visual capability after only transient periods of MDwould appear to be maladaptive. Transient conditions such as injury orinfections of lid margins or conjunctiva could have disastrousconsequences, effectively rendering one eye useless. Although evenperiods of deprivation as short as 6 h can cause significant shifts inocular dominance (Frank et al., 2001), we and others have recentlyshown that following a period of continuous monocular exposure,recovery is rapid (within a few days) and substantial, if the deprivedeye is simply re-opened and the subsequent binocular experience isconcordant (Mitchell & Gingras, 1998; Mitchell et al., 2001; Kind
et al., 2002). Here we investigated how successive periods ofmonocular and binocular vision each day are weighted in terms oftheir influence on visual cortical function. If all types of visualexperience were equally instructive, then one would expect to observecortical deprivation effects of graded severity proportional to the ratiosof monocular and binocular visual exposure. A recent behaviouralstudy indicated that this might not be the case. Mitchell et al. (2003)found that 2 h of binocular experience per day allowed kittens todevelop normal grating acuity for both eyes despite the animalsreceiving 5 h of monocular vision each day. In this context, it made nodifference whether the period of daily mixed monocular and binocularexperience followed a month of dark-rearing from birth, or whether itwas preceded by a month of normal binocular visual experience,which presumably led to the establishment of a normal, predominantlybinocular V1.The intriguing behavioural consequences of mixed normal and
abnormal experience pose questions concerning its neural basis and, inparticular, the role of visually driven activity in development of thevisual cortex. In an earlier single-cell study (Olson & Freeman, 1980),kittens that had experienced daily regimens of 4 h of monocular and14 h of normal binocular vision exhibited, perhaps unsurprisingly,normal ocular dominance distributions. We set out to determine theminimum requirements for maintaining normal V1 function. Kittenswere reared with various regimens of daily periods of monocular andbinocular exposure. The V1 ocular dominance architecture wasassessed through optical imaging of intrinsic signals, a technique thatgathers information from a very large number of cells and thusovercomes the problem of sampling bias inherent to single-cellrecordings (Bonhoeffer & Grinvald, 1996; Zepeda et al., 2004). We
Correspondence: Dr F. Sengpiel, as above.E-mail: [email protected]
Received 20 September 2006, revised 25 October 2006, accepted 31 October 2006
European Journal of Neuroscience, Vol. 25, pp. 270–280, 2007 doi:10.1111/j.1460-9568.2006.05273.x
ª The Authors (2007). Journal Compilation ª Federation of European Neuroscience Societies and Blackwell Publishing Ltd

determined the relative cortical area of ocular dominance domainsdedicated to the two eyes, as well as visually evoked potentials as aphysiological measure of acuity (Berkley & Watkins, 1973; Freemanet al., 1983).
Materials and methods
Rearing details
All procedures were approved by local ethical review and covered byUK Home Office licences. Forty-seven cats were used in this study.Selective rearing was carried out for about 3 weeks, starting at thepeak of the critical period between postnatal days 30 and 35. Subjectswere subdivided into two cohorts: 23 subjects were permitted 7 h ofvisual exposure per day, the other group of 24 subjects only 3.5 h. Anadditional three subjects received just 0.25 h of visual exposure, all ofwhich was binocular. For the remainder of the day animals were keptin complete darkness, together with their mother. The room in whichthey were reared contained cardboard boxes, toys, and furniture forenvironmental enrichment. Animals were encouraged to play to keepthem awake and active during the period of visual exposure.
Each animal was assigned to one of various rearing regimens, whichdetermined the order and duration of MD and binocular exposure (BE)it received on a daily basis (see Table 1). The period of BE was 0 h,0.25 h, 0.5 h, 1 h or 2 h and either preceded or followed the period ofMD. Six subjects were permitted two binocular periods of 0.25 hwhich flanked the monocular period. Four subjects in each cohortserved as controls and received binocular vision only. Deprivation wascarried out by means of completely opaque eye patches made fromsurgical face masks that were fastened with velcro bands.
During the period of visual exposure the animals were monitoredregularly to readjust the masks, if necessary. Whenever a mask slippedand permitted binocular experience this was recorded and the averagemaximal time of binocular experience was calculated for each subjectat the end of the rearing period. After the first few days subjects
usually adapted well to wearing the eye patches, and any unintentionalbinocular exposure caused by removal of a mask rarely exceeded afew minutes.
Optical imaging
On the day of data collection, animals did not receive any visualexposure. At the end of the dark-rearing period, anesthesia wasinduced by i.m. administration of ketamine (20–40 mg ⁄ kg) andxylazine (4 mg ⁄ kg). Atropine (0.2 mg ⁄ kg i.m.) was given to reducemucus secretion. A tracheotomy was performed and the animals wereintubated and placed on a heating blanket in a stereotactic frame.Subjects were artificially ventilated with an N2O ⁄ O2 mixture (60 : 40)and isoflurane (2–3% during surgery; 1–1.5% during data collection).End-tidal CO2 (3.5–4.0%), rectal temperature (37.5–38.0 �C), elec-trocardiogram (150–200 b.p.m.) and electroencephalogram weremonitored throughout the experiment and adequate measures takenif any of the values diverged from the described target values.Atropine and phenylephrine were administered to the eyes, whichwere fitted with gas-permeable contact lenses, to protect them and tofocus the animal’s vision onto the stimulus display.An intravenous catheter was inserted in one of the hind legs for
administration of drugs and for a continuous infusion of 4% glucose insaline at a rate of 3 mL ⁄ kg ⁄ h; the infusion solution also containeddexamethasone (Dexafort, Intervet, UK; 0.2 mg ⁄ kg ⁄ h) for preventionof cortical oedema, and gallamine triethiodide (Sigma, UK;10 mg ⁄ kg ⁄ h) for prevention of eye movements. The posterior portionof the lateral gyrus, containing the central visual field representation ofthe primary visual cortex, was exposed in both hemispheres throughcraniotomy. For some animals the dura was also removed because itsopacity and vascularization would have compromised data collection.The cortical surface was carefully cleared and kept free from any tracesof blood using Sugi sterile swabs (Kettenbach, Eschenburg, Germany).A titanium chamber was cemented to the skull and sealed on the insidewith dental wax. The chamber was filled through an inlet with siliconeoil and closed with a cover slip (Bonhoeffer & Grinvald, 1996).Initially, the exposed brain was illuminated with green light and a
reference image of the surface vascular pattern was taken. Subse-quently, the cortex was illuminated with red light at 700 nm. Intrinsicsignals were recorded using an enhanced differential imaging system(Imager 2001, Optical Imaging Inc., Mountainside, NJ, USA), withthe camera focused approximately 500 lm below the cortical surface.Images were therefore obtained primarily from layers 2 ⁄ 3, which arethought to play a key role in initiating cortical plasticity in response toaltered visual experience (Trachtenberg et al., 2000; Trachtenberg &Stryker, 2001). The imaged area subtended about 12 mm by 9 mm.The animal’s eyes were focused on a 21-inch computer monitor
(distance, 33 cm), on which stimuli were displayed by a visualstimulus generator (VSG Series 3; Cambridge Research Systems,Rochester, UK). They consisted of high-contrast sinusoidal or square-wave gratings (0.1–0.6 cycles per degree; mean luminance, 38 cd/m2)of four different orientations (0�, 45�, 90� and 135�), drifting at atemporal frequency of 2 Hz, randomly interleaved with trials in whichthe screen was blank. Activity maps were analysed using IDL software(RSI, Boulder, CO, USA). Single-condition responses (averages of48–64 trials per eye and orientation) were divided (a) by responses tothe blank screen, and (b) by the sum of responses to all fourorientations (‘cocktail blank’; Bonhoeffer & Grinvald, 1996) to obtainiso-orientation maps. Orientation preference maps were calculated byvectorial addition of four blank-divided iso-orientation maps, andpseudo-colour coded.
Table 1. Rearing conditions and actual daily binocular exposure of allanimals included in this study
Group N (OI) N (VEP) VE (h) BE (h)
0 ⁄ 3.5 1 1 3.5 0.08 –0.25 ⁄ 3.5 5 5 3.5 0.28 ± 0.010.5 ⁄ 3.5 4 5 3.5 0.56 ± 0.041 ⁄ 3.5 4 4 3.5 1.04 ± 0.022 ⁄ 3.5 1 1 3.5 2.02 –3.5 ⁄ 3.5 4 4 3.5 3.52 ± 0.020 ⁄ 7 4 3 7.0 0.08 ± 0.030.25 ⁄ 7 1 1 7.0 0.32 –0.5 ⁄ 7 3 3 7.0 0.58 ± 0.031 ⁄ 7 4 4 7.0 1.09 ± 0.062 ⁄ 7 3 4 7.0 2.05 ± 0.017 ⁄ 7 4 4 7.0 6.98 ± 0.022 · 0.25 ⁄ 3.5 3 4 3.5 0.54 ± 0.022 · 0.25 ⁄ 7 3 3 7.0 0.56 ± 0.020.25 ⁄ 0.25 3 3 0.25 0.25 ± 0.00
The first column (labelled ‘Group’) gives the nominal rearing condition inhours of binocular exposure per hours of total daily visual exposure. Theanimals which received two equal periods of binocular exposure flanking aperiod of monocular exposure are listed, respectively, as 2 · 0.25 ⁄ 3.5 and2 · 0.25 ⁄ 7.0. The second and third columns give the number of animals pergroup for which optical imaging maps or VEP data were obtained. The fourthcolumn (VE) gives the total daily visual exposure in hours. The final column(BE) gives the actual daily binocular exposure averaged across all animals ineach experimental group (±SEM).
Effects of mixed binocular and monocular vision 271
ª The Authors (2007). Journal Compilation ª Federation of European Neuroscience Societies and Blackwell Publishing LtdEuropean Journal of Neuroscience, 25, 270–280
Stimuli were presented to the two eyes separately in randomizedsequence by means of shutters placed in front of the animal. Oculardominance maps were calculated by dividing all responses to one eyeby the responses to the other. The actual signal used for subsequentquantitative analysis was reflectance change (DR ⁄ R) for each pixel,given at 16-bit precision. For analysis of the relative strength ofresponses through the two eyes, images were only low-pass filtered(smoothed). For analysis of areas responding preferentially throughone or the other eye (see below), images were additionally high-passfiltered well above the periodicity of ocular dominance domains (cut-off, 200 pixels ¼ 7.8 mm) to level the image intensity across theregion of interest. For illustrations, signals were range-fitted such thatthe 1.5% most responsive (least responsive) pixels were set to black(white), and Gaussian averaging over 6 pixels was applied to removehigh-frequency noise. Signal amplitude was displayed on an 8-bitgrey-scale.To quantify cortical territory occupied by the two eyes, for each
hemisphere a region of interest (ROI) was defined using IDL software(RSI). We manually excluded blood vessel and other artefacts using animage of the cortical surface taken under green-light illumination forguidance. Based on differential responses to gratings of high (0.4–0.6cycles per degree) and low (0.1–0.2 cycles per degree) spatialfrequency, analysis was restricted to V1 (Bonhoeffer et al., 1995). Inorder to minimize subjectiveness in defining the ROI, IDL softwareshifted the ROI by ± 10 pixels in x- and y-coordinates and calculatedmean results across all shift conditions. The ratio of the numbers ofpixels responding more strongly to the left and the right eye,respectively, were calculated. Finally, the percentages of pixelsresponding to the deprived eye and non-deprived eye were averagedacross both hemispheres.
Visually evoked potential (VEP) recording
After imaging data acquisition was completed, the chamber wasreopened and the silicone oil replaced with saline for VEP recording.A silver ball electrode was placed on the surface of the primary visualcortex near the representation of the area centralis (approximateHorsley–Clarke coordinates, P4 L2). The recorded signal was ampli-fied by a factor of 20 000 and low-pass filtered (cut-off, 300 Hz).Usually, four recordings were made, recording from each hemisphereand stimulating each eye separately. Stimuli were displayed on acomputer screen at a distance of 100 cm and consisted of phase-reversing square wave horizontal gratings of 98% contrast that variedonly in spatial frequency, typically from 0.14 to 2.26 cycles perdegree. For animals that showed a very pronounced deprivation effect,an additional set of low frequencies (0.05–0.4 cycles per degree) wasused for the deprived eye. Gratings reversed contrast at a rate of 1 Hzand drifted upwards at a velocity of 0.1 cycles ⁄ s. Moreover, a blankscreen was used to measure the baseline response. Stimuli werepresented to the left and right eye separately for 3 s, corresponding tosix contrast reversals, with interstimulus intervals of 3 s. Responseswere averaged across the six contrast reversals per presentation andacross 20 presentations of each stimulus using software written inLabVIEW (National Instruments, Austin, TX, USA). The resultingsignals therefore constituted the responses to 120 contrast reversalseach per stimulus. The total amplitude of the VEP signal was definedas the difference in voltage between the signal peak and thesubsequent trough within a 500-ms window.As a physiological measurement of visual acuity, the VEP cut-off
point was determined from the VEP amplitude vs. spatial frequencycurve. We fitted a straight line through the final 3–4 descending data
points, and calculated the spatial frequency of its intersection with aline corresponding to the blank response plus standard error.Additionally, a ratio of the VEP amplitudes through the two eyeswas calculated by dividing the sum of the amplitudes in response tothe four lowest spatial frequencies for the deprived eye by the samesum obtained for the non-deprived eye.After all data collection was completed, the animal was killed via an
i.v. overdose of barbiturate.
Results
Effects of rearing regimens on ocular dominance maps
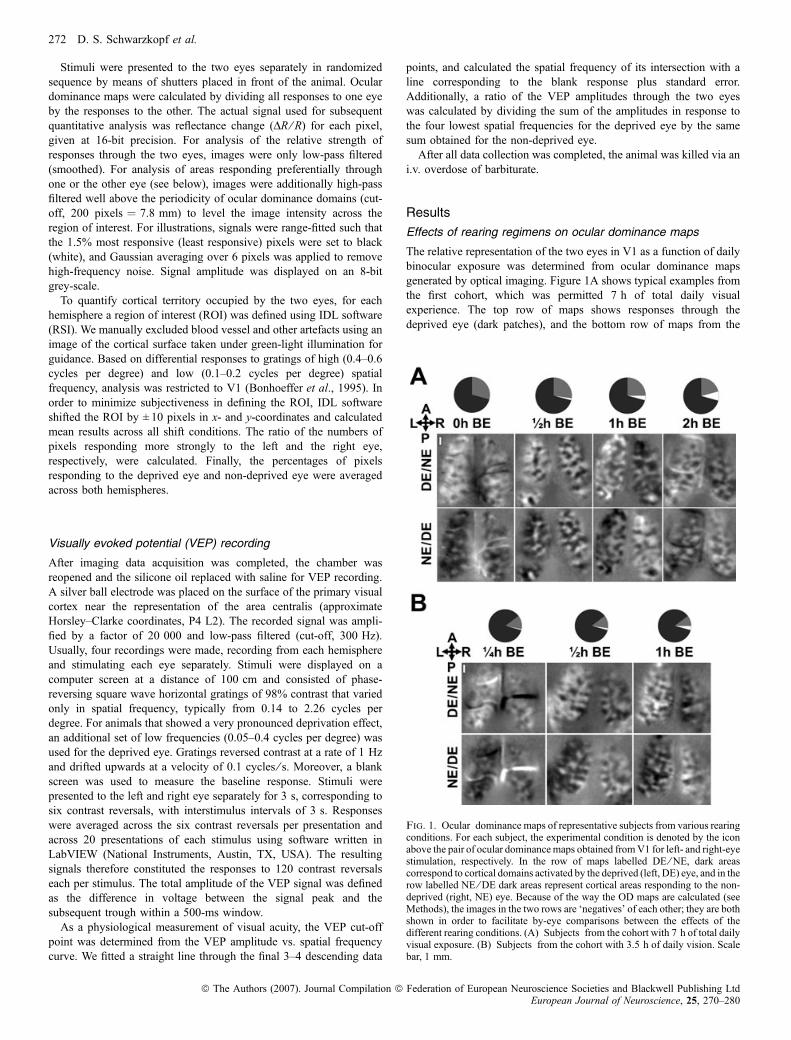
The relative representation of the two eyes in V1 as a function of dailybinocular exposure was determined from ocular dominance mapsgenerated by optical imaging. Figure 1A shows typical examples fromthe first cohort, which was permitted 7 h of total daily visualexperience. The top row of maps shows responses through thedeprived eye (dark patches), and the bottom row of maps from the
Fig. 1. Ocular dominance maps of representative subjects from various rearingconditions. For each subject, the experimental condition is denoted by the iconabove the pair of ocular dominancemaps obtained fromV1 for left- and right-eyestimulation, respectively. In the row of maps labelled DE ⁄ NE, dark areascorrespond to cortical domains activated by the deprived (left, DE) eye, and in therow labelled NE ⁄ DE dark areas represent cortical areas responding to the non-deprived (right, NE) eye. Because of the way the OD maps are calculated (seeMethods), the images in the two rows are ‘negatives’ of each other; they are bothshown in order to facilitate by-eye comparisons between the effects of thedifferent rearing conditions. (A) Subjects from the cohort with 7 h of total dailyvisual exposure. (B) Subjects from the cohort with 3.5 h of daily vision. Scalebar, 1 mm.
272 D. S. Schwarzkopf et al.
ª The Authors (2007). Journal Compilation ª Federation of European Neuroscience Societies and Blackwell Publishing LtdEuropean Journal of Neuroscience, 25, 270–280
same animals shows responses through the non-deprived eye. It isimmediately apparent that the longer the period of daily binocularexposure (from left to right, 0, 0.5, 1 and 2 h) the larger was the arearesponding to deprived-eye stimulation. Conversely, in the animalwith 0 h of binocular exposure most of the imaged cortex respondedexclusively to non-deprived eye stimulation but this over-representa-tion decreased dramatically in the 0.5-h condition and further still inthe 1- and 2-h conditions.
The subject displayed from the 0-h condition (i.e. no binocularexposure) exhibited an ocular dominance pattern typical of a kittenmonocularly deprived by lid suture (Faulkner et al., 2005), with thedeprived eye dominating only 21.1% of the cortical surface (9.7% ofcortical territory in the hemisphere ipsilateral to the deprived eye and32.5% in the contralateral hemisphere). In total, five animals wereraised without any binocular exposure (see Table 1). In these animals,the deprived eye dominated, on average 20.3% (± 3.3%, SEM) of theV1 surface, compared with 16.2% reported previously in animals ofsimilar age deprived by lid suture (Faulkner et al., 2005). If anything,the patching regimen appeared to have a slightly less (but notsignificantly so) detrimental effect on the cortical representation of theaffected eye than monocular lid suture.
The animal that was permitted 0.5 h of BE exhibited a slightlyreduced representation of the deprived eye, which was dominant for35.7% of the cortical surface. However, in marked contrast, the twosubjects that received 1 or 2 h of BE per day, respectively, exhibitedocular dominance maps typical of normally reared kittens. Acontralateral bias was evident in both hemispheres of the latteranimals (i.e. the left hemisphere being dominated by the right eye andvice versa), and the deprived eye dominated, respectively, 53.5 and46.7% of the cortical surface. Therefore, a relatively short daily periodof normal visual experience was sufficient to offset completely a muchlonger period of abnormal, monocular vision (6 and 5 h, respectively).
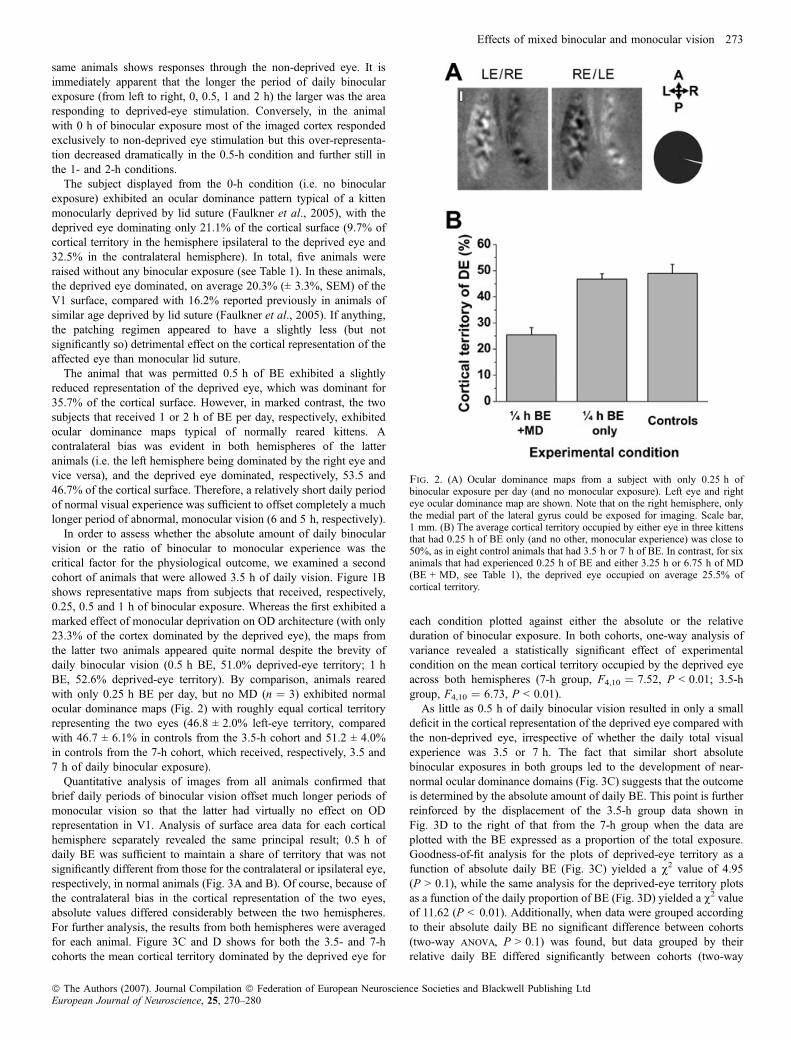
In order to assess whether the absolute amount of daily binocularvision or the ratio of binocular to monocular experience was thecritical factor for the physiological outcome, we examined a secondcohort of animals that were allowed 3.5 h of daily vision. Figure 1Bshows representative maps from subjects that received, respectively,0.25, 0.5 and 1 h of binocular exposure. Whereas the first exhibited amarked effect of monocular deprivation on OD architecture (with only23.3% of the cortex dominated by the deprived eye), the maps fromthe latter two animals appeared quite normal despite the brevity ofdaily binocular vision (0.5 h BE, 51.0% deprived-eye territory; 1 hBE, 52.6% deprived-eye territory). By comparison, animals rearedwith only 0.25 h BE per day, but no MD (n ¼ 3) exhibited normalocular dominance maps (Fig. 2) with roughly equal cortical territoryrepresenting the two eyes (46.8 ± 2.0% left-eye territory, comparedwith 46.7 ± 6.1% in controls from the 3.5-h cohort and 51.2 ± 4.0%in controls from the 7-h cohort, which received, respectively, 3.5 and7 h of daily binocular exposure).
Quantitative analysis of images from all animals confirmed thatbrief daily periods of binocular vision offset much longer periods ofmonocular vision so that the latter had virtually no effect on ODrepresentation in V1. Analysis of surface area data for each corticalhemisphere separately revealed the same principal result; 0.5 h ofdaily BE was sufficient to maintain a share of territory that was notsignificantly different from those for the contralateral or ipsilateral eye,respectively, in normal animals (Fig. 3A and B). Of course, because ofthe contralateral bias in the cortical representation of the two eyes,absolute values differed considerably between the two hemispheres.For further analysis, the results from both hemispheres were averagedfor each animal. Figure 3C and D shows for both the 3.5- and 7-hcohorts the mean cortical territory dominated by the deprived eye for
each condition plotted against either the absolute or the relativeduration of binocular exposure. In both cohorts, one-way analysis ofvariance revealed a statistically significant effect of experimentalcondition on the mean cortical territory occupied by the deprived eyeacross both hemispheres (7-h group, F4,10 ¼ 7.52, P < 0.01; 3.5-hgroup, F4,10 ¼ 6.73, P < 0.01).As little as 0.5 h of daily binocular vision resulted in only a small
deficit in the cortical representation of the deprived eye compared withthe non-deprived eye, irrespective of whether the daily total visualexperience was 3.5 or 7 h. The fact that similar short absolutebinocular exposures in both groups led to the development of near-normal ocular dominance domains (Fig. 3C) suggests that the outcomeis determined by the absolute amount of daily BE. This point is furtherreinforced by the displacement of the 3.5-h group data shown inFig. 3D to the right of that from the 7-h group when the data areplotted with the BE expressed as a proportion of the total exposure.Goodness-of-fit analysis for the plots of deprived-eye territory as afunction of absolute daily BE (Fig. 3C) yielded a v2 value of 4.95(P > 0.1), while the same analysis for the deprived-eye territory plotsas a function of the daily proportion of BE (Fig. 3D) yielded a v2 valueof 11.62 (P < 0.01). Additionally, when data were grouped accordingto their absolute daily BE no significant difference between cohorts(two-way anova, P > 0.1) was found, but data grouped by theirrelative daily BE differed significantly between cohorts (two-way
Fig. 2. (A) Ocular dominance maps from a subject with only 0.25 h ofbinocular exposure per day (and no monocular exposure). Left eye and righteye ocular dominance map are shown. Note that on the right hemisphere, onlythe medial part of the lateral gyrus could be exposed for imaging. Scale bar,1 mm. (B) The average cortical territory occupied by either eye in three kittensthat had 0.25 h of BE only (and no other, monocular experience) was close to50%, as in eight control animals that had 3.5 h or 7 h of BE. In contrast, for sixanimals that had experienced 0.25 h of BE and either 3.25 h or 6.75 h of MD(BE + MD, see Table 1), the deprived eye occupied on average 25.5% ofcortical territory.
Effects of mixed binocular and monocular vision 273
ª The Authors (2007). Journal Compilation ª Federation of European Neuroscience Societies and Blackwell Publishing LtdEuropean Journal of Neuroscience, 25, 270–280

anova, F3,24 ¼ 5.31, P < 0.05). Taken together this suggests thatthe absolute amount of binocular exposure is critical in terms of theresulting cortical ocular dominance. We therefore pooled data from the7- and 3.5-h cohorts and plotted deprived-eye territory againstabsolute daily BE (Fig. 3E). The data were well fitted with anexponential function (r2 ¼ 0.93), which allowed extrapolation of theamount of BE needed to reduce the deprivation effect by 50%(t50 ¼ 0.39 h) and by 95%, respectively (t95 ¼ 1.81 h).There was no significant difference (two-way anova, P > 0.1) in
terms of cortical territory occupied by the deprived eye betweenanimals in which the daily period of binocular exposure had preceded
the period of monocular deprivation and those in which it hadfollowed it (Fig. 3F).Because it could be argued that the first effect of brief or
intermittent MD on cortical ocular dominance is a weakening ofresponses through the deprived eye rather than shrinkage of deprived-eye territory, and that this effect would be obscured by our imageprocessing, we also analysed response amplitudes across the previ-ously defined ROIs in both cortical hemispheres in images that werenot high-pass filtered, such that overall responsivity (DC level)differences were preserved. Although results inevitably displayedgreater variability than those obtained after high-pass filtering, the
Fig. 3. Ocular dominance balance depends on daily binocular experience. The percentage cortical area dominated by the deprived eye (DE) in each experimentalcondition is plotted against the amount of binocular vision provided. (A) Data for the hemispheres contralateral to the DE; (B) those for the ipsilateralhemispheres. Data from control animals, which did not receive any monocular experience, are displayed as the mean of two hemispheres obtained when the left orthe right eye was taken as the deprived one. C and D depict the mean values averaged across both cortical hemispheres. In C, data are plotted against the absoluteduration of daily binocular vision; in D, data are plotted against the percentage of binocular vision relative to total daily vision. Data from control animals are plottedseparately for the left or the right eye, because none of the eyes was deprived. Filled squares: 7-h cohort. Open circles: 3.5-h cohort. All data represent mean ± 1SEM; absence of error bars indicates n ¼ 1. In E, pooled data from the 7-h and 3.5-h cohorts are plotted against the absolute duration of daily binocular vision, andan exponential function (see inset) is fitted to the data (solid line). In F, data from all individual animals from both the 7-h and 3.5-h cohorts are shown that receivedmixed daily binocular and monocular vision, with the shading of symbols indicating whether binocular experience preceded or followed monocular deprivation (seeinset).
274 D. S. Schwarzkopf et al.
ª The Authors (2007). Journal Compilation ª Federation of European Neuroscience Societies and Blackwell Publishing LtdEuropean Journal of Neuroscience, 25, 270–280
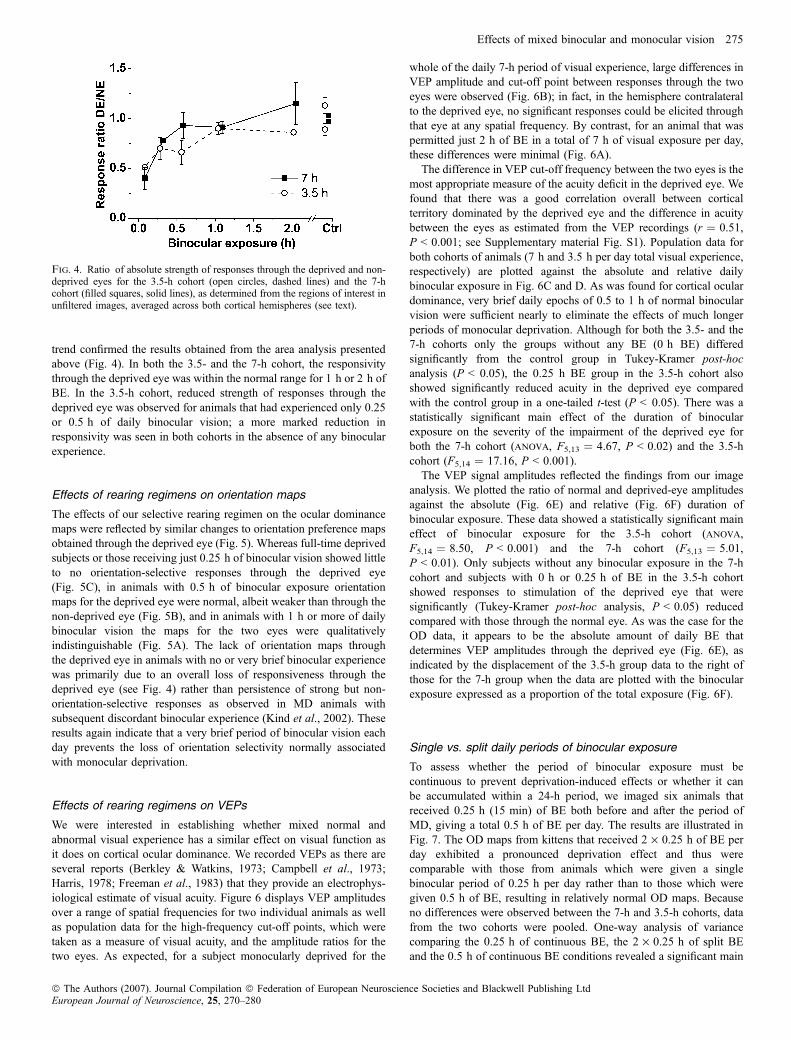
trend confirmed the results obtained from the area analysis presentedabove (Fig. 4). In both the 3.5- and the 7-h cohort, the responsivitythrough the deprived eye was within the normal range for 1 h or 2 h ofBE. In the 3.5-h cohort, reduced strength of responses through thedeprived eye was observed for animals that had experienced only 0.25or 0.5 h of daily binocular vision; a more marked reduction inresponsivity was seen in both cohorts in the absence of any binocularexperience.
Effects of rearing regimens on orientation maps
The effects of our selective rearing regimen on the ocular dominancemaps were reflected by similar changes to orientation preference mapsobtained through the deprived eye (Fig. 5). Whereas full-time deprivedsubjects or those receiving just 0.25 h of binocular vision showed littleto no orientation-selective responses through the deprived eye(Fig. 5C), in animals with 0.5 h of binocular exposure orientationmaps for the deprived eye were normal, albeit weaker than through thenon-deprived eye (Fig. 5B), and in animals with 1 h or more of dailybinocular vision the maps for the two eyes were qualitativelyindistinguishable (Fig. 5A). The lack of orientation maps throughthe deprived eye in animals with no or very brief binocular experiencewas primarily due to an overall loss of responsiveness through thedeprived eye (see Fig. 4) rather than persistence of strong but non-orientation-selective responses as observed in MD animals withsubsequent discordant binocular experience (Kind et al., 2002). Theseresults again indicate that a very brief period of binocular vision eachday prevents the loss of orientation selectivity normally associatedwith monocular deprivation.
Effects of rearing regimens on VEPs
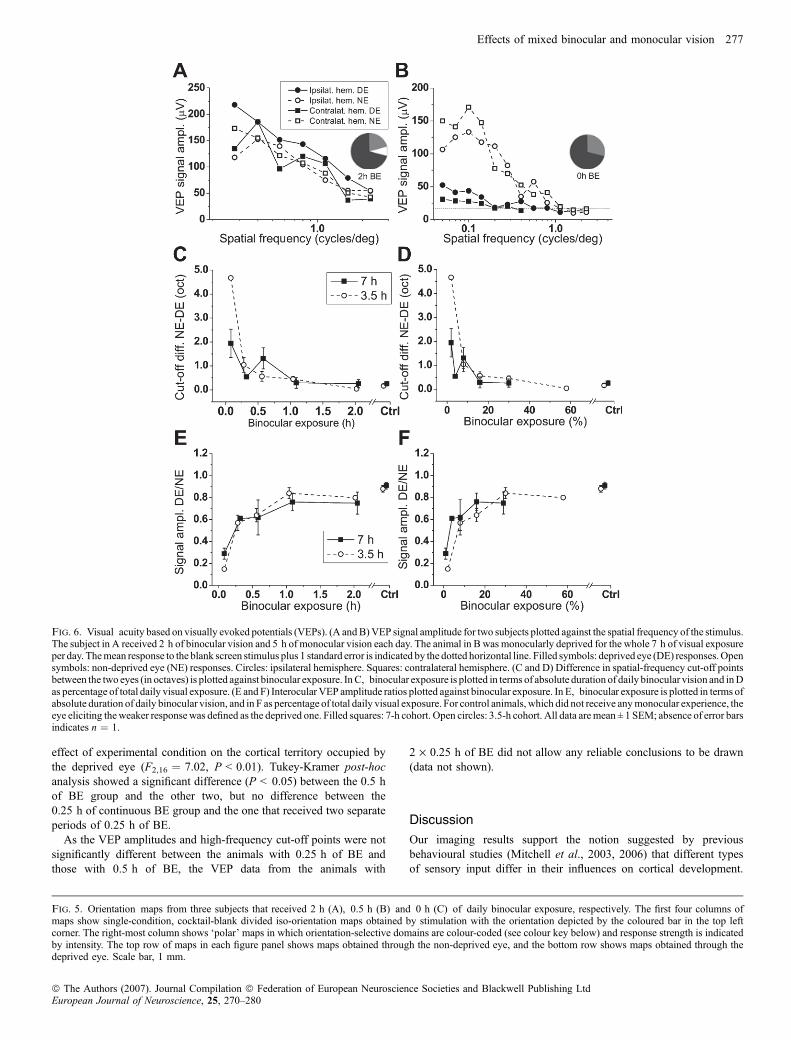
We were interested in establishing whether mixed normal andabnormal visual experience has a similar effect on visual function asit does on cortical ocular dominance. We recorded VEPs as there areseveral reports (Berkley & Watkins, 1973; Campbell et al., 1973;Harris, 1978; Freeman et al., 1983) that they provide an electrophys-iological estimate of visual acuity. Figure 6 displays VEP amplitudesover a range of spatial frequencies for two individual animals as wellas population data for the high-frequency cut-off points, which weretaken as a measure of visual acuity, and the amplitude ratios for thetwo eyes. As expected, for a subject monocularly deprived for the
whole of the daily 7-h period of visual experience, large differences inVEP amplitude and cut-off point between responses through the twoeyes were observed (Fig. 6B); in fact, in the hemisphere contralateralto the deprived eye, no significant responses could be elicited throughthat eye at any spatial frequency. By contrast, for an animal that waspermitted just 2 h of BE in a total of 7 h of visual exposure per day,these differences were minimal (Fig. 6A).The difference in VEP cut-off frequency between the two eyes is the
most appropriate measure of the acuity deficit in the deprived eye. Wefound that there was a good correlation overall between corticalterritory dominated by the deprived eye and the difference in acuitybetween the eyes as estimated from the VEP recordings (r ¼ 0.51,P < 0.001; see Supplementary material Fig. S1). Population data forboth cohorts of animals (7 h and 3.5 h per day total visual experience,respectively) are plotted against the absolute and relative dailybinocular exposure in Fig. 6C and D. As was found for cortical oculardominance, very brief daily epochs of 0.5 to 1 h of normal binocularvision were sufficient nearly to eliminate the effects of much longerperiods of monocular deprivation. Although for both the 3.5- and the7-h cohorts only the groups without any BE (0 h BE) differedsignificantly from the control group in Tukey-Kramer post-hocanalysis (P < 0.05), the 0.25 h BE group in the 3.5-h cohort alsoshowed significantly reduced acuity in the deprived eye comparedwith the control group in a one-tailed t-test (P < 0.05). There was astatistically significant main effect of the duration of binocularexposure on the severity of the impairment of the deprived eye forboth the 7-h cohort (anova, F5,13 ¼ 4.67, P < 0.02) and the 3.5-hcohort (F5,14 ¼ 17.16, P < 0.001).The VEP signal amplitudes reflected the findings from our image
analysis. We plotted the ratio of normal and deprived-eye amplitudesagainst the absolute (Fig. 6E) and relative (Fig. 6F) duration ofbinocular exposure. These data showed a statistically significant maineffect of binocular exposure for the 3.5-h cohort (anova,F5,14 ¼ 8.50, P < 0.001) and the 7-h cohort (F5,13 ¼ 5.01,P < 0.01). Only subjects without any binocular exposure in the 7-hcohort and subjects with 0 h or 0.25 h of BE in the 3.5-h cohortshowed responses to stimulation of the deprived eye that weresignificantly (Tukey-Kramer post-hoc analysis, P < 0.05) reducedcompared with those through the normal eye. As was the case for theOD data, it appears to be the absolute amount of daily BE thatdetermines VEP amplitudes through the deprived eye (Fig. 6E), asindicated by the displacement of the 3.5-h group data to the right ofthose for the 7-h group when the data are plotted with the binocularexposure expressed as a proportion of the total exposure (Fig. 6F).
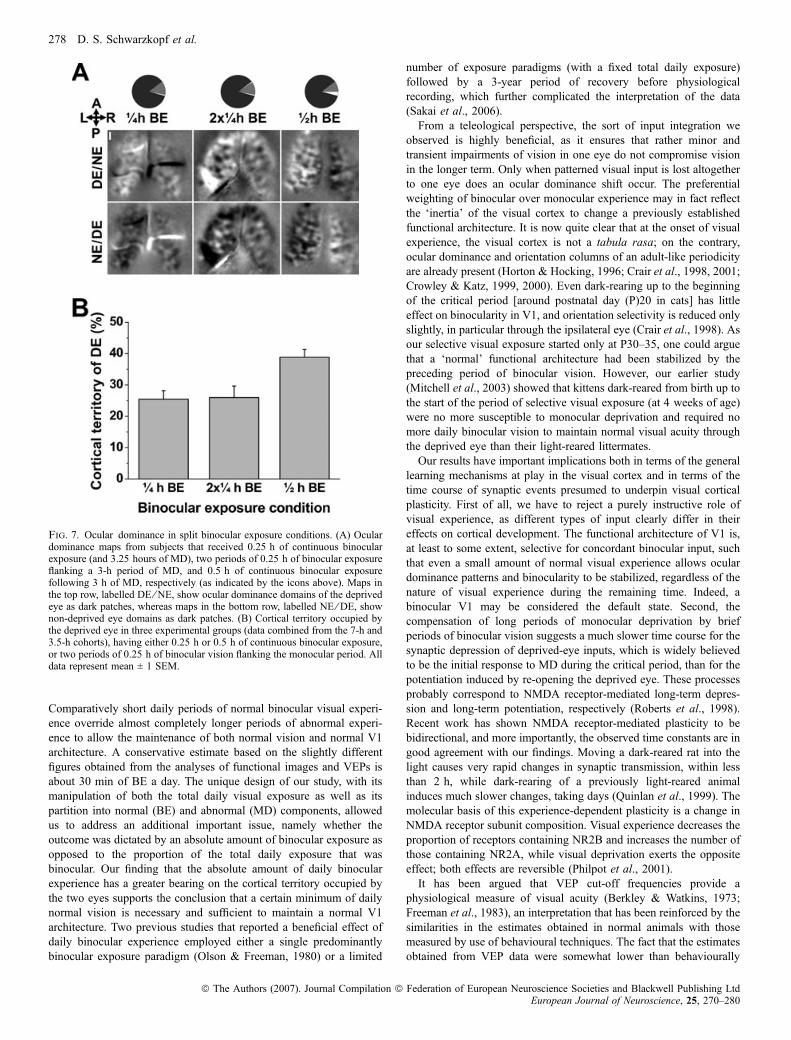
Single vs. split daily periods of binocular exposure
To assess whether the period of binocular exposure must becontinuous to prevent deprivation-induced effects or whether it canbe accumulated within a 24-h period, we imaged six animals thatreceived 0.25 h (15 min) of BE both before and after the period ofMD, giving a total 0.5 h of BE per day. The results are illustrated inFig. 7. The OD maps from kittens that received 2 · 0.25 h of BE perday exhibited a pronounced deprivation effect and thus werecomparable with those from animals which were given a singlebinocular period of 0.25 h per day rather than to those which weregiven 0.5 h of BE, resulting in relatively normal OD maps. Becauseno differences were observed between the 7-h and 3.5-h cohorts, datafrom the two cohorts were pooled. One-way analysis of variancecomparing the 0.25 h of continuous BE, the 2 · 0.25 h of split BEand the 0.5 h of continuous BE conditions revealed a significant main
Fig. 4. Ratio of absolute strength of responses through the deprived and non-deprived eyes for the 3.5-h cohort (open circles, dashed lines) and the 7-hcohort (filled squares, solid lines), as determined from the regions of interest inunfiltered images, averaged across both cortical hemispheres (see text).
Effects of mixed binocular and monocular vision 275
ª The Authors (2007). Journal Compilation ª Federation of European Neuroscience Societies and Blackwell Publishing LtdEuropean Journal of Neuroscience, 25, 270–280

276 D. S. Schwarzkopf et al.
ª The Authors (2007). Journal Compilation ª Federation of European Neuroscience Societies and Blackwell Publishing LtdEuropean Journal of Neuroscience, 25, 270–280
effect of experimental condition on the cortical territory occupied bythe deprived eye (F2,16 ¼ 7.02, P < 0.01). Tukey-Kramer post-hocanalysis showed a significant difference (P < 0.05) between the 0.5 hof BE group and the other two, but no difference between the0.25 h of continuous BE group and the one that received two separateperiods of 0.25 h of BE.
As the VEP amplitudes and high-frequency cut-off points were notsignificantly different between the animals with 0.25 h of BE andthose with 0.5 h of BE, the VEP data from the animals with
2 · 0.25 h of BE did not allow any reliable conclusions to be drawn(data not shown).
Discussion
Our imaging results support the notion suggested by previousbehavioural studies (Mitchell et al., 2003, 2006) that different typesof sensory input differ in their influences on cortical development.
Fig. 6. Visual acuity based on visually evoked potentials (VEPs). (A andB)VEP signal amplitude for two subjects plotted against the spatial frequency of the stimulus.The subject in A received 2 h of binocular vision and 5 h of monocular vision each day. The animal in B was monocularly deprived for the whole 7 h of visual exposureper day. Themean response to the blank screen stimulus plus 1 standard error is indicated by the dotted horizontal line. Filled symbols: deprived eye (DE) responses.Opensymbols: non-deprived eye (NE) responses. Circles: ipsilateral hemisphere. Squares: contralateral hemisphere. (C and D) Difference in spatial-frequency cut-off pointsbetween the two eyes (in octaves) is plotted against binocular exposure. InC, binocular exposure is plotted in terms of absolute duration of daily binocular vision and inDas percentage of total daily visual exposure. (E and F) Interocular VEP amplitude ratios plotted against binocular exposure. In E, binocular exposure is plotted in terms ofabsolute duration of daily binocular vision, and in F as percentage of total daily visual exposure. For control animals, which did not receive anymonocular experience, theeye eliciting theweaker responsewas defined as the deprived one. Filled squares: 7-h cohort. Open circles: 3.5-h cohort. All data aremean ± 1 SEM; absence of error barsindicates n ¼ 1.
Fig. 5. Orientation maps from three subjects that received 2 h (A), 0.5 h (B) and 0 h (C) of daily binocular exposure, respectively. The first four columns ofmaps show single-condition, cocktail-blank divided iso-orientation maps obtained by stimulation with the orientation depicted by the coloured bar in the top leftcorner. The right-most column shows ‘polar’ maps in which orientation-selective domains are colour-coded (see colour key below) and response strength is indicatedby intensity. The top row of maps in each figure panel shows maps obtained through the non-deprived eye, and the bottom row shows maps obtained through thedeprived eye. Scale bar, 1 mm.
Effects of mixed binocular and monocular vision 277
ª The Authors (2007). Journal Compilation ª Federation of European Neuroscience Societies and Blackwell Publishing LtdEuropean Journal of Neuroscience, 25, 270–280
Comparatively short daily periods of normal binocular visual experi-ence override almost completely longer periods of abnormal experi-ence to allow the maintenance of both normal vision and normal V1architecture. A conservative estimate based on the slightly differentfigures obtained from the analyses of functional images and VEPs isabout 30 min of BE a day. The unique design of our study, with itsmanipulation of both the total daily visual exposure as well as itspartition into normal (BE) and abnormal (MD) components, allowedus to address an additional important issue, namely whether theoutcome was dictated by an absolute amount of binocular exposure asopposed to the proportion of the total daily exposure that wasbinocular. Our finding that the absolute amount of daily binocularexperience has a greater bearing on the cortical territory occupied bythe two eyes supports the conclusion that a certain minimum of dailynormal vision is necessary and sufficient to maintain a normal V1architecture. Two previous studies that reported a beneficial effect ofdaily binocular experience employed either a single predominantlybinocular exposure paradigm (Olson & Freeman, 1980) or a limited
number of exposure paradigms (with a fixed total daily exposure)followed by a 3-year period of recovery before physiologicalrecording, which further complicated the interpretation of the data(Sakai et al., 2006).From a teleological perspective, the sort of input integration we
observed is highly beneficial, as it ensures that rather minor andtransient impairments of vision in one eye do not compromise visionin the longer term. Only when patterned visual input is lost altogetherto one eye does an ocular dominance shift occur. The preferentialweighting of binocular over monocular experience may in fact reflectthe ‘inertia’ of the visual cortex to change a previously establishedfunctional architecture. It is now quite clear that at the onset of visualexperience, the visual cortex is not a tabula rasa; on the contrary,ocular dominance and orientation columns of an adult-like periodicityare already present (Horton & Hocking, 1996; Crair et al., 1998, 2001;Crowley & Katz, 1999, 2000). Even dark-rearing up to the beginningof the critical period [around postnatal day (P)20 in cats] has littleeffect on binocularity in V1, and orientation selectivity is reduced onlyslightly, in particular through the ipsilateral eye (Crair et al., 1998). Asour selective visual exposure started only at P30–35, one could arguethat a ‘normal’ functional architecture had been stabilized by thepreceding period of binocular vision. However, our earlier study(Mitchell et al., 2003) showed that kittens dark-reared from birth up tothe start of the period of selective visual exposure (at 4 weeks of age)were no more susceptible to monocular deprivation and required nomore daily binocular vision to maintain normal visual acuity throughthe deprived eye than their light-reared littermates.Our results have important implications both in terms of the general
learning mechanisms at play in the visual cortex and in terms of thetime course of synaptic events presumed to underpin visual corticalplasticity. First of all, we have to reject a purely instructive role ofvisual experience, as different types of input clearly differ in theireffects on cortical development. The functional architecture of V1 is,at least to some extent, selective for concordant binocular input, suchthat even a small amount of normal visual experience allows oculardominance patterns and binocularity to be stabilized, regardless of thenature of visual experience during the remaining time. Indeed, abinocular V1 may be considered the default state. Second, thecompensation of long periods of monocular deprivation by briefperiods of binocular vision suggests a much slower time course for thesynaptic depression of deprived-eye inputs, which is widely believedto be the initial response to MD during the critical period, than for thepotentiation induced by re-opening the deprived eye. These processesprobably correspond to NMDA receptor-mediated long-term depres-sion and long-term potentiation, respectively (Roberts et al., 1998).Recent work has shown NMDA receptor-mediated plasticity to bebidirectional, and more importantly, the observed time constants are ingood agreement with our findings. Moving a dark-reared rat into thelight causes very rapid changes in synaptic transmission, within lessthan 2 h, while dark-rearing of a previously light-reared animalinduces much slower changes, taking days (Quinlan et al., 1999). Themolecular basis of this experience-dependent plasticity is a change inNMDA receptor subunit composition. Visual experience decreases theproportion of receptors containing NR2B and increases the number ofthose containing NR2A, while visual deprivation exerts the oppositeeffect; both effects are reversible (Philpot et al., 2001).It has been argued that VEP cut-off frequencies provide a
physiological measure of visual acuity (Berkley & Watkins, 1973;Freeman et al., 1983), an interpretation that has been reinforced by thesimilarities in the estimates obtained in normal animals with thosemeasured by use of behavioural techniques. The fact that the estimatesobtained from VEP data were somewhat lower than behaviourally
Fig. 7. Ocular dominance in split binocular exposure conditions. (A) Oculardominance maps from subjects that received 0.25 h of continuous binocularexposure (and 3.25 hours of MD), two periods of 0.25 h of binocular exposureflanking a 3-h period of MD, and 0.5 h of continuous binocular exposurefollowing 3 h of MD, respectively (as indicated by the icons above). Maps inthe top row, labelled DE ⁄ NE, show ocular dominance domains of the deprivedeye as dark patches, whereas maps in the bottom row, labelled NE ⁄ DE, shownon-deprived eye domains as dark patches. (B) Cortical territory occupied bythe deprived eye in three experimental groups (data combined from the 7-h and3.5-h cohorts), having either 0.25 h or 0.5 h of continuous binocular exposure,or two periods of 0.25 h of binocular vision flanking the monocular period. Alldata represent mean ± 1 SEM.
278 D. S. Schwarzkopf et al.
ª The Authors (2007). Journal Compilation ª Federation of European Neuroscience Societies and Blackwell Publishing LtdEuropean Journal of Neuroscience, 25, 270–280
measured acuities in animals reared under identical exposure condi-tions (Mitchell et al., 2003, 2006) may be a consequence of a numberof factors that include the possibility that the VEP data may not havesampled the activity of the most sensitive neurons in young kittens thatmediate behaviourally determined acuity values. Nevertheless, theconclusions that can be drawn from the VEP data mirror closely thoseobtained earlier on the basis of behavioural measurements. Import-antly, short periods of daily binocular experience outweighed farlonger periods of monocular experience to lead to the development ofnormal acuities in both eyes whether acuity was determined from VEPdata or from behavioural measurements.
In contrast to our imaging results, Mitchell et al. (2003) reported alonger critical daily binocular exposure (up to 2 h) to protect againstthe effect of monocular deprivation. However, ocular dominancearchitecture is unlikely to show a perfect correlation with visual acuity.The reduced size of deprived-eye domains compared with the non-deprived eye’s territory reflects numbers of neurons dominated by thetwo eyes, but the behavioural measurement of grating acuity is morelikely to depend on the ‘best’ cells, those responding to the highestspatial frequencies. It is possible that those are more vulnerable toMD. Alternatively, of course, behavioural performance may dependon the response characteristics of neurons beyond V1, at a stage wherethe representation of visual stimuli is integrated into a behaviouralresponse. It is worth noting that similarly rapid recovery (within 0.5–2 h) following re-opening of an eye deprived by lid suture has beenreported for ferret V1, albeit only for the hemisphere contralateral tothe deprived eye; in the ipsilateral hemisphere, recovery took about4 days (Krahe et al., 2005). It has been shown that the rapid form ofrecovery can occur independent of protein synthesis (Krahe et al.,2005).
Our finding that the absolute amount of daily binocular experienceis a stronger driving force of ocular dominance plasticity than itsrelative share of the overall experience is corroborated by earlierstudies on the recovery from MD. It appears that such recoveryprimarily depends on the absolute level of visual evoked activity indeprived-eye afferents, and not on competition between the afferentsfrom the two eyes: mere hours after reopening of the deprived eyethere is substantial recovery of vision in that eye (Mitchell & Gingras,1998). The initial speed of recovery is even greater when visualexperience is binocular than when the experienced fellow eye is closed(Mitchell et al., 2001). Similarly rapid recovery of vision followingsurgical treatment has been observed in human infants who had beendeprived of patterned visual input by congenital cataract (Maureret al., 1999).
Thus, while the afferents arriving from the deprived eye appearslowly to lose synaptic weight during monocular viewing, highactivity levels in cortical neurons when binocular vision is restored canquickly and effectively reverse this change. The daily binocularepisodes in our paradigm can be regarded as very brief recoveryperiods, which immediately counteract the deprivation effect duringthe preceding period of monocular viewing. Alternatively, one couldargue that each daily period of binocular experience leaves a memorytrace that enhances the effectiveness of similar inputs on subsequentdays, analogous to the recently reported effects of repeat MD in mousevisual cortex (Hofer et al., 2006). It is worth noting that neither ourstudy nor the behavioural study by Mitchell et al. (2003) foundevidence of an order effect: it appears to make no difference to theeventual cortical architecture and visual acuity whether the dailyperiod of binocular exposure follows that of monocular exposure orvice versa. This confirms an earlier study of alternating monocularocclusion (Freeman & Olson, 1980). Sleep has been proposed toconsolidate experiences into memory (Stickgold et al., 2000) and may
also consolidate the effects of monocular deprivation (Frank et al.,2001). Therefore, the type of exposure which occurs at the end of theday might be expected to be more effective in driving plasticity.However, the absence of any order effect in our data does not precludethe possibility of a consolidative property of sleep, as it may be theoverall balance of binocular and monocular experience in a day whichis consolidated during sleep. Moreover, we did not observe theanimals’ sleep patterns and cannot therefore be sure whether they weremore likely to sleep in the beginning of the dark period than at othertimes. Our results do, however, indicate that the second exposureperiod in our rearing regimen is no more capable of driving corticalplasticity than the first one.The present study demonstrates that visual cortical development
in early life is biased towards a normal outcome supportingbinocular vision. Even brief periods of binocular experience canoutweigh the effects of much more prolonged monocular depriva-tion, at least if vision has developed normally until vision in oneeye becomes compromised. Although remarkable plasticity exists inthe postnatal brain, this does not come at the cost of economicallysensible development. The kind of stimulation most likely to occurunder normal circumstances is favoured by the visual system. In thiscontext, it may be important that binocular experience is presentedwithin an enriched environment in order to provide maximal sensorystimulation and therefore to ensure maximal effectiveness (Canceddaet al., 2004). This allows a hopeful outlook for the treatment ofocular defects in infants as brief amounts of daily binocularexposure may be sufficient for normal visual development. In fact,patching regimens similar to those employed in the present studyare now routinely used in human patients (Mitchell & MacKinnon,2002). Assuming that mechanisms of plasticity are similar in thehuman and cat visual cortices, our results suggest that in childrenwho need to wear a patch over one eye for a longer period of time,normal vision will be maintained in that eye if the patch is removedfor about an hour a day to permit normal binocular visualexperience.
Supplementary material
The following supplementary material may be found on http://www.blackwell-synergy.comFig. S1. Correlation of visual acuity deficit and cortical territoryoccupied by the deprived eye.
Acknowledgements
This study was supported by grants to D.E.M. from the Natural Sciences andEngineering Research Council of Canada and from the Canadian Institute ofHealth Research, and to F.S. from the Medical Research Council (UK).
Abbreviations
BE, binocular exposure; MD, monocular deprivation; OD, ocular dominance;ROI, region of interest; V1, primary visual cortex; VEP, visually evokedpotential.
References
Berkley, M.A. & Watkins, D.W. (1973) Grating resolution and refraction in thecat estimated from evoked cerebral potentials. Vision Res., 13, 403–415.
Bonhoeffer, T. & Grinvald, A. (1996) Optical imaging based on intrinsicsignals. The methodology. In Toga, A.W. & Mazziotta, J.C. (Eds), BrainMapping: the Methods, pp. 55–97. Academic Press, London.
Effects of mixed binocular and monocular vision 279
ª The Authors (2007). Journal Compilation ª Federation of European Neuroscience Societies and Blackwell Publishing LtdEuropean Journal of Neuroscience, 25, 270–280

Bonhoeffer, T., Kim, D.S., Malonek, D., Shoham, D. & Grinvald, A. (1995)Optical imaging of the layout of functional domains in area 17 and across thearea 17 ⁄ 18 border in cat visual cortex. Eur. J. Neurosci., 7, 1973–1988.
Campbell, F.W., Maffei, L. & Piccolino, M. (1973) The contrast sensitivity ofthe cat. J. Physiol., 229, 719–731.
Cancedda, L., Putignano, E., Sale, A., Viegi, A., Berardi, N. & Maffei, L.(2004) Acceleration of visual system development by environmentalenrichment. J. Neurosci., 24, 4840–4848.
Crair, M.C., Gillespie, D.C. & Stryker, M.P. (1998) The role of visualexperience in the development of columns in cat visual cortex. Science, 279,566–570.
Crair, M.C., Horton, J.C., Antonini, A. & Stryker, M.P. (2001) Emergence ofocular dominance columns in cat visual cortex by 2 weeks of age. J. Comp.Neurol., 430, 235–249.
Crowley, J.C. & Katz, L.C. (1999) Development of ocular dominance columnsin the absence of retinal input. Nat. Neurosci., 2, 1125–1130.
Crowley, J.C. & Katz, L.C. (2000) Early development of ocular dominancecolumns. Science, 290, 1321–1324.
Faulkner, S.D., Vorobyov, V. & Sengpiel, F. (2005) Limited protection of theprimary visual cortex from the effects of monocular deprivation bystrabismus. Cereb. Cortex, 15, 1822–1833.
Frank, M.G., Issa, N.P. & Stryker, M.P. (2001) Sleep enhances plasticity in thedeveloping visual cortex. Neuron, 30, 275–287.
Freeman, R.D. & Olson, C.R. (1980) Cortical effects of daily sequentialstimulation of right and left eyes in the kitten. Exp. Brain Res., 39, 117–119.
Freeman, R.D., Sclar, G. & Ohzawa, I. (1983) An electrophysiologicalcomparison of convergent and divergent strabismus in the cat: visual evokedpotentials. J. Neurophysiol., 49, 227–237.
Giffin, F. & Mitchell, D.E. (1978) The rate of recovery of vision after earlymonocular deprivation in kittens. J. Physiol., 274, 511–537.
Harris, L.R. (1978) Contrast sensitivity and acuity of a conscious cat measuredby the occipital evoked potential. Vis. Res., 18, 175–178.
Hofer, S.B., Mrsic-Flogel, T.D., Bonhoeffer, T. & Hubener, M. (2006) Priorexperience enhances plasticity in adult visual cortex. Nat. Neurosci., 9, 127–132.
Horton, J.C. & Hocking, D.R. (1996) An adult-like pattern of ocular dominancecolumns in striate cortex of newborn monkeys prior to visual experience.J. Neurosci., 16, 1791–1807.
Kind, P.C., Mitchell, D.E., Ahmed, B., Blakemore, C., Bonhoeffer, T. &Sengpiel, F. (2002) Correlated binocular activity guides recovery frommonocular deprivation. Nature, 416, 430–433.
Krahe, T.E., Medina, A.E., de Bittencourt-Navarrete, R.E., Colello, R.J. &Ramoa, A.S. (2005) Protein synthesis-independent plasticity mediates rapidand precise recovery of deprived eye responses. Neuron, 48, 329–343.
Maurer, D., Lewis, T.L., Brent, H.P. & Levin, A.V. (1999) Rapid improvementin the acuity of infants after visual input. Science, 286, 108–110.
Mitchell, D.E. (1988) The extent of visual recovery from early monocular orbinocular visual deprivation in kittens. J. Physiol., 395, 639–660.
Mitchell, D.E. (1989) Normal and abnormal visual development in kittens:Insights into the mechanisms that underlie visual perceptual development inhumans. Can. J. Psychol., 43, 141–164.
Mitchell, D.E. & Gingras, G. (1998) Visual recovery after monoculardeprivation is driven by absolute, rather than relative, visually evokedactivity levels. Curr. Biol., 8, 1179–1182.
Mitchell, D.E., Gingras, G. & Kind, P.C. (2001) Initial recovery of vision afterearly monocular deprivation in kittens is faster when both eyes are open.Proc. Natl Acad. Sci. USA, 98, 11662–11667.
Mitchell, D.E., Kind, P.C., Sengpiel, F. & Murphy, K. (2003) Brief dailyperiods of binocular vision prevent deprivation-induced acuity loss. Curr.Biol., 13, 1704–1708.
Mitchell, D.E., Kind, P.C., Sengpiel, F. & Murphy, K. (2006) Short periods ofconcordant binocular vision prevent the development of deprivationamblyopia. Eur. J. Neurosci., 23, 2458–2466.
Mitchell, D.E. & MacKinnon, S. (2002) The present and potential impact ofresearch on animal models for clinical treatment of stimulus deprivationamblyopia. Clin. Exp. Optom., 85, 5–18.
Olson, C.R. & Freeman, R.D. (1980) Cumulative effect of brief daily periods ofmonocular vision on kitten striate cortex. Exp. Brain Res., 38, 53–56.
Philpot, B.D., Sekhar, A.K., Shouval, H.Z. & Bear, M.F. (2001) Visualexperience and deprivation bidirectionally modify the composition andfunction of NMDA receptors in visual cortex. Neuron, 29, 157–169.
Quinlan, E.M., Olstein, D.H. & Bear, M.F. (1999) Bidirectional, experience-dependent regulation of N-methyl-D-aspartate receptor subunit compositionin the rat visual cortex during postnatal development. Proc. Natl Acad. Sci.USA, 96, 12876–12880.
Roberts, E.B., Meredith, M.A. & Ramoa, A.S. (1998) Suppression ofNMDA receptor function using antisense DNA blocks ocular dominanceplasticity while preserving visual responses. J. Neurophysiol., 80, 1021–1032.
Sakai, E., Bi, H., Maruko, I., Zhang, B., Zheng, J., Wensveen, J., Harwerth,R.S., Smith, E.L. III & Chino, Y.M. (2006) Cortical effects of brief dailyperiods of unrestricted vision during early monocular form deprivation.J. Neurophysiol., 95, 2856–2865.
Shatz, C.J. & Stryker, M.P. (1978) Ocular dominance in layer IV of the cat’svisual cortex and the effects of monocular deprivation. J. Physiol., 281, 267–283.
Stickgold, R., James, L. & Hobson, J.A. (2000) Visual discrimination learningrequires sleep after training. Nat. Neurosci., 3, 1237–1238.
Trachtenberg, J.T. & Stryker, M.P. (2001) Rapid anatomical plasticity ofhorizontal connections in the developing visual cortex. J. Neurosci., 21,3476–3482.
Trachtenberg, J.T., Trepel, C. & Stryker, M.P. (2000) Rapid extragranularplasticity in the absence of thalamocortical plasticity in the developingprimary visual cortex. Science, 287, 2029–2032.
Wiesel, T.N. & Hubel, D.H. (1963) Single-cell responses in striate cortex ofkittens deprived of vision in one eye. J. Neurophysiol., 26, 1003–1017.
Wiesel, T.N. & Hubel, D.H. (1965) Comparison of the effects of unilateral andbilateral eye closure on cortical unit responses in kittens. J. Neurophysiol.,28, 1029–1040.
Zepeda, A., Arias, C. & Sengpiel, F. (2004) Optical imaging of intrinsic signals:recent developments in the methodology and its applications. J. Neurosci.Methods, 136, 1–21.
280 D. S. Schwarzkopf et al.
ª The Authors (2007). Journal Compilation ª Federation of European Neuroscience Societies and Blackwell Publishing LtdEuropean Journal of Neuroscience, 25, 270–280