Bridging the Telco and Financial - eServGlobal eServGlobal Our company 3 The growing market 4...
90
Bridging the Telco and Financial Worlds Annual Report 2013
Transcript of Bridging the Telco and Financial - eServGlobal eServGlobal Our company 3 The growing market 4...

Bridging the Telco and Financial Worlds
Annual Report 2013

About eServGlobalOur company 3
The growing market 4
End-to-end solutions 6
Our first 30 years 9
Review of the yearChairman’s review 9
CEO’s report 10
CFO’s report 11
GovernanceBoard of directors 12
Directors’ report 14
Auditor’s independence declaration 25
Corporate governance statement 26
Independent auditor’s report 34
Directors’ declaration 36
Financial statementsConsolidated statement of profit or loss
and other comprehensive income37
Consolidated statement of financial position 38
Consolidated statement of changes in equity 39
Consolidated statement of cash flows 40
Notes to the finanancial statements 41
Additional securities information 84

2
Bridging the Telco and Financial Worlds
Telco
TELC
O S
ERVI
CES
FINA
NC
IAL S
ERVIC
ES
Recharge Promotions MobileMoney
MobileFinancialServices
VoucherRecharge
VAS
TELC
OS
ERVI
CES
FINA
NC
IAL
SER
VICES
ElectronicRecharge
Promotions
Loyalty
Couponing
Segmentation
Advert.Campaigns
StandardWallet
IVR
Voice/VideoMail
AdvancedWallet
InternationalRemittance
MicroLoans
MicroSavings
MicroInsurance
CreditScoring
Telco
TELC
OS
ERVI
CES
FINA
NC
IAL
SER
VICES
RechargeRecharge PromotionsPromotions MobileMoneyMobileMoney
MobileMoney
InternationalRemittance
MobileFinancialServices
MobileFinancialServices
Reporting
Any
Acc
ess
Distribution Network Management

eServGlobal Limited Annual Report 2013 3
A new payment ecosystem is emerging.
The mobile is an acknowledged catalyst of change. It has already changed the way we communicate with each other and the way we access information. The mobile is now changing how we conduct our financial lives.
Mobile financial services is a rapidly developing industry led by a wave of dynamic, agile and technologically advanced solutions. At the front of this wave of new technology is eServGlobal.
In the past year, eServGlobal has consolidated its position as one of the top mobile money vendors in the industry. We are widely regarded as a leading provider of end-to-end mobile money and mobile financial service solutions. We bridge the telco and financial worlds by offering ‘any account to any account’ mobile financial services.
Our comprehensive suite of mobile money solutions is complemented by a range of sophisticated, revenue generating Value-Added Services.
In addition to success in domestic mobile money solutions, eServGlobal has led the way in the international remittance market by developing the technology which powers the market leading HomeSend® remittance hub.
As announced in December 2013, HomeSend will become a joint venture of MasterCard, eServGlobal and BICS, taking the service to its next level of global expansion.
As mobile money solutions reach a new age of maturity the next logical step will be to look for an open and neutral solution for interoperability on both a domestic and international level. HomeSend, backed by the strength of MasterCard, is ideally positioned to meet this need.
The HomeSend Joint Venture is a significant development not just for eServGlobal but for the financial services industry worldwide and the future of international money transfer.
FY2013 Highlights
» FY2013 adjusted EBITDA profit of A$1.7m (£1.1m) compared to an EBITDA loss of A$1.9m (£1.6m) in FY2012*
» Net profit after tax of A$10.4m (£6.6m) compared to a prior year loss of A$15.6m (£10.2m)
» FY2013 revenues up 17% to A$31.0m (£19.6m) (FY2012: A$26.5m excluding USP legacy revenues of A$1.6m generated in FY2012)
» 100+ customers using eServGlobal’s mobile money, international remittance, recharge and value-added services technologies including HomeSend (+16% in the past year).
» 10 new core mobile money business customers, bringing the total number of core business customers to 65 (excluding HomeSend).
» HomeSend exceeded 1.2 billion subscribers under contract coverage and is now in the next strategic phase of development, deploying live corridors.
» Post period end: Announcement of the HomeSend Joint Venture by MasterCard, eServGlobal and BICS to take the HomeSend service to its next phase of global expansion.
*Excludes foreign exchange gains of A$8.0m (FY2012 loss of A$3.4m), non-recurring costs of A$2.0m (FY2012 A$2.9m) and share based payments of A$0.5m (FY2012 A$0.6m)

4
We operate in a growing marketMobile money and mobile financial services is a large and growing space, particularly in emerging markets where mobile penetration rates are high and access to traditional financial services is limited. In these markets, mobile network operators and financial service providers are moving quickly to extend new services to their users. eServGlobal is well positioned to service this growing market, with extensive experience in holding customer balances and an in-depth understanding of the mobile infrastructure.
Emerging markets are moving away from cash-based economies, leap-frogging traditional financial infrastructure to embrace mobile payments, creating a substantial opportunity for mobile money services. Sub-Saharan Africa is one location where mobile money holds significant unrealized potential, outlined in the following example by McKinsey:
“An average of 54 percent of adults in sub-Saharan Africa make one or more long-distance payments in a given month, totaling approximately five billion transactions annually. The total volume of these flows is approximately $760 billion, and 50 to 60 percent of the transactions are in cash. With a conservative estimate of revenues at 2 percent of volume, this results in annual revenues of about $6.6 billion from electronic payments.”1
This situation is being replicated in emerging economies worldwide throughout Africa, the Middle East, Asia and the Pacific and Latin America.
The GSMA’s Mobile Money for the Unbanked (MMU) project reports that as of November 2013 there are 208 live deployments which extend mobile-based financial services in developing and emerging markets and a further 117 planned deployments.2 This represents 38% percent growth during 2012 and a 90% increase since 2011, signifying the growing demand for mobile financial services in markets where traditional financial services are unable to reach all users.
While the number of deployments is growing, there is still a significant untapped market. The MMU project reports that the actual number of active mobile money users worldwide is around 30 million. The GSMA estimates that the total number of unique mobile subscribers worldwide stands at 3.2 billion, while the World Bank reports that an estimated 2.5 billion working-age adults globally– more than half of the total adult population–have no access to the types of formal financial services.3 This represents a huge market for new mobile money deployments.
Another emerging trend is the replacement of ‘first-generation’ mobile money deployments. 19.5% of mobile money service launches in 2012 were re-launches or replacements of existing services.
Additionally, operator groups are taking a more holistic approach to their mobile money offering, seeking experienced vendors with the ability to supply comprehensive solutions, particularly across multiple affiliates. This evolution represents an important opportunity for eServGlobal and was instrumental in the strategic framework agreement announced with the Zain Group to roll out services across their eight affiliates, resulting in estimated revenue of US$12m over three years.
The launch of mobile money services, primarily in emerging markets, is an evolutionary process in which several steps are necessary to achieve full financial inclusivity. Once the mobile wallet has been deployed, the first services to be introduced (almost always at the same time as wallet deployment) involve remittance, whether in the form of airtime or in a cash transaction. This is where the HomeSend money transfer service forms a crucial link in the chain.
Juniper Research recently reported that, nearly 400m mobile phone users worldwide are expected to use their handsets for mobile money transfer by 2018, up from just under 150m this year.5
Foreign workers will be an important market for HomeSend. The World Bank estimates that by 2014, around 75 million foreign workers will use m-remittance to transfer payments from Europe, the US, Australia, Japan and the United Arab Emirates to India, China, Mexico, Indonesia and the Philippines. The developing world is expected to receive US$414b in migrant remittances in 2013, an increase of 6.3 percent over the previous year. This is projected to rise to US$540b by 2016. Globally, the world’s 232 million international migrants are expected to remit earnings worth US$550b this year and over US$700b by 2016.3
For both domestic and international mobile money, the market is substantial and eServGlobal is well positioned to meet the growing demand.
Berg Insight predicts the total value of mobile money transactions to grow from US$44bn in
2011 at a CAGR of 44% to US$395bn in 2017.4
1 http://www.mckinsey.com/insights/financial_services/sub_saharan_africa_a_major_potential_revenue_opportunity_for_digital_payments2 http://www.gsma.com/mobilefordevelopment/programmes/mobile-money-for-the-unbanked3 http://go.worldbank.org/1F2V9ZK8C04 http://www.berginsight.com/ReportPDF/ProductSheet/bi-mm2-ps.pdf5 http://www.juniperresearch.com/reports/mobile_money_transfer_and_remittances

Group deal across MENA
We signed a 3-year strategic agreement with the Zain Group, valued
at over US$12m, to deliver a mobile money and electronic top-up solution to the eight Zain
affiliates in the Middle East and Africa. Zain Grroup coverage extends to more than 44 million
subscribers and includes several markets where over 90% of the population does
not have access to banking facilities.
MasterCard Mobile Money
Partnership ProgrameServGlobal was named as a member
of MasterCard’s Mobile Money Partnership Program, an initiative aimed at helping the more
than 2.5 billion financially underserved consumers worldwide gain access
to mainstream financial services through their
mobile phone.
HomeSend corridors going
liveAs of November 2013, live HomeSend corridors connected 51 countries for
remittance and 76 countries for airtime transfer. The individual service providers in these countries are connected by over 690
live corridors. Exceeding the objective for live corridors connecting 50
countries in 2013. HomeSend JV
ready for take offIn December 2013, eServGlobal
announced a joint venture with MasterCard and BICS to take HomeSend into its next phase of global expansion. The joint venture will enable cross border remittances and domestic person-
to-person (P2P) transfers to and from mobile money accounts, bank accounts or cash
outlets.
Mobile payments
transactions worldwidePer year (Billions $US)
Remittance flows to
developing countriesPer year (Billions $US)
xxx
50M recharge subscribers in Indonesia
We expanded our footprint within the Ooredeeo (Qtel) Group through a strategic deal
with Group member, Indosat, an Indonesian Mobile Network operator. Through the PayMobile
platform we will provide voucher recharge to the subscriber base of more than 50 million
users, in this large and predominantly prepaid market.
Mobile transport app in the Middle East
We deployed our first NFC project for an operator in the Middle East, with our partner Airtag. The project featured an NFC transport application with an architectural framework for an easy upgrade to a full mobile wallet solution, enabling bill payment, person-to-
person transfers and loyalty schemes.
30 years’ experience10 offices
50+ countries65+ customers190+ people
Source: Gartner
Source: World Bank

6
eServGlobal offers a comprehensive suite of mobile money and mobile financial service solutions. Our PayMobile platform is an end-to-end solution which allows service providers to select the right mix of telco and financial services for each individual market.
Mobilebanking
Developedmarket
Mobile Money in practice
Emergingmarket
Buy goods
Companioncard
Mr Joe
5132 2873
Internationalmoney transfer
NFC
Buy tickets
532441
532441
ADMIT
ONE
HOMESEND
QR Code
ATM
ATM/Kiosk
Smartphoneapps
App
Handset
Agent
Branchlessbanking
P2P/OTCtransfer
Pay merchant
Receivesalary
$$$
Micro finance
Cash-in/out
Transport pass
1
PARIS-
LONDON
MAR 27
-2014
9:42
2
:::::
Pay bill
BILL
Redeem coupon
15%OFF
Rechargeairtime
Pay school fees

eServGlobal Limited Annual Report 2013 7
eServGlobal’s solutions are installed at more than 65 customers in over 50 countries worldwide (excluding HomeSend). In FY2013 we added 10 new customers for our core business in 10 new countries. We also expanded our footprint within our existing customer base, including four new product deployments including NFC payments and companion cards.
In financially underserved markets our solutions open a financial world to users, rich with innovative services such as the ability to pay their bills directly from their phone or the ability to easily and cost-effectively transfer money home to rural areas. Our range of micro-finance solutions includes the ability for farmers to insure their crops directly from their handset or to have the ability to save money in a safe way for the first time. In emerging markets around the globe, facilitating microfinance through the mobile is being seen as the future of financial inclusion. Leveraging the mobile infrastructure for microfinance can benefit operators, insurers and customers in a variety of ways. Our PayMobile solution embeds advanced financial service capabilities.
In a developing market in one Middle East country our solutions are already enabling public transport users to simply swipe their NFC-enabled phone for their morning train ride. Through a partnership with mobile app provider, AIRTAG, we provided a mobile transit app which allows travelers to use their phone as their transport pass as well as to view their account balance and recharge history. The first phase of this project was provisioned with an architectural framework to allow easy upgrade to a full mobile wallet solution which would enable mobile money, loyalty and couponing.
Our partnership with Wincor Nixdorf, one of the largest ATM manufacturers in the world, allows us to connect our mobile money solutions to the ATM network, allowing users to cash-in or out of their mobile wallet at an ATM. This is a particularly attractive option in
We offer an end- to-end solution
emerging markets where it addresses security and liquidity concerns for operators and can significantly increase the reach of the mobile money deployment.
We also offer mobile money solutions which feature companion cards, an option which allows the traditional payment infrastructure time to catch up with the new world of mobile money. This is enabled through our close relationship with MasterCard. eServGlobal is a member of MasterCard’s Mobile Money Partnership Program, an initiative aimed at helping the more than 2.5 billion financially underserved consumers worldwide gain access to mainstream financial services through their mobile phone.
In December 2013, we announced the HomeSend Joint Venture, a partnership of MasterCard, eServGlobal and BICS which will take HomeSend into its next phase of global expansion. Today, HomeSend has live deployments in 50+ countries and commercial contracts with mobile network operators (MNOs) and money transfer operators (MTOs) that have the potential of reaching more than 1.2 billion subscribers – the equivalent of one in seven of the world’s population – and 200,000 cash agents respectively.
By connecting the worldwide community of telecom partners and MTOs to the more than 24,000 financial institutions on the MasterCard network, the HomeSend JV will provide consumers new options and flexibility for sending or receiving funds and enable cross border remittance payments worldwide. For people in developing markets, the receipt of funds from friends and family is an important lifeline. Based on World Bank estimates, remittances to developing countries will reach around $515 b by 2015.
The HomeSend JV is a significant milestone for the hub itself and for eServGlobal and it is recognition of the market leading technology that we have developed to power this service. As HomeSend continues its growth over the coming years we are confident of the significant benefit that this will also bring to our core business, not only through the revenue that the hub will achieve, but in the opportunities for new projects for the core business. The recognition that eServGlobal has gained for its technology, through this JV, enables us to be at the forefront of the market for mobile payment and mobile wallet services.
Our continued investment in innovative product development has ensure we are competitive and well-positioned to meet the needs of customers in any region and with any requirement. eServGlobal is well positioned to continue the forward momentum we achieved in FY2013 and we are optimistic about the years ahead.
60
75
95 100
FY2010 FY2011 FY2012 FY 2013
eServGlobal Customer GrowthIncluding HomeSend

8
www.eservglobal.com/mediacenter/timeline
Read more about our first 30 years:
19
90
2012
2008
2013
2013
19
87
1983: FERMA (Française d’Électronique, Recherche et Mathématiques) was
founded in France on the strength of several patents regarding text-to-speech
synthesis, signal processing and large-capacity Voice Systems design.
FERMA
develops the
DIVAPHONE product line,
able to receive from 4 to 8
simultaneous calls, to vocally
respond to questions asked
through the phone.
FERMA strengthens
its ties to the banking
industry. The company introduces
the first solutions which allow customers
to interact with their account via a
telephone. These are widely adopted
across France by
several leading
banks.
1991: eServ was founded in Sydney, Australia.
as a provider of enterprise hardware, technical
services and software solutions..
2000: eServ Limited merges with G8 Labs, a Wellington based provider of
technical services and software to the telecommunications industry
2000: eServ is successfully listed on the
Australian Securities Exchange (symbol: ESV)
2001: eServ Limited changes its name to eServGlobal Limited to reflect its
transformation into a global company with operations in Australia, UK, US, Hong Kong
and New Zealand. The company secures significant Intelligent Network (IN) software
licence and implementation projects with major carriers in Denmark and Belgium.
2004: eServGlobal is listed on the London Stock
Exchange AIM Marketing (symbol: ESG)
2008: eServGlobal’s successful USP business was
acquired by Oracle .
eServGlobal’s
recharge and mobile
money suite, PayMobile,
manages approximately €3.5 billion
in transactions per year, adapting
to the differing needs
in emerging and
developed markets
2005: FERMA became part of eServGlobal: the combination of the two
companies provides a unique capability to deliver end-to-end solutions
for all interactive communications and advanced services.
1997: Launch of “simPATI” Pre-Paid service for TELKOMSEL, Indonesia’s
largest cellular operator, based on scratch card recharge
vouchers
eServGlobal and
BICS announce strategic
partnership to jointly launch
HomeSend, a new service for
mobile remittance, roaming recharge
and airtime exchange.
eServGlobal announces
a significant framework
agreement with the Zain Group to
deliver end-to-end mobile money
services to its subscribers across
countries in the Middle East and
North Africa.
eServGlobal
announces a Joint Venture
with MasterCard and BICS to take
HomeSend to its next phase of global
expansion, validating the company’s strategic
approach to align itself with the worlds
largest payment organisations in the financial,
telecommunications, global roaming and
international remittance sectors.
2010: eServGlobal focuses its strategy on mobile
money and value-added services and announces its
first customer for mobile money in the Middle East.
2013: eServGlobal consolidates its leading
position in the mobile money space announcing
it has joined MasterCard’s Mobile Money
Partnership Program.
2013: eServGlobal posts final year results
showing a return to EBITDA profitability and
strong growth in the core mobile money
business.
2012: Following a string of significant contract
announcements, HomeSend potential subscriber coverage
surpasses 1 billion subscribers.
1983 - 2013For more than 30 years, eServGlobal has been a source of innovation for telcos and financial institutions worldwide.

eServGlobal Limited Annual Report 2013 9
Chairman’s reviewI am delighted to report a successful year for eServGlobal. We have made significant progress against our strategic objectives during the period, with the return to full year EBITDA profitability marking an important milestone in our journey. Our restructuring initiatives over the last few years are now in place and we are confident that they will provide the right platform from which to grow the business. I am excited about the opportunities ahead as we enter a new age of mobile money.
The achievements in our core business have been complemented by the continuing success of the HomeSend international remittance hub. Building on our substantial customer base under contract coverage, we exceeded our objectives for live deployments in 2013. This success was instrumental in the creation of a joint venture with MasterCard and BICS, announced in December 2013. It is our belief that the JV will accelerate HomeSend’s move into a new phase in which the hub will become open to new markets, while being supported by the full bandwidth of MasterCard’s marketing and distribution networks.
Board CompositionDuring the year, we were pleased to announce the appointment of Paolo Montessori as CEO and Managing Director as well as the appointment of Steve Blundell to the Board as Chief Financial Officer. John Conoley joined the Board as a Non-Executive-Director, replacing Jamie Brooke who stepped down following three years with the Company. David Smart also retired as a director in 2013 after thirteen years on the eServGlobal Board. It has been a pleasure working with Paolo, Steve and John over the course of the year and I have no doubt we will continue to benefit from their experience and knowledge. I would also like to thank David and Jamie for their meaningful contributions to the Company and wish them well in their future endeavours.
Finally, following the establishment of the HomeSend joint venture, Director Craig Halliday stepped down from the Board in December 2013. During his tenure as COO, CEO and Director, Craig played a major part in the restructuring of the business and the formation of the leadership team we have in place today that has brought the Company back to EBITDA profitability. Craig’s final task as Executive Director was to bring HomeSend to a new and exciting level and the formation of the joint venture with MasterCard and BICS marked the completion of his commitments to the Company.
SecuritiesI would like to thank our shareholders for their support for our recent share placements. The placement of 29,507,815 shares in December 2012 raised $9.557 million (approximately £6.197 million) and was used to invest in our technology and to position our company to be able to bid for substantial projects, such as the Zain Group win. As eServGlobal competes for larger contracts with larger telecommunications and financial services companies, the demand for up-front performance bonds and the acceleration of specific projects and deliverables is required.
In January 2013, shareholders approved a second placement of $7.245 million (approximately £4.765 million), the proceeds of which were used to fully repay existing shareholder loans. Subsequent to the year-end, another smaller placement of 4,500,000 shares was carried out in December 2013, raising AUD$3.375 million (approximately £1.843 million). There are now a total of 253,545,997 shares on issue.
The number of share options currently on issue is 9,100,000. All of the options granted to date under the ESOP have been issued at 36 cents and are “in the money” by a significant amount due to the recent rapid appreciation in the Company’s share price. The efforts of the option holders have been a significant reason for the rapid appreciation in the Company’s share price. The deferred vesting dates (and requirement that an option holder be an employee at those vesting dates) provide a retention benefit for the company, while providing a tangible incentive to the option holder.
We are pleased to report that during the 2013 financial year we achieved a 226% increase in our market capitalisation and a 158% increase in our share price. As at 31 October 2012, eServGlobal’s share price was AU$0.20 with 196,847,706 shares on issue, creating a market capitalisation of AU$39.4M. At the close of the following financial year on 31 October 2013, the share price was AU$0.515 with 249,045,997 shares on issue, producing a market capitalisation of AU$128.3M. We are proud of the value we have created over this period for our shareholders and we are confident that our strategy has positioned eServGlobal to continue to lead in the dynamic mobile money industry.
I would like to thank all employees whose hard work and efforts have helped us to build our established position today and our shareholders who have supported us on the journey so far. We are proud to be a market leader and instrumental part of the innovation and global growth that characterises this segment of the financial services industry.
Looking ahead, we remain focussed on expanding our relationships with our customers and the ongoing innovation of our solutions to ensure that we remain the leading technology partner for end-to-end mobile money solutions. I am confident in the continued growth of the business and that the Company will have another successful year in 2014.
Richard MathewsChairman

10
At the close of 2013, eServGlobal is in the strongest position it has been in for many years. Following the efforts that have gone into reshaping our business over recent years, I am pleased to be able to report on the considerable successes we have achieved this year.
Our customer roster continues to grow and we have a diverse base of over 65 customers for the core domestic services business. This combined with a healthy backlog of work leaves us well positioned to capitalise on this expanding market.
This year, our core business has further expanded its footprint in this target market through the signing of 10 new customers in 10 new geographies and also through expansion within our existing customers. We have also expanded our product offering into areas such as Near Field Communications, companion cards and mobile financial services, which allow mobile money solutions to be deployed in more developed financial markets where users are already expecting their phones to play a key role in their financial affairs.
The marketplace for mobile money solutions is rapidly evolving. The opportunity for eServGlobal to extend financial services to the “unbanked” population in emerging markets is vast, particularly given that these markets are characterised by high rates of mobile penetration and coupled with limited access to traditional financial services. Mobile network operators and financial service providers continue to move quickly to position themselves to be able to extend these new services to their users.
As the market matures, a key trend is the desire for mobile operators to seek a more holistic and considered approach to their mobile money offering so as to ensure a seamless service
“Our technology is built on 30 years’ experience in delivering operators with
ways to store and transfer value.”
across all deployments and customers, in addition to realising cost efficiency benefits.
eServGlobal is ideally placed to benefit from this trend towards a single vendor strategy. Our technology is built on 30 years’ experience in delivering operators with ways to store and transfer value.
Our end-to-end solution allows operators to choose one technology platform to meet all their needs from recharge through to basic mobile money and more advanced mobile financial services. Our modular approach is also well-suited to operators or financial service providers who need a solution which can grow as their market matures. These factors were key to securing a Group-wide framework agreement with the Zain Group, resulting in estimated revenue of US$12m over three years.
Our objective for the HomeSend service during the year was to move from subscriber coverage land grab to the next phase of live deployments, with a target of reaching 50 live corridors by year end. We are pleased to have achieved that goal and the HomeSend service is now connecting 51 countries for remittance. Post the period-end, we announced a transformational joint venture agreement with MasterCard and BICS that will propel the HomeSend service to a new operating level. We are excited to be part of this truly unique partnership on the cutting edge of mobile financial services.
I am confident that the success of 2013 will form the platform for further market-leading achievements in the coming years.
Paolo MontessoriCEO & Managing Director
CEO’s report

eServGlobal Limited Annual Report 2013 11
I am pleased to be able to report on a pivotal year for eServGlobal, a year in which the company returned to EBITDA profitability for the first time in the core business since FY2009. FY2013 adjusted EBITDA profit was A$1.7m (UK£1.1m) compared to an EBITDA loss of A$1.9m (UK£1.6m) in FY2012.
The support of our shareholders during FY2013 and the years leading up to it has been integral to our success. As reported in the Chairman’s statement, during FY2013 we achieved a 226% increase in our market capitalisation and a 158% increase in our share price. We are proud of the value this has created for our shareholders.
During the financial year, two share placements were carried out, the first in December 2012, followed by a second placement in January 2013. The proceeds of these placements were used to repay shareholder loans in full, as well as invest in customer-facing resources. Subsequent to year end, in December 2013 another smaller placement was carried out. Thank you to our shareholders for their ongoing support.
eServGlobal has gained significant traction in the mobile money space. As the company competes for larger projects with telecommunication groups and financial service companies, there is an increased demand for up-front performance bonds combined with the acceleration of projects and deliverables. The share placements have been integral in allowing eServGlobal to successfully participate in these opportunities. The significant Zain Group frame agreement announced in April 2013 is testament to this. As reported this substantial contract will result in an estimated revenue of over US$12m over three years for eServGlobal. In line with our Company strategy, restructuring efforts are now largely complete and I feel the company is now ideally positioned to benefit from the rapidly growing mobile money market.
Our financial performance has been underpinned through tight cost control as evidenced by improvements in our gross margins which reached 62% in FY2013, a 6% improvement on the prior year.
The core business is in the strongest position it has been for some years and we are well positioned for sustainable growth in coming years. We have a healthy pipeline of orders to carry us into FY2014 and beyond. The company has a solid and
substantial existing customer base which brings stable recurring revenue into the business through ongoing support contracts. In FY2013, approximately 51% of revenue was recurring in nature. This is complemented by the predictable nature of our typical customer lifecycle. As a long-term technology vendor, eServGlobal often works with customers for years even decades, continually providing new services and license expansions as the needs of the market change.
We have also placed an emphasis in recent years on diversifying
CFO’s report
the geographies within which our customers are located. In FY2013 we added 10 new customers in 10 new countries.
We are now investing back into the business to ensure that we are well-equipped to meet the significant orders we have received. The strategic investments we are making are largely in customer facing roles such as sales and service delivery.
As we move into FY2014, I am confident that eServGlobal is well positioned to build on the success of the past year and to acheive sustainable growth in the years to come.
Stephen BlundellCFO & Finance Director
“The core business is in the strongest position it has been for some years and we are well positioned for sustainable growth
in coming years.”

12
Board of DirectorsThe directors of eServGlobal Limited submit herewith the financial report for the financial year ended 31 October 2013.The names and particulars of the directors of the company during or since the end of the financial year are:
Richard MatthewsNon-executive Chairman
Richard is the Non-Executive Chairman and former Chief Executive Officer of eServGlobal. He has over 20 years’ management experience in telecommunications, software and investment. He is a founding partner of MHB Holdings. Previously, Mr. Mathews
was CEO of Mincom, Australia’s largest enterprise software company, increasing the share price from $2.50 to $8.77 in a two-year period.
He has also held the role of Senior Vice President, International at J.D. Edwards and is currently managing director of listed company RungePincockMinarco Limited.
He holds a Bachelor of Commerce and a Bachelor of Science and is an Associate Chartered Accountant.
Richard was appointed as a director in July 2009.
Craig HallidayExecutive Director
Craig was the Chief Executive Officer and Managing Director of eServGlobal until his resignation from these roles on 30 April 2013.
Prior to eServGlobal, Craig served as Executive President of Field Operations
(COO) at Mincom, where he achieved record-breaking growth in both revenues and profitability. He has worked in the high-tech industry as an executive and investor since 1996 and has held senior roles including President of PeopleSoft Japan and various management positions within J.D. Edwards.
Craig holds a Bachelor of Science from Edinburgh University and is a member of the Institute of Chartered Accountants in England and Wales.
Craig resigned as a Director on 30 December 2013.
Paolo MontessoriManaging Director & Chief Executive Officer
Paolo Montessori has worked in the telecommunications industry for more than 20 years and is a well recognised figure in the global mobile VAS market with a particular focus on mobile money solutions. He has been closely involved in
both commercial and solution design in the field of mobile money and payments, having led projects for numerous industry leaders.
His experience extends to the telecom and financial services industries in Australia, the Middle East, South Asia, Asia Pacific, Europe and Latin America, encompassing both emerging and developed markets where mobile money is experiencing rapid growth.
Paolo was appointed Managing Director and Chief Executive Officer of eServGlobal on 30 April 2013 following the resignation of Craig Halliday from those roles.
Stephen BlundellFinance Director & Chief Financial Officer
Stephen has nearly 20 years’ experience in financial and operational management having held various senior roles with leading multi-national software companies.
His experience includes EMEA Director of Finance at Adobe Systems and EMEA Vice President Commercial Operations at Siemens PLM, where he drove eight quarters of unprecedented revenue growth, exceeding competitors’ success and the company’s own financial plans.
Stephen was appointed as Finance Director on 30 April 2013 and has held the role of Chief Financial Officer since November 2009

eServGlobal Limited Annual Report 2013 13
David SmartNon-Executive Director
David held senior executive positions in large scale manufacturing and merchandising businesses for more than 20 years. This includes 13 years as Chief Financial Officer of Tubemakers of Australia Limited and Metal Manufactures Limited. He is a non-executive director
of a listed company Saunders International Limited. David holds a Bachelor of Commerce and MBA from the University of New South Wales and is a Fellow of the Australian Society of Certified Practicing Accountants.
David has been a member of the Board since July 2000. He retired as a Director on 22 March 2013.
Stephen BaldwinNon-executive Director & Chairman of the Audit Committee
Stephen is a chartered accountant with 30 years of business experience. He commenced his career with Price Waterhouse and had a decade with the firm in three different countries. He was subsequently employed in the
funds management industry for many years, initially with Hambro-Grantham and then with Colonial First State, where he was that group’s Head of Private Equity. He has extensive Board experience across multiple industries. Other current roles include advising one of Australia’s larger superannuation funds on their global private equity program. Stephen holds a Bachelor of Commerce (Honours) from the University of Cape Town and is a member of the Institute of Chartered Accountants of Australia.
Stephen was appointed a director and a member of the Audit and Remuneration and Nomination Committees on 25 November 2011. He was appointed as Chairman of the Audit Committee with effect from 1 May 2013.
James BrookeNon-executive Director
James is a Chartered Accountant with experience in strategic consulting, finance and investment. He is currently a fund manager at Henderson in the Henderson Volantis Small Cap Team with responsibility for active corporate engagement. He previously worked in the
private equity industry for ten years, initially with 3i in the London buyout team and more recently as a venture capitalist with Quester where he specialized in IT services and telecommunications investments. Prior to this, he was with Deloitte’s strategic consultancy business after having trained with them as a Chartered Accountant.
He is a non-executive Director of Renovo PLC, NetDimensions, Oryx International Growth Fund and Chapel Down PLC. He holds a BA in Mathematics from Oxford University and an MSc in Telecommunications from University College London.
James resigned as a Director on 1 May 2013.
François BarraultNon-executive Director & Chairman of the Remuneration and Nomination Committee
François is the founder and chairman of FDB Partners, an investment and consulting firm that specializes in technology, renewable energy and publishing. He has previously served as
CEO of BT Global services, President of BT International, and as a member of the board and the operating committee of BT Group PLC. He is also Chairman of Idate/DigiWorld Institute, the leading European think tank in TMT (Telecom, Media & Technology). He is also a Non-Executive Director of Alpha Networks and sits on various advisory boards around the world.
His extensive experience includes key roles within Lucent Technologies such as President, Mobility International and President and CEO for the EMEA region. Prior to Lucent, he worked at Ascend Communications, where he held the position of Senior Vice President, International. He has also held executive positions within IBM, Computervision/Prime and Stratus and was co-founder and Chairman of the Board of Astria, an e-commerce software supplier. He holds a Master of Science (D.E.A) in Robotics/AI and an E.D.P in Engineering from the Ecole Centrale de Nantes.
François has been a member of the Board since March 2003 and is Chairman of the Remuneration and Nomination Committee.
John ConoleyNon-executive Director
John’s extensive experience spans the software, hardware, IT services, telecommunications and energy markets. He began his career in the IT industry with IBM in 1983, and worked on a range of industries in technical, sales, and marketing roles. Since then, Mr. Conoley
has held general management and director-level roles in small and medium-sized private and public companies. His most recent roles include: Non-executive director with IT security company Vistorm, Head of the £1.6bn B2B Energy Division at Eon, Chief Executive Officer of mobile device company Psion PLC, an international company listed in the UK. He is also currently CEO of a Private Equity backed software company based in the UK. John holds a Bachelor of Arts (Hons) from Southampton University.
John was appointed as a Director and a member of the Audit Committee on 1 May 2013.

14
Directors’ report Directorships of other listed companies Directorships of other listed companies held by Directors in the 3 years immediately before the end of the financial year are as follows: Name Company Period of Directorship Richard Mathews RungePincockMinarco Limited 8 February 2012 - Ongoing John Conoley Psion PLC 28 April 2008 – 01 October 2012 Company Secretary Tom Rowe has served as Company Secretary of eServGlobal since 6 April 2011. He is a Corporate and Commercial Lawyer practising with Simpsons Solicitors with a specialty in corporate transactions, corporate governance and listed company secretarial practice. Mr Rowe holds a BA LLB (Hons) from the University of Adelaide and is an Associate of the Governance Institute of Australia. Principal activities eServGlobal (LSE: ESG, ASX: ESV) offers mobile money solutions which put feature-rich mobile financial services at the fingertips of users worldwide, covering the full spectrum of mobile wallet, mobile commerce, recharge and agent management features. eServGlobal invests heavily in product development, using carrier-grade, next-generation technology and aligning with the requirements of 65 customers in 50 countries. eServGlobal is partnering with MasterCard and BICS to build the HomeSend joint venture, the market leading international remittance service based on eServGlobal technology and enabling mobile money transfer in over 50 markets. eServGlobal has been a source of innovative solutions for mobile and financial service providers for 30 years.

eServGlobal Limited Annual Report 2013 15
Directors’ report Review of operations This report is to be read in conjunction with the Chairman’s review and CEO’s report on pages 2 and 3. The consolidated entity achieved sales revenue for the year of $31.0 million (2012: $28.1 million). The EBITDA profit was $7.3 million after restructuring and non-core business costs of $2.0 million, foreign exchange gains of $8.0 million and share based payments of $0.5 million (2012 EBITDA loss $8.7 million after restructuring and non-core business costs of $2.9 million, foreign exchange losses of $3.4 million and share based payments of $0.6 million). The net result of the consolidated entity for the year to 31 October 2013 was a profit after tax and minority interest for the year of $10.3 million (2012 loss after tax and minority interest of $15.7 million). Included in this result was an income tax credit of $5.9 million (2012 income tax expense of $0.2 million). Earnings per share were 4.3 cents (2012 loss per share: 8.0 cents). The operating cash flow for the year was a net outflow of $8.9 million. Total cash flow for the year was a net inflow of $0.9 million. Cash at 31 October 2013 was $4.9 million. Changes in state of affairs There were no significant changes in the state of affairs of the Group during the financial year. Subsequent Events On 19 December 2013 eServGlobal concluded an agreement to create a new joint venture with MasterCard and BICS (eServGlobal’s current partner in HomeSend) for the international mobile money transfer service, HomeSend. Under the terms of the agreement, eServGlobal will contribute its Homesend business, including staff, that are directly related to the business into a newly formed company (“NewCo”). Following the transaction, MasterCard will own 55% of NewCo, eServGlobal will own 35% and BICS will own 10%. Based on the initial shareholdings, MasterCard will be entitled to appoint three directors to the Board of NewCo, eServGlobal will be entitled to make two appointments and BICS will be entitled to nominate one director. MasterCard will contribute cash for its interest in NewCo with eServGlobal to receive €9.0m ($13.6 million) in cash, which includes €3.45 million ($5.21 million) to be held in escrow, net of a pro rata of NewCo’s estimated working capital requirements for the medium term. In addition, MasterCard will enter into a commercial agreement with HomeSend which will have an initial duration of three years and automatic yearly renewal thereafter. The commercial agreement will require MasterCard to use its best endeavors to promote the HomeSend service utilising MasterCard’s sales channels. There are conditions precedent to the creation of the HomeSend joint venture and those conditions, together with a summary of the material terms and conditions of the HomeSend joint venture have been included in the regulatory announcement dated 19 December 2013. As a result of the transfer of its Homesend business to the HomeSend joint venture, eServGlobal will recognise a gain on disposal of between €23.5m - €24.2m in 2014 ($33.9m – $35.0m) based on consideration of €30.0m ($43.3m) less assets classified as held for sale and estimated selling expenses. The assets attributable to the HomeSend business (including the allocated goodwill component) have been classified as “Assets classified as held for sale” in the Consolidated Statement of Financial Position as at 31 October 2013. The expected taxable profit arising from the Homesend joint venture has resulted in the recognition of a deferred tax asset and associated income tax credit of €4.7M ($6.8M) as at 31 October 2013 relating to recoupment of income tax losses not previously recognised by the consolidated entity. On 23 December 2013 eServGlobal announced that it had entered into a subscription agreement with an existing Australian institutional investor for the Company to issue 4,500,000 fully paid ordinary shares at AUD$0.75 (£0.41) per share, raising AUD$3.375M (£1.843M). No fees were payable on the placement. The 4,500,000 fully paid ordinary shares were issued on 30 December 2013 (being represented by depositary interests in CREST) and admitted to AIM on 30 December 2013. Following the issue, the Company's total issued share capital is 253,545,997 fully paid ordinary shares of no par value.

16
Directors’ report Future developments Details of future developments in the Group are contained in the Chairman’s review and CEO’s report on pages 2 and 3. To the extent that the disclosure of information regarding likely developments in the operations of the Group in future financial years and the expected results of those operations is likely to result in unreasonable prejudice to the Group, this information has not been disclosed in this report. Environmental regulations
The Group operates primarily within the technology and telecommunication sector and conducts its business activities with respect for the environment while continuing to meet the expectations of shareholders, customers, employees and suppliers.
During the year under review, the Directors are not aware of any particular or significant environmental issues which have been raised in relation to the consolidated entity's operations.
Dividends
No dividends were declared or paid during the financial year (2012: nil). Share options eServGlobal Employee Share Option Plan The company has an ownership-based remuneration scheme for directors, key management personnel and employees. In accordance with the provisions of the scheme, directors and employees may be granted options to acquire ordinary shares in the company. The Board believes that the options scheme has a significant role to play in motivating employees to help ensure the continued performance of the company. The exercise of any share options is not dependant on any performance criteria, however, is dependent on a period of service relative to the vesting dates. Share options granted to directors and senior management During the financial year and up to the date of this report the company granted 2,400,000 options to the directors and senior management of the entity (2012: 10,200,000). Further details of the executive and employee share option plan are disclosed in Note 6 to the financial statements. Details of unissued shares under option as at the date of this report are:
Issuing Entity Number of shares
under option Class of shares Exercise price of
option Expiry date of options eServGlobal Limited 500,000 Ordinary $0.36 31 May 2014 eServGlobal Limited 6,200,000 Ordinary $0.36 14 May 2017 eServGlobal Limited 1,600,000 Ordinary $0.36 21 Dec 2017 eServGlobal Limited 800,000 Ordinary $0.36 10 Jun 2018
During the financial year and up to the date of this report, there were no options exercised. Indemnification of officers and auditors During the financial year, the company paid a premium in respect of a contract insuring the directors of the company (as named above), the company secretary, and all key management personnel officers of the company and of any related body corporate against any liability incurred as a director, secretary or key management personnel officer to the extent permitted by the Corporations Act 2001. The contract of insurance prohibits disclosure of the nature of the liability cover and the amount of the premium. The company has not otherwise, during or since the financial year, indemnified or agreed to indemnify an officer or auditor of the company or of any related body corporate, against any liability incurred by such an officer or auditor.

eServGlobal Limited Annual Report 2013 17
Directors’ report Directors’ attendance at Board and Committee meetings held during the financial year
Board of Directors Special Purpose Committees
Audit Committee Remuneration and Nomination Committee
Directors Held * Attended Held# Attended Held* Attended Held* Attended David Smart 9 8 1 1 3 3 - - François Barrault 15 13 - - - - 11 11 Richard Mathews 15 13 2 1 - - - - James Brooke 10 7 2 1 - - - - Stephen Baldwin 15 14 4 4 5 5 11 11 Craig Halliday 15 13 - - - - - - John Conoley 5 5 - - 2 2 Paolo Montessori 5 5 - - - - Stephen Blundell 5 5 1 1 - - *Held during term of director’s appointment to Board, Audit or Remuneration and Nomination Committees. #Special purpose committees established during the financial year with the delegated authority of the Board to consider specific matters to which the Director was appointed. The special purpose committees dissolved once the delegated authority was exercised. Non-audit services The directors are satisfied that the provision of non-audit services, during the financial year, by the auditor (or by another person or firm on the auditor’s behalf) is compatible with the general standard of independence for auditors imposed by the Corporations Act 2001. The audit committee, in conjunction with the Chief Financial Officer, assesses the provision of non-audit services by the auditors to ensure that the auditor independence requirements of the Corporations Act 2001 in relation to the audit are met. Details of amounts paid or payable to the auditor for non-audit services provided during the financial year by the auditor are outlined in Note 7 to the financial statements. Auditor’s independence declaration The auditor’s independence declaration is included on page 18 of the financial report. Rounding off of amounts The company is a company of the kind referred to in ASIC Class Order 98/0100, dated 10 July 1998, and in accordance with that Class Order, amounts in the directors’ report and the financial report are rounded off to the nearest thousand dollars unless otherwise indicated.

18
Directors’ report Remuneration Report Determining remuneration policy for directors and key management personnel, and its relationship to eServGlobal’s performance The Company is listed on both the Australian Securities Exchange and the London Stock Exchange (AIM). It is an international group which is faced with all of the market pressures that flow in such circumstances. It must compete successfully with other international organisations that are substantially larger and which have the ability to draw on enormous resources. Our employees are based in diverse parts of the globe and regularly must travel to work in remote locations. The remuneration policies must be appropriate to these circumstances. In determining the appropriate remuneration policies for the Group, the Board believes that the salary packages must be sufficient, in the international marketplace in which the Group operates, to attract, retain and motivate high calibre, hard working, dedicated employees, who have the knowledge and skills appropriate for the business. In this regard, a component of the salary package for employees is paid after the results of a financial year are completed, and the entitlement is based primarily on the results achieved by the Group. The Board’s broad policy is implemented through its Remuneration and Nominations Committee. Director and other key management personnel details The following persons acted as key management personnel of the Company and the Group during or since the end of the financial year:
• Richard Mathews (Non-executive Chairman) • Paolo Montessori (Managing director and Chief Executive Officer appointed on 30 April 2013; Chief
Operating Officer until 30 April 2013) • Stephen Blundell (Chief Financial Officer; appointed Finance director on 30 April 2013) • David Smart (Non-executive director until resignation on 22 March 2013) • François Barrault (Non-executive director) • James Brooke (Non-executive director until resignation on 1 May 2013) • Craig Halliday (Executive Director until resignation on 30 December 2013; Chief Executive Officer until
30 April 2013) • Stephen Baldwin (Non-executive director) • John Conoley (Non-executive director appointed on 1 May 2013) • Remi Arame (Chief Sales Officer) • James Hume (Chief Technology Officer appointed on 1 October 2012) Except as noted, the named persons held their current positions for the financial year and since the end of the financial year.

eServGlobal Limited Annual Report 2013 19
Directors’ report Elements of key management personnel remuneration Non-executive directors are paid directors’ fees and, in the case of those who are Australian based, compulsory superannuation fund contributions are made on their behalf. The Board reviews the level of fees from time to time, and sets individual non-executive directors fees based on the levels of fees for comparable listed companies in the appropriate parts of the world. During the year, the Board commissioned an independent benchmarking report for its non-executive director fees and, following the receipt and consideration of the report, reduced the fees paid to the non-executive directors. No remuneration recommendation was provided in the report. The non-executive directors are appointed by either the Board or shareholder vote and any appointment is subject to re-election on retirement required at Annual General Meetings. Executive directors and other key management personnel remuneration comprise both Short Term Incentives (STI) and Long Term Incentives (LTI) components. The STI takes the form of a cash bonus and the LTI comprises the issue of share options under the eServGlobal Employee Share Option Plan. a) The STI component for the executive directors and other key management personnel is as follows.
The Chief Executive Officer (CEO) is remunerated on a salary package basis that includes a base salary, pension contributions, a portion that is a variable component which is dependent on agreed performance objectives and various allowances such as housing and education. The variable component comprises elements relating to achievement of financial plan and specific business objectives. The CEO is a permanent employee with no fixed employment term and a notice period of five months required by either party. The Chief Financial Officer (CFO) is remunerated on a salary package basis that includes a base salary, pension contributions and a portion that is a variable component which is dependent on agreed performance objectives. The variable component comprises elements relating to achievement of financial plan and specific business objectives. The CFO is a permanent employee with no fixed employment term and a notice period of six months required by either party. The Chief Sales Officer (CSO) is remunerated on a salary package that includes a base salary, a portion that is a variable component (which is dependent on agreed performance objectives relating to sales), pension contributions and various allowances such as housing and education. The CSO is a permanent employee with no fixed employment term and a notice period of thirty days required by either party. The Chief Technology Officer (CTO) is remunerated on a salary package basis that includes a base salary and a portion that is a variable component which is dependent on agreed performance objectives. The variable component comprises elements relating to achievement of financial plan and specific business objectives. The CTO is a permanent employee with no fixed employment term and a notice period of two months required by either party.
b) The LTI (share option) component contains an element of reward to incentivise loyalty and continuity of
service to the company through the vesting of options over a defined period with eligibility being dependent on continued employment.
20
Directors’ report
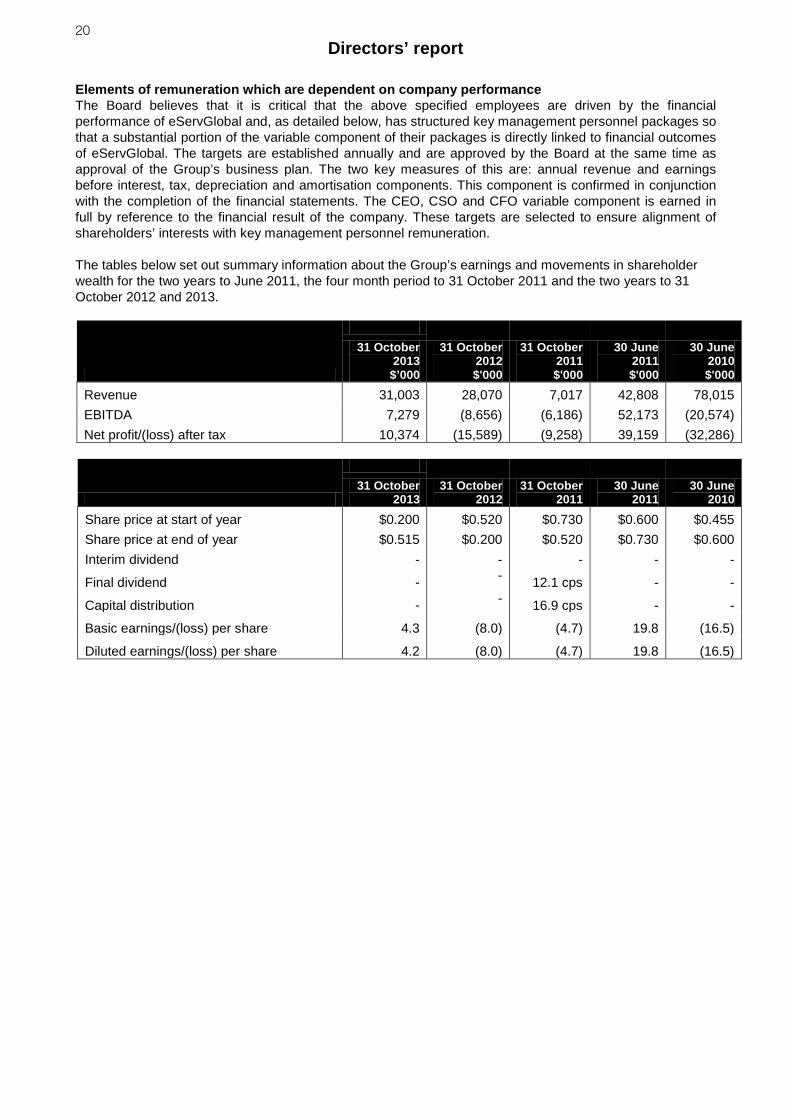
Elements of remuneration which are dependent on company performance The Board believes that it is critical that the above specified employees are driven by the financial performance of eServGlobal and, as detailed below, has structured key management personnel packages so that a substantial portion of the variable component of their packages is directly linked to financial outcomes of eServGlobal. The targets are established annually and are approved by the Board at the same time as approval of the Group’s business plan. The two key measures of this are: annual revenue and earnings before interest, tax, depreciation and amortisation components. This component is confirmed in conjunction with the completion of the financial statements. The CEO, CSO and CFO variable component is earned in full by reference to the financial result of the company. These targets are selected to ensure alignment of shareholders’ interests with key management personnel remuneration. The tables below set out summary information about the Group’s earnings and movements in shareholder wealth for the two years to June 2011, the four month period to 31 October 2011 and the two years to 31 October 2012 and 2013.
31 October
2012 $'000
31 October 2011 $'000
30 June 2011 $'000
30 June 2010 $'000
31 October 2013
$’000 Revenue 31,003 28,070 7,017 42,808 78,015 EBITDA 7,279 (8,656) (6,186) 52,173 (20,574) Net profit/(loss) after tax 10,374 (15,589) (9,258) 39,159 (32,286)
31 October
2012 31 October
2011 30 June
2011 30 June
2010 31 October
2013 Share price at start of year $0.200 $0.520 $0.730 $0.600 $0.455 Share price at end of year $0.515 $0.200 $0.520 $0.730 $0.600 Interim dividend - - - - -
Final dividend - - 12.1 cps - -
Capital distribution - - 16.9 cps - -
Basic earnings/(loss) per share 4.3 (8.0) (4.7) 19.8 (16.5)
Diluted earnings/(loss) per share 4.2 (8.0) (4.7) 19.8 (16.5)

eServG
lobal Limited A
nnual Report 2013
21
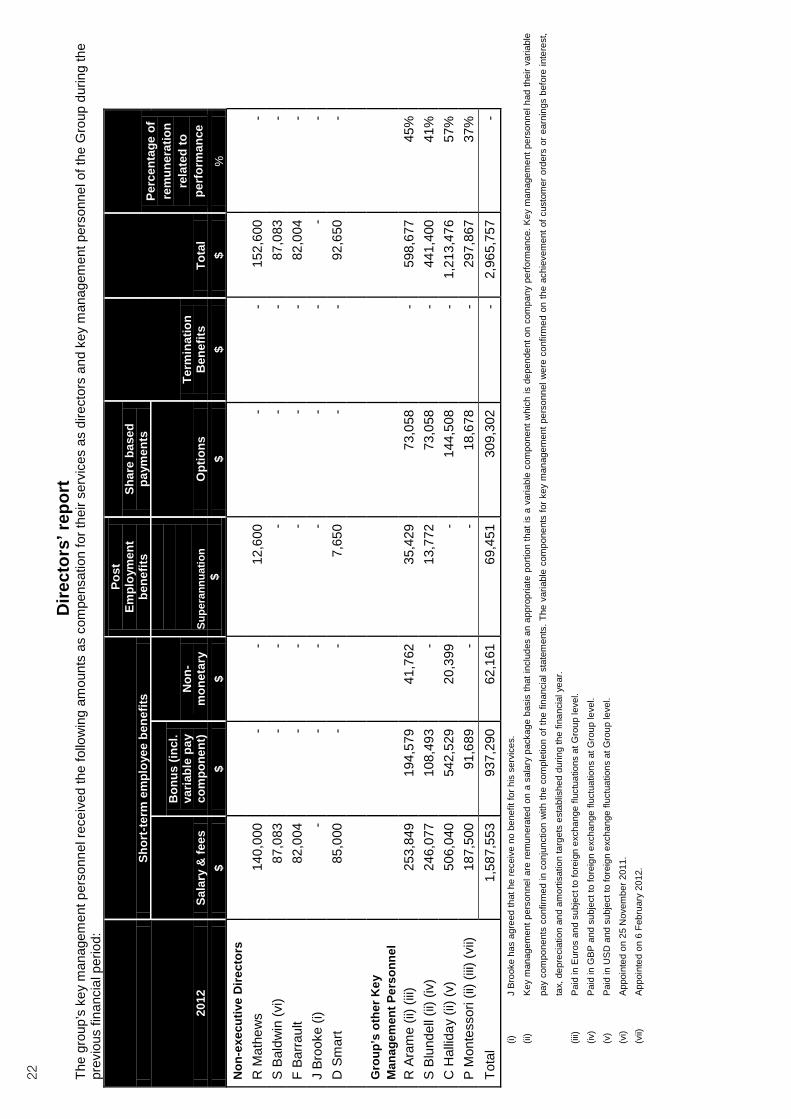
Directors’ report
The group’s key managem
ent personnel received, or will receive, the follow
ing amounts as com
pensation for their services as directors and key managem
ent personnel of the Group
during the financial year:
Non-executive D
irectors
R
Mathew
s 130,000
- -
6,300 -
- 136,300
- S B
aldwin
91,142 -
- -
- -
91,142 -
F Barrault 79,422
- -
- -
- 79,422
- J Brooke (i) (viii)
- -
- -
- -
- -
J Conoley (vi)
37,392 -
- -
- -
37,392 -
D Sm
art (vii) 33,360
- -
3,002 -
- 36,362
- G
roup’s other Key
Managem
ent Personnel
C H
alliday (v) (x) 282,602
208,159 24,060
- (48,888)
278,333 744,266
21%
R Aram
e (ii) (iii) 268,875
239,015 43,474
36,881 61,923
- 650,168
46%
S Blundell (ii) (iv)
263,524 -
724 14,209
72,083 -
350,540 21%
P M
ontessori (ii) (iii) (ix) 346,329
2,098 60,410
- 90,903
- 499,740
19%
J Hum
e 185,740
- -
- 66,927
- 252,667
26%
Total 1,718,386
449,272 128,668
60,392 242,948
278,333 2,877,999
- (i)
J Brooke agreed to receive no benefit for his services until his resignation on 1 M
ay 2013.
(ii) K
ey managem
ent personnel are remunerated on a salary package basis that includes an appropriate portion that is a variable com
ponent which is dependent on com
pany performance. K
ey managem
ent personnel had their variable pay
components confirm
ed in conjunction with the com
pletion of the financial statements. The variable com
ponents for key managem
ent personnel were confirm
ed on the achievement of custom
er orders or earnings before interest, tax,
depreciation and amortisation targets established during the financial year.
(iii) P
aid in Euros and subject to foreign exchange fluctuations at G
roup level.
(iv) P
aid in GB
P and subject to foreign exchange fluctuations at G
roup level.
(v) P
aid in US
D and subject to foreign exchange fluctuations at G
roup level.
(vi) A
ppointed on 1 May 2013.
(vii) R
etired as a Director on 22 M
arch 2013.
(viii) R
esigned on 1 May 2013.
(ix) A
ppointed Managing D
irector and Chief E
xecutive Officer on 30 A
pril 2013.
(x) R
esigned as Managing D
irector and Chief E
xecutive Officer on 30 A
pril 2013. Resigned as executive director on 30 D
ecember 2013. The total value of C
Halliday’s share options w
hich lapsed is $190,845.
Short-term
employee benefits
Post Em
ployment
benefits Share based
payments
Termination
Benefits
Total
Percentage of rem
uneration related to
performance
2013 Salary &
fees
Bonus (incl.
variable pay com
ponent) N
on-m
onetary
Superannuation
Options
$
$ $
$ $
$ $
%
22
Dire
ctor
s’ re
port
Th
e gr
oup’
s ke
y m
anag
emen
t per
sonn
el re
ceiv
ed th
e fo
llow
ing
amou
nts
as c
ompe
nsat
ion
for t
heir
serv
ices
as
dire
ctor
s an
d ke
y m
anag
emen
t per
sonn
el o
f the
Gro
up d
urin
g th
e pr
evio
us fi
nanc
ial p
erio
d:
Non
-exe
cutiv
e D
irect
ors
R
Mat
hew
s
140,
000
-
-
12,6
00
- -
15
2,60
0 -
S
Bal
dwin
(vi)
87,0
83
-
-
-
- -
87
,083
-
F Ba
rrau
lt
82,0
04
-
-
-
- -
82
,004
-
J
Broo
ke (i
) -
- -
- -
- -
- D
Sm
art
85,0
00
- -
7,65
0 -
- 92
,650
-
G
roup
’s o
ther
Key
M
anag
emen
t Per
sonn
el
R A
ram
e (ii
) (iii)
25
3,84
9 19
4,57
9 41
,762
35
,429
73
,058
-
598,
677
45%
S B
lund
ell (
ii) (i
v)
246,
077
108,
493
- 13
,772
73
,058
-
441,
400
41%
C
Hal
liday
(ii)
(v)
506,
040
542,
529
20,3
99
- 14
4,50
8 -
1,21
3,47
6 57
%
P M
onte
ssor
i (ii)
(iii)
(vii)
18
7,50
0 91
,689
-
- 18
,678
-
297,
867
37%
To
tal
1,58
7,55
3 93
7,29
0 62
,161
69
,451
30
9,30
2 -
2,96
5,75
7 -
(i)
J B
rook
e ha
s ag
reed
that
he
rece
ive
no b
enef
it fo
r his
ser
vice
s.
(ii)
Key
man
agem
ent p
erso
nnel
are
rem
uner
ated
on
a sa
lary
pac
kage
bas
is th
at in
clud
es a
n ap
prop
riate
por
tion
that
is a
var
iabl
e co
mpo
nent
whi
ch is
dep
ende
nt o
n co
mpa
ny p
erfo
rman
ce. K
ey m
anag
emen
t per
sonn
el h
ad th
eir v
aria
ble
pay
com
pone
nts
conf
irmed
in c
onju
nctio
n w
ith th
e co
mpl
etio
n of
the
finan
cial
sta
tem
ents
. The
var
iabl
e co
mpo
nent
s fo
r key
man
agem
ent p
erso
nnel
wer
e co
nfirm
ed o
n th
e ac
hiev
emen
t of c
usto
mer
ord
ers
or e
arni
ngs
befo
re in
tere
st,
tax,
dep
reci
atio
n an
d am
ortis
atio
n ta
rget
s es
tabl
ishe
d du
ring
the
finan
cial
yea
r.
(iii)
Pai
d in
Eur
os a
nd s
ubje
ct to
fore
ign
exch
ange
fluc
tuat
ions
at G
roup
leve
l.
(iv)
Pai
d in
GB
P a
nd s
ubje
ct to
fore
ign
exch
ange
fluc
tuat
ions
at G
roup
leve
l.
(v)
Pai
d in
US
D a
nd s
ubje
ct to
fore
ign
exch
ange
fluc
tuat
ions
at G
roup
leve
l.
(vi)
App
oint
ed o
n 25
Nov
embe
r 201
1.
(vii)
A
ppoi
nted
on
6 Fe
brua
ry 2
012.
Sh
ort-t
erm
em
ploy
ee b
enef
its
Post
Em
ploy
men
t be
nefit
s Sh
are
base
d pa
ymen
ts
Term
inat
ion
Ben
efits
To
tal
Perc
enta
ge o
f re
mun
erat
ion
rela
ted
to
perf
orm
ance
20
12
Sala
ry &
fees
Bon
us (i
ncl.
varia
ble
pay
com
pone
nt)
Non
-m
onet
ary
Su
pera
nnua
tion
Opt
ions
$ $
$ $
$ $
$ %

eServGlobal Limited Annual Report 2013 23
Directors’ report Directors’ shareholdings The following table sets out each director’s relevant interest in shares and options in shares of the company or a related body corporate during the financial year and as at the date of this report.
Directors
Fully paid ordinary shares
Executive share options John Conoley - - François Barrault 500,000 - Richard Mathews 10,679,512 1 - Paolo Montessori - 1,250,000 Stephen Blundell - 1,250,000 Stephen Baldwin 932,600 - 1 Shares are held by Paua Pty Ltd.
Share-based payments granted as compensation for the current financial year During the financial year, the following share-based payment arrangements were in existence.
Options series Grant date Expiry date Exercise price Grant date fair
value Issued 27 April 2012 (i) 27-Apr-12 2017 $0.36000 $0.13 Issued 14 May 2012 (i) 14-May-12 2017 $0.36000 $0.11 Issued 11 Feb 2013 (ii) 11-Feb-13 2017 $0.36000 $0.26 Issued 01 Jul 2013 (iii) 01-Jul-13 2018 $0.36000 $0.24
(i) The options in these series vest 2 years from the date of issue and expire on the 5 year anniversary of the date of issue.
(ii) Options issued in these series vest fully on 21 December 2014 and expire on 21 December 2017.
(iii) Options issued in this series vest as to one half on 10 June 2014 and the balance on 10 June 2015 and expire on 10 June 2018.
Value of options issued to directors and key management personnel Key management personnel receiving options are entitled to the beneficial interest under the option only if they continue to be employed with the Group at the time the option vests. Any exposure in relation to the risk associated with the movement in the underlying share price rests with the key management personnel. 1,500,000 options held by Craig Halliday lapsed during the year following his resignation as the Group’s Chief Executive Officer and Managing Director. During the financial year no options were forfeited as a result of a condition required for vesting (other than continuing employment with the company) not being satisfied. No options vested during the year. The following table discloses the options granted, exercised or lapsed during the financial year:

24
Directors’ report Name Number of
options granted
Value of options
granted at the grant date (i)
$
Value of options exercised at the
exercise date $
Value of options
lapsed (ii) $
R Arame 150,000 39,438 - - S Blundell 250,000 65,730 - - P Montessori 500,000 131,461 - - J Hume 650,000 161,370 - - C Halliday - - - 190,845 (i) The value of options granted during the period is recognised in compensation over the vesting period of the grant, in accordance with the
Australian Accounting Standards.
(ii) The value of options lapsing during the period due to the failure to satisfy a vesting condition is determined assuming the vesting condition has
been satisfied.
Signed in accordance with a resolution of the directors made pursuant to s.298 (2) of the Corporations Act 2001. On behalf of the Board
Richard Mathews Chairman 31 January 2014

Liability limited by a scheme approved under Professional Standards Legislation.
Member of Deloitte Touche Tohmatsu Limited
18
Deloitte Touche Tohmatsu
ABN 74 490 121 060
Grosvenor Place
225 George Street
Sydney NSW 2000
PO Box N250 Grosvenor Place
Sydney NSW 1220 Australia
Tel: +61 2 9322 7000
Fax: +61 (0)2 9322 7001
www.deloitte.com.au
The Board of Directors
eServGlobal Limited
c/- Simpsons Solicitors
Level 2, Pier 8/9
23 Hickson Road,
Millers Point NSW 2000
31 January 2014
Dear Board Members
eServGlobal Limited
In accordance with section 307C of the Corporations Act 2001, I am pleased to provide the following
declaration of independence to the directors of eServGlobal Limited.
As lead audit partner for the audit of the financial statements of eServGlobal Limited for the financial year
ended 31 October 2013, I declare that to the best of my knowledge and belief, there have been no
contraventions of:
(i) the auditor independence requirements of the Corporations Act 2001 in relation to the audit; and
(ii) any applicable code of professional conduct in relation to the audit.
Yours faithfully
DELOITTE TOUCHE TOHMATSU
Michael Kaplan
Partner
Chartered Accountants

26
Corporate governance statement The eServGlobal Limited board is responsible for establishing the corporate governance framework of the group having regard to the ASX Corporate Governance Council (CGC) published guidelines as well as its corporate governance principles and recommendations. eServGlobal is also required to comply with, inter alia, the Corporations Act 2001 (Cwth), the ASX Listing Rules and the London Stock Exchange AIM Rules for Companies. The table below and accompanying statement outlines the main corporate governance practices of eServGlobal during the financial year and the extent of eServGlobal’s compliance with the CGC’s recommendations as at the date of this report.
Recommendation Comply
Principle 1 – Lay solid foundations for management and oversight
1.1 Companies should establish the functions reserved to the board and those delegated to senior executives and disclose those functions.
√
1.2 Companies should disclose the process for evaluating the performance of senior executives.
√
1.3 Companies should provide the information indicated in the Guide to reporting on Principle 1. √*
Recommendation Comply
Principle 2 - Structure the board to add value
2.1 A majority of the board should be independent directors. √* 2.2 The chair should be an independent director.
√*
2.3 The roles of chair and chief executive officer (CEO) should not be exercised by the same individual.
√
2.4 The board should establish a nomination committee. √ 2.5 Companies should disclose the process for evaluating the performance of the board, its
committees and individual directors. √
2.6 Companies should provide the information indicated in the Guide to reporting on Principle 2. √*
Recommendation Comply
Principle 3 - Promote ethical and responsible decision-making
3.1 Companies should establish a code of conduct and disclose the code or a summary of the code as to: • The practices necessary to maintain confidence in the company’s integrity; • The practices necessary to take into account their legal obligations and the reasonable
expectations of their stakeholders; and • The responsibility and accountability of individuals for reporting and investigating
reports of unethical practices.
√
3.2 Companies should establish a policy concerning diversity and disclose the policy or a summary of that policy. The policy should include requirements for the board to establish measurable objectives for achieving gender diversity for the board to assess annually both the objectives and the progress in achieving them.
x
3.3 Companies should disclose in each annual report the measurable objectives for achieving gender diversity set by the board in accordance with the diversity policy and progress towards achieving them.
x
3.4 Companies should disclose in each annual report the proportion of women employees in the whole organisation, women in senior executive positions and women on the board.
√
3.5 Companies should provide the information indicated in the Guide to reporting on Principle 3. √

eServGlobal Limited Annual Report 2013 27
Corporate governance statement
Recommendation Comply
Principle 4 – Safeguard integrity in financial reporting
4.1 The board should establish an audit committee. √ 4.2 The audit committee should be structured so that it:
• Consists only of non-executive Directors. • Consists of a majority of independent Directors. • Is chaired by an independent chair, who is not chair of the board. • Has at least three members.
√*
4.3 The audit committee should have a formal charter. √ 4.4 Companies should provide the information indicated in the Guide to reporting on Principle 4. √*
Recommendation Comply
Principle 5 - Make timely and balanced disclosure
5.1 Companies should establish written policies designed to ensure compliance with ASX listing rule disclosure requirements and to ensure accountability at a senior executive level for that compliance and disclose those policies or a summary of those policies.
√
5.2 Companies should provide the information indicated in the Guide to reporting on Principle 5. √
Recommendation Comply
Principle 6 - Respect the rights of shareholders
6.1 Companies should design a communications policy for promoting effective communication with shareholders and encouraging their participation at general meetings and disclose their policy or a summary of that policy.
√
6.2 Companies should provide the information indicated in the Guide to reporting on Principle 6. √
Recommendation Comply
Principle 7 – Recognise and manage risk
7.1 Companies should establish policies for the oversight and management of material business risks and disclose a summary of those policies.
√*
7.2 The board should require management to design and implement the risk management and internal control system to manage the Company’s material business risks and report to it on whether those risks are being managed effectively. The board should disclose that management has reported to it as to the effectiveness of the Company’s management of its material business risks.
√
7.3 The board should disclose whether it has received assurance from the CEO [or equivalent] and the Chief Financial Officer (CFO) [or equivalent] that the declaration provided in accordance with section 295A of the Corporations Act is founded on a sound system of risk management and internal control and that the system is operating effectively in all material respects in relation to financial reporting risks.
√
7.4 Companies should provide the information indicated in the Guide to reporting on Principle 7. √
Recommendation Comply
Principle 8 – Remunerate fairly and responsibly
8.1 The board should establish a remuneration committee. √ 8.2 The remuneration committee should be structured so that it:
• Consists of a majority of independent Directors. • Is chaired by an independent chair. • Has at least three members.
√*
8.3 Companies should clearly distinguish the structure of non-executive directors’ remuneration from that of executive directors and senior executives.
√
8.4 Companies should provide the information indicated in the Guide to reporting on Principle 8. √* √* indicates partial compliance. Refer to further details below.

28
Corporate governance statement
Principle 1. Lay solid foundations for management and oversight
1.1 Companies should establish the functions reserved to the board and those delegated to senior executives and disclose those functions.
The primary responsibilities of eServGlobal’s board include:
• the establishment of long term goals of the company and strategic plans to achieve those goals; • the review and adoption of the annual business plan and budgets for the financial performance of the
company and monitoring the results on a monthly basis; • the appointment of the Chief Executive Officer; • ensuring that the company has implemented adequate systems of internal control together with
appropriate monitoring of compliance activities; and • the approval of the annual and half-yearly financial statements and reports.
The board meets on a regular basis, on average at least once monthly, to review the performance of the company against its goals, both financial and non-financial. In normal circumstances, prior to the scheduled monthly board meetings, each board member is provided with a formal board package containing appropriate management and financial reports.
The responsibilities of senior management including the Chief Executive Officer are contained in letters of appointment and job descriptions given to each executive on appointment and updated annually or as required.
The primary responsibilities of senior management are to:
(i) Achieve the annual business plan and budget (ii) Ensure the highest standards of quality and service are delivered to customers (iii) Ensure that employees are supported, developed and rewarded to the appropriate professional
standards (iv) Ensure that the company continues to produce innovative technology and leading products
Decision making in respect of the functions reserved for the board and those delegated to management is in accordance with a delegation of authority policy and procedures adopted by the board.
1.2 Companies should disclose the process for evaluating the performance of senior executives.
The performance of all senior executives is reviewed at least once a year by the Chief Executive Officer, in conjunction with the full board. They are assessed against personal and company key performance indicators established at the start of each calendar year for each individual. For more detail, refer to the Remuneration Report. 1.3 Companies should provide the information indicated in the Guide to reporting on Principle 1.
A performance evaluation for each senior executive has taken place in the reporting period in line with the process disclosed. A statement covering the primary responsibilities of the board is set out in 1.1 above. A statement covering the primary responsibilities of the senior management is set out in 1.1 above. A copy of the board charter is not publicly available.

eServGlobal Limited Annual Report 2013 29
Corporate governance statement
Principle 2. Structure the board to add value
2.1 A majority of the board should be independent directors.
The eServGlobal board consists of four non-executive directors and two executive directors. John Conoley, Stephen Baldwin and Francois Barrault are considered to be independent directors. David Smart was also considered an independent director during his tenure with the board. Richard Mathews and James Brooke were not considered to be independent by virtue of being associated with substantial shareholders of the company during the financial year. Craig Halliday was not considered independent as he is a former Chief Executive Officer of the company and associated with a former substantial shareholder of the Company. As such, during the financial year a majority of the board were not independent directors.
At the date of this Annual Report, Richard Mathews has ceased to be associated with a substantial shareholder of the Company and as his executive role with the company ceased more than three years ago, he is now considered an independent director. Accordingly, the board is currently composed of four independent and two non-independent directors.
2.2 The chair should be an independent director.
Richard Mathews is a former Chief Executive Officer of the Company and stepped into the position of Chairman of the Board in 2010. While this movement resulted in a chairman who is not independent, the company believes that a chairman with a strong knowledge of the company’s operations has been in the best interests of the company.
Due to the passage of time since his executive role with the company and his ceasing to be associated with a substantial shareholder since the end of the financial year, the Chairman is independent at the date of this Annual Report.
2.3 The roles of chair and chief executive officer should not be exercised by the same individual.
Richard Mathews is the company’s Chairman and Paolo Montessori is the Chief Executive Officer.
2.4 A nomination committee should be established.
The Company has established a Remuneration and Nomination Committee. The members of this Committee are Francois Barrault and Stephen Baldwin. Many of the functions of the Remuneration and Nomination Committee were also carried out in conjunction with the full board.
2.5 Companies should disclose the process for evaluating the performance of the board, its committees and individual directors.
The Chairman undertakes an annual informal evaluation process in reviewing the performance of directors and the board.
2.6 Companies should provide the information indicated in the Guide to reporting on Principle 2
A description of the skills and experience of each director is contained in the Directors’ Report.
The names of the directors considered to be independent are specified in 2.1 above. Directors are able to take independent professional advice at the expense of the company, with the prior agreement of the chairman. The period of office held by each director is specified in the Directors’ Report. An evaluation of the board of directors did take place during the reporting period as described at 2.5 above. New directors are selected by and voted on by the board. The board does not have a formal policy for the nomination and appointment of directors but considers the position on merit on a case by case basis. Any director appointed by the board must retire at the next Annual General Meeting of the company but may submit himself/herself for re-election. Further, each year, a third of directors retire by rotation and are subject to re-election by shareholders at the Annual General Meeting.
A copy of the Remuneration and Nomination Committee charter is not publicly available.

30
Corporate governance statement
Principle 3. Promote ethical and responsible decision-making 3.1 Companies should establish a code of conduct and disclose the code or a summary of the code as to:
• the practices necessary to maintain confidence in the company's integrity; • the practices necessary to take into account their legal obligations and the reasonable
expectations of their stakeholders; and • the responsibility and accountability of individuals for reporting and investigating reports of
unethical practices.
eServGlobal Limited’s policies contain a formal code of ethics that applies to all directors and employees, who are expected to maintain a high standard of conduct and work performance, and observe standards of equity and fairness in dealing with others. The detailed policies and procedures encapsulate the company’s ethical standards.
The code of ethics is available on the company’s website www.eservglobal.com.
3.2 Companies should establish a policy concerning diversity and disclose the policy or a summary of that policy. The policy should include requirements for the board to establish measurable objectives for achieving gender diversity for the board to assess annually both the objectives and the progress in achieving them.
The company has not established a policy concerning diversity.
3.3 Companies should disclose in each annual report the measurable objectives for achieving gender diversity set by the board in accordance with the diversity policy and progress towards achieving them.
The company has not established measurable objectives for achieving gender diversity
3.4 Companies should disclose in each annual report the proportion of women employees in the whole organisation, women in senior executive positions and women on the board.
The proportion of women within the organisation is: 26% Women within whole organisation: 48 Women in senior executive positions: 29% Women on the board: none
3.5 Companies should provide the information indicated in the Guide to reporting on Principle 3.
The company’s business operations are conducted worldwide, and its Code of Ethics has been designed to accommodate the business operations of all the countries in which the company operates. The Code of Ethics complies with Principle 3.1.

eServGlobal Limited Annual Report 2013 31
Corporate governance statement Principle 4. Safeguard integrity in financial reporting 4.1 The board should establish an audit committee. The company has established an Audit Committee.
4.2 The audit committee should be structured so that it:
• consists only of non-executive directors. • consists of a majority of independent directors. • is chaired by an independent chair, who is not chair of the board. • has at least three members. Until 22 March 2013, The Audit Committee comprised David Smart and Stephen Baldwin at which date David Smart retired as a director. On 1 May 2013, John Conoley was appointed to the Audit Committee. All members of the Audit Committee are independent directors. Despite not having at least three members, the board believes that the Audit Committee is of an appropriate size for the company. 4.3 The audit committee should have a formal charter. The company has adopted an Audit Committee charter. 4.4 Companies should provide the information indicated in the Guide to reporting on Principle 4 The names and qualifications of the audit committee members and the number of meetings of the audit committee are contained in the Directors’ Report. The Audit Committee charter is not publicly available on the company’s website. The Audit Committee meets with and receives regular reports from the external auditors concerning any matters that arise in connection with the performance of their role, including the adequacy of internal controls. In conjunction with the auditors, the Audit Committee monitors the term of the external audit engagement partner and ensures that the regulatory limit for such term is not exceeded. At the completion of the term, or earlier in some circumstances, the auditor nominates a replacement engagement partner. The Audit Committee interviews the nominee to assess relevant prior experience, potential conflicts of interest and general suitability for the role. If the nominee is deemed suitable, the Audit Committee reports to the board on its recommendation. Principle 5. Make timely and balanced disclosure 5.1 Companies should establish written policies designed to ensure compliance with ASX listing
rule disclosure requirements and to ensure accountability at a senior executive level for that compliance and disclose those policies or a summary of those policies.
The eServGlobal board, Company Secretary and senior management are aware of the ASX Listing Rules, AIM Rules and Corporations Act disclosure requirements, and take steps to actively monitor and ensure ongoing compliance. At each board meeting, there is a separate agenda item on this topic where directors review the disclosures made by the company over the past month and consider any existing issues that may give rise to further required disclosure. The Chairman and Chief Executive Officer continually monitor developments in the company and its business and in conjunction with the Company Secretary report any developments immediately to the board

32
Corporate governance statement for consideration. All announcements are reviewed by the Company Secretary and/or other external advisers before release to the ASX or AIM.
5.2 Companies should provide the information indicated in the Guide to reporting on Principle 5.
The company’s continuous disclosure policy is described above.
Principle 6. Respect the rights of shareholders 6.1 Companies should design a communications policy for promoting effective communication
with shareholders and encouraging their participation at general meetings and disclose their policy or a summary of that policy.
eServGlobal provides information to its shareholders through the formal communications processes (eg ASX & AIM announcements, annual general meeting, annual report, and shareholder letters). This material is also available on the eServGlobal website (www.eservglobal.com) and on the ASX and AIM websites. Shareholders are encouraged to participate in the AGMs and time is set aside for formal and informal questioning of the board and senior management. The company requests that its external auditor attend the annual general meeting and be available to answer any shareholder questions about the conduct of the audit and the preparation and content of the audit report. 6.2 Companies should provide the information indicated in the Guide to reporting on Principle 6. The company’s communications policy is described in 6.1 above. Principle 7. Recognise and manage risk 7.1 Companies should establish policies for the oversight and management of material business
risks and disclose a summary of those policies. The board monitors the risks and internal controls of eServGlobal in conjunction with the Audit Committee. The Audit Committee looks to the Chief Executive Officer and Chief Financial Officer to ensure that an adequate system is in place to identify and, where possible, appropriately manage and mitigate risks inherent in the business, and to implement appropriate internal controls. Categories of risks managed cover all major aspects of a global technology company. The details are not disclosed as this may disadvantage the company in regard to its competitors. 7.2 The board should require management to design and implement the risk management and
internal control system to manage the Company’s material business risks and report to it on whether those risks are being managed effectively. The board should disclose that management has reported to it as to the effectiveness of the Company’s management of its material business risks.
The board has required management to design and implement the risk management and internal control system to manage the company's material business risks and report to it on whether those risks are being managed effectively. Management has reported to the board as to the effectiveness of the company's management of its material business risks. 7.3 The board should disclose whether it has received assurance from the CEO [or equivalent]
and the Chief Financial Officer (CFO) [or equivalent] that the declaration provided in accordance with section 295A of the Corporations Act is founded on a sound system of risk management and internal control and that the system is operating effectively in all material respects in relation to financial reporting risks.
The board has received assurance from the Chief Executive Officer and the Chief Financial Officer that the declaration provided in accordance with section 295A of the Corporations Act 2001 is founded on a sound system of risk management and internal control and that the system is operating effectively in all material

eServGlobal Limited Annual Report 2013 33
Corporate governance statement respects in relation to financial reporting risks. 7.4 Companies should provide the information indicated in the guide to reporting on Principle 7. The board has received the report from management under recommendation 7.2; the board has received assurance from the Chief Executive Officer and the Chief Financial Officer under recommendation 7.3; the company’s policies on risk oversight and management of material business risks are not publicly available for the reason specified above.
Principle 8. Remunerate fairly and responsibly 8.1 The board should establish a remuneration committee. The Company has established a Remuneration and Nomination Committee. The members of that Committee are Francois Barrault and Stephen Baldwin. 8.2 The remuneration committee should be structured so that it: • Consists of a majority of independent directors • Is chaired by an independent chair • Has at least three members. The committee consists of a majority of independent directors.
The committee is chaired by Francois Barrault and despite not having three members the board believes the size of the committee is appropriate to discharge its mandate.
8.3 Companies should clearly distinguish the structure of non-executive directors' remuneration from that of executive directors and senior executives.
Non-executive directors are paid a fixed directors fee as set out in the Directors’ Report. Senior executives remuneration packages, which consist of base salary, fringe benefits, incentive schemes (including performance related bonuses), superannuation and pension payments and entitlements upon retirement or termination, are reviewed annually with due regard to performance. 8.4 Companies should provide the information indicated in the guide to reporting on Principle 8. The members of the Remuneration and Nomination Committee and its operation are described above. There are no schemes for retirement benefits, other than superannuation, for non-executive directors. Non-executive directors do not receive options or bonus payments. A copy of the Remuneration and Nomination committee charter is not publicly available.

Liability limited by a scheme approved under Professional Standards Legislation.
Member of Deloitte Touche Tohmatsu Limited. 27
Independent Auditor’s Report
to the Members of eServGlobal Limited
Report on the Financial Report
We have audited the accompanying financial report of eServGlobal Limited, which comprises the statement of financial position as at 31 October 2013, the statement of profit or loss and other
comprehensive income, the statement of cash flows and the statement of changes in equity for the year
ended on that date, notes comprising a summary of significant accounting policies and other explanatory information, and the directors’ declaration of the consolidated entity comprising the
company and the entities it controlled at the year’s end or from time to time during the financial year
as set out on pages 29 to 76.
Directors’ Responsibility for the Financial Report
The directors of the company are responsible for the preparation of the financial report that gives a true and fair view in accordance with Australian Accounting Standards and the Corporations Act
2001. The directors are also responsible for such internal control as the directors determine is
necessary to enable the preparation of the financial report that is free from material misstatement,
whether due to fraud or error. In Note 1, the directors also state, in accordance with Accounting Standard AASB 101 Presentation of Financial Statements, that the financial statements comply with
International Financial Reporting Standards.
Auditor’s Responsibility
Our responsibility is to express an opinion on the financial report based on our audit. We conducted our audit in accordance with Australian Auditing Standards. Those standards require that we comply
with relevant ethical requirements relating to audit engagements and plan and perform the audit to
obtain reasonable assurance that the financial report is free from material misstatement.
An audit involves performing procedures to obtain audit evidence about the amounts and disclosures
in the financial report. The procedures selected depend on the auditor’s judgement, including the
assessment of the risks of material misstatement of the financial report, whether due to fraud or error. In making those risk assessments, the auditor considers internal control, relevant to the entity’s
preparation of the financial report that gives a true and fair view, in order to design audit procedures
that are appropriate in the circumstances, but not for the purpose of expressing an opinion on the
effectiveness of the entity’s internal control. An audit also includes evaluating the appropriateness of accounting policies used and the reasonableness of accounting estimates made by the directors, as well
as evaluating the overall presentation of the financial report.
We believe that the audit evidence we have obtained is sufficient and appropriate to provide a basis for
our audit opinion.
Deloitte Touche Tohmatsu
ABN 74 490 121 060
Grosvenor Place
225 George Street
Sydney NSW 2000
PO Box N250 Grosvenor Place
Sydney NSW 1220 Australia
Tel: +61 2 9322 7000
Fax: +61 (0)2 9322 7001
www.deloitte.com.au

28
Auditor’s Independence Declaration
In conducting our audit, we have complied with the independence requirements of the Corporations
Act 2001. We confirm that the independence declaration required by the Corporations Act 2001,
which has been given to the directors of eServGlobal Limited, would be in the same terms if given to
the directors as at the time of this auditor’s report.
Opinion
In our opinion:
(a) the financial report of eServGlobal Limited is in accordance with the Corporations Act 2001,
including:
(i) giving a true and fair view of the consolidated entity’s financial position as at 31 October 2013
and of its performance for the year ended on that date; and
(ii) complying with Australian Accounting Standards and the Corporations Regulations 2001;
(b) the consolidated financial statements also comply with International Financial Reporting
Standards as disclosed in Note 1.
Report on the Remuneration Report
We have audited the Remuneration Report included in pages 11 to 17 of the directors’ report for the
year ended 31 October 2013. The directors of the company are responsible for the preparation and presentation of the Remuneration Report in accordance with section 300A of the Corporations Act
2001. Our responsibility is to express an opinion on the Remuneration Report, based on our audit
conducted in accordance with Australian Auditing Standards.
Opinion
In our opinion the Remuneration Report of eServGlobal Limited for the year ended 31 October 2013, complies with section 300A of the Corporations Act 2001.
DELOITTE TOUCHE TOHMATSU
Michael Kaplan
Partner
Chartered Accountants Sydney, 31 January 2014

36
Directors’ declaration
The directors declare that: (a) in the directors’ opinion, there are reasonable grounds to believe that the company will be able to pay
its debts as and when they become due and payable;
(b) the attached financial statements are in compliance with International Financial Reporting Standards, as stated in Note 1 to the financial statements;
(c) in the director’s opinion, the attached financial statements and notes thereto are in accordance with the Corporations Act 2001, including compliance with accounting standards and giving a true and fair view of the financial position and performance of the consolidated entity; and
(d) the directors have been given the declarations required by section 295A of the Corporations Act 2001. Signed in accordance with a resolution of the directors made pursuant to section 295(5) of the Corporations Act 2001. On behalf of the directors
Richard Mathews Chairman
Brisbane, 31 January 2014

eServGlobal Limited Annual Report 2013 37
Consolidated statement of profit or loss and other comprehensive income for the financial year ended 31 October 2013
Note
Year Ended 31 October
2013 $’000
Year Ended 31 October
2012 $’000
Revenue 2 31,003 28,070 Cost of sales (11,789) (12,267) Gross profit 19,214 15,803 Other income 2 55 389 Foreign exchange gain/(loss) 8,024 (3,387) Research and development expenses (2,717) (2,289) Sales and marketing expenses (4,683) (6,132) Administration expenses (12,614) (13,040) Earnings/(loss) before interest expense, tax, depreciation and amortisation
7,279 (8,656)
Amortisation expense 3 (1,875) (4,704) Depreciation expense 3 (468) (637) Earnings/(loss) before interest expense and tax 4,936 (13,997) Finance costs 3 (441) (1,405) Profit/(loss) before tax 3 4,495 (15,402) Income tax benefit/(expense) 4 5,879 (187) Profit/(loss) for the year 10,374 (15,589) Other comprehensive income/(loss) Items that may be reclassified subsequently to profit or loss:
Exchange differences arising on the translation of foreign operations (nil tax impact)
(4,475) 1,277
Total comprehensive income/(loss) for the year 5,899 (14,312) Profit/(loss) attributable to: Equity holders of the parent 10,248 (15,715) Non-controlling interest 126 126 10,374 (15,589) Total comprehensive income/(loss) attributable to:
Equity holders of the parent 5,784 (14,438) Non-controlling interest 115 126 5,899 (14,312) Earnings/(loss) per share: Basic (cents per share) 22 4.3 (8.0) Diluted (cents per share) 22 4.2 (8.0)
Notes to the financial statements are included on pages 34 to 76

38
Consolidated statement of financial position as at 31 October 2013
Note
31 October 2013 $’000
31 October 2012 $’000
Current Assets Cash and cash equivalents 28(a) 4,909 3,794 Trade and other receivables 9 21,846 14,094 Inventories 11 74 158 Current tax assets 4 4,272 90 31,101 18,136 Assets classified as held for sale 8 7,754 - Total Current Assets 38,855 18,136 Non-Current Assets Property, plant and equipment 12 482 912 Deferred tax assets 4 10,325 6,005 Goodwill 13 3,523 5,878 Other intangible assets 14 - 3,508 Total Non-Current Assets 14,330 16,303 Total Assets 53,185 34,439 Current Liabilities Trade and other payables 15 8,143 7,816 Borrowings 16 3,000 1,200 Current tax payables 4 150 69 Provisions 17 1,800 1,724 Deferred Revenue 18 1,989 2,125 Total Current Liabilities 15,082 12,934 Non-Current Liabilities Borrowings 16 - 6,000 Provisions for employee benefits 17 749 431 Total Non-Current Liabilities 749 6,431 Total Liabilities 15,831 19,365 Net Assets 37,354 15,074
Equity Issued capital 19 106,695 90,770 Reserves 20 (4,090) (82) Accumulated Losses 21 (65,451) (75,699) Parent entity interest 37,154 14,989 Non-controlling interest 200 85 Total Equity 37,354 15,074
Notes to the financial statements are included on pages 34 to 76

eServGlobal Limited Annual Report 2013 39
Consolidated statement of changes in equity for the year ended 31 October 2013
Issued Capital $’000
Foreign Currency
Translation Reserve
$’000
Employee equity-settled
benefits Reserve
$’000
Retained Earnings (Accumu-
lated Losses)
$’000
Attributable to owners of
the parent $’000
Non-controlling
Interest
$’000 Total $’000
Consolidated Balance at 1 November 2012 90,770 (2,099) 2,017 (75,699) 14,989 85 15,074
Profit for the year - - - 10,248 10,248 126 10,374 Other comprehensive income (loss) for the year, net of income tax
Exchange differences arising on translation of foreign operations
- (4,464) - - (4,464) (11) (4,475)
Total comprehensive income (loss) for the year
- (4,464) - 10,248 5,784 115 5,899
Issue of new shares (Note 19) 15,925 - - - 15,925 - 15,925
Equity settled payments - - 456 - 456 - 456
Balance at 31 October 2013 106,695 (6,563) 2,473 (65,451) 37,154 200 37,354
Balance at 1 November 2011 90,770 (3,376) 1,393 (59,984) 28,803 70 28,873
Profit/(Loss) for the year - - - (15,715) (15,715) 126 (15,589)
Other comprehensive income (loss) for the year, net of income tax
Exchange differences arising on translation of foreign operations
- 1,277 - - 1,277 - 1,277
Total comprehensive income (loss) for the year
- 1,277 - (15,715) (14,438) 126 (14,312)
Payment of dividends - - - - - (111) (111)
Equity settled payments - - 624 - 624 - 624
Balance at 31 October 2012 90,770 (2,099) 2,017 (75,699) 14,989 85 15,074
Notes to the financial statements are included on pages 34 to 76

40
Consolidated statement of cash flows for the year ended 31 October 2013
Note
Year Ended 31 October
2013 $’000
Year Ended 31 October
2012 $’000
Cash Flows from Operating Activities Receipts from customers 23,851 30,182 Payments to suppliers and employees (31,058) (42,083) Interest and other finance cost paid (591) (1,536) Net income tax paid (1,088) (7,813) Net cash used in operating activities 28(c) (8,886) (21,250) Cash Flows From Investing Activities Proceeds from asset disposal (escrow deposit) - 23,307 Interest received 11 562 Payment for property, plant and equipment (111) (140) Software development costs (1,839) (1,826) Net cash (used in)/provided by investing activities (1,939) 21,903 Cash Flows From Financing Activities Proceeds from issue of shares 19 16,802 - Payment for share issue costs 19 (877) - Dividend paid by controlled entity to non-controlling interest - (111) Proceeds from borrowings 3,000 2,500 Repayment of borrowings (7,200) (9,300) Net cash provided by/(used in) financing activities 11,725 (6,911) Net Increase/(Decrease) In Cash and Cash Equivalents 900 (6,258) Cash At The Beginning Of The Year 3,794 10,129 Effects of exchange rate changes on the balance of cash held in foreign currencies 215 (77) Cash and Cash Equivalents At The End Of The Year 28(a) 4,909 3,794
Notes to the financial statements are included on pages 34 to 76
eServGlobal Limited Annual Report 2013 41
Notes to the Financial Statements for the financial year ended 31 October 2013
1. SUMMARY OF ACCOUNTING POLICIES Statement of compliance The financial statements are general purpose financial statements which have been prepared in accordance with the Corporations Act 2001, Accounting Standards and Interpretations, and comply with other requirements of the law. The financial statements include the consolidated financial statements of the Group. Accounting Standards include Australian equivalents to International Financial Reporting Standards (‘A-IFRS’). Compliance with A-IFRS ensures that the financial statements and notes of the Group comply with International Financial Reporting Standards (‘IFRS’). The financial statements were authorised for issue by the directors on 31 January 2014. Basis of preparation The financial statements have been prepared on the basis of historical cost. Cost is based on the fair values of the consideration given in exchange for assets. All amounts are presented in Australian dollars, unless otherwise noted. The company is a company of the kind referred to in ASIC Class Order 98/100, dated 10 July 1998, and in accordance with that Class Order amounts in the financial statements are rounded off to the nearest thousand dollars, unless otherwise indicated. The following significant accounting policies have been adopted in the preparation and presentation of the financial statements: (a) Cash and cash equivalents Cash and cash equivalents include cash on hand and in banks, deposits held at call with banks and financial institutions, investments in money market instruments with maturities of three months or less from the date of acquisition, and bank overdrafts. Bank overdrafts are shown within short-term borrowings in current liabilities on the statement of financial position. (b) Employee benefits Provision is made for benefits accruing to employees in respect of wages and salaries, annual leave and long service leave when it is probable that settlement will be required and they are capable of being measured reliably. Provisions made in respect of employee benefits expected to be settled within 12 months, are measured at their nominal values using the remuneration rate expected to apply at the time of settlement. Provisions made in respect of employee benefits which are not expected to be settled within 12 months are measured as the present value of the estimated future cash outflows to be made by the Group in respect of services provided by employees up to reporting date. Defined contribution plans Contributions to defined contribution superannuation plans are expensed when employees have rendered service entitling them to the contributions.

42
Notes to the Financial Statements for the financial year ended 31 October 2013
1. SUMMARY OF ACCOUNTING POLICIES (continued) (c) Financial assets Financial assets are classified into the following specified category: ‘loans and receivables’. The classification depends on the nature and purpose of the financial assets and is determined at the time of initial recognition. Loans and receivables Trade and other receivables that have fixed or determinable payments that are not quoted in an active market are classified as ‘loans and receivables’. Loans and receivables are measured at amortised cost using the effective interest method less impairment. Interest income is recognised by applying the effective interest rate. Appropriate allowances for estimated irrecoverable amounts are recognised in profit or loss when there is objective evidence that the asset is impaired. The allowance recognised is measured as the difference between the asset’s carrying amount and the present value of estimated future cash flows discounted at the effective interest rate computed on initial recognition. Subsequent recoveries of amounts previously written off are credited against the allowance account. Changes in the carrying value of the allowance account are recognised in profit or loss. (d) Financial instruments issued by the Group Debt and equity instruments Debt and equity instruments are classified as either liabilities or as equity in accordance with the substance of the contractual arrangement. An equity instrument is any contract that evidences a residual interest in the assets of an entity after deducting all of its liabilities. Equity instruments issued by the Group are recorded at the proceeds received, net of direct issue costs. Transaction costs on the issue of equity instruments Transaction costs arising on the issue of equity instruments are recognised directly in equity as a reduction of the proceeds of the equity instruments to which the costs relate. Transaction costs are the costs that are incurred directly in connection with the issue of those equity instruments and which would not have been incurred had those instruments not been issued. Other financial liabilities Other financial liabilities, including borrowings, are initially measured at fair value, net of transaction costs and are subsequently measured at amortised cost using the effective interest method, with the interest expense recognised on an effective yield basis. The effective interest method is a method of calculating the amortised cost of a financial liability and of allocating interest expense over the relevant period. The effective interest rate is the rate that exactly discounts estimated future cash payments through the expected life of the financial liability, or, where appropriate, a shorter period. Trade payables Trade payables are initially measured at fair value, and are subsequently measured at amortised cost.

eServGlobal Limited Annual Report 2013 43
Notes to the Financial Statements for the financial year ended 31 October 2013
1. SUMMARY OF ACCOUNTING POLICIES (continued) (e) Foreign currency
Foreign currency transactions All foreign currency transactions arising during the financial year are brought to account using the exchange rate in effect at the date of the transaction. Foreign currency monetary items at reporting date are translated at the exchange rate existing at reporting date. Non-monetary assets and liabilities carried at fair value that are denominated in foreign currencies are translated at the rates prevailing at the date when the fair value was determined. Non-monetary items that are measured at historical cost in a foreign currency are not re-translated. Exchange differences are recognised in profit or loss in the year in which they arise.
Foreign operations All overseas subsidiaries, other than those that are part of the eServGlobal Holdings SAS group, report in their functional currency of AUD, in accordance with the requirements of AASB 121 “The Effects of Changes in Foreign Currency Exchange Rates” and as a consequence all exchange rate translation differences are taken to profit or loss. The eServGlobal Holdings SAS group reports in its functional currency of EUR and on consolidation, the assets and liabilities of the eServGlobal Holdings SAS group are translated at exchange rates prevailing at the reporting date. Income and expense items are translated at the average exchange rates for the year unless exchange rates fluctuate significantly. Exchange differences arising, if any, are recognised in other comprehensive income and accumulated in equity (foreign currency translation reserve). Accumulated exchange differences are recognised in profit or loss on disposal of the foreign operation. Goodwill and fair value adjustments arising on the acquisition of a foreign entity on or after the date of transition to A-IFRS are treated as assets and liabilities of the foreign entity and translated at exchange rates prevailing at the reporting date. (f) Goods and services tax Revenues, expenses and assets are recognised net of the amount of goods and services tax (GST), except:
i. where the amount of GST incurred is not recoverable from the taxation authority, it is recognised as part of the cost of acquisition of an asset or as part of an item of expense; or
ii. for receivables and payables which are recognised inclusive of GST.
The net amount of GST recoverable from, or payable to, the taxation authority is included as part of receivables or payables. Cash flows are included in the statement of cash flows on a gross basis. The GST component of cash flows arising from investing and financing activities which is recoverable from, or payable to, the taxation authority is classified as operating cash flows. (g) Goodwill Goodwill, representing the excess of the cost of acquisition over the fair value of the identifiable assets, liabilities and contingent liabilities acquired, is recognised as an asset and not amortised, but tested for impairment annually and whenever there is an indication that the goodwill may be impaired. Any impairment is recognised immediately in profit or loss and is not subsequently reversed. Refer also to Note 1(h).

44
Notes to the Financial Statements for the financial year ended 31 October 2013
1. SUMMARY OF ACCOUNTING POLICIES (continued) (h) Impairment of assets At each reporting date, the Group reviews the carrying amounts of its tangible and intangible assets to determine whether there is any indication that those assets have suffered an impairment loss. If any such indication exists, the recoverable amount of the asset is estimated in order to determine the extent of the impairment loss (if any). Where the asset does not generate cash flows that are independent from other assets, the Group estimates the recoverable amount of the cash-generating unit to which the asset belongs. For the purpose of impairment testing, goodwill is allocated to the cash-generating units expected to benefit from the synergies of the business combination. Recoverable amount is the higher of fair value less costs to sell and value in use. In assessing value in use, the estimated future cash flows are discounted to their present value using a pre-tax discount rate that reflects current market assessments of the time value of money and the risks specific to the asset for which the estimates of future cash flows have not been adjusted. If the recoverable amount of an asset (or cash-generating unit) is estimated to be less than its carrying amount, the carrying amount of the asset (cash-generating unit) is reduced to its recoverable amount. An impairment loss is recognised in profit or loss immediately. With the exception of goodwill, where an impairment loss subsequently reverses, the carrying amount of the asset (cash-generating unit) is increased to the revised estimate of its recoverable amount, but only to the extent that the increased carrying amount does not exceed the carrying amount that would have been determined had no impairment loss been recognised for the asset (cash-generating unit) in prior years. A reversal of an impairment loss is recognised in profit or loss immediately. (i) Income tax Current tax Current tax is calculated by reference to the amount of income taxes payable or recoverable in respect of the taxable profit or tax loss for the year. It is calculated using tax rates and tax laws that have been enacted or substantively enacted by reporting date. Current tax for current and prior year is recognised as a liability (or asset) to the extent that it is unpaid (or refundable). Deferred tax Deferred tax is accounted for in respect of temporary differences arising from differences between the carrying amount of assets and liabilities in the financial statements and the corresponding tax base of those items. In principle, deferred tax liabilities are recognised for all taxable temporary differences. Deferred tax assets are recognised to the extent that it is probable that sufficient taxable amounts will be available against which deductible temporary differences or unused tax losses and tax offsets can be utilised. However, deferred tax assets and liabilities are not recognised if the temporary differences giving rise to them arise from the initial recognition of assets and liabilities (other than as a result of a business combination) which affects neither taxable income nor accounting profit. Furthermore, a deferred tax liability is not recognised in relation to taxable temporary differences arising from goodwill. Deferred tax assets and liabilities are measured at the tax rates that are expected to apply to the year(s) when the asset and liability giving rise to them are realised or settled, based on tax rates (and tax laws) that have been enacted or substantively enacted by reporting date. The measurement of deferred tax liabilities and assets reflects the tax consequences that would follow from the manner in which the Group expects, at the reporting date, to recover or settle the carrying amount of its assets and liabilities. Deferred tax assets and liabilities are offset when they relate to income taxes levied by the same taxation authority and the Group intends to settle its current tax assets and liabilities on a net basis.

eServGlobal Limited Annual Report 2013 45
Notes to the Financial Statements for the financial year ended 31 October 2013
1. SUMMARY OF ACCOUNTING POLICIES (continued) (i) Income tax (continued) Current and deferred tax for the year Current and deferred tax is recognised as an expense or income in profit or loss, except when it relates to items credited or debited to other comprehensive income or directly to equity, in which case the deferred tax is also recognised in other comprehensive income or directly in equity. Where it arises from the initial accounting for a business combination it is taken into account in the determination of goodwill. (j) Intangible assets All intangible assets acquired in a business combination are identified and recognised separately from goodwill where they satisfy the definition of an intangible asset and their fair value can be measured reliably. Software and Documentation Software and Documentation are recorded initially at fair value and have an estimated useful life. Amortisation is charged on a straight line basis over their useful lives. Customer Relationships Customer Relationships are recorded initially at fair value and have an estimated useful life. Amortisation is charged on a straight line basis over their useful lives. Internally-generated intangible assets – research and development expenditure Expenditure on research activities is recognised as an expense in the period in which it is incurred. Where no internally-generated intangible asset can be recognised, development expenditure is recognised as an expense in the period as incurred. An intangible asset arising from development (or from the development phase of an internal project) is recognised if, and only if, all of the following have been demonstrated:
• the technical feasibility of completing the intangible asset so that it will be available for use or sale;
• the intention to complete the intangible asset and use or sell it; • the ability to use or sell the intangible asset; • how the intangible asset will generate probable future economic benefits; • the availability of adequate technical, financial and other resources to complete the
development and to use or sell the intangible asset; and • the ability to measure reliably the expenditure attributable to the intangible asset during
its development.
The amount initially recognised for internally-generated intangible assets is the sum of the expenditure incurred from the date when the intangible asset first meets the recognition criteria listed above. The expenditure capitalised includes cost of materials, direct labour and a proportion of overheads. Other development expenditure is recognised in profit or loss as an expense as and when incurred. Subsequent to initial recognition, internally-generated intangible assets are reported at cost less accumulated amortisation and accumulated impairment losses, on the same basis as intangible assets acquired separately. (k) Inventories Inventories are valued at the lower of cost and net realisable value. Costs are assigned to inventory on hand by the method most appropriate to each particular class of inventory, with the majority being valued on a first in first out basis. Net realisable value represents the estimated selling price less all estimated costs to be incurred in marketing, selling and distribution.
46
Notes to the Financial Statements for the financial year ended 31 October 2013
1. SUMMARY OF ACCOUNTING POLICIES (continued) (l) Leases Operating lease payments, where substantially all of the risks and benefits remain with the lessor, are recognised as an expense on a straight-line basis over the lease term, except where another systematic basis is more representative of the time pattern in which economic benefits from the leased asset are consumed. Contingent rentals are recognised as an expense in the year in which they are incurred. Lease incentives In the event that lease incentives are received to enter into operating leases, such incentives are recognised as a liability. The aggregate benefits of incentives are recognised as a reduction of rental expense on a straight-line basis. (m) Basis of consolidation The consolidated financial statements incorporate the financial statements of the Company and entities controlled by the Company (its subsidiaries) (referred to as ‘the Group’ in these financial statements). Control is achieved where the Company has the power to govern the financial and operating policies of an entity so as to obtain benefits from its activities. The results of subsidiaries acquired or disposed of during the year are included in consolidated profit or loss from the effective date of acquisition or up to the effective date of disposal, as appropriate. Where necessary, adjustments are made to the financial statements of subsidiaries to bring their accounting policies into line with those used by other members of the Group. All intra-group transactions, balances, income and expenses are eliminated in full on consolidation. Non-controlling interest in the net assets (excluding goodwill) of consolidated subsidiaries are identified separately from the Group’s equity therein. Non-controlling interests consist of the amount of those interests at the date of the original business combination and the non-controlling interest’s share of changes in equity since the date of the combination. Total comprehensive income is attributed to non-controlling interests even if this results in the non-controlling interests having a deficit balance. Acquisitions of subsidiaries and businesses are accounted for using the purchase method. The cost of the business combination is measured as the aggregate of the fair values (at the date of exchange) of the assets given, liabilities incurred or assumed, and equity instruments issued by the group in exchange for control of the acquiree. The acquiree’s identifiable assets, liabilities and contingent liabilities that meet the conditions for recognition under AASB 3 “Business Combinations” are recognised at their fair values at the acquisition date, except for non-current assets (or disposal groups) that are classified as held for sale in accordance with AASB 5 “Non-current Assets Held for Sale and Discontinued Operations”, which are recognised and measured at fair value less costs to sell. Acquisition related costs are recognised in profit or loss as incurred. Goodwill arising on acquisition is recognised as an asset and initially measured at cost, being the excess of the cost of the business combination over the group’s interest in the net fair value of the identifiable assets, liabilities and contingent liabilities recognised. If after reassessment, the group’s interest in the net fair value of the acquiree’s identifiable assets, liabilities and contingent liabilities exceeds the cost of the business combination, the excess is recognised immediately in profit or loss. The interest of minority shareholders in the acquiree is initially measured at the minority’s proportion of the net fair value of the assets, liabilities and contingent liabilities recognised.

eServGlobal Limited Annual Report 2013 47
Notes to the Financial Statements for the financial year ended 31 October 2013
1. SUMMARY OF ACCOUNTING POLICIES (continued) (n) Property, plant and equipment Plant and equipment, office furniture and fittings and leasehold improvements are stated at cost less accumulated depreciation and impairment. Cost includes expenditure that is directly attributable to the acquisition of the item. In the event that settlement of all or part of the purchase consideration is deferred, cost is determined by discounting the amounts payable in the future to their present value as at the date of acquisition. Depreciation is provided on property, plant and equipment. Depreciation is calculated on a straight line basis so as to write off the net cost of each asset over its expected useful life to its estimated residual value. Leasehold improvements are depreciated over the period of the lease or estimated useful life, whichever is the shorter, using the straight line method. The estimated useful lives, residual values and depreciation method are reviewed at the end of each annual reporting period. The following estimated useful lives are used in the calculation of depreciation: Office furniture and fittings 5 years Plant and equipment 3 years Leasehold improvements over the period of the lease (o) Provisions Provisions are recognised when the Group has a present obligation, the future sacrifice of economic benefits is probable, and the amount of the provision can be measured reliably. The amount recognised as a provision is the best estimate of the consideration required to settle the present obligation at reporting date, taking into account the risks and uncertainties surrounding the obligation. Where a provision is measured using the cash flows estimated to settle the present obligation, its carrying amount is the present value of those cash flows. When some or all of the economic benefits required to settle a provision are expected to be recovered from a third party, the receivable is recognised as an asset if it is virtually certain that recovery will be received and the amount of the receivable can be measured reliably. Onerous Contracts An onerous contract is considered to exist where the Group has a contract under which the unavoidable cost of meeting the contractual obligations exceeds the economic benefits expected to be received. Present obligations arising under onerous contracts are recognised as a provision to the extent that the present obligation exceeds the economic benefits expected to be received. (p) Assets held for sale Assets and disposal groups are classified as held for sale if their carrying amount will be recovered principally through a sale transaction rather than through continuing use. This condition is regarded as met only when the asset (or disposal group) is available for immediate sale in its present condition subject only to terms that are usual and customary for sales of such asset (or disposal group) and its sale is highly probable. Management must be committed to the sale, which should be expected to qualify for recognition as a completed sale within one year from the date of classification. Non-current assets (and disposal groups) classified as held for sale are measured at the lower of their previous carrying amount and fair value less costs to sell.

48
Notes to the Financial Statements for the financial year ended 31 October 2013
1. SUMMARY OF ACCOUNTING POLICIES (continued) (q) Revenue recognition Sale of Goods and Licences Revenue from the sale of goods and licences is recognised when the Group has passed control of the goods or other assets to the buyer, except in the case of projects involving significant customisation where revenue is recognised by reference to the stage of completion of the project. Rendering of Services Revenue from services to supply custom designed and developed software or solutions is recognised by reference to the stage of completion of the project. The stage of completion is determined by assessing, at the reporting date, the level of actual services performed as a percentage of total services to be performed in relation to the project. Revenue recognised in advance of the corresponding bill being raised is recorded as ‘work in progress’, whilst bills raised in advance of the services being performed is recorded as ‘deferred income’. Where a loss is expected to occur it is recognised immediately and a provision is made in relation to any future work on the contract. Revenue from Support, Maintenance and Facilities Management Agreements Revenue from support and maintenance contracts is recognised on a straight line basis over the contract period. Work in Progress Work in progress is stated at the aggregate of contract costs incurred to date plus recognised profits less recognised losses and progress billings. If there are contracts where progress billings exceed the aggregate costs incurred plus profits less losses, the net amounts are presented in other liabilities. Contracts costs include all costs directly related to specific contracts and costs that are specifically chargeable to the customers under the terms of the contract. (r) Share-based payments Equity-settled share-based payments are measured at fair value at the date of grant. Fair value is measured by use of either a Black Scholes or binomial model. The expected life used in the model has been adjusted, based on management’s best estimate, for the effects of non-transferability, exercise restrictions, and behavioural considerations. The fair value determined at the grant date of the equity-settled share-based payments is expensed on a straight-line basis over the vesting period, based on the Group’s estimate of shares that will eventually vest. (s) Derivative financial instruments and hedge accounting The Group may use derivative financial instruments (primarily foreign currency forward contracts) to hedge its risks associated with foreign currency fluctuations relating to transactions arising from specific customer orders. Derivatives are initially recognised at fair value at the date a derivative contract is entered into and are subsequently remeasured to their fair value at each reporting date. The resulting gain or loss is recognised in profit or loss immediately unless the derivative is designated and effective as a hedging instrument, in which event, the timing of the recognition in profit or loss depends on the nature of the hedge relationship.

eServGlobal Limited Annual Report 2013 49
Notes to the Financial Statements for the financial year ended 31 October 2013
1. SUMMARY OF ACCOUNTING POLICIES (continued) (s) Derivative financial instruments and hedge accounting (continued) The fair value of all derivative financial instruments outstanding at the reporting date are recognised in the statement of financial position as either financial assets or financial liabilities. Changes in the fair value of derivative financial instruments that are designated and effective as hedges of future cash flows are recognised directly in equity, with any ineffective portion being recognised in profit or loss. Amounts deferred in equity are recycled in profit or loss in the periods when the hedged item is recognised in profit or loss in the same line of the income statement as the recognised hedged item. Changes in the fair value of derivative financial instruments that do not qualify for hedge accounting are recognised in profit or loss as they arise. Derivatives embedded in other financial instruments, or other non financial host contracts, are treated as separate derivatives when their risks and characteristics are not closely related to those of the host contract, and the host contract is not carried at fair value with unrealised gains or losses reported in profit or loss. (t) Critical accounting judgments and key sources of estimation uncertainty The directors evaluate estimates and judgments incorporated into the financial statements based on historical knowledge and best available current information. Estimates assume a reasonable expectation of future events and based on current trends and economic data, obtained both externally and within the Group. The following are the key assumptions concerning the future, and other key sources of estimation uncertainty at the reporting date, that have a significant risk of causing a material adjustment to the carrying amounts of assets and liabilities within the next financial year: Impairment of goodwill The Group assesses impairment at each reporting date by evaluating conditions specific to the Group that may lead to impairment of goodwill. Where an impairment trigger exists, the recoverable amount of the asset is determined. Value-in-use calculations performed in assessing recoverable amounts incorporate a number of key estimates described in Note 13. Revenue recognition Revenue in relation to the supply of custom designed and developed software or solutions is recognised on each project by reference to the stage of completion of the project. The method of calculating the percentage completion of the project involves an element of judgement based on future project costs and profitability of each project. The information used to forecast these costs is based on historical events and current economic data on a customer by customer basis. Unused tax losses The recognition of unused tax losses as a deferred tax asset requires estimation and judgement of the availability of future taxable profits and is subject to compliance with the relevant tax legislations. At the date of this report, the directors have assessed the degree of probability of recovering the remaining unused tax losses. Accordingly, a deferred tax asset has been recognised to the extent that the probability criteria has been met.

50
Notes to the Financial Statements for the financial year ended 31 October
2013
1. SUMMARY OF ACCOUNTING POLICIES (continued) (u) Adoption of new and revised Accounting Standards In the current year, the Group has adopted all of the new and revised Standards and Interpretations issued by the Australian Accounting Standards Board (the AASB) that are relevant to their operations and effective for the current annual reporting period. The adoption of these new and revised Standards and Interpretations has resulted in no changes to the Group’s accounting policies, but has resulted in disclosure changes. Refer below. (u.1) Standards and Interpretations affecting amounts reported in the current year (and/or prior years) The following new and revised Standard and Interpretation has been adopted in the current year and has affected the presentation of amounts reported in these financial statements. Standards affecting presentation and disclosure
Amendments to AASB 101 ‘Presentation of Financial Statements’
AASB 2011-9 ‘Amendments to Australian Accounting Standards – Presentation of Items of Other Comprehensive Income’ introduces new terminology for the statement of comprehensive income and income statement. The amendments to AASB 101 requires items of other comprehensive income to be grouped into two categories in the other comprehensive income section:
(a) items that will not be reclassified subsequently to profit or loss and
(b) items that may be reclassified subsequently to profit or loss when specific conditions are met. Income tax on items of other comprehensive income is required to be allocated on the same basis.
Standards and Interpretations affecting the reported results or financial position There are no new and revised Standards and Interpretations adopted in these financial statements affecting the reporting results or financial position. (u.2) Standards and Interpretations in issue not yet adopted At the date of authorisation of the financial statements, the Standards and Interpretations listed below were in issue but not yet effective. The potential impact of the new or revised Standards and Interpretations has not yet been determined.

eServGlobal Limited Annual Report 2013 51
Notes to the Financial Statements for the financial year ended 31 October 2013
1. SUMMARY OF ACCOUNTING POLICIES (continued) (u.2) Standards and Interpretations in issue not yet adopted (continued)
Standard/Interpretation
Effective for
annual reporting
periods
beginning on or
after
Expected to be
initially applied
in the financial
year ending
• AASB 10 ‘Consolidated Financial Statements’ and AASB 2011-7 ‘Amendments to Australian Accounting Standards arising from the consolidation and Joint Arrangements standards’
1 January 2013 31 October 2014
• AASB 11 ‘Joint Arrangements’ and AASB 2011-7 ‘Amendments to Australian Accounting Standards arising from the consolidation and Joint Arrangements standards’
1 January 2013 31 October 2014
• AASB 12 ‘Disclosure of Interests in Other Entities’ and AASB 2011-7 ‘Amendments to Australian Accounting Standards arising from the consolidation and Joint Arrangements standards’
1 January 2013 31 October 2014
• AASB 13 ‘Fair Value Measurement’ and AASB 2011-8 ‘Amendments to Australian Accounting Standards arising from AASB 13’
1 January 2013 31 October 2014
• AASB 119 ‘Employee Benefits’(2011) and AASB 2011-10 ‘Amendments to Australian Accounting Standards arising from AASB 119 (2011)’
1 January 2013 31 October 2014
• AASB 9 ‘Financial Instruments’, and the relevant amending standards 1 January 2017 31 October 2018
• AASB 2011-4 ‘Amendments to Australian Accounting Standards to Remove Individual Key Management Personnel Disclosure Requirements’
1 July 2013 31 October 2015
• AASB 2012-3 ‘Amendments to Australian Accounting Standards – Disclosures – Offsetting Financial Assets and Financial Liabilities’
1 January 2014 31 October 2015
• AASB 2013-3 ‘Amendments to AASB 136 - Recoverable Amount Disclosures for Non-Financial Assets’
1 January 2014 31 October 2015
• AASB 2013-5 ‘Amendments to Australian Accounting Standards – ‘Investment Entities’
1 January 2014 31 October 2015
• Interpretation 21 ‘Levies’ 1 January 2014 31 October 2015

52
Notes to the Financial Statements for the financial year ended 31 October
2013
Consolidated Year Ended
31 October 2013 $’000
Year Ended 31 October
2012 $’000
2. REVENUE a) Revenue from continuing operations
consisted of the following items: Revenue from the sale of goods 12,681 9,813 Revenue from the rendering of services 18,322 18,257 Total Revenue from continuing operations 31,003 28,070 b) Other Income Interest revenue 55 389 3. PROFIT/ (LOSS) BEFORE TAX Consolidated
Year Ended
31 October
2013 $’000
Year Ended
31 October
2012 $’000
Profit/(loss) before tax has been arrived at after charging (crediting) the following:
Net foreign exchange (gain)/ loss (8,024) 3,387 Finance costs: Interest – bank borrowings 85 47 Interest – other entities 356 1,358 Total finance costs 441 1,405 Depreciation of non-current assets: Office furniture and fittings 36 40 Leasehold improvements - 3 Plant and equipment 432 594 Total depreciation of non-current assets 468 637 Amortisation of intangible assets: Software development costs 1,875 4,704 Operating lease rental expenses: Minimum lease payments 1,661 2,063 Net (profit)/loss on disposal of non-current assets Plant and equipment (10) 123 (Write back)/ impairment recognised on trade receivables
(Note 9) 2 (200)
Employee benefit expense: Contributions to defined contribution plans 14 26 Other employee benefits 15,973 23,546 Equity settled share-based payments 456 624 Total employee benefits expense 16,443 24,196

eServGlobal Limited Annual Report 2013 53
Notes to the Financial Statements for the financial year ended 31 October 2013
4. INCOME TAXES Year
Ended 31
October 2013 $’000
Year Ended
31 October
2012 $’000
(a) Income tax recognised in profit/(loss) Tax (benefit)/expense comprises: Current tax (benefit)/expense (1,611) 1,753 Adjustments recognised in the current year in relation
to the current tax of prior years 52 (130) Deferred tax (income)/expense relating to the
origination and reversal of temporary differences (4,320) (1,436)
Total tax (benefit)/expense (5,879) 187 The prima facie income tax expense on pre-tax
accounting profit/(loss) from operations reconciles to the income tax (benefit)/expense in the financial statements as follows:
Profit/(loss) from operations 4,495 (15,402) Income tax expense/ (benefit) calculated at 30% 1,349 (4,621) Non-deductible expenses 196 591 Foreign withholding tax credits not utilised 635 943 Deferred tax assets not recognised 1,859 3,698 Non-assessable income (3,187) (217) Recognition of previously unrecognised deferred tax
asset in respect of available tax losses (6,788) -
Effect of different tax rate in foreign operations 5 (77) Under/(over) provision of income tax in previous year 52 (130) (5,879) 187 The tax rate used in the above reconciliation is the corporate tax rate of 30% payable by Australian corporate entities on taxable profits under Australian tax law. There has been no change in the corporate tax rate when compared with the previous reporting period. No income tax was recognised directly in equity or in other comprehensive income during the financial year. Consolidated
31 October
2013 $’000
31 October
2012 $’000
(b) Current tax assets and liabilities Current tax assets: Tax refund receivable (i) 4,272 90 Current tax payables: Income tax payable 150 69
(i) The tax refund mainly relates to research & development tax credits which are eligible as a tax refund claim from the taxation authorities in the 2014 financial year.

54
Notes to the Financial Statements for the financial year ended 31 October 2013
4. INCOME TAXES (continued) Deferred tax balances Deferred tax assets and liabilities arise from the following:
2013
Consolidated Opening balance
Reclassified
Credited to income
Closing balance
$’000 $’000 $’000 $’000
Deferred tax liabilities: Exchange difference on foreign subsidiary - - - - Intangible assets - - - - - - - - Deferred tax assets: Tax losses – revenue 1,020 - 6,807 7,827 Research & development tax credits 4,483 - (2,676) 1,807 Foreign tax credits 113 - 189 302 Doubtful debts 319 - - 319 Accrued costs 35 - - 35 Other 35 - - 35 6,005 - 4,320 10,325
2012
Consolidated Opening balance
Reclassified
Credited to income
Closing balance
$’000 $’000 $’000 $’000
Deferred tax liabilities: Exchange difference on foreign subsidiary (15) - 15 - Intangible assets 805 - (805) - 790 - (790) - Deferred tax assets: Tax losses – revenue 866 - 154 1,020 Research & development tax credits 3,913 - 570 4,483 Foreign tax credits 124 - (11) 113 Doubtful debts 319 - - 319 Accrued costs 103 - (68) 35 Other 34 - 1 35 5,359 - 646 6,005 The deferred tax asset recognised in respect of taxation losses in the current financial year relates predominantly to taxable gains expected to be derived in the 2014 financial year as a result of the HomeSend transaction disclosed in Note 31. The benefit of tax losses which have not been recognised as a deferred tax asset due to non-satisfaction of the reasonable probability of the recoupment criteria totalled $20.4m at year end (2012: $23.9m).

eServGlobal Limited Annual Report 2013 55
Notes to the Financial Statements for the financial year ended 31 October 2013
4. INCOME TAXES (continued) Tax consolidation Relevance of tax consolidation to the consolidated entity The company and its wholly-owned Australian resident entities have formed a tax-consolidated group and are therefore taxed as a single entity. The head entity within the tax-consolidated group is eServGlobal Limited. The members of the tax-consolidated group are identified at Note 25. Nature of tax funding arrangements and tax sharing agreements Entities within the tax-consolidated group have entered into a tax funding arrangement and a tax-sharing agreement with the head entity. Under the terms of the tax funding arrangement, eServGlobal Limited and each of the entities in the tax-consolidated group has agreed to pay a tax equivalent payment to or from the head entity, based on the current tax liability or current tax asset of the entity. Such amounts are reflected in amounts receivable from or payable to other entities in the tax-consolidated group. The tax sharing agreement entered into between members of the tax-consolidated group provides for the determination of the allocation of income tax liabilities between the entities should the head entity default on its tax payment obligations. No amounts have been recognized in the financial statements in respect of this agreement as payment of any amounts under the tax sharing agreement is considered remote. 5. KEY MANAGEMENT PERSONNEL COMPENSATION Key management personnel compensation policy The Remuneration and Nominations Committee reviews the remuneration packages of all key management on an annual basis and makes recommendations to the Board. The Boards approach on Remuneration Policies is set out in the Remuneration Report which forms part of the Directors’ Report. The aggregate compensation made to key management personnel of the Group is set out as follows:
Consolidated Year
Ended 31 October
2013 $
Year Ended
31 October 2012
$ Short-term employee benefits 2,296,326 2,587,004 Post-employment benefits 60,392 69,451 Termination benefits 278,333 - Share-based payments 242,948 309,302 2,877,999 2,965,757

56
Notes to the Financial Statements for the financial year ended 31 October 2013
6. EXECUTIVE AND EMPLOYEE SHARE OPTIONS The Group has an ownership-based remuneration scheme for directors, key management personnel and employees of the Group. In accordance with the provisions of the scheme, directors and employees may be granted options to acquire ordinary shares in the company. The board believes that the options scheme has a significant role to play in motivating employees to help ensure the continued performance of the Group. The vesting of any share options is not dependent on any performance criteria, however, is dependent on a period of service relative to the vesting dates. During the financial year, the company issued 2,400,000 options (2012: 10,200,000). Under the eServGlobal Employee Share Option Plan, established 4 August 2000 to assist in the attraction, retention and motivation of employees and Directors of the company and its related bodies corporate, at 31 October 2013, key management personnel and employees are entitled to purchase an aggregate of 9,100,000 (2012: 9,200,000) ordinary shares of the entity at an exercise price of $0.36 (2012: $0.36) per ordinary share. At 31 October 2013, nil (31 October 2012: nil) of these options had vested. The options may be exercised at various times up until 01 Jun 2018. The holders of such options do not have the right, by virtue of the option to participate in any share issue or interest issue of any other body corporate or scheme, and do not participate in any dividends declared. The following share-based payment arrangements were in existence during the year:
Option Series
Number Grant Date
Expiry Date
Exercise Price $
Fair value at grant
date Issued 27 April 2012 (i) (iii) 1,500,000 27-Apr-12 2017 $0.36000 $0.13 Issued 14 May 2012 (i) (iv) 7,700,000 14-May-12 2017 $0.36000 $0.11 Issued 11 Feb 2013 (v) 1,600,000 11-Feb-13 2017 $0.36000 $0.26 Issued 01 Jul 2013 (ii) 800,000 01-Jul-13 2018 $0.36000 $0.24 In accordance with the terms of the Employee Share Option Plan: (i) Options issued in these series vest fully on the second anniversary date from the date of issue and expire five years from the
date of issue. (ii) Options issued in this series vest as to one half on 10 June 2014 and the balance on 10 June 2015 and expire on 10 June
2018. (iii) During the year the options issued in this series lapsed in its entirety. (iv) During the year 1,000,000 options issued in this series lapsed. (v) Options issued in these series vest fully on 21 December 2014 and expire on 21 December 2017.
In accordance with the terms of the Employee Share Option Plan, options may be exercised at any time from the date on which they vest to the date of their expiry.

eServGlobal Limited Annual Report 2013 57
Notes to the Financial Statements for the financial year ended 31 October 2013
6. EXECUTIVE AND EMPLOYEE SHARE OPTIONS (continued) The fair value of the options were derived by an appropriately qualified expert using the binomial pricing model. Where relevant, the expected life used in the model has been adjusted based on a best estimate for the effects of non-transferability, exercise restrictions and behavioural considerations. Expected volatility is based on the historical share price volatility over the past 5 years. The risk-free rate is sourced from the Reserve Bank of Australia. Inputs into the models for the series of options:
Issue Date
Share price at
grant date
Risk free rate of return to expiry (p.a.)
Years to expiration/exercise
Dividend yield (p.a.) Volatility
Sub optimal early exercise
factor 27-Apr-12 0.30 3.23% 5 0.0% 52.50% none assumed
14-May-12 0.25 2.82% 5 0.0% 52.50% none assumed 11-Feb-13 0.45 2.91% 4.86 0.0% 65.00% none assumed 01-Jul-13 0.38 3.19% 4.94 0.0% 65.00% none assumed
The following reconciles the outstanding share options granted under the executive share option plan at the beginning and the end of the financial year:
31 October 2013 31 October 2012
Number of
Options
Weighted average exercise
price $
Number of Options
Weighted average exercise
price $
Balance at the beginning of the year 9,200,000 0.360 7,710,000 0.656 Granted during the year 2,400,000 0.360 10,200,000 0.360 Expired/ lapsed/ cancelled during the year (2,500,000) 0.360 (8,710,000) 0.622 Balance at the end of the year 9,100,000 0.360 9,200,000 0.360 Exercisable at the end of the financial year - - - -
Exercised during the financial year No options were exercised during the financial year, nor during the previous financial period. Balance at the end of the financial year The share options outstanding at the end of the financial year are as follows:
Issued No
Vested Unvested Expiry Exercise Contractual No. No. Date Price Life
$ (days) Issued 14 May 2012 6,700,000 - 6,700,000 2017 $0.36 1,290 Issued 11 February 2013 1,600,000 - 1,600,000 2017 $0.36 1,511 Issued 01 July 2013 800,000 - 800,000 2018 $0.36 1,682 9,100,000 - 9,100,000

58
Notes to the Financial Statements for the financial year ended 31 October 2013
Consolidated Year Ended
31 October 2013
$
Year Ended 31 October
2012 $
7. REMUNERATION OF AUDITORS Auditor of the Parent Entity Auditing or review of the financial report 113,000 135,000 113,000 135,000 Other Auditors Auditing or review of the financial report 139,062 121,883 Other services – Taxation 44,961 20,806 184,023 142,689 297,023 277,689
The auditor of eServGlobal Limited is Deloitte Touche Tohmatsu in Australia and the Other Auditors are all affiliated firms of Deloitte Touche Tohmatsu. Fees paid to other auditors are charged in respective foreign currencies and are subject to exchange rate fluctuations.
8. ASSETS CLASSIFIED AS HELD FOR SALE On 19th December 2013 the company concluded an agreement to create a new joint
venture with MasterCard and BICS (eServGlobal’s current partner in HomeSend) for the international mobile money transfer service, HomeSend. Under the terms of the agreement, eServGlobal will contribute its Homesend business, including staff, that are directly related to the business into a newly formed company (“NewCo”). The major classes of HomeSend business assets at the end of the reporting period that will be derecognised by the Group are as follows:
31 October 2013 $’000
31 October 2012 $’000
Goodwill 3,550 - Other intangible assets (capitalised R&D expenditure) 4,204 - HomeSend assets classified as held for sale 7,754 - No impairment loss was recognised on reclassification of the above assets as held for
sale at 31 October 2013.

eServGlobal Limited Annual Report 2013 59
Notes to the Financial Statements for the financial year ended 31 October 2013
31 October
2013 $’000
31 October 2012 $’000
9. CURRENT TRADE AND OTHER RECEIVABLES
Trade receivables (i) 8,943 9,683 Less : Allowance for doubtful debts (894) (892) 8,049 8,791 Prepayments 1,223 956 Goods and services tax receivable 851 461 Work in progress (Note 10) 10,400 3,602 Deposits and accrued interest 1,323 284 21,846 14,094
(i) The average credit period on sales of goods and rendering of services is 60 days (2012: 60 days). Historically, the Group has had no requirement to charge interest on overdue receivables, although customer contractual terms include the ability to do this. The group recognises an allowance for debts whose collectability is considered doubtful. Objective evidence is determined by reference to knowledge of disputes at balance date, where applicable. The Group also considers any change in the credit quality of the trade receivable from the date credit was initially granted up to the reporting date.
Before accepting any new customers, the Group obtains, where considered necessary, third party references to assess the potential customer’s credit worthiness. The majority of the Group’s outstanding trade receivables consist of large Telecommunication companies and are considered high quality creditworthy customers.
Included in the Group’s trade receivable balance are debtors with a carrying amount of $5.7 million (2012: $2.6 million) which are past due at the reporting date for which the Group has not provided an allowance for doubtful debts as there has not been a significant change in credit quality and the amounts are still considered recoverable. The Group does not hold any collateral over these balances. The average days overdue for these receivables is 103 days (2012: 108 days).
Consolidated 31 October
2013 $’000
31 October 2012 $’000
Ageing of past due but not impaired By up to 30 days 1,129 640 30 - 90 days 577 410 90 - 120 days 2,456 371 120 + days 1,552 1,129 5,714 2,550 Movement in allowance for doubtful debts Balance at the beginning of the year 892 1,092 Impairment (reduction)/losses recognised on receivables 2 (200) Balance at the end of the year 894 892 The ageing of all impaired receivables is 120+ days (2012: 120+ days)

60
Notes to the Financial Statements for the financial year ended 31 October
2013
10. WORK IN PROGRESS
31 October 2013 $’000
31 October 2012 $’000
Contract work in progress 17,808 17,750 Progress billings and advances received (9,397) (16,273) 8,411 1,477
Recognised and included in the financial statements as amounts due:
From customers: Current (Note 9) 10,400 3,602 To customers as deferred income: Current (Note 18) (1,989) (2,125) 8,411 1,477
31 October
2013 $’000
31 October 2012 $’000
11. CURRENT INVENTORIES Finished goods 74 158

eServGlobal Limited Annual Report 2013 61
Notes to the Financial Statements for the financial year ended 31 October 2013
12. PROPERTY, PLANT AND EQUIPMENT
Consolidated Office
furniture and
fittings Leasehold
improvements Plant and equipment Total
$’000 $’000 $’000 $’000 Gross carrying amount – at cost Balance at 31 October 2011 648 11 8,267 8,926 Additions 4 - 136 140 Disposals (72) (11) (3,059) (3,142) Net foreign currency movement (53) - (684) (737) Balance at 31 October 2012 527 - 4,660 5,187 Additions 3 - 108 111 Disposals (54) - (778) (832) Net foreign currency movement 84 - 730 814 Balance at 31 October 2013 560 - 4,720 5,280
Accumulated depreciation Balance at 31 October 2011 576 8 6,801 7,385 Depreciation expense 40 3 594 637 Disposal (72) (11) (2,936) (3,019) Net foreign currency movement (55) - (673) (728) Balance at 31 October 2012 489 - 3,786 4,275 Depreciation expense 36 - 432 468 Disposal (58) - (784) (842) Net foreign currency movement 86 - 811 897 Balance at 31 October 2013 553 - 4,245 4,798 Net book value As at 31 October 2012 38 - 874 912 As at 31 October 2013 7 - 475 482

62
Notes to the Financial Statements for the financial year ended 31 October 2013
Consolidated 31 October
2013 $’000
31 October 2012 $’000
13. GOODWILL Gross carrying amount and net book value Balance at the beginning of the financial year 14,328 15,391 Reclassified as “held for sale” (3,550) -
Translation effects of foreign currency exchange movements 2,519 (1,063)
Balance at end of financial year 13,297 14,328 Accumulated impairment losses Balance at the beginning of the financial year (8,450) (9,009)
Translation effects of foreign currency exchange movements (1,324) 559
Balance at end of financial year (9,774) (8,450) Net book value At the beginning of the financial year 5,878 6,382 At the end of the financial year 3,523 5,878
During the financial year, the Group assessed the recoverable amount of goodwill based on the methodology below, and determined that no impairment was required (2012: $ nil). No write-down of the carrying amounts of other assets in the cash-generating unit was necessary.
Allocation of goodwill to cash-generating units
Goodwill has been allocated for impairment testing purposes to a single cash generating unit, being the entire business, at which level goodwill is monitored for internal management purposes. This is because substantially the entire product list of the combined entity is available for sale to, and being sold to, substantially the entire customer base of the combined entity.
The recoverable amount of the cash-generating unit is determined based on a value-in-use calculation which uses cash flow projections based on financial budgets approved by management covering a 5 year forecast period, and a terminal value based upon an extrapolation of cash flows beyond the 5 year period using an estimated growth rate of 3% per annum which does not exceed the average long term growth rate for the global industry in which it operates.
The key assumptions used in the value-in-use calculation for the cash generating unit are as follows:
• Sales are expected to grow over the forecast period by 10% per annum consistent with the actual growth rate achieved in the current year.
• A gross margin of 60% over the forecast period: this is based upon average gross margins achieved in recent periods.
• In performing the value-in-use calculations, the company has applied post-tax discount rates to discount the forecast future attributable post tax cash flows. The equivalent pre-tax discount rate is 23% per annum.
• Operating expenses are expected to increase steadily over the forecast period, but at a rate lower than the sales growth.
The directors believe that any reasonable possible change in the key assumptions on which recoverable amount is based would not cause the aggregate carrying amount to exceed the aggregate recoverable amount of the cash-generating unit.

eServGlobal Limited Annual Report 2013 63
Notes to the Financial Statements for the financial year ended 31 October 2013
14. INTANGIBLES Consolidated
Software & documentation
acquired $’000
Customer relationships
acquired $’000
Software
development $’000
Total $’000
Gross carrying amount Balance at 31 October 2011 17,545 20,897 6,799 45,241
Internally developed - - 1,826 1,826 Effects of foreign currency exchange movements - (164) (283) (447) Balance at 31 October 2012 17,545 20,733 8,342 46,620
Internally developed - - 1,840 1,840
Reclassified as held for sale - - (10,922) (10,922) Effects of foreign currency exchange movements - - 740 740
Balance at 31 October 2013 17,545 20,733 - 38,278 Accumulated Amortisation and impairment
Balance at 31 October 2011 (17,545) (18,267) (2,621) (38,433) Amortisation expense - (2,479) (2,225) (4,704) Effects of foreign currency exchange movements - 13 12 25 Balance at 31 October 2012 (17,545) (20,733) (4,834) (43,112) Amortisation expense - - (1,875) (1,875) Reclassified as held for sale - - 6,718 6,718 Effects of foreign currency exchange movements - - (9) (9) Balance at 31 October 2013 (17,545) (20,733) - (38,278) Net Book Value As at 31 October 2012 - - 3,508 3,508 As at 31 October 2013 - - - - Significant intangible assets Software development costs of $10.922 million are amortised over three years, They relate to HomeSend and have been reclassified as held for sale at year end (see Note 8).

64
Notes to the Financial Statements for the financial year ended 31 October
2013
Consolidated 31
October 2013 $’000
31 October
2012 $’000
15. TRADE AND OTHER PAYABLES Trade payables (i) 2,019 1,359 Accruals and other payables 6,124 6,457 8,143 7,816
(i) The average credit period on purchases of goods is 45 days (2012: 45 days). No
interest is charged on overdue payables. The Group has financial risk management policies in place to ensure that all payables are paid within the credit timeframe.
31
October 2013 $’000
31 October
2012 $’000
16. BORROWINGS Secured Loans 3,000 7,200
Current (i) (ii) 3,000 1,200 Non-current (ii) - 6,000 3,000 7,200
(i) Current borrowings at 31 October 2013 represent a $3 million loan from National Australia Bank which was drawn down in full in June 2013. It is secured by way of a fixed and floating charge over the total assets of the Group (refer to the statement of financial position). Interest is charged at the weighted average of the interest rates applicable to each of the business markets facility components (average rate in 2013: 7.6%). The loan facility is due for repayment on 30 April 2014.
(ii) The $7.2 million loans outstanding at the end of the prior year were repaid in full in February 2013. These loans were secured by a fixed and floating charge over the total assets of the group and were subject to interest at a rate of 9.75% per annum.

eServGlobal Limited Annual Report 2013 65
Notes to the Financial Statements for the financial year ended 31 October 2013
17. PROVISIONS
Employee provisions
Retirement contribution
plans (i) Total $'000 $'000 $'000
Consolidated Balance as at 31 October 2012 1,724 431 2,155 Additional provisions recognised 114 318 432 Utilised during the year (38) - (38) Balance as at 31 October 2013 1,800 749 2,549 Current 1,800 - 1,800 Non-current - 749 749 1,800 749 2,549
(i) The retirement contribution plan is the statutory termination payment due to eligible employees in France.
Consolidated 31
October 2013 $’000
31 October
2012 $’000
18. OTHER CURRENT LIABILITIES Deferred income (Note 10) 1,989 2,125

66
Notes to the Financial Statements for the financial year ended 31 October
2013
19. ISSUED CAPITAL
31
October 2013 $’000
31
October 2012 $’000
249,045,997 fully paid ordinary shares (2012: 196,847,706)
106,695
90,770
31 October 2013 31 October 2012
No. ‘000
$ ‘000
No. ‘000
$ ‘000
Fully Paid Ordinary Shares Balance at the beginning of financial year 196,848 90,770 196,848 90,770 Shares issued in the year 52,198 16,802 - - Costs of share issue - (877) - - Balance at the end of financial year 249,046 106,695 196,848 90,770
Fully paid ordinary shares carry one vote per share and carry the right to dividends.
Changes to the then Corporations Law abolished the authorised capital and par value concept in relation to share capital from 1 July 1998. Therefore, the company does not have a limited amount of authorised capital and issued shares do not have a par value.
Share Options
In accordance with the terms of the executive and employee share option plan as at 31 October 2013, employees are entitled to exercise options granted and thus acquire shares in the company. Details of the executive and employee share option plan are contained in Note 6 to the financial statements.
Subsequent to the 31 October 2013 year end, on 23 December 2013 eServGlobal announced that it had entered into a subscription agreement with an existing Australian institutional investor for the Company to issue 4,500,000 fully paid ordinary shares at AUD$0.75 (£0.41) per share, raising AUD$3.375M (£1.843M). No fees were payable on the placement. The 4,500,000 fully paid ordinary shares were issued on 30 December 2013 (being represented by depositary interests in CREST) and admitted to AIM on 30 December 2013. Following the issue, the Company's total issued share capital is 253,545,997 fully paid ordinary shares of no par value.

eServGlobal Limited Annual Report 2013 67
Notes to the Financial Statements for the financial year ended 31 October 2013
Consolidated
31 October
2013 $’000
31
October 2012 $’000
20. RESERVES Foreign currency translation (6,563) (2,099) Employee equity-settled benefits 2,473 2,017 (4,090) (82) Foreign currency translation reserve Balance at beginning of financial year (2,099) (3,376) Translation of foreign operations (4,464) 1,277 Balance at the end of the financial year (6,563) (2,099)
Exchange differences relating to the translation from Euros, being the functional currency of the eServGlobal SAS and its controlled entities, into Australian dollars are recognised directly in other comprehensive income and accumulated in the foreign currency translation reserve.
Employee equity-settled benefits reserve Balance at beginning of financial year 2,017 1,393 Share based payments 456 624 Balance at the end of the financial year 2,473 2,017
The employee equity-settled benefits reserve arises on the grant of share options to key management personnel and employees under the executive and employee share option plan. Amounts are transferred out of the reserve and into issued capital when options are exercised. Further information about share-based payments to key management personnel and employees is contained in Note 6 to the financial statements.
21. ACCUMULATED LOSSES 31
October 2013 $’000
31 October
2012 $’000
Balance at beginning of the financial year (75,699) (59,984)
Profit/(loss) for the year attributable to equity holders of the parent 10,248 (15,715)
Balance at end of financial year (65,451) (75,699)

68
Notes to the Financial Statements for the financial year ended 31 October 2013
Consolidated Year Ended
31 October 2013
Cents Per Share
Year Ended 31 October
2012 Cents Per
Share
22. EARNINGS/(LOSS) PER SHARE Basic earnings/(loss) per share 4.3 (8.0) Diluted earnings/(loss) per share 4.2 (8.0) Basic earnings/(loss per share
The earnings/(loss) and weighted average number of ordinary shares used in the calculation of basic earnings/(loss) per share are as follows:
Year Ended 31 October
2013 $’000
Year Ended 31 October
2012 $’000
Earnings – being the profit/(loss) for the year attributable to equity holders of the parent 10,248 (15,715)
31 October
2013 No ‘000
31 October
2012 No ‘000
Weighted average number of ordinary shares 241,072 196,848 Diluted earnings/(loss) per share
The earnings/(loss) and weighted average number of ordinary and potential ordinary shares used in the calculation of diluted loss per share are as follows:
Year Ended 31 October
2013 $’000
Year Ended 31 October
2012 $’000
Earnings – being the profit/(loss) for the year attributable to equity holders of the parent 10,248 (15,715)
31 October
2013 No ‘000
31 October
2012 No ’000
Weighted average number of ordinary shares and potential ordinary shares (a) 242,124 196,848
(a) Weighted average numbers of ordinary shares and potential ordinary shares used in the calculation of diluted earnings(loss) per share reconciles to the weighted average number of ordinary shares used in the calculation of basic earnings/(loss) per share as follows:
Weighted average number of ordinary shares used in the calculation of basic earnings/(loss) per share
241,072 196,848
Shares deemed to be issued for no consideration in respect of employee options 1,052 -
Weighted average number of ordinary shares and potential ordinary shares used in the calculation of diluted earnings/(loss) per share
242,124 196,848

eServGlobal Limited Annual Report 2013 69
Notes to the Financial Statements for the financial year ended 31 October 2013
Consolidated 31 October 2013 31 October 2012 Cents
Per Share Total $‘000
Cents Per Share
Total $‘000
23. DIVIDENDS Fully Paid Ordinary Shares partly franked - - - -
In respect of the current financial year no dividend has been declared.
24. LEASES Operating Leases
Leasing arrangements Operating leases relate to office facilities with lease terms of up to five years. The Group does not have an option to purchase the leased asset at the expiry of the lease period.
Consolidated Year
Ended 31
October 2013 $’000
Period Ended
31 October
2012 $’000
Non-cancellable operating leases No longer than 1 year 1,711 1,512 Longer than 1 year and not longer than 5 years 1,141 2,425 Longer than 5 years - - 2,852 3,937

70
Notes to the Financial Statements for the financial year ended 31 October 2013
Ownership Interest
COUNTRY OF INCORPORATION
31 October
2013 %
31 October 2012
%
25. SUBSIDIARIES Parent Entity eServGlobal Limited Australia (vi) (vii) Subsidiary eServGlobal Holdings SAS France (i) 100 100 eServGlobal SAS France (i) (iii)(viii) 100 100 PT eServGlobal Indonesia Indonesia (i) (ix) 100 100 eServGlobal Telecom Romania Srl Romania (i)(ix)(viii) 50 50 eServGlobal Telecom Serviços do Brasil
Ltda Brazil (i) (ix) 100 100 eServGlobal (NZ) Pty Limited Australia (ii) (v) (vi) 100 100 eServGlobal (HK) Limited Hong Kong (i) (iv) 100 100 eServGlobal NVSA Belgium (i) 100 100 eServGlobal UK Limited United Kingdom (x) 100 100 eServ UK Limited United Kingdom(iv) 100 100 eServGlobal Singapore Pte. Ltd. Singapore (i) 100 100
eServGlobal Inc United States of America (iv) 100 100
eServGlobal Aust Pty Limited Australia (iv) (v) (vi) 100 100 (i) These subsidiaries carry on business in their country of incorporation; France,
Indonesia, Romania, Brazil, Hong Kong, Belgium and Singapore. (ii) eServGlobal (NZ) Pty Ltd carries on business in Australia and has a branch
which carries on business in New Zealand.
(iii) eServGlobal SAS carries on business in France and has branches or
representative office which carry on business in Egypt, Poland, India and the United Arab Emirates.
(iv) These subsidiaries did not trade in the year ended 31 October 2013.
(v) These subsidiaries are classified as small proprietary companies and, in
accordance with the Corporations Act 2001, are relieved from the requirement to prepare, audit and lodge a financial report.
(vi) These companies are members of the Australian tax consolidated group. (vii) eServGlobal Limited is the head entity within the tax consolidated group.
(viii) This company is a subsidiary of eServGlobal Holdings SAS. Management
have determined that the group has the power to govern the financial and operating policies of eServ Global Telecom Romania Srl.
(ix) These companies are subsidiaries of eServGlobal SAS. (x) eServGlobal UK Limited carries on business in the United Kingdom and has a
branch which carries on business in the Netherlands.

eServGlobal Limited Annual Report 2013 71
Notes to the Financial Statements for the financial year ended 31 October 2013
26. SEGMENT INFORMATION The Group operates in a single segment being the provision of telecommunications software solutions to mobile and financial service providers on a global basis. Information reported to the chief operating decision maker (Board of directors) for the purposes of resource allocation and assessment of segment performance focuses on the telecommunication software solution business as a single business unit. The results and financial position of this single segment are shown in the statement of profit or loss and other comprehensive income and the statement of financial position respectively. Revenue from major products and services The following is an analysis of the Group’s revenue from continuing operations from its major products and services.
Year Ended
31 October 2013 $’000
Year Ended 31 October
2012 $’000
Hardware 1,992 613 Licences 10,689 9,200 Services 3,754 3,378 Support 12,534 12,148 Software as a Service 2,034 2,731 Total revenue from continuing operations 31,003 28,070 Geographical information The Group’s revenue from continuing operations from external customers by location of operations and information about it’s non-current assets by location of assets are detailed below. Revenue from
external customers Non-current assets
Year Ended 31 October
2013 $’000
Year Ended 31 October
2012 $’000
Year Ended 31 October
2013 $’000
Year Ended 31 October
2012 $’000
Middle East 11,583 7,863 - - Asia Pacific 6,519 3,783 21 19 Europe 3,077 3,706 3,973 10,266 Africa 9,228 12,120 11 13 Central and South America 596 598 - - Total 31,003 28,070 4,005 10,298 Non-current assets exclude non-current assets held for sale and deferred tax assets. Information about major customers No single customers contributed 10% or more to the Group’s revenue for both 2013 and 2012.

72
Notes to the Financial Statements for the financial year ended 31 October
2013
27. RELATED PARTY DISCLOSURES a) Equity Interests in Related Parties Equity Interests in Controlled Entities
Details of the percentage of ordinary shares held in subsidiaries are disclosed in Note 25 to the financial statements.
b) Key management personnel compensation Details of key management personnel compensation are disclosed in Note 5 to
the financial statements. c) Key management personnel equity holdings Fully paid ordinary shares issued by eServGlobal Limited.
Balance at 1
November Received on exercise of
options
Net other change
Balance at 31 October
No. No. No. No. Year to 31 October 2013
Richard Mathews(i) 16,317,275 - (3,030,303) 13,286,972 Craig Halliday(ii) 23,445,324 - (3,030,303) 20,415,021 Francois Barrault 500,000 - - 500,000 James Brooke(iii) 35,153,419 - (35,153,419) - Stephen Baldwin (v) 932,600 - - 932,600 David Smart(iv) 40,000 - (40,000) - Year to 31 October 2012
David Smart 40,000 - - 40,000 Richard Mathews(i) 16,317,275 - - 16,317,275 Craig Halliday(ii) 23,445,324 - - 23,445,324 Francois Barrault 500,000 - - 500,000
James Brooke(iii)
35,153,419
-
-
35,153,419 Stephen Baldwin (v) - - 932,600 932,600
(i) Had the power to exercise, control the exercise of, or influence the exercise of, the voting powers or disposal of the securities to which the relevant interest relates of the 16,110,592 ordinary shares held by MHB Holdings Pty Ltd and 206,683 shares held by Paua Pty Ltd. On 19 February 2013, MHB Holdings Pty Ltd, holding as agent, transferred 3,030,303 ordinary fully paid shares to an unrelated principal, unrelated to Mr Mathews.
(ii) Had the power to exercise, control the exercise of, or influence the exercise of, the voting powers or disposal of the securities to which the relevant interest relates of the 16,110,592 ordinary shares held by MHB Holdings Pty Ltd, 62,005 held by Paua Pty Ltd, and 7,272,727 shares held by National Nominees Limited. On 19 February 2013, MHB Holdings Pty Ltd, holding as agent, transferred 3,030,303 ordinary fully paid shares to the principal, unrelated to Mr Halliday.
(iii) James Brooke has a relevant interest in shares held by Henderson Global Investors Limited. James Brooke resigned on 1 May 2013.
(iv) David Smart retired as a Director on 22 March 2013. (v) Stephen Baldwin appointed a Director on 25 November 2011.

eServGlobal Limited Annual Report 2013 73
Notes to the Financial Statements for the financial year ended 31 October 2013
27. RELATED PARTY DISCLOSURES (continued)
c) Key management personnel equity holdings (continued) Options issued by eServGlobal Limited to Key Management Personnel
Balance at 1
November
Granted as compen-
sation
Exercised Net other change
Balance at 31 October
Balance vested at
31 October
Vested but not
exercisable
Vested and exercisable
Vested during the
year
No. No. No. No. No. No. No. No. No. Year to 31 October 2013
Craig Halliday 1,500,000 - - (1,500,000) - - - - -
R Arame 1,000,000 150,000 - - 1,150,000 - - - -
S Blundell 1,000,000 250,000 - - 1,250,000 - - - -
P Montessori(i) 750,000 500,000 - - 1,250,000 - - - -
Balance at 1 July
Granted as compen-
sation
Exercised Net other change
Balance at 31 October
Balance vested at
31 October
Vested but not
exercisable
Vested and exercisable
Vested during
the year
No. No. No. No. No. No. No. No. No. Year to 31 October 2012
Craig Halliday 1,000,000 1,500,000 - (1,000,000) 1,500,000 - - - -
R Arame 1,000,000 1,000,000 - (1,000,000) 1,000,000 - - - -
S Blundell 1,000,000 1,000,000 - (1,000,000) 1,000,000 - - - -
P Montessori(i) - 750,000 - - 750,000 - - - -
(i) P Montessori was employed on 6 February 2012. Each executive share plan option converts into one ordinary share of eServGlobal Limited when the option is exercised and the exercise price paid. When options are issued, no amounts are paid or payable by the recipient of the option (Refer Note 6). d) Non-executive directors option holdings There were no options in issue to non-executive directors during the financial year or in the prior financial period.

74
Notes to the Financial Statements for the financial year ended 31 October
2013 27. RELATED PARTY DISCLOSURES (continued)
Consolidated
Year Ended 31 October
2013 $
Year Ended 31 October
2012 $
e) Loans from related parties Loans from shareholders - 6,000,000
During the year, the Group paid down all of the secured loans from shareholders (refer Note 16).
f) Other related party transactions
Interest on shareholder loans
252,691
915,740 Mr Baldwin’s Director’s Fees, as detailed in
the Directors’ Report, are paid to his private company 91,142 87,083
Mr Mathews’ Directors Fees have been paid to his private company since April 2013 70,000 -
g) Parent Entities The parent and ultimate parent entity in the Group is eServGlobal
Limited.

eServGlobal Limited Annual Report 2013 75
Notes to the Financial Statements for the financial year ended 31 October 2013
28. NOTES TO THE STATEMENT OF CASH FLOWS
Consolidated Year
Ended 31 October
2013 $’000
Year Ended 31
October 2012 $’000
a) Reconciliation of cash For the purposes of the statement of cash flows, cash and cash
equivalents includes cash on hand and in banks and investments in money market instruments, net of outstanding bank overdrafts. Cash at the end of the financial year as shown in the statement of cash flows is reconciled to the related items in the statement of financial position as follows:
Cash and cash equivalents 4,909 3,794 Bank overdraft - - 4,909 3,794 b) Financing facilities Secured loan facility amount used 3,000 7,200 amount unused - - Total Secured loan facilities 3,000 7,200 c) Reconciliation of profit/ (loss) for the year to net cash
flows from operating activities
Profit/(loss) for the year 10,374 (15,589) Interest income (11) (562) Depreciation of non-current assets 468 637 Amortisation of non-current assets 1,875 4,704 (Profit)/loss on disposal of non-current assets (10) 123 Foreign exchange (gain)/loss, including changes in foreign
currency net assets and liabilities
(6,534)
2,290 Equity settled share-based payments 456 624 Proceeds from asset disposal (escrow deposit) - (23,307) (Increase)/decrease in current income tax balances (4,101) (6,835) (Increase)/decrease in deferred tax balances (4,320) (1,435) Changes in net assets and liabilities, net of effects from
acquisition of businesses:
(Increase)/decrease in assets: - Receivables (7,752) 26,331 - Inventories 84 12 Increase/(decrease) in liabilities: - Trade payables 327 (7,428) - Provisions 394 (747) - Other liabilities (136) (68) Net cash used in operating activities (8,886) (21,250)

76
Notes to the Financial Statements for the financial year ended 31 October
2013 28. NOTES TO THE STATEMENT OF CASH FLOWS (continued)
Consolidated
31 October
2013 $’000
31 October
2012 $’000
d) Cash balance not available for use 1,014 428
The above cash balance which is not available for use is held as security by the financial institutions in relation to a financial guarantee that has been issued on behalf of the company.
29. FINANCIAL INSTRUMENTS
a) Significant Accounting Policies Details of the significant accounting policies and methods adopted, including the criteria for
recognition, the basis of measurement and the basis on which revenues and expenses are recognised, in respect of each class of financial asset, financial liability and equity instrument are disclosed in Note 1 to the financial statements.
b) Capital Risk Management The Group manages its capital to ensure that entities in the Group will be able to continue as
a going concern while maximising the return to stakeholders through the optimisation of the debt and equity balance. The Group’s overall strategy remains unchanged from the year ended 31 October 2012. The capital structure of the Group includes cash and cash equivalents and equity attributable to equity holders of the parent, comprising issued capital, reserves and retained earnings. At 31 October 2013 the Group had bank borrowings of $ 3.0m (2012: $ nil). The Group has no other borrowings (2012: $7.2m secured borrowings). Operating cash flows are used to maintain and expand the Group’s assets as well as to pay for operating expenses, tax liabilities and software development activities.
c) Financial Risk Management Objectives The Group’s activities expose it to a variety of financial risks: market risk (including currency
and interest rate risk), credit risk and liquidity risk. The Group’s overall risk management program focuses on the unpredictability of financial and exchange rate markets and seeks to minimise potential adverse effects on the Group’s performance. The Group seeks to minimise the effect of foreign currency risks using derivative financial instruments detailed at 29 (e). A risk management framework, including the policy on use of financial derivatives is governed by the Board of Directors. The Group does not enter into or trade financial instruments, including derivative financial instruments, for speculative purposes.
d) Market Risk The Group’s activities expose it primarily to the financial risks of changes in foreign currency
exchange rates. The Group may enter into forward foreign exchange contracts to cover foreign currency receipts from specific customer orders. There has been no change to the Group’s exposure to market risks or the manner in which it manages and measures the risk from the previous period.

eServGlobal Limited Annual Report 2013 77
Notes to the Financial Statements for the financial year ended 31 October 2013
29. FINANCIAL INSTRUMENTS (continued)
e) Foreign Currency Risk Management The Group undertakes certain transactions denominated in foreign currencies that are
different to the functional currency of the respective entities undertaking the transactions, hence exposures to exchange rate fluctuations arise. The group may use foreign currency exchange contracts to hedge these risks. No such contracts were entered into during the current year (2012: nil). The carrying amount of the Group’s foreign currency denominated monetary assets and monetary liabilities at the reporting date that are denominated in a currency that is different to the functional currency of the respective entities holding the monetary assets and liabilities are as follows:
Assets Liabilities 31 October
2013 31 October
2012 31 October
2013 31 October
2012 $’000 $’000 $’000 $’000 US Dollars 2,399 2,532 60 266 Euro 43 98 - 14 UK Pounds - - 154 23 Egyptian Pounds 483 20 - - Indonesian Rupees 115 35 - - Indian Rupees 71 36 - - Romanian Lei (RON) 39 23 - - UAE Dirham (AED) 116 89 - - Consolidated 31 October
2013 31 October
2012 Categories of financial instruments $’000 $’000 Financial Assets: Cash and cash equivalents 4,909 3,794 Loans and receivables Receivables 8,049 8,791 Deposits and accrued interest 1,323 284 Financial Liabilities: Trade payables (at amortised cost) 2,019 1,359 Borrowings 3,000 7,200

78
Notes to the Financial Statements for the financial year ended 31 October 2013
29. FINANCIAL INSTRUMENTS (continued)
Foreign currency sensitivity analysis The following table details the Group’s sensitivity to a 10% increase and decrease in the Australian dollar against the relevant foreign currencies, which represents management’s assessment of the possible change in foreign exchange rates. The sensitivity analysis includes only outstanding foreign currency denominated monetary items (arising from monetary assets and liabilities held at balance date in a currency different to the functional currency of the respective entities holding the assets or liabilities) and adjusts their translation at a year end for a 10% change in foreign currency rates.
Profit or loss Consolidated Currency 31
October 2013
31 October
2012 $’000 $’000 US Dollar 273 311 Euro 5 12 UK Pounds 17 3 Egyptian Pounds 54 2 Indonesian Rupees 13 4 Indian Rupees 8 4 Romanian Lei (RON) 4 3 UAE Dirham (AED) 13 10 A positive number indicates an increase in profit or loss with the Australian Dollar strengthening against the respective currency. For a weakening of the Australian Dollar against the respective currency there would be an equal and opposite impact on the profit, and the amounts above would be negative.
In management’s opinion, the above sensitivity analysis is not fully representative of the inherent foreign exchange risk as the year end exposure does not necessarily reflect the exposure during the course of the year. In addition, the Group includes certain subsidiaries whose functional currencies are different to the Group’s presentation currency. The main operating entity outside of Australia is based in France. As stated in the Group’s Accounting Policies Note 1(e), on consolidation the assets and liabilities of these entities are translated into Australian dollars at exchange rates prevailing on the balance date. The income and expenses of these entities is translated at the average exchange rates for the year. Exchange differences arising are classified as equity and are transferred to a foreign exchange translation reserve. The Group’s future reported profits could therefore be impacted by changes in rates of exchange between the Australian Dollar and the Euro. f) Interest Rate Risk Management The Group’s exposure to interest rate risk at 31 October 2013 is in respect of interest generated on deposits balances invested during the course of the year and interest incurred on external borrowings. Cash deposits yielded a weighted average interest rate of 0.97% for the financial year (2012: 0.2%), and borrowings were incurred at a weighted average rate of 8.87% for the current financial year (2012: 9.75%). Interest rate sensitivity analysis
The Group’s sensitivity to interest rates is on surplus cash placed on short-term deposit or drawings on borrowing facilities. The Group’s net sensitivity to interest rate movements is not considered to be material to the Group.

eServGlobal Limited Annual Report 2013 79
Notes to the Financial Statements for the financial year ended 31 October 2013
FINANCIAL INSTRUMENTS (continued)
g) Credit Risk Management Credit risk refers to the risk that a counterparty will default on its contractual obligations resulting in financial loss to the Group. The Group has adopted the policy of dealing with creditworthy counterparties, as a means of mitigating the risk of financial loss from defaults. Trade receivables consist of a relatively small number of closely managed customers, spread across diverse geographical areas. Ongoing credit evaluation is performed on the financial condition of accounts receivable as part of the overall client management process. The carrying amount of the financial assets recorded in the financial statements, net of any allowance for losses, represents the Group’s maximum exposure to credit risk.
h) Liquidity Risk Management Ultimate responsibility for liquidity risk management rests with the board of directors, who have built an appropriate liquidity risk management framework for the management of the Group’s short, medium and long-term funding and liquidity management requirements. The Group manages liquidity risk by maintaining adequate reserves, banking facilities and reserve borrowing facilities by continuously monitoring forecast and actual cash flows and matching the maturity profiles of financial assets and liabilities. Liquidity and interest risk tables The following tables detail the Group’s remaining contractual maturity for its non-derivative financial liabilities. The tables have been drawn up based on the undiscounted cash flows of financial liabilities based on the earliest date on which the Group can be required to pay. The table includes principal cash flows.
Weighted
average effective
interest rate %
Less than 1 month
$’000
1-3 months $’000
3 months – 1 year $’000
1-5 years $’000
Consolidated 31 October 2013 Trade payables - Non-interest bearing - 1,346 673 - - Borrowings 7.60% - - 3,000 - 31 October 2012 Trade payables - Non-interest bearing
- 906 453 - -
Borrowings 9.75% - - 1,200 6,000

80
Notes to the Financial Statements for the financial year ended 31 October 2013
29. FINANCIAL INSTRUMENTS (continued) The following tables detail the Group’s expected maturity for its non-derivative financial assets. The tables have been drawn up based on the undiscounted contractual maturities of the financial assets including interest that will be earned on those assets except where the Group anticipates that the cash flow will occur in a different period based on the earliest date on which the Group can expect to receive payment. The table includes both interest and principal cash flows. Weighted
average effective interest
rate %
Less than 1 month
$’000
1-3 months $’000
3 months – 1 year
$’000 1-5 years
$’000
5+ years $’000
Consolidated 31 October 2013 Cash and cash equivalents 0.12% 4,909 - - - - Deposits - Non-interest bearing - - - 1,323 - - Trade receivables - Non-interest bearing
- 4,427 2,213 1,409 - -
9,336 2,213 2,732 - - 31 October 2012 Cash and cash equivalents 0.02% 3,794 - - - - Deposits – interest bearing - - - - - - Deposits - Non-interest bearing - - - 284 - - Trade receivables - Non-interest bearing
- 4,835 2,418 1,538 - -
8,629 2,418 1,822 - -
i) Fair Value of Financial Instruments The fair values of financial assets and financial liabilities are determined as follows:
• The fair value of other financial assets and financial liabilities are determined in accordance with generally accepted pricing models based on discounted cash flow analysis using prices from observable current market transactions;
The directors consider that the carrying amount of financial assets and financial liabilities recorded at amortised cost in the financial statements approximates their fair values.

eServGlobal Limited Annual Report 2013 81
Notes to the Financial Statements for the financial year ended 31 October 2013
30. PARENT ENTITY INFORMATION (a) Financial position 31 October 2013 31 October 2012 $’000 $’000 Assets Current assets 2,412 894 Non-current assets 38,304 21,972 Total assets 40,716 22,866 Liabilities Current liabilities 3,362 1,792 Non-current liabilities - 6,000 Total liabilities 3,362 7,792 Equity Issued capital 106,695 90,770 Accumulated losses (71,814) (77,713) Reserves Employee equity-settled benefits 2,473 2,017 Total equity 37,354 15,074 (b) Financial performance
Year Ended 31 October
2013 $’000
Year Ended 31 October
2012 $’000
Profit/(loss) for the year 5,899 (14,422) Other comprehensive income - - Total comprehensive income/(loss) 5,899 (14,422) (c) Guarantees entered into by the parent entity
eServGlobal Limited has not provided any guarantees in relation to any of its subsidiaries.
(d) Contingent liabilities of the parent entity
There are no contingent liabilities for the parent entity.
(e) Commitments for the acquisition of property, plant and equipment by the parent entity
There are no commitments for the acquisition of property, plant and equipment by the parent entity.

82
Notes to the Financial Statements for the financial year ended 31 October
2013
31. SUBSEQUENT EVENTS
On 19 December 2013 eServGlobal concluded an agreement to create a new joint venture with MasterCard and BICS (eServGlobal’s current partner in HomeSend) for the international mobile money transfer service, HomeSend. Under the terms of the agreement, eServGlobal will contribute its Homesend business, including staff that are directly related to the HomeSend business into a newly formed company (“NewCo”). Following the transaction, MasterCard will own 55% of NewCo, eServGlobal will own 35% and BICS will own 10%. Based on the initial shareholdings, MasterCard will be entitled to appoint three directors to the Board of NewCo, eServGlobal will be entitled to make two appointments and BICS will be entitled to nominate one director. MasterCard will contribute cash for its interest in NewCo with eServGlobal to receive €9.0m ($13.6 million) in cash, which includes €3.45 million ($5.21 million) to be held in escrow, net of a pro rata of NewCo’s estimated working capital requirements for the medium term. In addition, MasterCard will enter into a commercial agreement with HomeSend which will have an initial duration of three years and automatic yearly renewal thereafter. The commercial agreement will require MasterCard to use its best endeavors to promote the HomeSend service utilising MasterCard’s sales channels. There are conditions precedent to the creation of the HomeSend joint venture and those conditions, together with a summary of the material terms and conditions of the HomeSend joint venture have been included in the regulatory announcement dated 19 December 2013. As a result of the transfer of Homesend business to the HomeSend joint venture, eServGlobal will recognise a gain on disposal of between €23.5m - €24.2m in 2014 ($33.9m – $35.0m) based on consideration of €30.0m ($43.3m) less assets classified as held for sale and estimated selling expenses. The assets attributable to the HomeSend business (including the allocated goodwill component) have been classified as “Assets classified as held for sale” in the Consolidated Statement of Financial Position as at 31 October 2013. The expected taxable profit arising from the Homesend joint venture has resulted in the recognition of a deferred tax asset and associated income tax credit of €4.7M ($6.8M) as at 31 October 2013 relating to recoupment of income tax losses not previously recognised by the consolidated entity. On 23 December 2013 eServGlobal announced that it had entered into a subscription agreement with an existing Australian institutional investor for the Company to issue 4,500,000 fully paid ordinary shares at AUD$0.75 (£0.41) per share, raising AUD$3.375M (£1.843M). No fees were payable on the placement. The 4,500,000 fully paid ordinary shares were issued on 30 December 2013 (being represented by depositary interests in CREST) and admitted to AIM on 30 December 2013. Following the issue, the Company's total issued share capital is 253,545,997 fully paid ordinary shares of no par value.

eServGlobal Limited Annual Report 2013 83
Notes to the Financial Statements for the financial year ended 31 October 2013
32.
ADDITIONAL COMPANY INFORMATION
eServGlobal Limited is a listed public company, incorporated in Australia and operating in Australia, Europe, the Middle East, North Africa, Asia/Pacific and the Americas.
Registered Office c/o Simpsons Solicitors
Level 2, Pier 8/9 23 Hickson Road Millers Point Sydney NSW 2000 Australia

84
Additional Securities Exchange Information
as at 22 January 2014 Ordinary share capital 253,545,997 fully paid ordinary shares are held by 951 individual shareholders on the Australian Securities Exchange and 198 individual depository interest holders on the London Stock Exchange (AIM). All issued ordinary shares carry one vote per share.
Options 18 individual option holders hold 9,100,000 options Options do not carry a right to vote.
Distribution of holders of equity securities Fully Paid
Ordinary Shares Listed on ASX
Depository Interests Listed on LSE (AIM)
Options- not listed
1-1,000 131 16 - 1,001-5,000 357 25 - 5,001-10,000 179 26 - 10,001-100,000 232 72 - 100,001-Over 52 59 18 Total 951 198 18 Holding less than a marketable parcel
68
Substantial shareholders Number Legal and General Investment Management Plc 45,295,200 Henderson Global Investors Ltd 35,153,419 Acorn Capital Limited 32,913,500 Investec Asset Management Limited 19,047,619

eServGlobal Limited Annual Report 2013 85
Additional Securities Exchange Information
as at 22 January 2014
Twenty largest holders of quoted equity securities
Australian Securities Exchange Computershare Clearing Pty Ltd holds 157,666,241
ordinary fully paid shares on behalf of the Depositary Interest Holders.
London Stock Exchange (AIM)
Ordinary Shareholders Number % of
capital Depository Interest (DI) Holders
Number
% of DI Holders
NATIONAL NOMINEES LIMITED 20,134,023 7.94 NORTRUST NOMINEES LIMITED <TDS> 29,959,69
9 19.01
MHB HOLDINGS PTY LTD# 13,080,289 5.16 VIDACOS NOMINEES LIMITED <2303> 18,809,45
3 11.93
J P MORGAN NOMINEES AUSTRALIA
LIMITED 11,799,467 4.65 STATE STREET NOMINEES LIMITED <OM04>
18,000,00
0 11.42
HSBC CUSTODY NOMINEES
(AUSTRALIA) LIMITED 9,547,822 3.77
HSBC GLOBAL CUSTODY NOMINEE (UK)
LIMITED <764685>
12,500,00
0 7.93
BT PORTFOLIO SERVICES LIMITED
<MCMANAMEY SUPER FUND A/C> 4,121,388 1.63
HSBC GLOBAL CUSTODY NOMINEE (UK)
LIMITED <667656>
11,648,00
6 7.39
HSBC CUSTODY NOMINEES
(AUSTRALIA) LIMITED <NT-COMNWLTH
SUPER CORP A/C>
3,903,233 1.54 NORTRUST NOMINEES LIMITED <SLEND> 6,506,936 4.13
CITICORP NOMINEES PTY LIMITED
<COLONIAL FIRST STATE INV A/C> 3,030,436 1.20 NUTRACO NOMINEES LIMITED <UKREITS> 6,186,986 3.93
MR DAVID BATKIN + MRS ADRIENNE
BATKIN + MRS JENNIFER BEST <D & A
BATKIN FAMILY A/C>
3,030,303 1.20 BNY (OCS) NOMINEES LIMITED <HIT> 5,595,790 3.55
CITICORP NOMINEES PTY LIMITED 1,953,197 0.77 THE BANK OF NEW YORK (NOMINEES)
LIMITED <RUEGF> 5,300,000 3.36
PATRICK MCGRORY 1,730,426 0.68 PLATFORM SECURITIES NOMINEES LIMITED
<KKCLT> 5,151,597 3.27
MIRRABOOKA INVESTMENTS LIMITED 1,300,000 0.51 HSBC GLOBAL CUSTODY NOMINEE (UK)
LIMITED <944287> 4,000,000 2.54
RBC INVESTOR SERVICES AUSTRALIA
NOMINEES PTY LIMITED <PISELECT> 1,002,183 0.40
HSBC GLOBAL CUSTODY NOMINEE (UK)
LIMITED <978777> 3,260,714 2.07
LINK 405 PTY LTD 995,759 0.39 CHASE NOMINEES LIMITED 3,000,000 1.90
MR STEPHEN JOHN BALDWIN + MRS
ANDREA MAREE BALDWIN <THE
STEVE BALDWIN SF A/C>
850,000 0.34 FITEL NOMINEES LIMITED <DMOD> 2,108,000 1.34
JP MORGAN NOMINEES AUSTRALIA
LIMITED <CASH INCOME A/C> 673,299 0.27
HSBC GLOBAL CUSTODY NOMINEE (UK)
LIMITED <887711> 2,044,037 1.30
MR NIGEL PILCHER + MRS FRANCES
PILCHER <PILCHER SUPER FUND A/C> 555,000 0.22 JAMES CAPEL (NOMINEES) LIMITED <PC> 1,825,000 1.16
MR FRANCOIS BARRAULT 500,000 0.20 HARGREAVES LANSDOWN (NOMINEES)
LIMITED <HLNOM> 1,737,778 1.10
HALLAM DRAINAGE PTY LTD 500,000 0.20 BNY (OCS) NOMINEES LIMITED <UKREITS> 1,707,708 1.08
MR JAMES PRATT 500,000 0.20 HSBC GLOBAL CUSTODY NOMINEE (UK)
LIMITED <909731> 1,100,000 0.70
MR IAN FRASER MCMANAMEY 376,266 0.15 BARCLAYSHARE NOMINEES LIMITED 886,640 0.56
#On 30 December 2013 MHB Holdings Pty Ltd transferred 10,534,834 shares to Paua Pty Ltd and 2,545,455 Shares to Mr Paul Beesley. These transfers have not been recorded on the Company’s register of members at 22 January 2014.

86
Additional Securities Exchange Information
as at 22 January 2014
Secretary Tom Rowe Chief Financial Officer Stephen Blundell Registered Office & Principal Administration Office C/o Simpsons Solicitors Level 2, Pier 8/9 23 Hickson Road Millers Point Sydney NSW 2000 Australia Share Registry Computershare Registry Services Pty Ltd Level 3, 60 Carrington Street Sydney NSW 2000 Australia Stock Exchange listings eServGlobal Limited’s ordinary shares are quoted on the Australian Securities Exchange Limited under the ticker “ESV”, and on the London Stock Exchange (AIM) as Depository Interests under the ticker “ESG”.

eServGlobal Limited Annual Report 2013 87
Contacting eServGlobal Paris Headquarters eServGlobal SAS 244, avenue Pierre Brossolette 92245, Malakoff Cedex, France www.eservglobal.com [email protected]

88
THIS PAGE HAS BEEN LEFT BLANK

eServG
lobal Limited A
nnual Report 2013
www.eservglobal.com