Bridging the Gap Between Research and Operations in the ...
32
1 Darden, C., B. Carroll, S. Goodman, G. Jedlovec, B. Lapenta, 2002: Bridging the Gap Between Research and Operations in the National Weather Service: Collaborative Activities Among the Huntsville Meteorological Community, NOAA, Technical Memorandum NWS SR-222. Bridging the Gap Between Research and Operations in the National Weather Service: Collaborative Activities Among the Huntsville Meteorological Community Chris Darden WFO Huntsville, Alabama Beth Carroll University of Alabama – Huntsville Steve Goodman, Gary Jedlovec, and Bill Lapenta NASA/MSFC, Huntsville, Alabama 1. INTRODUCTION A major goal of the National Weather Service (NWS) is to provide improved customer service and products to our local communities and customers. The rapid advancements in computer and communication technology have led to an explosion in the amount of weather information available to the public and private sectors. To maintain its standing as a vital agency and avoid losing its customer base, it is incumbent upon the NWS to adapt to the ever-changing times and “think outside the box” for new and creative ways to reach our customers. In an effort to achieve this goal, the new Weather Forecast Office (WFO) in Huntsville, Alabama has embarked upon a pro-active training, outreach and familiarization program geared towards assessing the needs and concerns of the local users. WFO Huntsville is slated to begin full-time operations in early 2003. At that time, the office will take over forecast and warning responsibilities for eleven counties in northern Alabama (Figure 1). The southeast region of the United States experiences a wide range of weather regimes, from severe storms and flash flooding to significant winter events. The establishment of WFO Huntsville within the National Space Science and Technology Center (NSSTC) has provided a unique opportunity for close and productive collaboration with atmospheric scientists at NASA Marshall Space Flight Center (MSFC) and the University of Alabama in Huntsville (UAH). As part of this effort, NASA will be providing satellite data products and regional model forecasts to the WFO through its newly formed S hort-term P redictio n R esearch and T ransition (SPoRT) Center. The mission of SPoRT is to incorporate NASA technology and research into the NWS operational environment, with emphasis on improving short-term warnings and forecasts
Transcript of Bridging the Gap Between Research and Operations in the ...

1
Darden, C., B. Carroll, S. Goodman, G. Jedlovec, B. Lapenta, 2002: Bridging the Gap
Between Research and Operations in the National Weather Service: Collaborative
Activities Among the Huntsville Meteorological Community, NOAA, Technical
Memorandum NWS SR-222.
Bridging the Gap Between Research and Operations in the National
Weather Service: Collaborative Activities Among the Huntsville
Meteorological Community
Chris Darden
WFO Huntsville, Alabama
Beth Carroll
University of Alabama – Huntsville
Steve Goodman, Gary Jedlovec, and Bill Lapenta
NASA/MSFC, Huntsville, Alabama
1. INTRODUCTION
A major goal of the National Weather Service (NWS) is to provide improved customer
service and products to our local communities and customers. The rapid advancements in
computer and communication technology have led to an explosion in the amount of
weather information available to the public and private sectors. To maintain its standing
as a vital agency and avoid losing its customer base, it is incumbent upon the NWS to
adapt to the ever-changing times and “think outside the box” for new and creative ways
to reach our customers. In an effort to achieve this goal, the new Weather Forecast
Office (WFO) in Huntsville, Alabama has embarked upon a pro-active training, outreach
and familiarization program geared towards assessing the needs and concerns of the local
users.
WFO Huntsville is slated to begin full-time operations in early 2003. At that time, the
office will take over forecast and warning responsibilities for eleven counties in northern
Alabama (Figure 1). The southeast region of the United States experiences a wide range
of weather regimes, from severe storms and flash flooding to significant winter events.
The establishment of WFO Huntsville within the National Space Science and Technology
Center (NSSTC) has provided a unique opportunity for close and productive
collaboration with atmospheric scientists at NASA Marshall Space Flight Center (MSFC)
and the University of Alabama in Huntsville (UAH). As part of this effort, NASA will be
providing satellite data products and regional model forecasts to the WFO through its
newly formed Short-term Prediction Research and Transition (SPoRT) Center.
The mission of SPoRT is to incorporate NASA technology and research into the NWS
operational environment, with emphasis on improving short-term warnings and forecasts

2
in the 0-24 hour timeframe. A joint symposium was held in April 2002 as the first step in
the development of the SPoRT Center implementation plan. In conjunction with this
effort, a survey was developed which seeks to identify the most critical needs of the
forecast community. This paper provides an overview of the symposium and the
accompanying survey, and some future directions for SPoRT/NWS collaborative
activities.
2. NASA-NWS SYMPOSIUM
2.1 Symposium Overview
The NASA-NWS Joint Symposium on Short-Term Forecasting and the Convective
Weather Warning Process was held in Huntsville on April 9-10 2002. For a complete
agenda, see http://wwwghcc.msfc.nasa.gov/sport/sport_meetings.html. A primary goal of
the symposium was to foster interactions between researchers, operational
meteorologists, and users through informal presentations and discussion sessions. To
achieve this goal, organizers invited representatives from the media, emergency
management community, private sector, research community, academia, and operational
forecasting community. The fifty-five attendees represented a solid cross-section of these
individual groups, which provided for productive interaction throughout the symposium.
The members of SPoRT were able to assess the needs of the operational community in
order to develop a road map for future SPoRT activities.
2.2 Presentations
The introductory session began with an overview of NASA’s weather research program.
Other topics included an introduction to the SPoRT Center and a presentation of satellite
products applicable to short-term forecasting. The focus of the presentations then shifted
to local modeling efforts. Operational and research meteorologists discussed the utility
of regional data assimilation and alternative initialization techniques for the enhancement
of mesoscale model output.
During the afternoon session, presentations focused on the challenges of forecasting
convective weather. Members of the aviation forecasting community expressed the
concerns of their customers and the difficulties of providing site-specific convective
forecasts. Several presentations addressed the various remote sensing tools and
techniques available to the operational forecaster. The techniques included advanced
precipitation estimates based on Doppler radar and satellite data and the use of the
northern Alabama Lightning Mapping Array to assess storm strength and severity. The
symposium concluded with a session on the ever-changing role of the NWS and the need
for continued collaboration with partners in the media, emergency management,
academic, and scientific communities. The symposium presentations are on line at the
SPoRT Center Web site:
http://wwwghcc.msfc.nasa.gov/sport/sport_meetings.html.
2.3 Discussion Sessions

3
A major theme of the symposium was identifying ways that the research and operational
communities could work together to improve the forecasts and services provided to the
end user. To facilitate interaction and feedback within the individuals in attendance,
several open floor discussions were held during the symposium. Discussion topics
ranged from methods of technology infusion into the operational environment to new
products and data sets needed to enhance our customer service.
2.3.1 Partnership Issues
Dr. Bill Lapenta, meteorologist with MSFC, chaired a discussion session geared toward
local modeling and data assimilation. The purpose of this session was to gauge the needs
of the operational community and provide a direction for future partnership and
innovations. Dr. Lapenta defined the following priority areas of the SPoRT modeling
program: regional data assimilation, short-range ensemble modeling, verification
initiatives, identifying “value-added” services, and forecaster training.
The potential benefits of incorporating satellite data and other remote sensing data sets in
the model initialization process were discussed. In particular, Dr. Lapenta displayed the
utility of the “hot start technique” (McGinley and Smart 2001; Schultz and Albers 2001)
in improving timing and placement of convective precipitation in the model output.
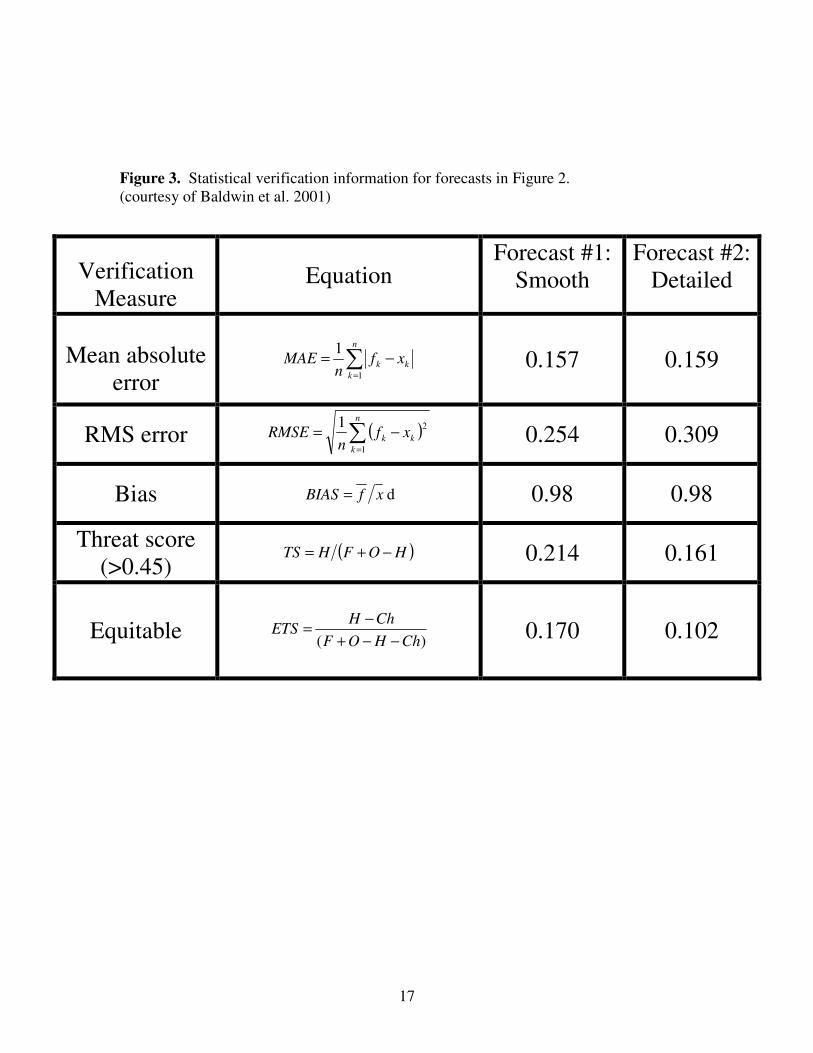
The issue of qualitative versus quantitative verification was discussed in some detail
including the limitations of strictly quantitative calculations. An example of how
misleading statistical verification can be compared to the actual quality of the forecast
was displayed (Figures 2 and 3). As can be seen in Figure 2, the output from forecast
model #2 was much closer to the observed conditions than the output from forecast
model #1. However, when viewing the statistical verification information in Figure 3, the
“poorer” output from forecast model #1 actually produced lower error values. Cases like
this one indicate the weaknesses of purely statistical verification and the need for broader
evaluation methods. A consensus was reached among the group that new methods of
verification must be developed that take into account the usefulness of the forecast to the
end customer.
Given proper training and context, Dr. Lapenta stressed the utility of supplemental model
data and local data assimilation techniques. Some benefits of the NASA/NWS
collaboration would include high-resolution short-term numerical guidance that could be
incorporated into the Interactive Forecast Preparation System (IFPS), development of
site-specific model products, implementation of advanced model verification procedures,
and training and daily interaction.
2.3.2 Short-term forecasts of convective weather and infusion of new products
Dr. Steve Goodman, meteorologist with MSFC, and Tom Bradshaw, Science and
Operations Officer (SOO) at WFO Huntsville, chaired this informative discussion.

4
Members of the emergency management agency (EMA) stressed their need for additional
pre-event information. They discussed their need for a more detailed Hazardous Weather
Outlook (HWO) and better coordination between the EMA and NWS communities.
Rusty Russell, EMA director for Madison county, Alabama, expressed his desire to see
detailed lightning forecasts, better training on hydrology issues, and experimental outlook
products similar to those issued by the Storm Prediction Center (SPC).
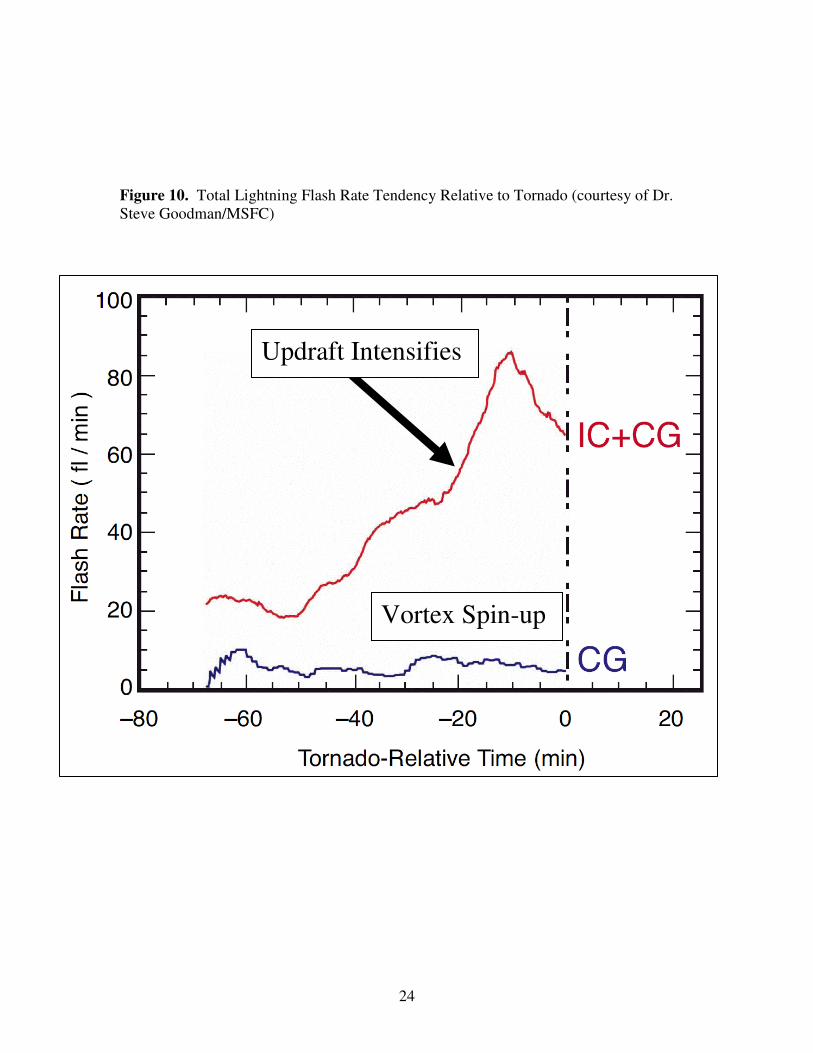
An active discussion ensued among the group concerning the current state of NWS
forecasts and a look to the future. Dr. Goodman reviewed the potential benefits of using
total lightning data in the warning decision-making process. Several forecasters voiced
the desire for high-resolution satellite and surface observation data to detect boundaries
and areas of convective initiation. The issues of optimal warning lead times and the
utility of probabilistic type warnings were once again discussed. A consensus agreed
upon the need for the NWS to “think outside the box” and to look for new and effective
means to reach the customers. Members of SPoRT and WFO Huntsville stressed the
need for collaboration with surrounding forecast offices in order for the initiatives to
achieve their ultimate goals.
The transition from primarily text-based forecasts to a graphical and digital suite of NWS
products was also discussed. With the implementation of the Graphical Forecast Editor
(GFE) component of IFPS, forecasters can create a wide array of products through a
single database. The attendees stressed the need of infusing the available data sets
(lightning, satellite, high resolution data assimilation and models) into GFE and creating
as detailed a suite of products as possible. The EMA community again expressed their
desire to receive as much weather information as possible. They stated they realize the
experimental nature of some of the products, and would give them their appropriate
weight in the decision process.
2.3.3 Training and Integration Issues
At the conclusion of the first session, Tom Bradshaw led a group discussion concerning
the infusion of new products and data sets into the operational environment. Virtually
everyone in attendance noted the positive potential of the mesoscale modeling initiatives
and satellite products on the forecast process. However, the two primary concerns of
field forecasters were: 1) training and 2) integration of new data sets.
Several forecasters were not aware of some of the satellite data sets that were available.
Several NWS meteorologists mentioned the underutilization of Polar Orbiting Satellite
(POES) data and its growing potential in the forecast process. Dr. Gary Jedlovec,
meteorologist with MSFC, re-iterated the utility of POES data sets and the need for
adequate training on the operational use of satellite products. The discussion then
transitioned to the overall need for improved local training and methods for incorporating
the training into a shift-work environment. Also, forecasters stressed that it simply takes
too long for new innovations or techniques to be integrated into the Advanced Weather
Interactive Processing System (AWIPS). The operational community would like to
implement a more efficient method of ingesting new data sets into the WFO forecasting

5
environment. The attendees were encouraged to provide ideas on how these issues could
be addressed by SPoRT.
2.4 Symposium survey
The NWS, along with UAH and the members of SPoRT, desire to evaluate the needs of
the operational community and the end users in order to develop a roadmap for further
collaboration. In order to quantify the needs of the users and operational forecasters, a
survey was developed and distributed to the attendees. The survey consisted of a cross-
section of questions ranging from short-term forecast issues to the needs of the customers
(Appendix 1).
3. SURVEY RESULTS
3.1 Overview
Seventeen surveys were completed and returned at the conclusion of the two-day
symposium (Appendix A). The large majority (70.6%) of the surveys were from NWS
operational personnel. The operational feedback was deemed beneficial since the
research community was looking to bridge the gap between research and operations.
The survey questions centered on the short term forecast issues that affect operational
personnel and in turn impact the end users. Some survey questions focused on these
forecast issues and the tools and data sets used to address them. Other topics included the
necessity of improving and broadening NWS services to the end users, and methods for
accomplishing this task. NASA has a wide array of earth science resources at their
disposal. The SPoRT Center realizes the need to prioritize their efforts on the short-term
forecast issues that are most pressing and urgent to the end users.
3.1.1. Individual questions
A total of eleven questions were included on the participant survey. The survey issues
that are deemed essential for developing a roadmap for future NWS/NASA collaborative
activities will be covered in some detail. The complete survey results can be located at:
http://wwwghcc.msfc.nasa.gov/sport/2002_symp_survey.html.
Question #1 asked the respondents to address the top five short-term forecast issues
affecting their area or constituency. The majority of answers centered around three major
issues including convection, aviation, and QPF. In fact, over 70% of all surveys included
these three issues (Figure 4). Although these issues overlap to some degree, the accuracy
of the forecast output affects a diverse group of customers. The overall theme of the
responses focused on increased accuracy and predictability of mesoscale phenomena.
While the operational forecaster currently has a vast array of model and remote sensing
data at his or her disposal, the desire to precisely assess the mesoscale environment has
amplified a need for additional products and data sets. As indicated by the survey results,

6
supplemental mesoscale data sets tend to be underutilized in forecast operations. This is
the result of latency issues, lack of training, or knowledge on the available data sets.
Question #3 asks the respondents for ways that current products and services could be
improved to better meet their needs. The majority of respondents (65%) expressed the
need for real-time data access and integration of a vast array of data into one platform
(i.e. AWIPS). Due to time limitations and scheduled product issuances, it is imperative
for the forecaster to assess as much data as possible within a limited window of time. To
achieve this need, integration of real-time data sets is essential. Other frequent responses
included model performance improvements, additional training and sharing of
information, increased resolution of data sets, and the need for faster computer
processing.
Although the NWS issues a large suite of products, feedback from the public and
emergency management officials in Question #4 indicates a need for additional
information. Every respondent stressed the need for improved forecasts of aviation
hazards (Figure 5). In particular, the need for better forecasts of cloud ceilings, visibility,
precipitation timing and precipitation type were noted. Improved forecasts of QPF were
also listed on 75% of the surveys. To achieve the desired forecast improvements, NWS
personnel stressed the need for additional data sets (i.e. surface observations, gauge data,
total lightning data).
As customer requirements for weather information changes, the NWS has to assess the
benefit of the suite of products and data sets currently available. Specifically, it is
incumbent upon the NWS to identify new products, services, and data sets that will better
address the forecast needs of our customers. To achieve this goal, suggestions were
received from the survey participants in Question #5. Topping the list was the need for
enhanced (high resolution with local data assimilation) model data and a wider range of
high-resolution satellite data to better assess the mesoscale environment (Figure 6). In
addition, many of the end users listed the need for lightning warnings and forecasts along
with other area-specific text and graphical products.
To gauge the current level of collaboration between the various entities, Question #7
centered on the way users currently receive data. An overwhelming majority (88%)
stated that they were primarily introduced to new products by attending conferences or
symposiums (Figure 7). Several respondents also indicated that word of mouth
discussions and reading research publications or memorandums was their main source of
introduction to new products and innovations. It is interesting to note that only 25% of
the respondents listed local training initiatives as a way they have been introduced to new
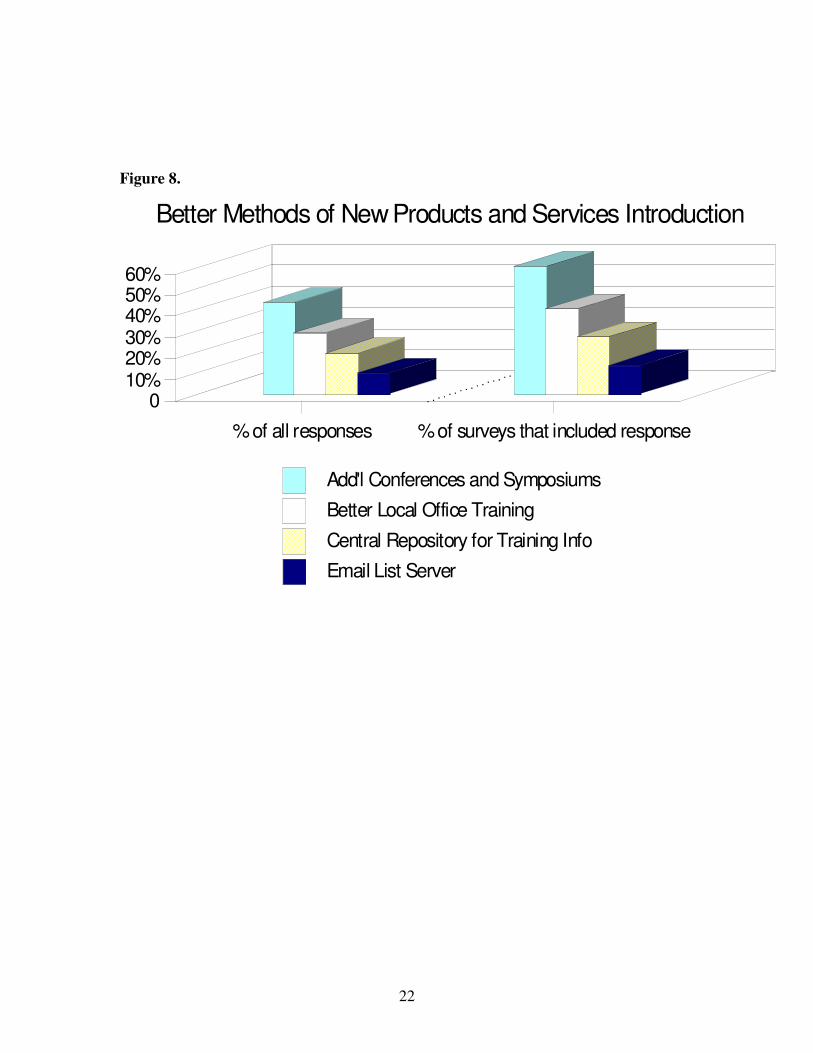
products. In Question #8, the need for additional conferences, face-to-face training
initiatives (local and in-resident), and a central repository for training information was
underscored by the attendees (Figure 8).
The final question (Question #10) to be discussed concerned the utility of satellite data in
the forecast process. The respondents stressed their desire for more streamlined access to
the data sets including the timeliness and integration issues discussed earlier. Over half

7
of the surveys also stressed the need for better training on the use of satellite data. Of the
satellite data sets that are available, forecasters expressed their interest in high-resolution
output to detect boundaries, data to support precipitation estimates, and atmospheric
sounding data. Again, with a new suite of high-resolution NWS products being
implemented, it is incumbent upon the forecaster to receive as much mesoscale data as
possible.
4. ONGOING PROJECTS AND OPPORTUNITES
4.1 COMET Cooperative Project
The Cooperative Program for Operational Meteorology, Education and Training
(COMET), established in 1989, provides financial support to universities for
collaborative research projects, graduate student fellowships, postdoctoral fellowships,
and other activities (http://www.comet.ucar.edu/cometprogram.htm). In the summer of
2000, WFO Birmingham, in conjunction with NASA/MSFC and UAH, embarked upon a
three-year COMET Cooperative project (COMET 2000). This collaboration was aimed
at addressing two core areas of the NWS Strategic Plan (NOAA 1999): improving
tornado warning lead times and reducing false alarm ratios, and improving flash flood
warning detection rates and lead times. Central to the ongoing COMET project is the
integration of an array of tools and data sets, available through NASA and UAH,
generally not available to NWS offices. Specifically, the use of total lightning data,
supplemental mesoscale models, and satellite data have proven quite promising in the
forecast process.
Due to the proximity of the new WFO with NASA and UAH, the interested parties plan
to expand upon the current COMET project proposal to exploit all data sets and
technologies available in the region. Assuming these initiatives provide positive impacts
on the forecast and warning process, it is anticipated that these regional data sets could be
expanded to a national scale.
4.2 Lightning Mapping Array
The core mission of the NWS is to issue warnings for the protection of life and property.
The warning decision-making process remains a challenge for operational forecasters
given the time limitations involved. Through the years, a large volume of research has
focused on storm updraft strength and its association with severe weather. The
limitations of radar sampling have amplified the need for additional information
concerning the structure of thunderstorms. In light of these limitations, a growing area of
research has centered on the use of additional remote sensing data sets to assess the storm
scale environment and anticipating the onset of severe weather.
In the past several years, WFO Melbourne, Florida, in conjunction with NASA MSFC
and Massachusetts Institute of Technology (MIT)/Lincoln Laboratory (LL) scientists,
have conducted research on the relationships between total lightning within
thunderstorms and overall storm severity. This research was completed using a NASA-

8
funded collaborative research tool named the Lightning Imaging Sensor Data
Applications Demonstration (LISDAD) (Boldi et al. 1999). The LISDAD system allows
for the integration of multi-sensor data including in-cloud lightning, cloud-to-ground
lightning, and radar data for real-time analysis and manipulation. The initial results
indicate a distinct relationship between in-cloud flash rate and trends, and the onset of
severe weather (Williams et al. 1999; Hodanish et al. 1999; Goodman et al., 1999).
Through collaboration with New Mexico Tech (Rison et al. 1999; Thomas et al., 2000), a
Lightning Mapping Array (LMA) consisting of ten stations, a central receiving station,
and a processing station has been developed and implemented across northern Alabama
(McCaul et al., 2002). With a range of nearly 150 km, the LMA can detect in-cloud
lightning strikes from any storms encompassing the area from Birmingham, AL to
Nashville, TN (Figure 9). A new second generation LISDAD II system will ingest and
display LMA data, cloud-to-ground lightning from the National Lightning Detection
Network (NLDN), Level II NEXRAD data from Hytop (KHTX), and GOES
visible/infrared imagery. Through the use of algorithms developed at the Massachusetts
Institute of Technology Lincoln Laboratories, the LISDAD will display gust fronts and
boundaries with options to diagnose individual storm cell trends (as in Figure 10) via
pop-up menus.
4.3 Mesoscale Modeling
The regional modeling component of SPoRT will provide NWS operational forecasters
with additional numerical guidance that supplements the National Centers for
Environmental Prediction (NCEP) model suite of products. The overall goal is to
improve NWS short-term forecasts associated with convective initiation and evolution,
aviation hazards, and quantitative precipitation. Satellite data and all available remote
sensing measurements will be used within a regional data assimilation system to enhance
short-term (0-12h) numerical forecasts.
The SPoRT Center MM5 is currently configured with a 36 km CONUS domain and a 12
km nest over the southeastern US. The model is run ten times daily. Forty-eight hour
forecasts are produced at 00 and 12 UTC and twelve-hour forecasts are produced every
hour between 14 and 21 UTC (http://wwwghcc.msfc.nasa.gov/sport/sport_modeling_schedule.html).
Images are provided via the web (http://www.ghcc.msfc.nasa.gov/Model/model_mm5.html) and
binary output is available via anonymous ftp server for ingest into AWIPS.
In Figures 11 and 12, it can be seen that the SPoRT MM5 output can provide “added
value” to the NCEP suite of numerical models. In this particular case from early March
2002, the SPoRT MM5 solution verified better than the Eta in terms of the placement,
timing, and relative magnitude of the significant rainfall across the southeastern US.
Bradshaw et al., (2001) demonstrated the utility of using supplemental model data in the
forecast process during the Summer Convective Rainfall in Alabama Prediction
Experiment (SCRAPE). During the summer of 2000, forecasters from WFO
Birmingham were able to improve upon their overall quantitative precipitation forecasts
(QPF) by using MM5 output in an operational environment.

9
The use of supplemental model output with NWSFO’s continues to increase. However, a
recent NWS workshop revealed only eight percent of models used in the field were
initialized with a regional data assimilation system (McQueen and Hirschberg 2001).
Over the next several months, SPoRT will implement the diabatic “hot start”
initialization technique (McGinley and Smart 2001; Schultz and Albers 2001) to reduce
model “spin-up” during precipitation events. In addition, regional satellite data
assimilation will be performed within LAPS to enhance the cloud analysis and
subsequent diabatic initialization. Future SPoRT modeling activities include
development of a regional short-range ensemble forecast (SREF) system that will be
composed of MM5, the nonhydrostatic Eta, and the Weather Research and Forecast
(WRF) model systems. SREF output will be provided to forecasters in real-time for use
in forecast development.
In order to supplement the regional satellite data assimilation effort within SPoRT, the
NWS and its partners will attempt to garner as much real-time regional in-situ data as
possible. The goal is to form a MESONET by leveraging resources from a wide range of
local, regional, and state entities. With a robust mesonet in place, the initialized data and
subsequent model output should aid in identification of key mesoscale features not
currently resolved well by the NCEP model suite.
The Cooperative Huntsville Area Rainfall Measurements (CHARM) initiative has
already proven quite valuable in the interrogation and verification of precipitation
estimates across portions of northern Alabama (Jedlovec et al. 2002). Figure 13 shows
the location of the daily rainfall measurements taken by volunteers in the Huntsville
region with twenty sites capable of reporting in real-time. The CHARM network has
been effective in normalizing precipitation estimates from surrounding radars and
providing added value to the short term forecast. Figure 14 shows a case where the
CHARM data was able to resolve a localized rainfall maximum not detected by either the
KOHX or KHTX WSR-88D radars.
4.4 Satellite data
One of the most underutilized tools that a forecaster possesses is satellite data. Static
displays of satellite data and its derived products can provide a host of information
ranging from the position of long-wave troughs to atmospheric instability information.
They provide measurements over the ocean where conventional measurements rarely
exist, thermodynamic and stability information between coarsely spaced rawinsondes,
and high-resolution cloud information during both the day and at night. Animation of the
satellite imagery provides a fourth dimension which is invaluable in spotting developing
cloud and storm regions, mesoscale circulation patterns, and other surface and
atmospheric changes which are important for accurate short term forecasting. Through
the years, NWS forecasters have relied on only a modest amount of low-resolution GOES
data in a few channels as their primary source of satellite information. The use of timely
high-resolution satellite data and derived products has been spotty at best. Table 1
presents a list of potential satellite imagery and products available at the SPoRT Center

10
relevant to the short-term forecast problem. For GOES, this is a subset of a list reviewed
by the NWS/NESDIS Satellite Products and Services Review Board (NESDIS 2002).
Through collaboration with SPoRT, the NWS will look to exploit these and other GOES
Imager and Sounder datasets (including rapid scan operations) and derived products to
aid in the forecast process. A number of these satellite-derived parameters are also
assimilated into the MM5 model (see section 4.3).
In addition, a wide variety of other satellite datasets are available in near real time as part
of NASA’s Earth Observing System. These instruments, while mostly in polar or low-
inclination orbit, provide unique observational capabilities because of their high spectral
and or spatial resolution. The MODerate-resolution Imaging Spectrometer (MODIS,
http://modis.gsfc.nasa.gov/) on-board the Terra and Aqua satellites provide a broad
spectrum of multispectral observations at resolutions as fine as 250m. Figure 15
presents a natural-color composite of three short wave channels from MODIS. This
mid-morning image captures many important aspects of developing and mature
convective systems. This is just one of many examples where unique observing
capabilities provide an opportunity for improvement in weather forecasts across the
country.
Additional instruments such as the Atmospheric InfraRed Sounder (AIRS, http://www-
airs.jpl.nasa.gov/) and precipitation and lightning instruments on the Tropical Rainfall
Measuring Mission (TRMM) will provide near real time observing capabilities to
improve short-term prediction. The high spectral resolution of AIRS will provide
unprecedented vertical resolution of temperature, moisture, and trace gases at about 40km
spatial resolution. Along with the Advanced Microwave Sounder (AMSU) and the
Humidity Sounder for Brazil (HSB) which are flying together on the Aqua satellite, this
triad of instruments will provide an all weather sounding capability in clear and cloudy
regions.
4.5 Other data sources
WFO Huntsville will have access to real-time dual Doppler synthesis using the WSR-
88D in Hytop, AL (KHTX) and the WSR-74C at the Huntsville International Airport.
The dual-Doppler analysis will provide the vertical motion and horizontal flow fields.
Also, boundaries and boundary layer wind fields will be determined using the MIT/LL
Machine Intelligent Gust Front Algorithm (MIGFA) and National Center for
Atmospheric Research (NCAR) Tracking Reflectivity Echoes by Correlation (TREC)
algorithm (Tuttle and Gall 1999), applied to the reflectivity and radial velocity data. The
utility of using dual Doppler analysis for the detection and evolution of boundaries has
been well documented (Riordan et al. 1995).
In addition, UAH has real-time access to the mobile integrated profiling system (MIPS).
MIPS consists of a 915 MHz wind profiler, a 2 kHz Doppler sodar, a lidar ceilometer
(0.905 um), 12-channel microwave radiometer, and surface instrumentation. The 915
MHz profiler and the Doppler sodar provide high vertical resolution wind profiles along
with backscattered power return information. The backscattered power profiles will

11
provide important information on atmospheric stratification, which is useful for
monitoring moisture gradients, stable layers and the Planetary Boundary Layer (PBL)
inversion layer. The 12-channel microwave radiometer will return profiles of
temperature and moisture density up to 10 km. MIPS will provide the forecaster with a
wealth of information concerning the structure of the boundary layer processes along
with storm initiation and evolution diagnostics. During the landfall of Hurricane Georges
along the Mississippi Gulf Coast in 1998, the wide-ranging potential of the MIPS was
demonstrated with its high-resolution boundary layer analyses (Knupp et al. 2000).
An additional meteorological data source available to the WFO Huntsville is the upper air
observation facility located at the Redstone Arsenal military installation in Huntsville.
Technicians at Redstone Arsenal are prepared to complete standard radiosonde releases
on fairly short notice. The nearest regular radiosonde sites to Huntsville are Birmingham,
Alabama and Nashville, Tennessee which are both roughly 80 statute miles from the
Arsenal. To better assess the mesoscale environment across northern Alabama, the WFO
Huntsville will arrange for balloon releases on critical weather days. This data can then
be analyzed using various methods to aid in the short-term forecast process.
5. Benefits to Operations
WFO Huntsville has a unique opportunity for close collaboration with NASA and UAH.
The three entities working in partnership will be able to leverage a vast pool of resources
with the goal of infusing the latest technologies and research into the operational
environment. As the push for high-resolution (both spatial and temporal) forecasts gains
momentum, the NWS must access all available data sets to provide the best possible
services to our customers. Over the next several months, the partners involved will work
to form an implementation plan that can be a “test bed” for other weather service offices
and collaborators. Our EMA partners are eager to participate in the project, and to
provide feedback on proposed products ranging from lightning forecasts and warnings to
experimental severe weather outlook products. In addition, the Huntsville collaborators
will continue the interaction and “science sharing” with other members of the
meteorological community through additional symposia, workshops and presentations.
As outlined in the symposium survey and the NWS Strategic Plan, there is a need for
improvement of weather services in several areas. In particular, the collaborative
activities in Huntsville will look to address several of these issues, including an increase
in tornado warning lead times, reduction of tornado warning false alarm ratios,
production of quality, high-resolution graphical products and a drastic improvement of
aviation terminal forecasts. The overall key to the success of the National Weather
Service is reaching and effectively serving our customers. It is incumbent upon the
NWS to leverage all available resources to meet this goal in a timely manner. The desire
of WFO Huntsville, NASA, and UAH is to provide a framework for future collaborative
activities than can benefit the entire nation’s weather services.
Acknowledgements

12
The authors would like to thank Tom Bradshaw, Science Operations Officer, and John
Gordon, Meteorologist in Charge, from the Huntsville WFO for their reviews and
suggestions. Also, a thanks goes to Diane Samuelson from NASA/MSFC for
developing and maintaining the symposium web page. The authors also appreciate the
feedback from those who completed the survey and made this paper possible.
Review of Links
AIRS Home Page: http://www-airs.jpl.nasa.gov/
Aqua Home Page: http://aqua.gsfc.nasa.gov/
COMET Home Page: http://www.comet.ucar.edu/cometprogram.htm
MODIS Home Page: http://modis.gsfc.nasa.gov/
SPoRT Home Page: http://wwwghcc.msfc.nasa.gov
SPoRT MM5 Model Output: http://www.ghcc.msfc.nasa.gov/Model/model_mm5.html
SPoRT MM5 Modelling Schedule: http://wwwghcc.msfc.nasa.gov/sport/sport_modeling_schedule.html Symposium Survey Results:
http://wwwghcc.msfc.nasa.gov/sport/2002_symp_survey.html.
Symposium Web Page: http://wwwghcc.msfc.nasa.gov/sport/sport_meetings.html
References
Albers, S.A., J.A. McGinley, D.L. Birkenheuer, and J.R. Smart, 1996: The Local
Analysis and Pre-diction System (LAPS): Analyses of clouds, precipitation, and
temperature. Weather and Forecasting: Vol. 11, No. 3, pp. 273-287.
Baldwin, M.E., S. Lakshmivarahan, and J.S. Kain, 2001: Verification of Mesoscale
Features in NWP Models. Preprints, 9th Conf. on Mesoscale Processes, Ft. Lauderdale,
FL, Amer. Meteor. Soc., pp. 255-258.
Boldi, B., E. Williams, A. Matlin, M. Weber, S. Hodanish, D. Sharp, S. Goodman and R.
Raghavan, 1999: The Design and Evaluation of the Lightning Imaging Sensor Data
Application Display (LISDAD). Preprints, 19th Conf. on Severe Local Storms,
Minneapolis, MN, Amer. Meteor. Soc., pp. 631-634.
Bradshaw, T., R. Kilduf, R. McNeil, K. Pence, P. Hart, W. Lapenta, 2001: Experiences
from SCRAPE2000 – Summer Convective Rainfall in Alabama Prediction Experiment.
Preprints, 14th Conf. on Numerical Weather Prediction, Ft. Lauderdale, FL, Amer.
Meteor. Soc., pp. P2.1.
Case, J., J. Manobianco, T. Oram, T.Garner, P. Blottman, S. Spratt, 2002: Local Data
Integration over East-Central Florida Using the ARPS Data Analysis System. Weather
and Forecasting: Vol. 17, No. 1, pp. 3–26.

13
COMET, 2000: COMET Cooperative Project. Special Observing, Forecast and Warning
Tools in the Tennessee Valley and their Application to the End-to-End Warning Decision
Making Process. http://www.comet.ucar.edu/outreach/coopnow.htm.
Goodman, S. J., R. Raghavan, R. Ramachandran, D. Buechler, S. Hodanish, D. Sharp, E.
Williams, B. Boldi, A. Matlin, and M. Weber, 1999: Total Lightning and Radar Storm
Characteristics Associated with Severe Storms in Central Florida. Preprints, 19th Conf.
on Severe Local Storms, Minneapolis, MN, Amer. Meteor. Soc., pp. 639-642.
Hodanish, S., D. Sharp, E. Williams, B. Boldi, A. Matlin, M. Weber, S. Goodman and R.
Raghavan, 1999: Observations of Total Lightning Associated with Severe Convection
During the Wet Season in Central Florida. Preprints, 19th Conf. on Severe Local Storms,
Minneapolis, MN, Amer. Meteor. Soc., pp. 635-638.
Jedlovec, G. J., P. J. Meyer, A. R. Guillory, K. Stellman, and A. Limaye, 2002:
Intercomparison of CHARM data and WSR-88D storm integrated rainfall. Sixteenth
Conference on Hydrology, AMS, Orlando, 109-112.
Knupp, K.R., J. Walters, and E.W. McCaul, 2000: Doppler Profiler Observations of
Hurricane Georges at Landfall. Geophysical Research Letter, Vol. 27, No. 20, pp. 3361-
3364.
McCaul, E. W., J. Bailey, S. Goodman, R. Blakeslee, J. Hall, D. Buechler, and T.
Bradshaw, 2002: Preliminary results from the North Alabama Lightning Mapping Array,
Preprints, 21st Conf. on Severe Local Storms, Boston, MA, Am. Meteor. Soc., P11A.2.
McGinley, J.A., and J.R. Smart, 2001: On providing a cloud-balanced initial condition
for diabatic initialization. Preprints, 14th
Conf. On Numerical Weather Prediction, Ft.
Lauderdale, Amer. Meteor. Soc., P1.11.
McQueen, J., and P. Hirschberg, 2001: National Weather Service Local-scale Numerical
Weather Prediction Planning Workshop. National Weather Service, Office of Science
and Technology, Silver Spring, Maryland. pp. 1-12.
NESDIS, 2002: NWS/NESDIS Joint Review Results. NESDIS Office of Satellite Data
Processing and Distribution. http://www.osdpd.noaa.gov/PSB/EPS/icg/Joint_Rev4.html.
NOAA, 1999: Vision 2005 National Weather Service Strategic Plan for Weather, Water,
and Climate Services 2000-2005. U.S. Department of Commerce, National Oceanic and
Atmospheric Administration, National Weather Service, Silver Spring, Maryland. pp.
1-24.
Riordan, A.J., J.T. Anderson, S. Chiswell, 1995: Small-Scale Structure of a Coastal Front
as Revealed by Dual-Doppler Radar. Monthly Weather Review: Vol. 123, No. 3, pp. 622–
640.

14
Schultz, P. and S. Albers, 2001: The use of three-dimensional analyses of cloud attributes
for diabatic initialization of mesoscale models. Preprints, 14th Conf. on Numerical
Weather Prediction, Ft. Lauderdale, FL, Amer. Meteor. Soc., JP2.5A.
Thomas, R., P. Krehbiel, W. Rison, T. Hamlin, D. Boccippio, S. Goodman, and H.
Christian, 2000: Comparison of ground-based 3-dimensional lightning mapping
observations with satellite-based LIS observations in Oklahoma, Geophys. Res. Lett.,
Vol. 27, pp.1703-1706.
Tuttle, J. and R.Gall, 1999: A Single-Radar Technique for Estimating the Winds in
Tropical Cyclones. Bulletin of the American Meteorological Society: Vol. 80, No. 4, pp.
653–668.
Williams, E., B. Boldi, A. Matlin, M. Weber, S. Hodanish, D. Sharp, S. Goodman and R.
Raghavan, D. Buechler, 1999: The Behavior of Total Lightning Activity in Severe
Florida Thunderstorms. Atmospheric Research, Vol. 51, pp. 245-265.

15
Figure 1. Map of WFO HUN County Warning Area. (courtesy of Jason Burks, WFO
HUN)

16
Figure 2. Comparison of two different model solutions for the same precipitation event.
(courtesy of Baldwin et al. 2001)
OBSERVED FCST #1: SMOOTH
OBSERVED FCST #2: DETAILED
17
Figure 3. Statistical verification information for forecasts in Figure 2.
(courtesy of Baldwin et al. 2001)
Verification
Measure Equation
Forecast #1:
Smooth
Forecast #2:
Detailed
Mean absolute
error ∑
=
−=n
k
kk xfn
MAE1
1 0.157 0.159
RMS error ( )∑=
−=n
k
kk xfn
RMSE1
21 0.254 0.309
Bias xfBIAS = d 0.98 0.98
Threat score
(>0.45) ( )HOFHTS −+= 0.214 0.161
Equitable )( ChHOF
ChHETS
−−+
−= 0.170 0.102

18
Figure 4.
Conv. Init. Aviation Storm Type QPF Ptype
010%20%30%40%50%60%70%80%
% of surveys that included response
% of total responses
Top 5 Forecast Issues
• Conv. Init. = Convective Initiation
• QPF = Quantitative Precipitation Forecast
• Ptype = Precipitation Type

19
Figure 5.
Aviation QPF Add'l Data Convection Coordination Lightning
0
20%
40%
60%
80%
100%
% of surveys that included response
% of total responses
Issues Not Adequately Addressed By NWS Products or Services
• QPF = Quantitative Precipitation Forecast
• Add’l Data = Additional Data

20
Figure 6.
28.9% (A)
23.7% (B)
15.8% (C) 10.5% (D)
10.5% (E)
Enhanced Model Data (A)
Additional Satellite Data (B)
Lightning Fcsts (C)
High Resolution Graphics (D)
Additional Text Forecasts (E)
Percent of Total ResponsesProducts/Data Sets Needed to Address Issues

21
Figure 7.
87.5% (A)56.3% (B)
50% (C)
43.8% (D) 25% (E)
25% (F)
12.5% (G)
Conferences (A) Word of Mouth (B)
Reading Publications (C) Memos (D)
Web Sources (E) Local Training (F)
Resident Training (G)
Percent of Surveys That Included Response
Methods for New Product Introduction
22
Figure 8.
% of all responses % of surveys that included response
010%20%30%40%50%60%
Add'l Conferences and Symposiums
Better Local Office Training
Central Repository for Training Info
Email List Server
Better Methods of New Products and Services Introduction

23
Figure 9. Sample LMA Data Set from 03/30/02 (courtesy of Dr. Steve
Goodman/MSFC)
24
Figure 10. Total Lightning Flash Rate Tendency Relative to Tornado (courtesy of Dr.
Steve Goodman/MSFC)
Total Lightning Flash Rate Tendency Relative to Tornado
Updraft Intensifies
Vortex Spin-up

25
Figure 11. The model output from the Early Eta and the SPoRT MM5 compared to the
observed (stage II) 6-hour rainfall data. The SPoRT MM5 was able to better resolve the
location and magnitude of the precipitation axis in this case.
Figure 12. The 36 km CONUS domain of the MM5
SPoRT MM5 Observed (Stage II) Early Eta

26
Figure 12. Same as in Figure 11, except 12 hours later. Again, in this case, the SPoRT
MM5 provided a better precipitation forecast than the Early Eta.
SPoRT MM5 Observed (Stage II) Early Eta

27
Figure 13. CHARM network coverage map as of June 2002. (courtesy of
http://wwwghcc.msfc.nasa.gov/charm)

28
HYTOP
RADAR
NASHVILLE RADAR
4-5”
CHARM
Figure 14. Nashville and
Hytop storm integrated
rainfall totals on June 4-5,
2001 over Northern
Alabama. The CHARM
insert shows ground truth
validation data from a
local rainfall network.
Note that the dual
precipitation maximum is
not well resolved by either
radar, and that the
Nashville radar over
estimates the actual
intensity (less than 3.00”).
(Courtesy of Dr. Gary
Jedlovec/MSFC)

29
Figure 15. This true-color image of Tropical Storm Allison over the Southeastern United
States was acquired from MODIS on June 13, 2001 MODIS. Many cloud and convective
lines are evident as well as details of large convective systems. Red dots over Florida
indicate points of active wildfires as identified by high-resolution imagery.

30
Table 1. A Sample of Satellite Data and Products Applicable to Short-term Prediction
GOES MODIS AIRS OTHER GIFTS
Imager
calibrated radiances calibrated radiances,
natural and false
color composites
T(p) Ocean surface winds T(p)
insolation insolation q(p) Precipitation rates q(p)
Albedo albedo N(p) Total lightning N(p)
LST/SST LST, SST Winds (p)
Stability Stability
TPW TPW
cloud height Cloud products
Winds Vegetation state,
NDVI
wildfires Surface thermal
emissivity
Sounder Aerosols
T(p) Wildfires and smoke
Q(p) dust
Winds
Stability
TPW
Cloud height

31
Appendix 1.
2002 NASA-NWS Joint Symposium on Short-Term
Forecasting and the Convective Weather Warning
Process
Participant Survey
The organizers of the symposium have created this survey to gauge the interest
level, concerns and needs of the participants. We would very much like everyone
to fill out this survey as your responses may be critical in determining the direction
of future collaborative activities. Thank you for your time and effort in filling out
this survey.
Affiliation: NASA ____________ Media ____________
University ____________ Emergency Management ____________
NWS (Operations) ___________ Other (please specify) ____________
NWS (HQ) ________
1. From your perspective, what do you see as the top 5 short-term (0-12 hour)
forecast issues affecting your area or constituency? (i.e., convective initiation
timing, forecasting mode of convection, better precipitation forecasts, improved
aviation forecasts, etc.)
2. What types of products, services or data sets (i.e., satellite, radar, NWP, etc.) do
you currently utilize to address the issues listed above?
3. How do you envision that these current products and services could be
improved to better meet your needs?
4. Are there certain problems or issues that affect your local planning and
operations that you feel are not adequately addressed by NWS products or
services? (i.e., excessive lightning deaths, accurate wintertime model QPF, onset
of wintertime precip, etc.)

32
5. What type(s) of new products, services, or data sets would you like to see
developed in the future to address your local planning or operations? (i.e., higher
resolution NWP or satellite data, lightning warnings, etc.)
6. How do you (or can you) see the research and academia community better
helping to address these issues?
7. How are you currently introduced or exposed to new products, services, or
datasets? (Examples...publications, conferences, memos, Aword of mouth@)
8. From your perspective, how could you be better introduced to those products,
services or data sets?
9. As end users, would like you like to see more detailed verification information?
If so, what type? (Ex. verification by convective regime, storm type - MCS,
supercell, etc., model versus model, forecast vs model, etc.)
10. Satellite data is generally underutilized. What factor(s) do you feel limit its
utility (data access, scientific understanding, training limitations). From what you
hear about available satellite date from SpoRT, what do you see as most useful?
11. What one element or issue does the NWS need to address in order to increase
warning lead times and decrease false alarm ratios? (i.e. additional WES training,
science training, better spotter network)