BRIDGE DIAGNOSTICS, INC. - Structural Health Monitoring & Stress Load...
87
FIELD TESTING AND LOAD RATING REPORT: THE MILO ADVENTIST ACADEMY’S COVERED BRIDGE SUBMITTED TO: Rodney P. Kinney Associates, Inc. 16515 Centerfield Drive, Suite 101 Eagle River, AK 99577 907-694-2332 www.rpka.net SUBMITTED BY: BRIDGE DIAGNOSTICS, INC. 1995 57 th Court North, Suite 100 Boulder, CO 80301-2810 303.494.3230 www.bridgetest.com March 2013
Transcript of BRIDGE DIAGNOSTICS, INC. - Structural Health Monitoring & Stress Load...

FIELD TESTING AND LOAD RATING REPORT:
THE MILO ADVENTIST ACADEMY’S COVERED BRIDGE
SUBMITTED TO:
Rodney P. Kinney Associates, Inc. 16515 Centerfield Drive, Suite 101
Eagle River, AK 99577 907-694-2332
www.rpka.net
SUBMITTED BY:
BRIDGE DIAGNOSTICS, INC.
1995 57th
Court North, Suite 100
Boulder, CO 80301-2810
303.494.3230
www.bridgetest.com
March 2013

FIELD TEST AND LOAD RATING REPORT – MILO ADVENTIST ACADEMY BRIDGE: DAYS CREEK, OR II
EXECUTIVE SUMMARY
In January 2013, Bridge Diagnostics, Inc. (BDI) was contracted by Rodney P. Kinney
Associates, Inc. to perform diagnostic load testing on the Milo Adventist Academy Bridge over
the Umpqua River in Days Creek Oregon. This structure was load tested and analyzed to help
determine the participation of the kingpost A-frame system and to determine preliminary load
ratings for the structure. In addition, the effects of turnbuckle tension on the structure’s live-load
carrying capacity were examined.
During the field testing phase, the superstructure was instrumented with a combination of
strain transducers and tiltmeter rotation sensors. Once the structure was instrumented, controlled
load tests were performed with a 3-axle local fire truck along one centered lateral position. Data
obtained from the load tests was evaluated for quality and subsequently used to verify and
calibrate a finite-element model of the structure.
In general, the response data recorded during the load tests was found to be of good quality
and indicated no major signs of distress. The test data exhibited response magnitudes and shapes
typical of a two girder structure and of the multi-stringer approach structures. The following
notable observations were made from review of the load test data:
The kingpost and turnbuckle system was significantly activated by the test truck. Both
axial compressive stress and flexural stress were observed near the top of the kingpost.
The relative magnitude of the flexural stress was somewhat concerning because it may be
necessary to treat the kingpost struts as beam-columns rather than just compression
members. The initial load rating capacities were calculated based on compression
member specifications, however flexural and axial stress ratios were generated for
additional consideration.
Near the damaged girder section (section with a severely bent bottom flange), a
substantial amount of out-of plane bending was observed in the top flange. This indicated
a non-uniform stress profile across the compression flange which would cause one edge
to reach yield stress well before the theoretical moment capacity was reached. While this
was not considered in the initial load rating, information about the compression flange
stress profile has been provided to help determine if additional reduction factors should
be applied to the moment capacity.
Significant dynamic effects (20%) were observed during the normal speed test (5-7 mph).
However negligible dynamics were observed during the crawl speed tests (1-3 mph). This
observation indicates that if the heavier trucks cross at crawl speed, a much larger weight
can safely cross.
A quasi three-dimensional finite-element model of the structure was created using the
collected structural information, and subsequently calibrated until an acceptable match between
the measured and analytical responses was achieved. Because the structure was not highly
redundant, a good correlation between the measured and computed response was obtained fairly
quickly.
Load ratings for the standard HS-20 rating vehicle and the local fire and sawdust trucks were
performed according to the AASHTO Manual for Bridge Evaluation, 2011 Edition. The
controlling ratings are shown in Table 1, and the following conclusions were made from the
rating process:

FIELD TEST AND LOAD RATING REPORT – MILO ADVENTIST ACADEMY BRIDGE: DAYS CREEK, OR III
Load rating results were controlled by the ultimate flexural capacity of the girders near
midspan. Only the local fire truck crossing at crawl speed had a satisfactory load rating,
which indicated that with the structure in its current state only the fire truck can cross the
structure safely if it does so at crawl speed (1-3 mph).
A primary conclusion from the girder flexure ratings was that the dead-load responses
were much greater than the live-load responses. It was found that the bridge covering
accounted for approximately 30% of the dead-load, which greatly reduced the girders’
remaining live-load capacity.
The kingpost system was determined to be an important structural element and
effectively reduced the peak live-load girder moment by approximately 40%. While not
the critical rating component, the kingposts were found to have slightly deficient
compression capacity at the upper section with no cover-plates. A recommended retrofit
would be to extend the existing cover-plates to the ends and thereby increase the
compression capacity by over 40 percent.
Other than a 0.85 condition factor at the damaged girder section, no additional capacity
reductions or live-load amplifiers were applied to account for the observed bending
stresses on primary compression members. Further investigation and consideration may
be needed to account for bending effects in the kingpost and the top girder flange.
The approach span’s stringers have unsatisfactory ratings in their current state due to the
lack of mechanical attachment to the decking members or other lateral bracing of the top
flanges. Bracing the stringer top flanges at quarter points would increase the moment
capacity so that all examined vehicles would have sufficient load ratings.
In addition to the load ratings performed on the structure in its current condition, an
iterative analysis and rating process was performed in order to determine the effects of
tightening the turnbuckle and increasing the participation of the kingpost system. The
following was determined from this process:
It was found that by tightening the turnbuckle to 10 kips (which is approximately
equivalent to ¼” of turnbuckle adjustment) the sawdust truck could cross at crawl speed
(using reduced impact). With the turnbuckle tightened to this minimum level, the girders
had a satisfactory rating in flexure of 1.00.
Additionally, it was determined that if the turnbuckle was tightened to 30 kips of force
(~3/4” of turnbuckle tightening) that the sawdust truck had a higher overall live-load
carrying capacity, with the controlling rating factor at crawl speed of 1.11 for girder
flexure. It should be noted that at this level of kingpost system participation, the
turnbuckle rating was 1.37 for reduced impact. Since breaking of the turnbuckle is not a
ductile failure and therefore not desired, BDI considered this to be the maximum
recommended level of turnbuckle tightening.
Tensioning the turnbuckle to 10 kips would likely be very difficult without some external
load assistance (i.e. come-along between the girder and kingpost so that the turnbuckle
can be adjusted).
This report contains details regarding the instrumentation and load testing procedures, a
qualitative review of the load test data, a brief explanation of the modeling steps, and a summary
of the load rating methods and results.

FIELD TEST AND LOAD RATING REPORT – MILO ADVENTIST ACADEMY BRIDGE: DAYS CREEK, OR IV
Table 1 - Controlling load rating factors – Current Structural Condition.
RATING
VEHICLE
LOCATION/LIMITING
CAPACITY
CONTROLLING RATING
FACTOR
(FULL IMPACT)
CONTROLLING RATING
FACTOR
(REDUCED IMPACT)
HS-20
(Inventory)
Near Midspan / Girder
in Flexure 0.46 0.58
HS-20
(Operating)
Near Midspan / Girder
in Flexure 0.60 0.76
Local Fire
Truck
Near Midspan / Girder
in Flexure 0.93 1.18
Local
Sawdust
Truck
Near Midspan / Girder
in Flexure 0.74 0.94
Table 2 - Controlling load rating factors – With Kingpost Retrofit & Turnbuckle tightened
0.25” (10 kips).
RATING
VEHICLE
LOCATION/LIMITING
CAPACITY
CONTROLLING RATING
FACTOR
(FULL IMPACT)
CONTROLLING RATING
FACTOR
(REDUCED IMPACT)
HS-20
(Inventory)
Near Midspan / Girder
in Flexure 0.50 0.63
HS-20
(Operating)
Near Midspan / Girder
in Flexure 0.64 0.81
Local Fire
Truck
Near Midspan / Girder
in Flexure 1.01 1.28
Local
Sawdust
Truck
Near Midspan / Girder
in Flexure 0.79 1.00
Table 3 - Controlling load rating factors – With Kingpost Retrofit & Turnbuckle tightened
0.75” (30 kips).
RATING
VEHICLE
LOCATION/LIMITING
CAPACITY
CONTROLLING RATING
FACTOR
(FULL IMPACT)
CONTROLLING RATING
FACTOR
(REDUCED IMPACT)
HS-20
(Inventory)
Near Midspan / Girder
in Flexure 0.56 0.71
HS-20
(Operating)
Near Midspan / Girder
in Flexure 0.72 0.91
Local Fire
Truck
Near Midspan / Girder
in Flexure 1.13 1.43
Local
Sawdust
Truck
Near Midspan / Girder
in Flexure 0.88 1.11

FIELD TEST AND LOAD RATING REPORT – MILO ADVENTIST ACADEMY BRIDGE: DAYS CREEK, OR V
Submittal Notes:
This submittal includes the following files on CD:
1. Milo_Academy_Testing_Documents.pdf
This file provides pertinent details about the instrumentation plan and testing
scenarios/procedures.
2. BDI_Milo_Academy_Submittal_V3.pdf
This is the BDI report in “pdf” format. It contains details regarding the testing
procedures, provides a qualitative data evaluation, displays response histories for each
sensor, and discusses any notable observations and/or conclusions arising from the
testing process.
3. F&M_Milo_2.xlsx
This is the spreadsheet used to calculate the forces and moments induced by the test
truck. It contains the data processed in units of stress which are used to calculate the
observed moment and force histories at the instrumented sections. It also contains
envelope tables of the maximum and minimum force and moment values.
4. Milo_Processed_Data.xlsx
This spreadsheet contains data from all sensors from the selected crawl load test,
normal speed test, and envelope tables for each sensor. It also contains a legend that
describes each sensor location.
5. Covered_Span_Rating_Files
The output files contain detailed information regarding the applied load and
resistance factors, capacities, unfactored structural responses, and controlling load
rating results for each of the rated vehicles. The summary files contain the controlling
load rating results along with the controlling factored responses.
6. Approach_Spans_Rating_Files
The output files contain detailed information regarding the applied load and
resistance factors, capacities, unfactored structural responses, and controlling load
rating results for each of the rated vehicles. The summary files contain the controlling
load rating results along with the controlling factored responses.
FIELD TEST AND LOAD RATING REPORT – MILO ADVENTIST ACADEMY BRIDGE: DAYS CREEK, OR VI
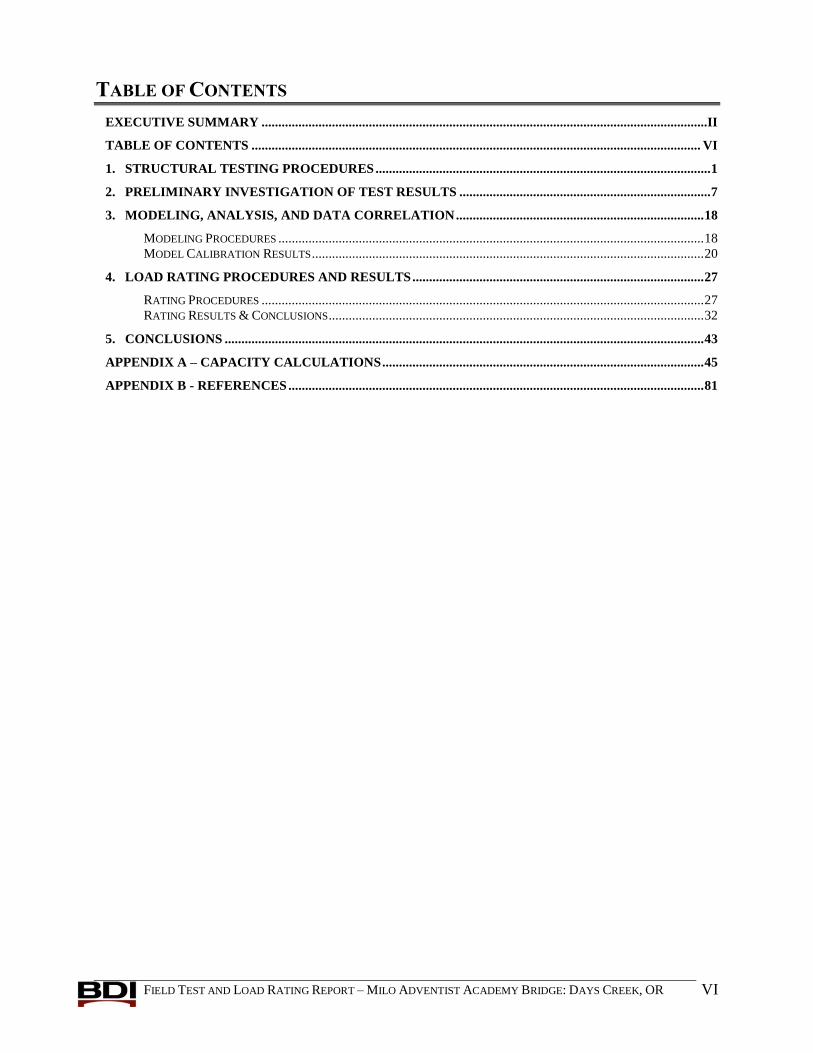
TABLE OF CONTENTS
EXECUTIVE SUMMARY .....................................................................................................................................II
TABLE OF CONTENTS ...................................................................................................................................... VI
1. STRUCTURAL TESTING PROCEDURES .................................................................................................... 1
2. PRELIMINARY INVESTIGATION OF TEST RESULTS ........................................................................... 7
3. MODELING, ANALYSIS, AND DATA CORRELATION .......................................................................... 18
MODELING PROCEDURES ............................................................................................................................... 18 MODEL CALIBRATION RESULTS ..................................................................................................................... 20
4. LOAD RATING PROCEDURES AND RESULTS ....................................................................................... 27
RATING PROCEDURES .................................................................................................................................... 27 RATING RESULTS & CONCLUSIONS ................................................................................................................ 32
5. CONCLUSIONS ............................................................................................................................................... 43
APPENDIX A – CAPACITY CALCULATIONS ................................................................................................ 45
APPENDIX B - REFERENCES ............................................................................................................................ 81

FIELD TEST AND LOAD RATING REPORT - MILO ADVENTIST ACADEMY BRIDGE: DAYS CREEK, OR 1
1. STRUCTURAL TESTING PROCEDURES
The Milo Academy Covered Bridge was a 132’ through girder structure that carries one lane
of private traffic over the Umpqua River in Days Creek, OR. The covered bridge’s superstructure
was made up of two 6’-1” deep plate girders, bailey transom floor-beams, built-up stringer tee
members, and a king post system comprised of bailey transom members and a 1.5” rod
turnbuckle. The deck was comprised of 4”x12” timber planks and two steel runner plates. In
addition to the covered span, three 20’ approach spans were present east of the covered span.
These approach spans consisted of 5 bailey type transom stringers and the same decking as the
covered span. All of the important readily-available geometric details were verified during the
field visit; however, BDI did not perform an in-depth visual inspection of the structure or a full
non-destructive evaluation (NDE).
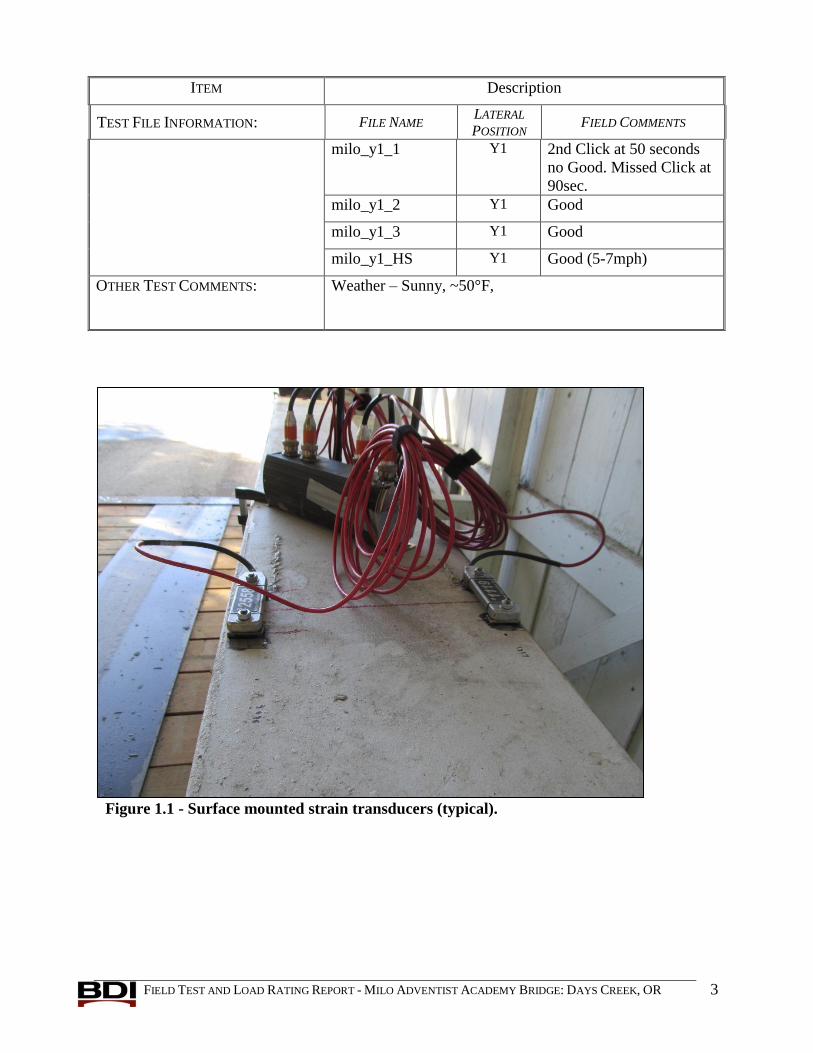
The structure, including the approach spans, was instrumented with 65 reusable, surface-
mount strain transducers (Figure 1.1 through Figure 1.4) and 4 tiltmeter rotation sensors (Figure
1.5). The final instrumentation plans, including sensor locations and IDs, have been provided in
the attached drawings labeled “Milo_Academy_Testing_Documents.pdf”. Ropes access
(SPRAT) was used to install some of the sensors on the covered span.
Once the instrumentation was installed, a series of diagnostic load tests was completed with
the test truck traveling at crawl speed (1-3 mph). During testing, data was recorded on all
channels at sample rate of 40 Hz as the test vehicle (3-axle fire truck) crossed the structure in the
westbound direction along a centered lateral position, referred to as Path Y1 (further described in
the attached testing documents). The truck’s longitudinal position was wirelessly tracked so that
the response data could later be viewed as both a function of time and vehicle position. In
addition to the crawl speed tests, one load test with the test truck traveling at 5-7 mph was
performed to evaluate the dynamics observed at the normal crossing speed.
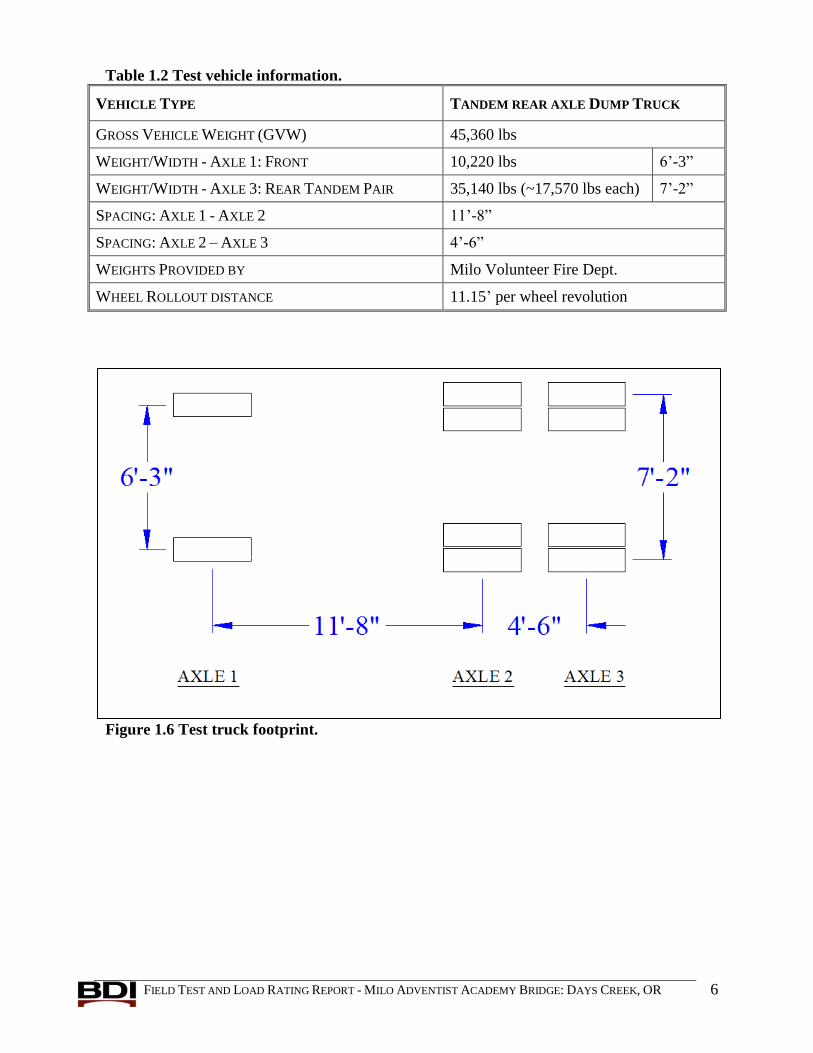
Information specific to the load tests can be found in Table 1.1. The test vehicle’s gross
weight, axle weights, and wheel rollout distance (required for tracking its position along the
structure) are provided in Table 1.2. A vehicle “footprint” is also shown in Figure 1.6. The
vehicle weights were obtained from certified scales at a local truck stop, and all vehicle
dimensions were measured in the field at the time of testing.
BDI would like to thank Rodney P. Kinney Associates for their help in scheduling, planning,
and organizing the testing project. BDI would also like to thank the Milo Adventist Academy
for their support during this project.

FIELD TEST AND LOAD RATING REPORT - MILO ADVENTIST ACADEMY BRIDGE: DAYS CREEK, OR 2
Table 1.1 Structure description & testing info.
ITEM Description
STRUCTURE NAME Milo Adventist Academy Covered Bridge
BDI Project Number 121201-OR
TESTING DATE January 17, 2013
CLIENT’S STRUCTURE ID # Milo
LOCATION/ROUTE Over the Umpqua River/ Access Drive / Milo Adventist
Academy
STRUCTURE TYPE Two Built-Up Girder Bridge with Covering & Wood deck
with multi-stringer approach spans
TOTAL NUMBER OF SPANS 4
SPAN LENGTHS Covered Bridge span - 132’
Approach spans -20’
SKEW 0°
STRUCTURE/ROADWAY WIDTHS Structure: 18’-3” / Roadway: 13’-0”
WEARING SURFACE 30”x 3/8” plate steel runners over 4”x12” timbers
OTHER STRUCTURE INFO N/A
SPANS TESTED 3
TEST REFERENCE LOCATION
(BOW) (X=0,Y=0)
South-east corner of the first approach span structure along
the inside edge of the curb
TEST VEHICLE DIRECTION Westbound
TEST BEGINNING POINT Front axle 10 ft east of test reference location (BOW)
LOAD POSITIONS Path Y1 – Driver’s side wheel 3’-4” from BOW
(Centered along bridge)
NUMBER/TYPE OF SENSORS - 65 Strain Transducers
- 4 Tiltmeters
SAMPLE RATE 40 Hz
NUMBER OF TEST VEHICLES 1
STRUCTURE ACCESS TYPE Ropes (SPRAT)
STRUCTURE ACCESS PROVIDED BY Bridge Diagnostics Inc.
TRAFFIC CONTROL PROVIDED BY Milo Volunteer Fire Department
TOTAL FIELD TESTING TIME 2 day
ADDITIONAL NDT INFO N/A
FIELD TEST AND LOAD RATING REPORT - MILO ADVENTIST ACADEMY BRIDGE: DAYS CREEK, OR 3
ITEM Description
TEST FILE INFORMATION: FILE NAME LATERAL
POSITION FIELD COMMENTS
milo_y1_1 Y1 2nd Click at 50 seconds
no Good. Missed Click at
90sec.
milo_y1_2 Y1 Good
milo_y1_3 Y1 Good
milo_y1_HS Y1 Good (5-7mph)
OTHER TEST COMMENTS: Weather – Sunny, ~50°F,
Figure 1.1 - Surface mounted strain transducers (typical).

FIELD TEST AND LOAD RATING REPORT - MILO ADVENTIST ACADEMY BRIDGE: DAYS CREEK, OR 4
Figure 1.2 - Strain transducers attached to Turnbuckle Stud (typical).
Figure 1.3 - Sensors attached to A-frame and Turnbuckle Stud (typical).

FIELD TEST AND LOAD RATING REPORT - MILO ADVENTIST ACADEMY BRIDGE: DAYS CREEK, OR 5
Figure 1.4 – Strain Transducers attached to Approach Span Stringers (typical).
Figure 1.5 - Tiltmeters attached near centerline of support (typical).
FIELD TEST AND LOAD RATING REPORT - MILO ADVENTIST ACADEMY BRIDGE: DAYS CREEK, OR 6
Table 1.2 Test vehicle information.
VEHICLE TYPE TANDEM REAR AXLE DUMP TRUCK
GROSS VEHICLE WEIGHT (GVW) 45,360 lbs
WEIGHT/WIDTH - AXLE 1: FRONT 10,220 lbs 6’-3”
WEIGHT/WIDTH - AXLE 3: REAR TANDEM PAIR 35,140 lbs (~17,570 lbs each) 7’-2”
SPACING: AXLE 1 - AXLE 2 11’-8”
SPACING: AXLE 2 – AXLE 3 4’-6”
WEIGHTS PROVIDED BY Milo Volunteer Fire Dept.
WHEEL ROLLOUT DISTANCE 11.15’ per wheel revolution
Figure 1.6 Test truck footprint.

FIELD TEST AND LOAD RATING REPORT - MILO ADVENTIST ACADEMY BRIDGE: DAYS CREEK, OR 7
2. PRELIMINARY INVESTIGATION OF TEST RESULTS
All of the field data was examined graphically to provide a qualitative assessment of the
structure's live-load response. Some indicators of data quality include reproducibility between
tests along identical truck paths, elastic behavior (strains returning to zero after truck crossing),
and any unusual-shaped responses that might indicate nonlinear behavior or possible gage
malfunctions. This process can provide a significant amount of insight into how a structure
responds to live-load, and is often extremely helpful in performing an efficient and accurate
structural analysis.
RESPONSES AS A FUNCTION OF LOAD POSITION: Manual markers or “Clicks”, representing a
single rotation of the test truck’s front driver’s side wheel, were inserted into the data so that
the corresponding strain and rotation data could be presented as a function of vehicle
position. This step was crucial during the model calibration process since it allowed the
analysis engineer to easily compare the measured and computed responses as the truck loads
moved across the structure. Please note that the test reference location (denoted at
“Beginning of World” or “BOW) was located at the bridge’s east expansion joint of the
approach spans and corresponds to the 0 ft load position in provided figures.
Once all data was processed as a function of load position, one file was selected as having the
best apparent quality. Table 2.1 provides a list of the selected data. Please note that the
selected data was used to determine the response envelopes for all gages.
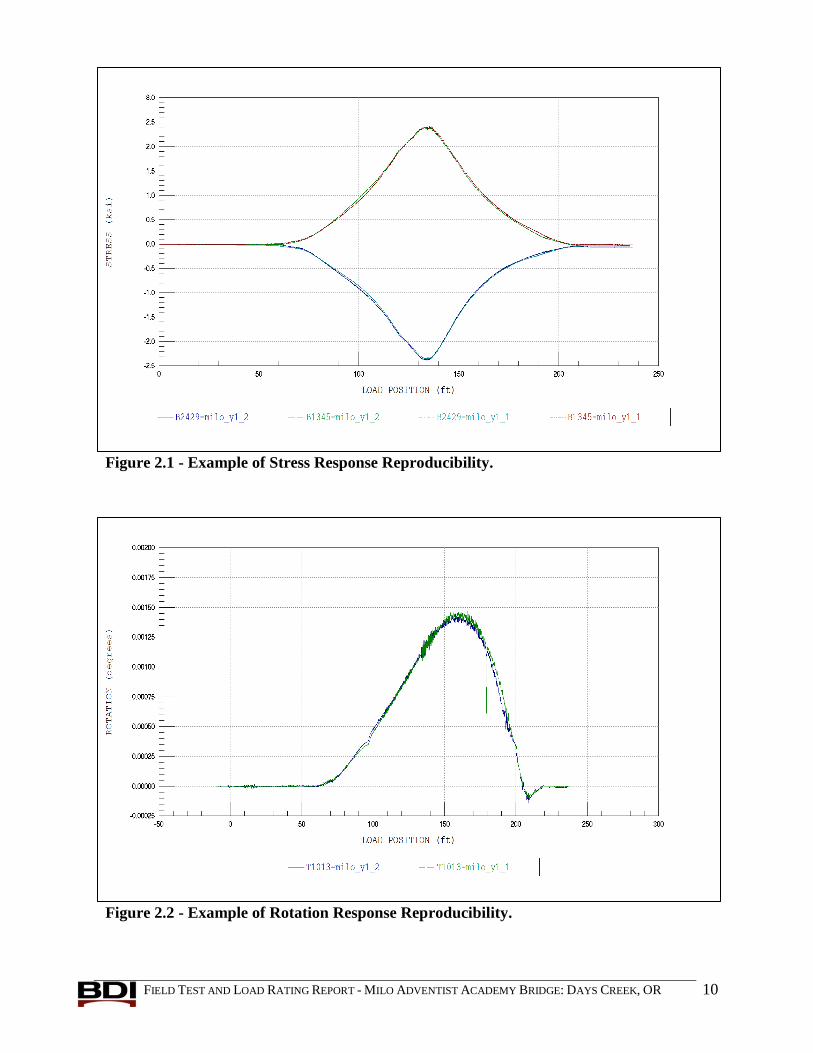
REPRODUCIBILITY AND LINEARITY OF RESPONSES: The structural responses from identical tests
were very reproducible as shown in Figure 2.1 and Figure 2.2. In addition, all strains
appeared to be linear with respect to magnitude and truck position, and all strains returned to
nearly zero, indicating that the structure was acting in a linear-elastic manner. The majority
of the response histories had a similar degree of reproducibility and linearity, indicating that
the data was of good quality.
LATERAL LOAD DISTRIBUTION: When evaluating a bridge for the purpose of developing a load
rating, the bridge’s ability to laterally distribute load is an essential characteristic to quantify.
Lateral distribution of the approach spans can easily be observed by plotting the responses
from an entire lateral cross-section. Figure 2.3 displays the corresponding peak midspan
strains of an approach span along its cross-section. The response values shown in these
figures correspond to the longitudinal load positions producing the maximum midspan
responses for each truck path. All five stringers were active in resisting the truck load with
the majority of resistance coming from the three interior stringers.
END-RESTRAINT BEHAVIOR OBSERVED IN GIRDER NEAR SUPPORTS: The structural responses
measured in the girders near the support locations showed significant end-restraint, as shown
in Figure 2.4. This end-restraint was observed in the curved response history and reversal of
flexure (negative moment) after the truck had past the sensors. Response histories from a true
simple support would appear as straight lines returning to zero when the truck reached the
end of the bridge. The combination of negative moment and net compression in the girder
section indicated the end-restraint was due to resistance of horizontal and rotational motion
of the girder’s bottom flange. This condition was likely due to the long bearing length and
embedment/connection of the girder ends to the abutment concrete and adjacent stringers,
and was considered during the modeling of the structure.

FIELD TEST AND LOAD RATING REPORT - MILO ADVENTIST ACADEMY BRIDGE: DAYS CREEK, OR 8
OBSERVED DYNAMICS DURING NORMAL SPEED TEST: The structural responses measured in the
girders during the normal speed test contained dynamic responses that were approximately
20% of the static responses, as shown in Figure 2.5. This observation was important for two
reasons. First, it showed that when the test vehicle crossed the bridge at normal speed a
typical impact factor was observed, which increased the load effect by around 20% during
testing. Secondly, it illustrated that the dynamic response could be eliminated when the fire
truck crossed at crawl speed. Therefore, if the heavier trucks cross at crawl speed (1-2 mph)
it is possible to consider a reduced dynamic load allowance for rating.
OBSERVED OUT-OF-PLANE BENDING EFFECTS OF THE DAMAGED GIRDER SECTION: Near the
damaged girder section (section with a significantly bent bottom flange), a substantial
amount of lateral bending was observed in both flanges. This means axial stresses across the
flanges were not uniform as shown in Figure 2.6. This was not a concern for the bottom
flange, which was in tension, because yielding would result in a straightening effect. Local
and asymmetrical yielding of the top flange could potentially lead to greater lateral
displacement and greater flexural stresses. While the top flange is braced against buckling
there is a potential for a reduced moment capacity. To quantify this effect, the following ratio
based on the recorded load test data was calculated at the worst case location:
Where:
GIRDER = Bending stress to Total Stress Ratio = 0.45
TopFlangeBendingPlaneofOut .... = Peak out-of-plane bending stress in top flange = 1.84 ksi
TopFlangenCompressio . = Peak average compressive flexural stress in top flange = 2.29 ksi
This ratio shows that the lateral bending stress increased the compressive stress by 45% on
one edge while decreasing the stress on the opposite edge by the same amount. It should be
noted that this bending stress is likely due to both the damaged flange and the floorbeam-
girder interaction. With perfect lateral bracing this effect would not be an issue, however any
ability for the flange to move laterally could cause the lateral bending effect to increase and
thereby reduce the overall compressive capacity of the top flange and thereby reduce the
girder moment capacity. Other than a 0.85 condition factor, no other capacity reduction or
load amplification was considered in the preliminary load rating. The quality of the lateral
bracing should be considered in determining if this capacity reduction is sufficient.
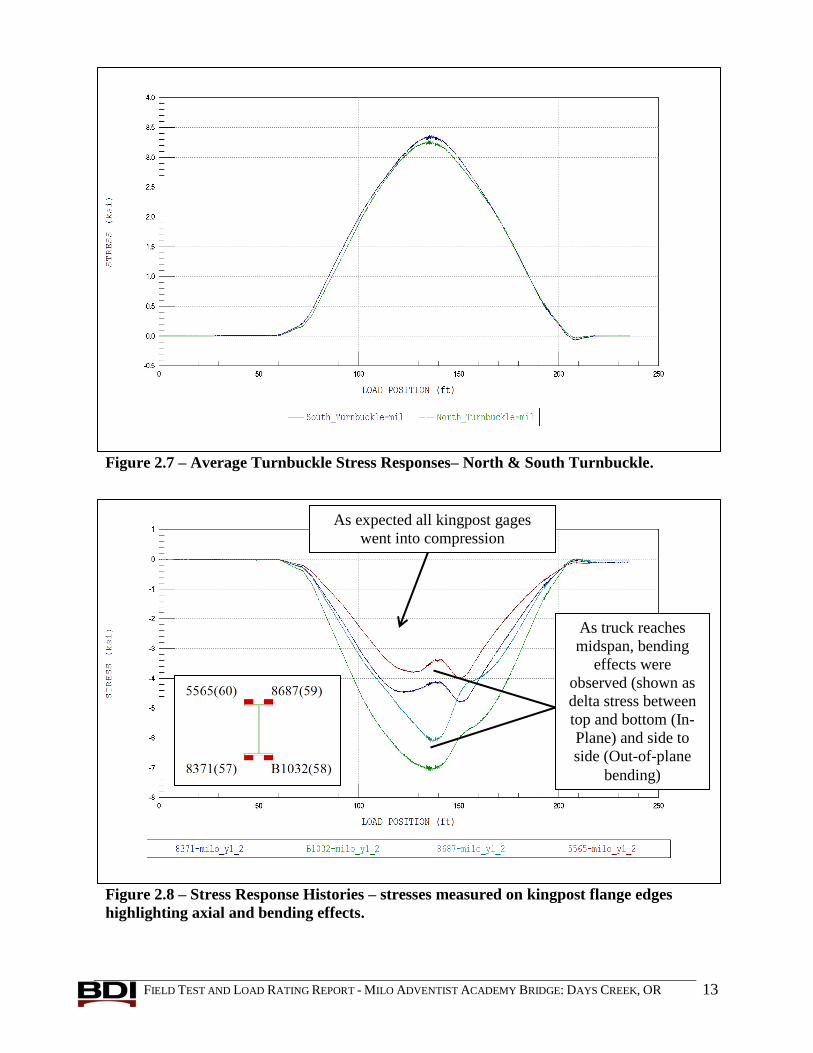
KINGPOST MEMBER & TURNBUCKLE LIVE-LOAD STRESSES: The responses measured on the
kingpost members and turnbuckle rods indicated this system was in fact activated by the test
truck. Figure 2.7 shows the average stress from the two gages installed on both turnbuckles
as a function of truck position. Figure 2.8 shows the stress histories recorded on the top and
bottom flange edges, indicating that live-load induced both compression and significant
biaxial bending in the kingpost. To quantify the bending effects, a ratio of the biaxial flexural
stresses and the total stress were computed as shown in the following equation:
BendingPlaneInBendingPlaneofOutAxial
BendingPlaneInBendingPlaneofOut
KINGPOST
.....
.....
TopFlangeBendingPlaneofOutTopFlangenCompressio
TopFlangeBendingPlaneofOut
GIRDER
.....
....

FIELD TEST AND LOAD RATING REPORT - MILO ADVENTIST ACADEMY BRIDGE: DAYS CREEK, OR 9
Where:
KINGPOST = Bending stress based reduction factor = 0.37
Axial = Peak average compressive stress in top section of kingpost = 4.17 ksi
BendingPlaneofOut ... = Peak out-of-plane bending stress in top section of kingpost = 1.93 ksi
BendingPlaneIn .. = Peak in-plane bending stress in top section of kingpost = 0.52 ksi
This ratio shows that the bending stresses made up 37% of the total stress induced at one
outer edge of a kingpost cross-section (section without cover-plates). For the preliminary
load ratings the kingpost was treated as a compression member primarily because the
analysis did not compute significant flexure. The level of observed bending stress suggests
that some type of capacity reduction or load amplification may be warranted due to the
combined stress conditions.
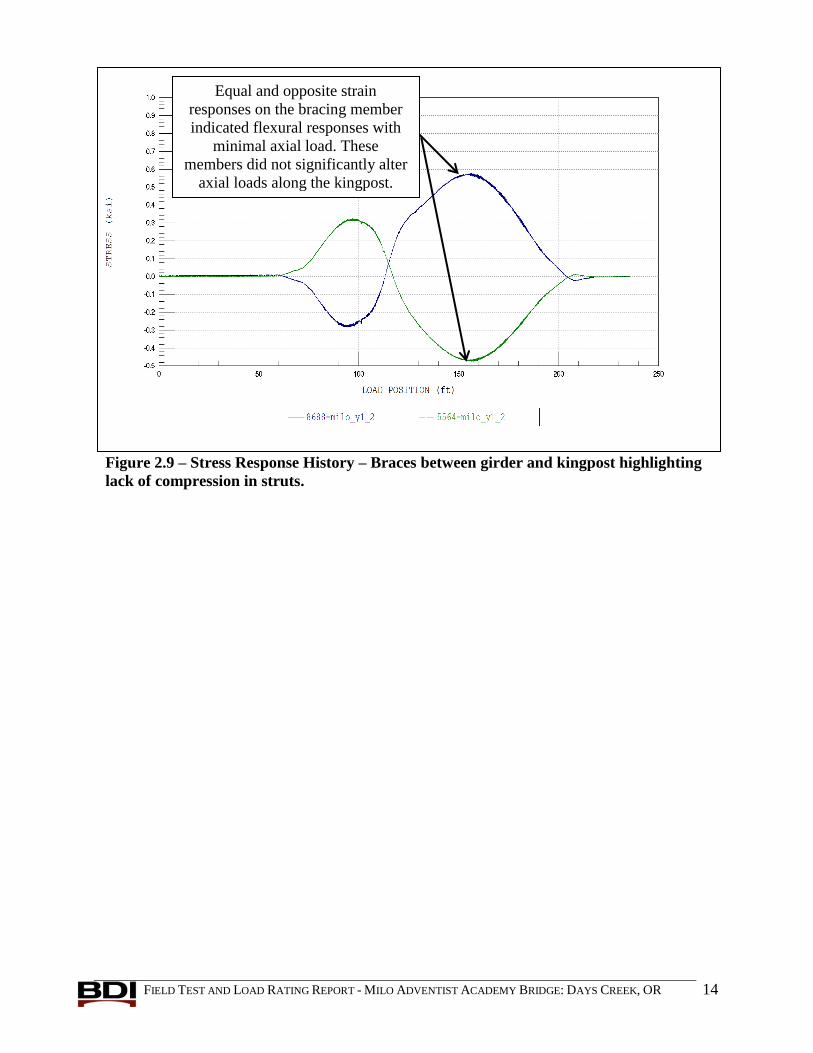
BENDING OBSERVED IN KINGPOST BRACES: The responses recorded on the thin braces between
the girder and kingposts were found to indicate that these members were acting as brace
points but did not receive significant axial loads. Therefore the braces did not alter the axial
load along the length of the kingposts. Figure 2.9 shows responses of a brace gage pair that
primarily measured in-plane bending (depicted by the responses of the gages on either side of
the strut being essentially equal and opposite of each other).
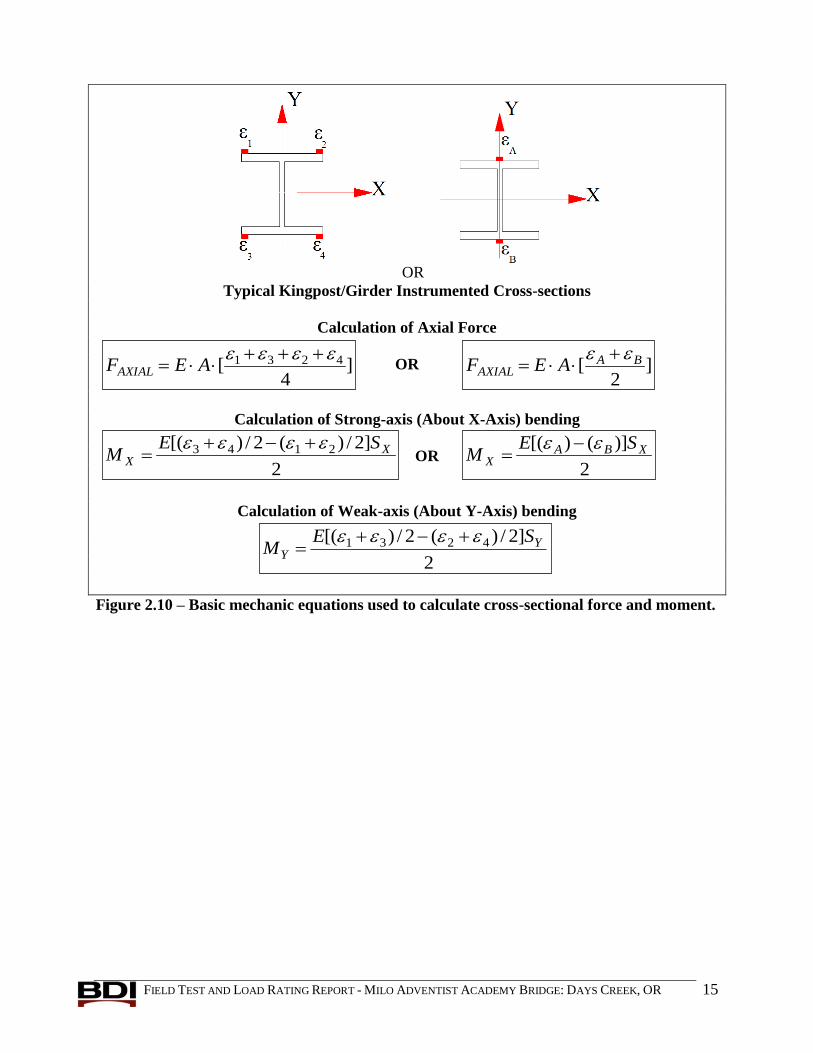
MOMENTS AND FORCES CALCULATED FROM LOAD TEST DATA: Since all of the measurements
were made on steel members, all strain measurements were converted to stress assuming a
Young’s modulus of 29,000ksi.These stress values were then applied to the various section
properties to compute axial force and flexural moment induced by the test truck as shown
Figure 2.10. These member actions were calculated as reference to show the level of induced
load in each of the selected instrumented sections. A Microsoft Excel spreadsheet, containing
the moments and forces calculated using the selected data, has been attached to this report as
reference. Because the measured member forces were limited to the instrumentation points,
bridge load ratings were based on a field-verified model where responses could be obtained
throughout the structure.
As previously stated, all test data was initially processed and assessed for quality. Then, one set
of test data for each truck path was selected for having the best apparent quality. This selected
data was then used to briefly calibrate the finite-element (FE) model of the structure, which was
in turn used to produce the load ratings. Table 2.1 provides a list of the data file that was used in
the FE analysis.
Table 2.1 Selected truck path file information.
TRUCK PATH SELECTED DATA FILE
Y1 milo_y1_2.dat
FIELD TEST AND LOAD RATING REPORT - MILO ADVENTIST ACADEMY BRIDGE: DAYS CREEK, OR 10
Figure 2.1 - Example of Stress Response Reproducibility.
Figure 2.2 - Example of Rotation Response Reproducibility.

FIELD TEST AND LOAD RATING REPORT - MILO ADVENTIST ACADEMY BRIDGE: DAYS CREEK, OR 11
Figure 2.3 - Lateral Load Distribution observed in Maximum Strain Responses.
Figure 2.4 – Strain Response History – Girder near support - Highlighting observed end-
restraint behavior.
Curved response shape denoting
end-restraint
Theoretical straight response shape
that would denote simple support

FIELD TEST AND LOAD RATING REPORT - MILO ADVENTIST ACADEMY BRIDGE: DAYS CREEK, OR 12
Figure 2.5 – Strain Response Comparison –Girder bottom flange near midspan -
Highlighting observed dynamic behavior.
Figure 2.6 – Stress Response History – Top flange stress highlighting out-of-plane
bending induced by live-load.
The difference
between stresses
on top flange was
equal to twice the
out-of-plane
bending stress
Observed dynamics
during normal speed
crossing (blue response)
were found to be
approximately 20%
FIELD TEST AND LOAD RATING REPORT - MILO ADVENTIST ACADEMY BRIDGE: DAYS CREEK, OR 13
Figure 2.7 – Average Turnbuckle Stress Responses– North & South Turnbuckle.
Figure 2.8 – Stress Response Histories – stresses measured on kingpost flange edges
highlighting axial and bending effects.
As expected all kingpost gages
went into compression
As truck reaches
midspan, bending
effects were
observed (shown as
delta stress between
top and bottom (In-
Plane) and side to
side (Out-of-plane
bending)
FIELD TEST AND LOAD RATING REPORT - MILO ADVENTIST ACADEMY BRIDGE: DAYS CREEK, OR 14
Figure 2.9 – Stress Response History – Braces between girder and kingpost highlighting
lack of compression in struts.
Equal and opposite strain
responses on the bracing member
indicated flexural responses with
minimal axial load. These
members did not significantly alter
axial loads along the kingpost.
FIELD TEST AND LOAD RATING REPORT - MILO ADVENTIST ACADEMY BRIDGE: DAYS CREEK, OR 15
OR
Typical Kingpost/Girder Instrumented Cross-sections
Calculation of Axial Force
OR
Calculation of Strong-axis (About X-Axis) bending
OR
Calculation of Weak-axis (About Y-Axis) bending
Figure 2.10 – Basic mechanic equations used to calculate cross-sectional force and moment.
2
]2/)(2/)[( 4231 YY
SEM
]4
[ 4231 AEFAXIAL
2
]2/)(2/)[( 2143 XX
SEM
]2
[ BAAXIAL AEF
2
)]()[( XBAX
SEM

FIELD TEST AND LOAD RATING REPORT - MILO ADVENTIST ACADEMY BRIDGE: DAYS CREEK, OR 16
Table 2.2 – North Girder Section –Axial Force and Bending Moment Envelope.
MEMBER DESIGNATION MEMBER DESCRIPTION VALUE
DESCRIPTION AXIAL FORCE
(KIPS)
IN-PLANE BENDING
(KIP-IN)
OUT-OF-PLANE
BENDING (KIP-IN)
North Girder Section J-J Minimum -17.6 -701.8 N/A
Maximum 1.6 491.6 N/A
North Girder Section L-L Minimum -16.8 -55.4 -26.2
Maximum 7.1 2643.6 2.8
North Girder Section M-M Minimum -20.2 -8.6 N/A
Maximum 3.0 3647.1 N/A
North Girder Section N-N Minimum -18.3 -192.8 N/A
Maximum 0.5 795.5 N/A
North Kingpost Section P-P
(Cover Plate)
Minimum -27.5 -11.7 N/A
Maximum 0.0 0.8 N/A
North Kingpost Section Q-Q
(No Cover Plate)
Minimum -33.3 -13.0 -0.1
Maximum 0.0 0.4 4.2
North Kingpost
Turnbuckle Turnbuckle
Minimum -0.1 N/A N/A
Maximum 5.8 N/A N/A
FIELD TEST AND LOAD RATING REPORT - MILO ADVENTIST ACADEMY BRIDGE: DAYS CREEK, OR 17
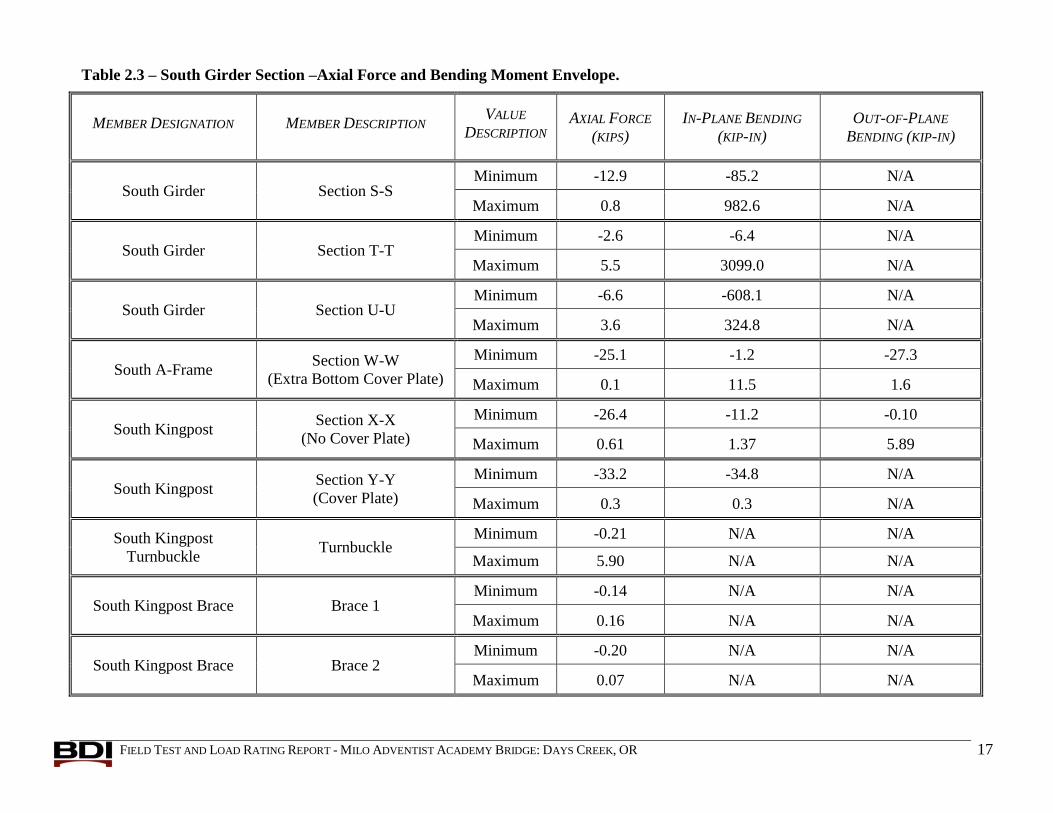
Table 2.3 – South Girder Section –Axial Force and Bending Moment Envelope.
MEMBER DESIGNATION MEMBER DESCRIPTION VALUE
DESCRIPTION AXIAL FORCE
(KIPS)
IN-PLANE BENDING
(KIP-IN)
OUT-OF-PLANE
BENDING (KIP-IN)
South Girder Section S-S Minimum -12.9 -85.2 N/A
Maximum 0.8 982.6 N/A
South Girder Section T-T Minimum -2.6 -6.4 N/A
Maximum 5.5 3099.0 N/A
South Girder Section U-U Minimum -6.6 -608.1 N/A
Maximum 3.6 324.8 N/A
South A-Frame Section W-W
(Extra Bottom Cover Plate)
Minimum -25.1 -1.2 -27.3
Maximum 0.1 11.5 1.6
South Kingpost Section X-X
(No Cover Plate)
Minimum -26.4 -11.2 -0.10
Maximum 0.61 1.37 5.89
South Kingpost Section Y-Y
(Cover Plate)
Minimum -33.2 -34.8 N/A
Maximum 0.3 0.3 N/A
South Kingpost
Turnbuckle Turnbuckle
Minimum -0.21 N/A N/A
Maximum 5.90 N/A N/A
South Kingpost Brace Brace 1 Minimum -0.14 N/A N/A
Maximum 0.16 N/A N/A
South Kingpost Brace Brace 2 Minimum -0.20 N/A N/A
Maximum 0.07 N/A N/A
FIELD TEST AND LOAD RATING REPORT - MILO ADVENTIST ACADEMY BRIDGE: DAYS CREEK, OR 18
3. MODELING, ANALYSIS, AND DATA CORRELATION
This section briefly describes the methods and findings of the Milo Academy Bridge
modeling procedures. A list of modeling and analysis parameters specific to this bridge is
provided in Table 3.1.
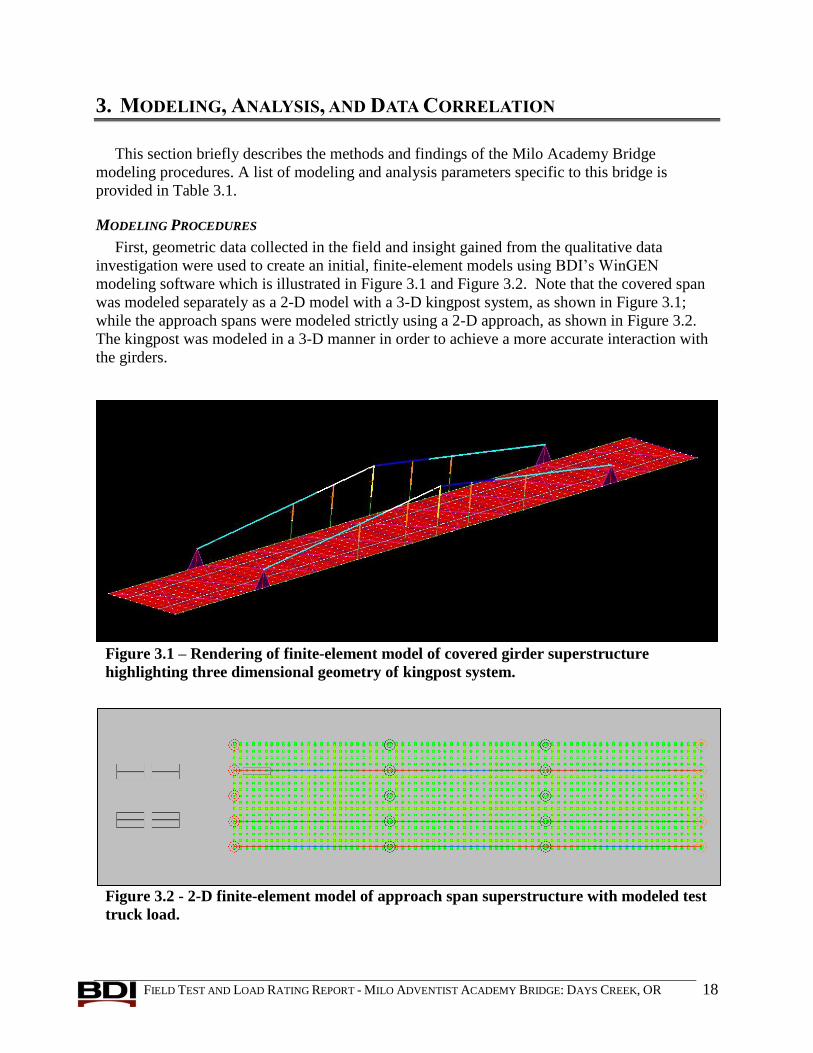
MODELING PROCEDURES
First, geometric data collected in the field and insight gained from the qualitative data
investigation were used to create an initial, finite-element models using BDI’s WinGEN
modeling software which is illustrated in Figure 3.1 and Figure 3.2. Note that the covered span
was modeled separately as a 2-D model with a 3-D kingpost system, as shown in Figure 3.1;
while the approach spans were modeled strictly using a 2-D approach, as shown in Figure 3.2.
The kingpost was modeled in a 3-D manner in order to achieve a more accurate interaction with
the girders.
Figure 3.1 – Rendering of finite-element model of covered girder superstructure
highlighting three dimensional geometry of kingpost system.
Figure 3.2 - 2-D finite-element model of approach span superstructure with modeled test
truck load.

FIELD TEST AND LOAD RATING REPORT - MILO ADVENTIST ACADEMY BRIDGE: DAYS CREEK, OR 19
Once the initial models were created, the load test procedures were reproduced using BDI’s
WinSAC structural analysis and data correlation software. This was done by moving a two-
dimensional “footprint” of the test truck across the model in consecutive load cases that
simulated the designated truck path used in the field, as shown in Figure 3.2. The analytical
responses of this simulation were then compared to the field responses to validate the model’s
basic structure and to identify any gross modeling deficiencies.
The models were then briefly calibrated until an acceptable match between the measured and
analytical responses was achieved. This calibration involved an iterative process of optimizing
material properties and boundary conditions until they were realistically quantified. In the case
of these structures, the majority of the calibration effort was spent modeling the observed bearing
conditions. Please note that the goal of this calibration process was to ensure that model was
accurate and somewhat conservative in simulating the responses under the fire truck; given that
some of the factors lowering the induced load, like the observed end-restraint, could not be fully
reliable upon at the ultimate strength state.
Table 3.1 Analysis and model details.
ANALYSIS TYPE - Linear-elastic finite element - stiffness method.
MODEL
GEOMETRY
- Approach Spans: 2D composed of shell elements, frame elements, and springs.
- Covered Bridge: 3D composted of shell frame elements
NODAL
LOCATIONS
- Nodes placed at the ends of all frame elements.
- Nodes placed at all four corners of each shell element.
MODEL
COMPONENTS
- Shell elements representing the wearing surface and the connecting elements
between the girder and the kingpost.
- Frame elements representing the girders, stringers, floor-beams, kingposts, and
cross-frames.
- Springs representing the bearing conditions at supports.
LIVE-LOAD - 2-D footprint of test truck consisting of 10 vertical point loads. Truck paths
simulated by series of load cases with truck footprint moving at 1.5 ft increments
along a straight path.
DEAD-LOAD - Self-weight of structure, including the wooden components of the covered span.
TOTAL NUMBER
OF RESPONSE
COMPARISONS
- 61 strain gage locations x 186 load positions = 11,346 strain comparisons
- 4 rotation gage locations x 186 load positions = 744 displacement comparisons
COVERED SPAN
MODEL
STATISTICS
- 899 Nodes
- 1406 Elements
- 16 Cross-section/Material types
- 108 Load Cases
- 53 Gage locations
APPROACH SPAN
MODEL
STATISTICS
- 1482 Nodes
- 1955 Elements
- 9 Cross-section/Material types
- 78 Load Cases
- 12 Gage locations

FIELD TEST AND LOAD RATING REPORT - MILO ADVENTIST ACADEMY BRIDGE: DAYS CREEK, OR 20
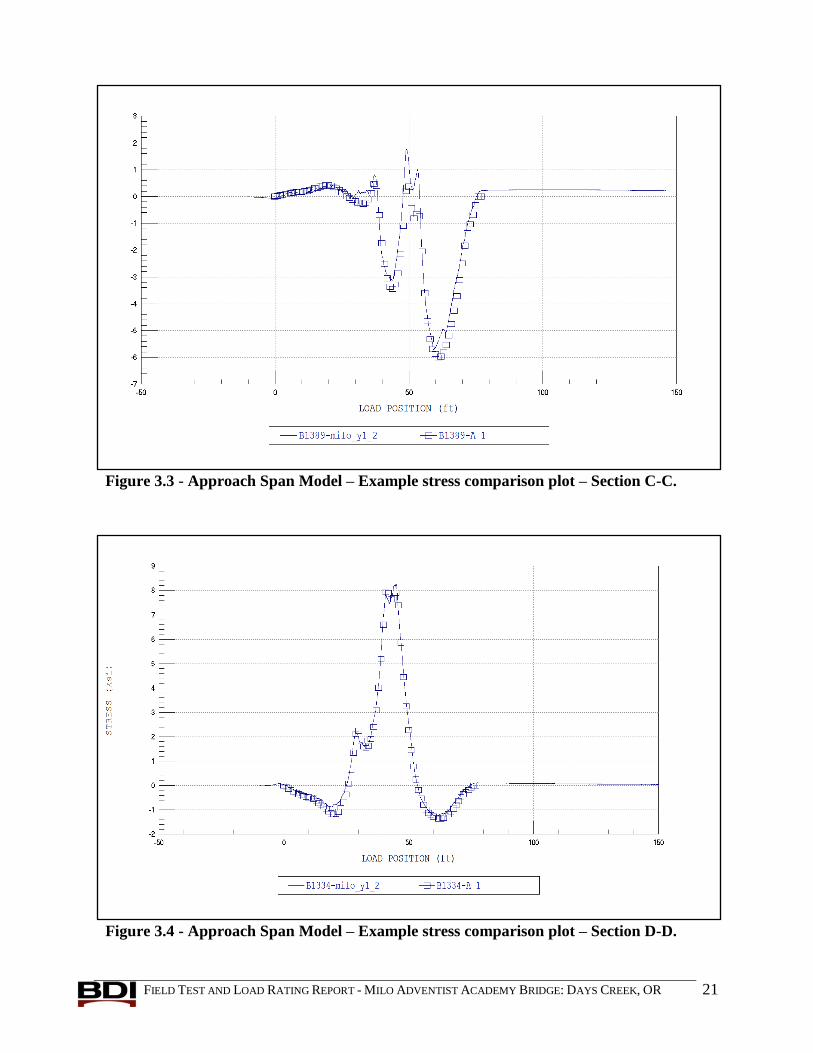
MODEL CALIBRATION RESULTS
Following the optimization procedures, the final model produced 0.968 and 0.982 correlations
with the main span and approach spans, respectively. The main-span model did an excellent job
of simulating the primary flexure and axial responses of all members but could not reproduce the
local bending behavior observed in the kingposts or the lateral bending of the girder flanges at
the damaged section. The accuracy of the approach span model can be considered excellent; the
primary result being a realistic stringer load distribution. Numeric accuracy or error terms are
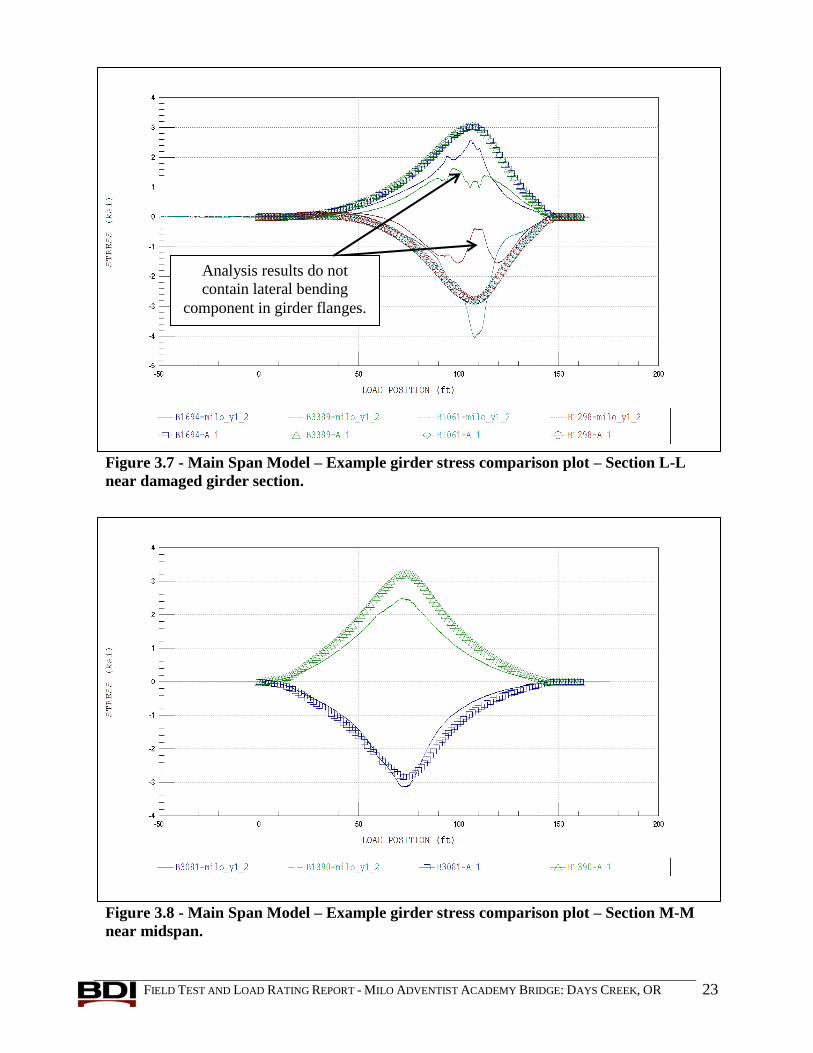
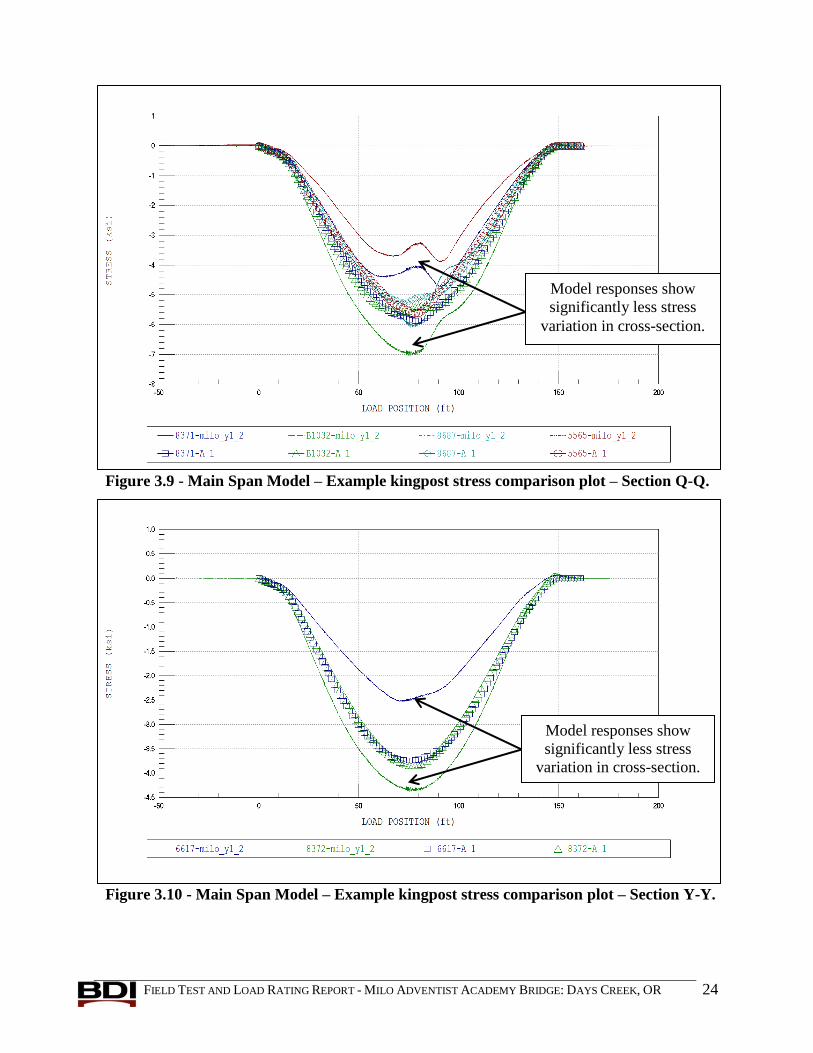
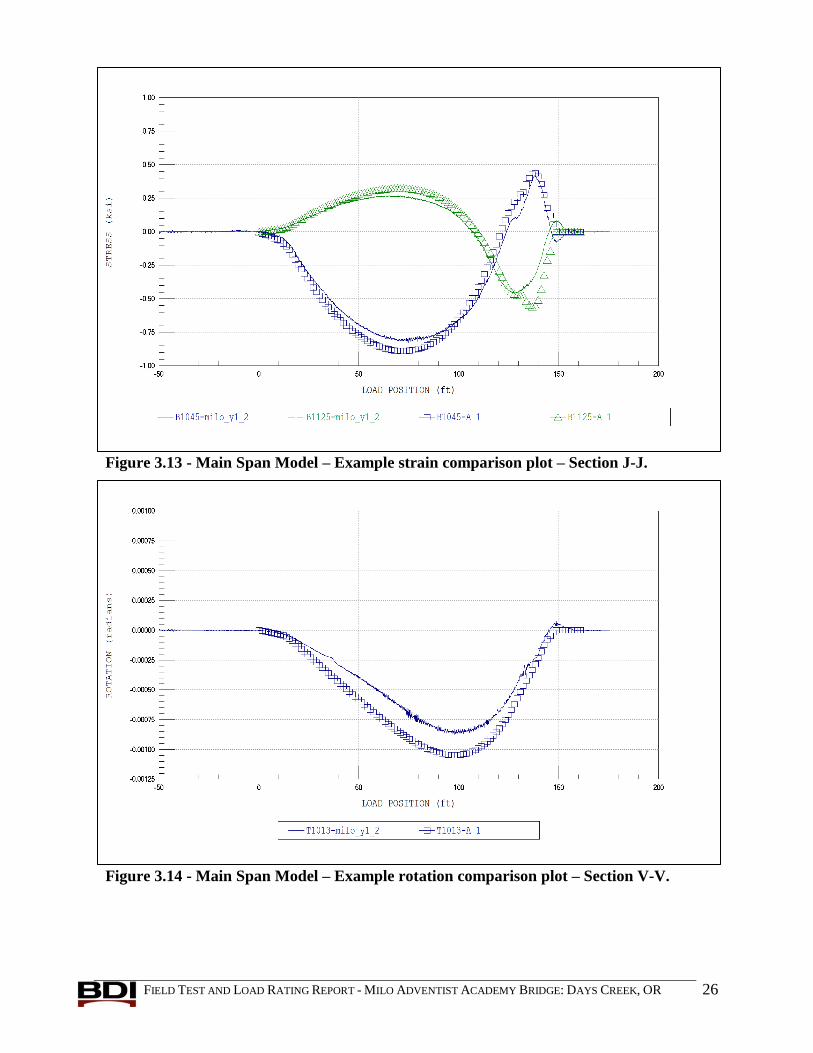
provided in Table 3.2. Visual comparisons of the response histories are shown in Figure 3.3
through Figure 3.14.
Table 3.2 Model accuracy & parameter values.
ERROR PARAMETERS APPROACH SPANS MODEL
VALUE
COVERED SPAN MODEL
VALUE
Absolute Error 2,758.7 22,891.4
Percent Error 3.6% 11.8%
Scale Error 3.3% 17.8%
Correlation Coefficient 0.982 0.968
The following table contains the equations used to compute each of the statistical error values:
Table 3.3 - Error Functions
ERROR FUNCTION EQUATION BRIEF DESCRIPTION
Absolute Error |c - m| Weighted absolute sum of the differences.
Used to determine small response changes
in accuracy due to parameters.
Percent Error )2m( / c - m2
Sum of the response differences squared
divided by the sum of the measured
responses squared. Helps provide a better
qualitative measure of accuracy
Scale Error |gagem|
|gagec - m|
max
max
Maximum error from each gage divided
by the maximum response value from each
gage. Helps determine error with respect
to maximum magnitude.
Correlation Coefficient
)2c - c()2m - m(
)c - c)(m - m(
Measure of the linearity between the
measured and computed data. Helps
determine the error with respect to
response shape and phase.
FIELD TEST AND LOAD RATING REPORT - MILO ADVENTIST ACADEMY BRIDGE: DAYS CREEK, OR 21
Figure 3.3 - Approach Span Model – Example stress comparison plot – Section C-C.
Figure 3.4 - Approach Span Model – Example stress comparison plot – Section D-D.

FIELD TEST AND LOAD RATING REPORT - MILO ADVENTIST ACADEMY BRIDGE: DAYS CREEK, OR 22
Figure 3.5 - Main Span Model – Example girder stress comparison plot – Section S-S near
the supports.
Figure 3.6 - Main Span Model – Example girder rotation comparison plot – Section O-O
near the supports.
FIELD TEST AND LOAD RATING REPORT - MILO ADVENTIST ACADEMY BRIDGE: DAYS CREEK, OR 23
Figure 3.7 - Main Span Model – Example girder stress comparison plot – Section L-L
near damaged girder section.
Figure 3.8 - Main Span Model – Example girder stress comparison plot – Section M-M
near midspan.
Analysis results do not
contain lateral bending
component in girder flanges.
FIELD TEST AND LOAD RATING REPORT - MILO ADVENTIST ACADEMY BRIDGE: DAYS CREEK, OR 24
Figure 3.9 - Main Span Model – Example kingpost stress comparison plot – Section Q-Q.
Figure 3.10 - Main Span Model – Example kingpost stress comparison plot – Section Y-Y.
Model responses show
significantly less stress
variation in cross-section.
Model responses show
significantly less stress
variation in cross-section.

FIELD TEST AND LOAD RATING REPORT - MILO ADVENTIST ACADEMY BRIDGE: DAYS CREEK, OR 25
Figure 3.11 - Main Span Model – Example floor-beam stress comparison plot.
Figure 3.12 - Main Span Model – Example stringer-tee stress comparison plot.
FIELD TEST AND LOAD RATING REPORT - MILO ADVENTIST ACADEMY BRIDGE: DAYS CREEK, OR 26
Figure 3.13 - Main Span Model – Example strain comparison plot – Section J-J.
Figure 3.14 - Main Span Model – Example rotation comparison plot – Section V-V.

FIELD TEST AND LOAD RATING REPORT - MILO ADVENTIST ACADEMY BRIDGE: DAYS CREEK, OR 27
4. LOAD RATING PROCEDURES AND RESULTS
RATING PROCEDURES
Preliminary load ratings were performed on all primary bridge elements in accordance with
the AASHTO LRFR guidelines. Structural responses were obtained from a slightly modified
version of the final calibrated model, and member capacities were based on the notes from the
on-site bridge investigation. The rating methods used in BDI’s approach closely match typical
rating procedures, with the exception that a field-verified finite-element model analysis was used
rather than a typical AASHTO girder-line analysis. This section briefly discusses the methods
and findings of the load rating procedures.
Once the analytical model was calibrated to produce an acceptable match to the measured
responses, the model was adjusted to ensure the reliability of all optimized model parameters.
This adjustment involved the identification of any calibrated parameters that could change over
time or could become unreliable under heavy loads. In the analysis of the Milo Academy
Bridge, the only calibrated parameter that was determined to be unreliable was the end-restraint
at the supports. The end-restraint behavior was therefore reduced by 50% to ensure that the
ratings would remain accurate and slightly conservative over time.
Member capacities (provided in Appendix A) were calculated based on OBEC’s & RPKA’s
structural investigations of the superstructure, the AASHTO LRFD specifications, and the
following assumptions:
RESISTANCE FACTORS: Current AASHTO LRFR resistance factors were used as follows:
o The total resistance factor was set to the following Φ total= Φr * Φs * Φc
o The resistance factors, Φr, were the following: 1.0 (flexure), 1.0 (shear), 0.9
(compression), 0.9 (tension)
o The system factors, Φs, were the following: 0.85 for members in two girder
bridge, 1.0 for the redundant stringer system of the approach spans
o Φc – 0.95 (fair for majority of members), 0.85 for the damaged girder section
(poor condition)
LOAD FACTORS: In order to better match the AASHTO LRFR resistance factors, the
following current AASHTO LRFR load and impact factors were used (not the ODOT
equivalent):
o γDL – 1.25 for all dead load, which assumes all nonstructural load was well
measured
o γLL – 1.30 for the local routine vehicles (fire and sawdust trucks), and 1.75 &
1.35 for the inventory and operating HS20 ratings
o IM – 33% for normal speed crossing and 5% for crawl speed crossing based on
the crawl speed load test data
GENERAL ASSUMPTIONS:
o All ratings were based on the current condition of each member type and the
current AASHTO LRFR code.
o All welds, splices and connections of any kind were assumed to be as strong as
the primary members.
o Both the covered span and the approach spans were evaluated separately.
o Only strength limit states were checked. Due to low number of load cycles,
fatigue was not considered. Additionally, serviceability was not checked based on
FIELD TEST AND LOAD RATING REPORT - MILO ADVENTIST ACADEMY BRIDGE: DAYS CREEK, OR 28
the assumption that the bridge would be routinely checked for any serviceability
concerns like permanent deformation of the girders.
o The kingpost and turnbuckle were essentially assumed to only resist live-load.
This was achieved by greatly reducing the modeled stiffness of these elements
with the dead load application.
o Based on the age of the structure, the steel yield strength, Fy, was assumed to be
33 ksi for the built-up sections (girder, stringer tees), and 50 ksi for the Bailey
Transom Trestle members (floor-beams, approach span stringers, kingposts).
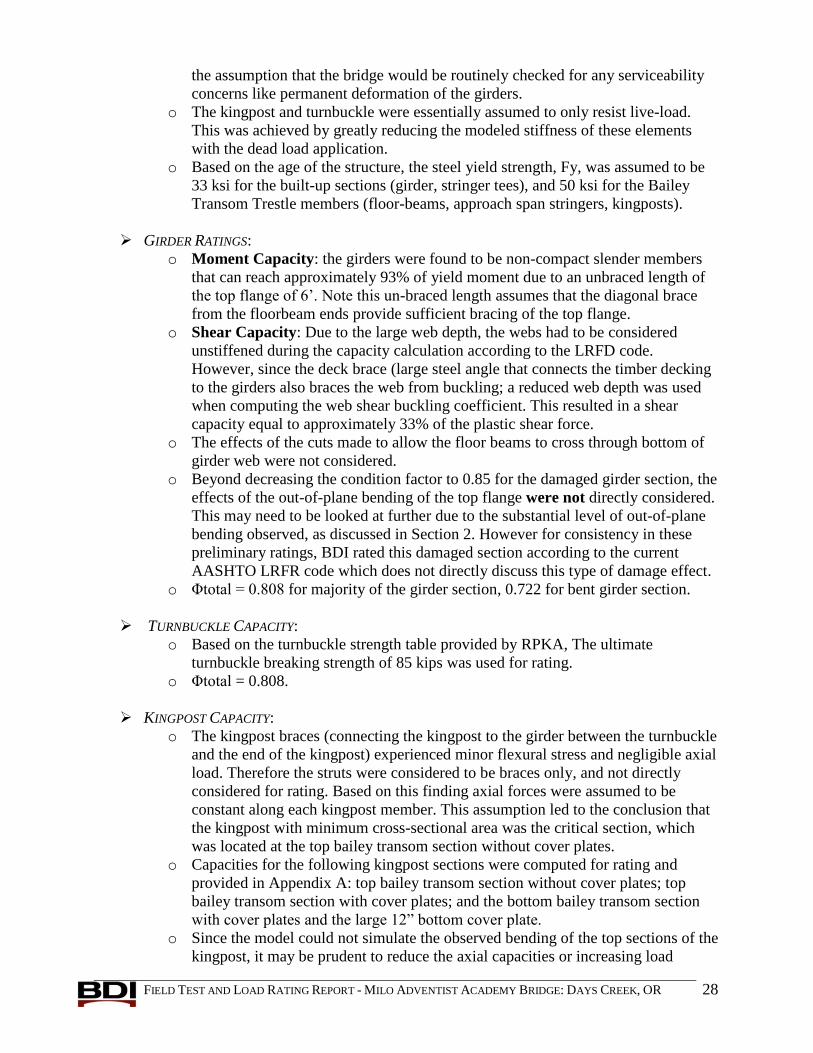
GIRDER RATINGS:
o Moment Capacity: the girders were found to be non-compact slender members
that can reach approximately 93% of yield moment due to an unbraced length of
the top flange of 6’. Note this un-braced length assumes that the diagonal brace
from the floorbeam ends provide sufficient bracing of the top flange.
o Shear Capacity: Due to the large web depth, the webs had to be considered
unstiffened during the capacity calculation according to the LRFD code.
However, since the deck brace (large steel angle that connects the timber decking
to the girders also braces the web from buckling; a reduced web depth was used
when computing the web shear buckling coefficient. This resulted in a shear
capacity equal to approximately 33% of the plastic shear force.
o The effects of the cuts made to allow the floor beams to cross through bottom of
girder web were not considered.
o Beyond decreasing the condition factor to 0.85 for the damaged girder section, the
effects of the out-of-plane bending of the top flange were not directly considered.
This may need to be looked at further due to the substantial level of out-of-plane
bending observed, as discussed in Section 2. However for consistency in these
preliminary ratings, BDI rated this damaged section according to the current
AASHTO LRFR code which does not directly discuss this type of damage effect.
o Φtotal = 0.808 for majority of the girder section, 0.722 for bent girder section.
TURNBUCKLE CAPACITY:
o Based on the turnbuckle strength table provided by RPKA, The ultimate
turnbuckle breaking strength of 85 kips was used for rating.
o Φtotal = 0.808.
KINGPOST CAPACITY:
o The kingpost braces (connecting the kingpost to the girder between the turnbuckle
and the end of the kingpost) experienced minor flexural stress and negligible axial
load. Therefore the struts were considered to be braces only, and not directly
considered for rating. Based on this finding axial forces were assumed to be
constant along each kingpost member. This assumption led to the conclusion that
the kingpost with minimum cross-sectional area was the critical section, which
was located at the top bailey transom section without cover plates.
o Capacities for the following kingpost sections were computed for rating and
provided in Appendix A: top bailey transom section without cover plates; top
bailey transom section with cover plates; and the bottom bailey transom section
with cover plates and the large 12” bottom cover plate.
o Since the model could not simulate the observed bending of the top sections of the
kingpost, it may be prudent to reduce the axial capacities or increasing load

FIELD TEST AND LOAD RATING REPORT - MILO ADVENTIST ACADEMY BRIDGE: DAYS CREEK, OR 29
effects by some kind of stress ratio as discussed in Section 2. However for
consistency in these preliminary ratings, BDI rated this section for compression
only using the AASHTO LRFD capacity that accounts for flexural buckling of a
concentrically loaded member.
o Φtotal = 0.808
FLOORBEAM CAPACITY:
o Moment strength: This capacity was based on an un-braced strength between the
stringer tees (~4.5’), which resulted in a flexural resistance that is approximately
105% of the yielding moment.
o Shear strength: This resistance was based on the section with a 4” hole in the
web, which reduced the capacity by ~40%.
o Φtotal = 0.808
STRINGER CAPACITIES – MAIN SPAN:
o Moment strength: Due to a relatively course mesh refinement of the model in
each stringer bay, it was decided that these rating were best based on simple span
assumptions and an un-braced length between the floorbeams (w*L2/8 for dead
load and P*L/4 for live load). In addition to this assumption, consideration for a 1
foot variation in vehicle lateral position was implemented, which was determined
to possibly increase the load on a given stringer by about 15.5%. It should be
noted that before the addition of the lateral variation of load, that the stringer
moment ratings from the model were comparable to the slightly more
conservative ratings provided in this report.
o Shear strength: Based on the double tee webs.
o Φtotal = 0.808
STRINGER CAPACITIES - APPROACH SPAN:
o Moment strength: Due to lack of evidence of mechanical connection between
timber deck and the stringers, this capacity was based on an un-braced length of
~20’ (entire span length). This un-braced length reduces the capacity to 33% of
the yield moment, which could be addressed by the addition of proper bracing of
the stringers’ top flange.
o Shear strength: Was based on the section with the 4” hole. Note that shear
capacity considering the hole is significantly reduced (38.5 kip vs 67.5 kip).
Given the holes between the transverse stiffeners, the webs were assumed to be
“unstiffened” since the stiffened capacity relies on post buckling behavior
(tension field action) which these holes would prevent.
o Φtotal = 0.95
FIELD TEST AND LOAD RATING REPORT - MILO ADVENTIST ACADEMY BRIDGE: DAYS CREEK, OR 30
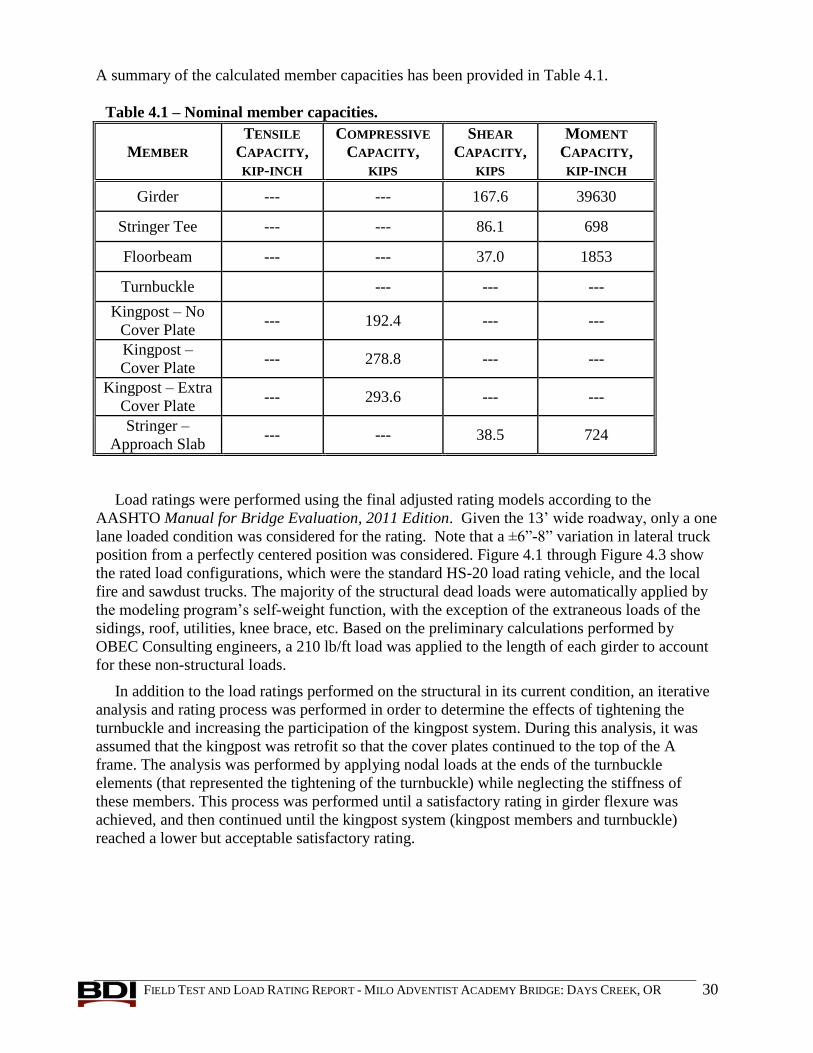
A summary of the calculated member capacities has been provided in Table 4.1.
Table 4.1 – Nominal member capacities.
MEMBER
TENSILE
CAPACITY,
KIP-INCH
COMPRESSIVE
CAPACITY,
KIPS
SHEAR
CAPACITY,
KIPS
MOMENT
CAPACITY,
KIP-INCH
Girder --- --- 167.6 39630
Stringer Tee --- --- 86.1 698
Floorbeam --- --- 37.0 1853
Turnbuckle --- --- ---
Kingpost – No
Cover Plate --- 192.4 --- ---
Kingpost –
Cover Plate --- 278.8 --- ---
Kingpost – Extra
Cover Plate --- 293.6 --- ---
Stringer –
Approach Slab --- --- 38.5 724
Load ratings were performed using the final adjusted rating models according to the
AASHTO Manual for Bridge Evaluation, 2011 Edition. Given the 13’ wide roadway, only a one
lane loaded condition was considered for the rating. Note that a ±6”-8” variation in lateral truck
position from a perfectly centered position was considered. Figure 4.1 through Figure 4.3 show
the rated load configurations, which were the standard HS-20 load rating vehicle, and the local
fire and sawdust trucks. The majority of the structural dead loads were automatically applied by
the modeling program’s self-weight function, with the exception of the extraneous loads of the
sidings, roof, utilities, knee brace, etc. Based on the preliminary calculations performed by
OBEC Consulting engineers, a 210 lb/ft load was applied to the length of each girder to account
for these non-structural loads.
In addition to the load ratings performed on the structural in its current condition, an iterative
analysis and rating process was performed in order to determine the effects of tightening the
turnbuckle and increasing the participation of the kingpost system. During this analysis, it was
assumed that the kingpost was retrofit so that the cover plates continued to the top of the A
frame. The analysis was performed by applying nodal loads at the ends of the turnbuckle
elements (that represented the tightening of the turnbuckle) while neglecting the stiffness of
these members. This process was performed until a satisfactory rating in girder flexure was
achieved, and then continued until the kingpost system (kingpost members and turnbuckle)
reached a lower but acceptable satisfactory rating.

FIELD TEST AND LOAD RATING REPORT - MILO ADVENTIST ACADEMY BRIDGE: DAYS CREEK, OR 31
Figure 4.1 - AASHTO HS-20 load rating vehicle configuration.
Figure 4.2 – Local Fire Truck - Load rating vehicle configuration (kips & feet).
Figure 4.3 – Local Sawdust Truck - Load rating vehicle configuration (kips & feet).

FIELD TEST AND LOAD RATING REPORT - MILO ADVENTIST ACADEMY BRIDGE: DAYS CREEK, OR 32
RATING RESULTS & CONCLUSIONS
For clarification, a rating factor is the ratio of the available live-load capacity to the applied
factored live-load. Therefore any rating factor equal to or greater than one (1.0) indicates that
the structure can support the specific vehicle loads with a sufficient factor of safety.
Consequently, any rating factor less than one (1.0) indicates that the structure can only support a
portion of the given vehicle’s weight with a sufficient factor of safety. The load rating factor for
a particular truck can essentially be considered a multiplier on a specific truck load to obtain the
maximum load limit for that vehicle.
The following is a breakdown of the load rating factors for the structure in its current
condition for the three rated vehicles:
Kingpost and turnbuckle rating factors were slightly deficient when full impact was
considered but satisfactory with a reduced impact factor. It should be noted that further
consideration of the biaxial bending observed may be needed.
Shear capacities of the girders and floorbeams were deficient with full impact applied but
satisfactory with the impact reduced to 5%. Vehicles would need to cross the bridge at
1-2 mph.
The controlling rating factors for this structure are for the girder in flexure. The girders
only have a satisfactory flexural rating for the fire truck when the reduced impact factor
is applied. This indicates that the fire truck can cross the structure in its current state with
the required factor of safety if it does so at crawl speed.
An important conclusion regarding the controlling load ratings were that the covering
caused a 30% increase dead load moment, which directly reduced the capacity available
for live-load.
The approach span’s stringers have insufficient ratings in their current state due to the
lack of top flange bracing. It was found that the stringer ratings would be sufficient for all
vehicles examined by simply bracing the top flange at quarter points.
Although the 4” holes in the stringer near the ends of the approach spans significantly
reduce their shear capacity, all of the shear ratings of the approach span were satisfactory.
This result was unexpected and was a result of the level of lateral load distribution
observed in these approach spans.
Additional secondary Sawdust truck ratings were performed as reference considering that
the covering and the kingpost system were both removed, see Table 4.26. From
comparison of the Sawdust truck rating at current condition, the following conclusions
were made:
o The maximum live-load girder moment was reduced by 40% due to the
kingpost interaction.
o The kingpost system accounted for 10% of the girder’s total dead load
moment.
o The covering (sidings & roof) represent 30% of the total girder dead load
moment.
FIELD TEST AND LOAD RATING REPORT - MILO ADVENTIST ACADEMY BRIDGE: DAYS CREEK, OR 33
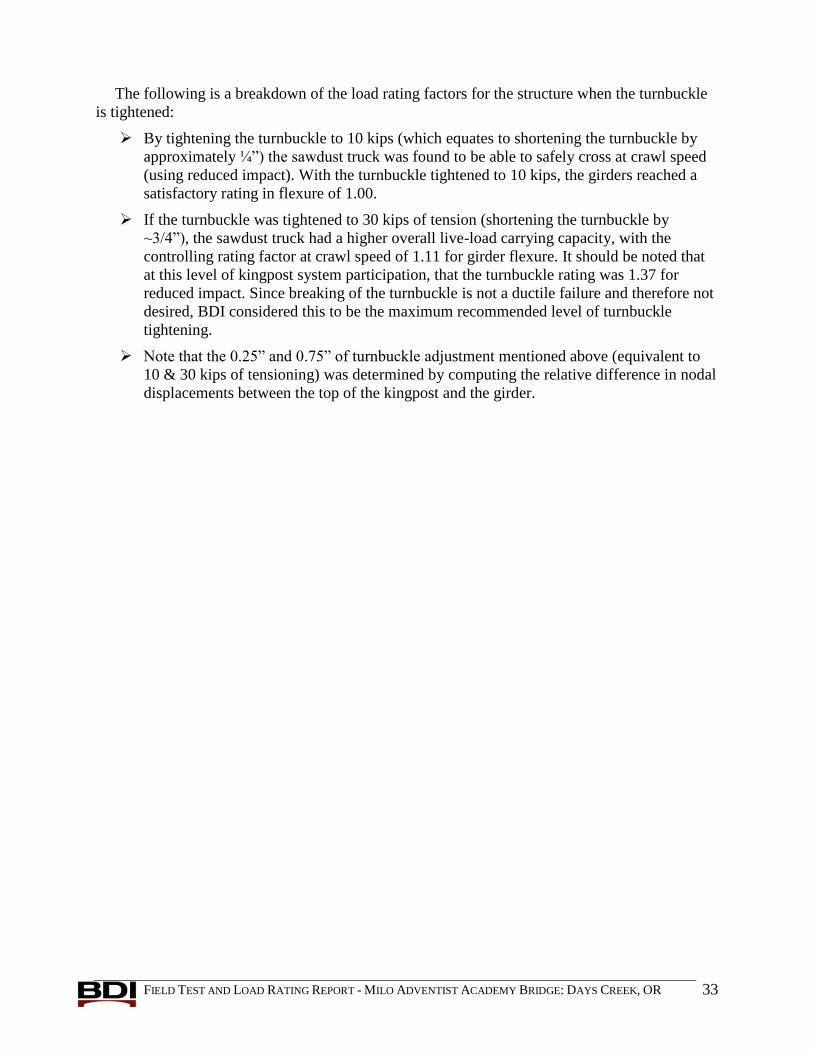
The following is a breakdown of the load rating factors for the structure when the turnbuckle
is tightened:
By tightening the turnbuckle to 10 kips (which equates to shortening the turnbuckle by
approximately ¼”) the sawdust truck was found to be able to safely cross at crawl speed
(using reduced impact). With the turnbuckle tightened to 10 kips, the girders reached a
satisfactory rating in flexure of 1.00.
If the turnbuckle was tightened to 30 kips of tension (shortening the turnbuckle by
~3/4”), the sawdust truck had a higher overall live-load carrying capacity, with the
controlling rating factor at crawl speed of 1.11 for girder flexure. It should be noted that
at this level of kingpost system participation, that the turnbuckle rating was 1.37 for
reduced impact. Since breaking of the turnbuckle is not a ductile failure and therefore not
desired, BDI considered this to be the maximum recommended level of turnbuckle
tightening.
Note that the 0.25” and 0.75” of turnbuckle adjustment mentioned above (equivalent to
10 & 30 kips of tensioning) was determined by computing the relative difference in nodal
displacements between the top of the kingpost and the girder.

FIELD TEST AND LOAD RATING REPORT - MILO ADVENTIST ACADEMY BRIDGE: DAYS CREEK, OR 34
Table 4.2 - Rating factors & responses for rated vehicles - Kingpost Compression –
Current Condition.
TRUCK DEAD LOAD
EFFECTS, KIPS
LIVE LOAD
EFFECTS, KIPS
CONTROLLING
OPERATING RF
(FULL IMPACT)
CONTROLLING
OPERATING RF
(REDUCED IMPACT)
HS-20
(Inventory) -4.19 -65.03 0.89 1.13
HS-20
(Operating) -4.19 -65.03 1.15 1.46
Local Fire
Truck -4.19 -41.01 1.90 2.41
Local Sawdust
Truck -4.19 -68.20 1.14 1.44
* Both the Live Load and Dead Load Responses are-unfactored responses.
Table 4.3 - Rating factors & responses for rated vehicles - Kingpost Compression with
cover plate RETROFIT – Tightened Turnbuckle to Minimum Level – 0.25” (10 kips).
TRUCK DEAD LOAD
EFFECTS, KIPS
LIVE LOAD
EFFECTS, KIPS
CONTROLLING
OPERATING RF
(FULL IMPACT)
CONTROLLING
OPERATING RF
(REDUCED IMPACT)
HS-20
(Inventory) -11.7 -65.05 1.24 1.57
HS-20
(Operating) -12.41 -65.00 1.60 2.03
Local Fire
Truck -12.41 -40.99 2.64 3.34
Local Sawdust
Truck -11.7 -68.23 1.59 2.01
* Both the Live Load and Dead Load Responses are-unfactored responses.
Table 4.4 - Rating factors & responses for rated vehicles - Kingpost Compression with
cover plate RETROFIT – Tightened Turnbuckle to Maximum Level – 0.75” (30 kips).
TRUCK DEAD LOAD
EFFECTS, KIPS
LIVE LOAD
EFFECTS, KIPS
CONTROLLING
OPERATING RF
(FULL IMPACT)
CONTROLLING
OPERATING RF
(REDUCED IMPACT)
HS-20
(Inventory) -28.93 -65.00 1.10 1.39
HS-20
(Operating) -28.93 -65.00 1.43 1.81
Local Fire
Truck -28.93 -40.99 2.35 2.98
Local Sawdust
Truck -28.93 -68.18 1.41 1.79
* Both the Live Load and Dead Load Responses are-unfactored responses.

FIELD TEST AND LOAD RATING REPORT - MILO ADVENTIST ACADEMY BRIDGE: DAYS CREEK, OR 35
Table 4.5 - Rating factors & responses for rated vehicles - Turnbuckle Tension – Current
Condition.
TRUCK DEAD LOAD
EFFECTS, KIPS
LIVE LOAD
EFFECTS, KIPS
CONTROLLING
OPERATING RF
(FULL IMPACT)
CONTROLLING
OPERATING RF
(REDUCED IMPACT)
HS-20
(Inventory) 0.00 14.04 1.99 2.52
HS-20
(Operating) 0.00 14.04 2.58 3.27
Local Fire
Truck 0.00 8.86 4.24 5.38
Local Sawdust
Truck 0.00 14.70 2.56 3.24
* Both the Live Load and Dead Load Responses are-unfactored responses.
Table 4.6 - Rating factors & responses for rated vehicles - Turnbuckle Tension –
Tightened Turnbuckle to Minimum Level – 0.25” (10 kips).
TRUCK DEAD LOAD
EFFECTS, KIPS
LIVE LOAD
EFFECTS, KIPS
CONTROLLING
OPERATING RF
(FULL IMPACT)
CONTROLLING
OPERATING RF
(REDUCED IMPACT)
HS-20
(Inventory) 10.00 14.04 1.61 2.04
HS-20
(Operating) 10.00 14.04 2.08 2.64
Local Fire
Truck 10.00 8.86 3.43 4.34
Local Sawdust
Truck 10.00 14.70 2.07 2.62
* Both the Live Load and Dead Load Responses are-unfactored responses.
Table 4.7 - Rating factors & responses for rated vehicles - Turnbuckle Tension –
Tightened Turnbuckle to Maximum Level – 0.75” (30 kips).
TRUCK DEAD LOAD
EFFECTS, KIPS
LIVE LOAD
EFFECTS, KIPS
CONTROLLING
OPERATING RF
(FULL IMPACT)
CONTROLLING
OPERATING RF
(REDUCED IMPACT)
HS-20
(Inventory) 30.00 14.04 0.84 1.07
HS-20
(Operating) 30.00 14.04 1.09 1.38
Local Fire
Truck 30.00 8.86 1.80 2.28
Local Sawdust
Truck 30.00 14.70 1.08 1.37
* Both the Live Load and Dead Load Responses are-unfactored responses.
FIELD TEST AND LOAD RATING REPORT - MILO ADVENTIST ACADEMY BRIDGE: DAYS CREEK, OR 36
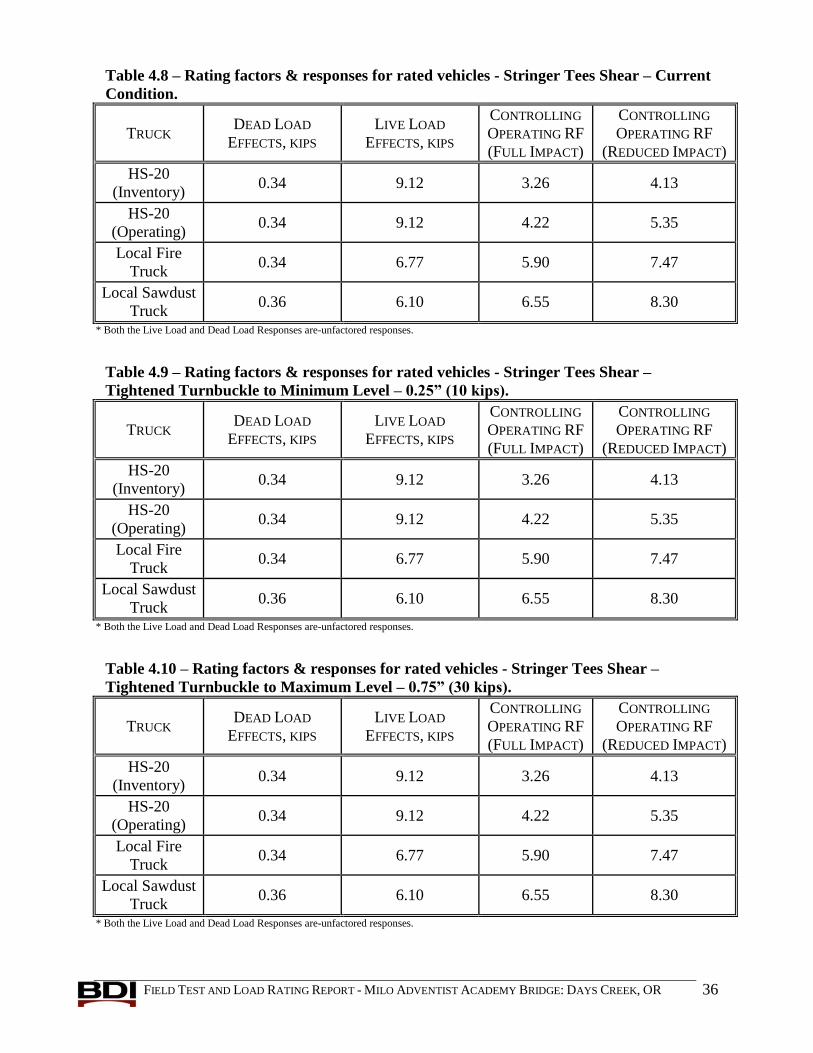
Table 4.8 – Rating factors & responses for rated vehicles - Stringer Tees Shear – Current
Condition.
TRUCK DEAD LOAD
EFFECTS, KIPS
LIVE LOAD
EFFECTS, KIPS
CONTROLLING
OPERATING RF
(FULL IMPACT)
CONTROLLING
OPERATING RF
(REDUCED IMPACT)
HS-20
(Inventory) 0.34 9.12 3.26 4.13
HS-20
(Operating) 0.34 9.12 4.22 5.35
Local Fire
Truck 0.34 6.77 5.90 7.47
Local Sawdust
Truck 0.36 6.10 6.55 8.30
* Both the Live Load and Dead Load Responses are-unfactored responses.
Table 4.9 – Rating factors & responses for rated vehicles - Stringer Tees Shear –
Tightened Turnbuckle to Minimum Level – 0.25” (10 kips).
TRUCK DEAD LOAD
EFFECTS, KIPS
LIVE LOAD
EFFECTS, KIPS
CONTROLLING
OPERATING RF
(FULL IMPACT)
CONTROLLING
OPERATING RF
(REDUCED IMPACT)
HS-20
(Inventory) 0.34 9.12 3.26 4.13
HS-20
(Operating) 0.34 9.12 4.22 5.35
Local Fire
Truck 0.34 6.77 5.90 7.47
Local Sawdust
Truck 0.36 6.10 6.55 8.30
* Both the Live Load and Dead Load Responses are-unfactored responses.
Table 4.10 – Rating factors & responses for rated vehicles - Stringer Tees Shear –
Tightened Turnbuckle to Maximum Level – 0.75” (30 kips).
TRUCK DEAD LOAD
EFFECTS, KIPS
LIVE LOAD
EFFECTS, KIPS
CONTROLLING
OPERATING RF
(FULL IMPACT)
CONTROLLING
OPERATING RF
(REDUCED IMPACT)
HS-20
(Inventory) 0.34 9.12 3.26 4.13
HS-20
(Operating) 0.34 9.12 4.22 5.35
Local Fire
Truck 0.34 6.77 5.90 7.47
Local Sawdust
Truck 0.36 6.10 6.55 8.30
* Both the Live Load and Dead Load Responses are-unfactored responses.
FIELD TEST AND LOAD RATING REPORT - MILO ADVENTIST ACADEMY BRIDGE: DAYS CREEK, OR 37
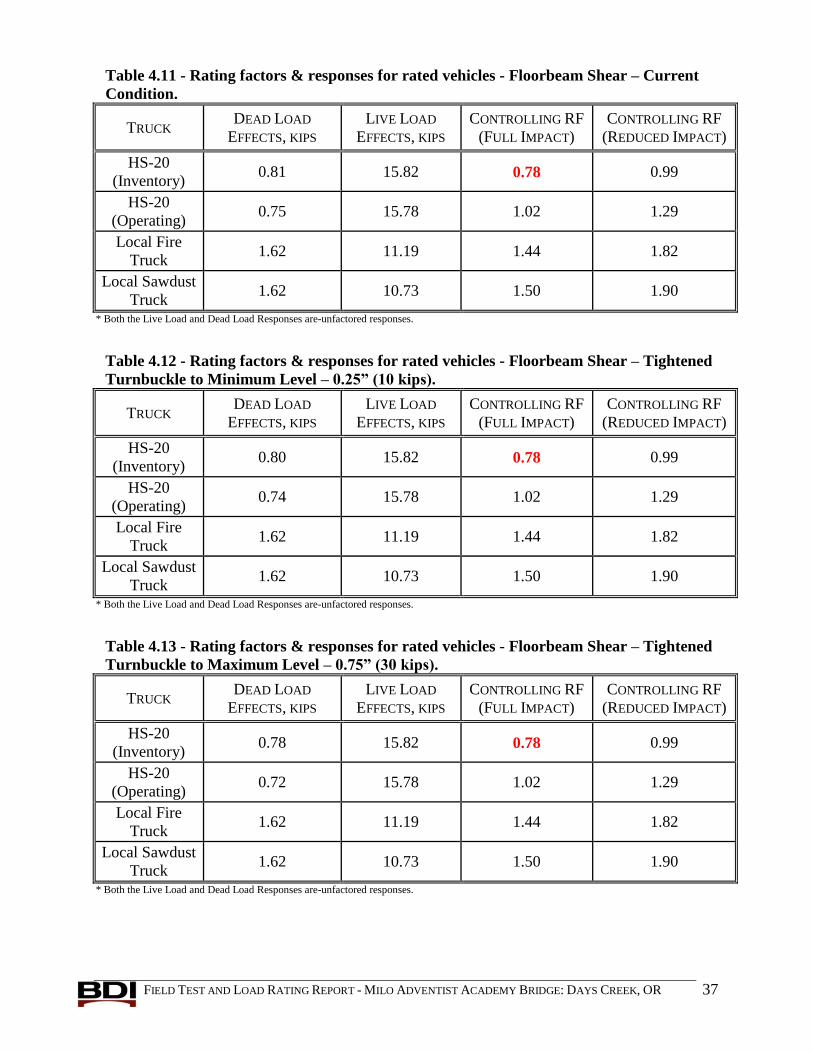
Table 4.11 - Rating factors & responses for rated vehicles - Floorbeam Shear – Current
Condition.
TRUCK DEAD LOAD
EFFECTS, KIPS
LIVE LOAD
EFFECTS, KIPS
CONTROLLING RF
(FULL IMPACT)
CONTROLLING RF
(REDUCED IMPACT)
HS-20
(Inventory) 0.81 15.82 0.78 0.99
HS-20
(Operating) 0.75 15.78 1.02 1.29
Local Fire
Truck 1.62 11.19 1.44 1.82
Local Sawdust
Truck 1.62 10.73 1.50 1.90
* Both the Live Load and Dead Load Responses are-unfactored responses.
Table 4.12 - Rating factors & responses for rated vehicles - Floorbeam Shear – Tightened
Turnbuckle to Minimum Level – 0.25” (10 kips).
TRUCK DEAD LOAD
EFFECTS, KIPS
LIVE LOAD
EFFECTS, KIPS
CONTROLLING RF
(FULL IMPACT)
CONTROLLING RF
(REDUCED IMPACT)
HS-20
(Inventory) 0.80 15.82 0.78 0.99
HS-20
(Operating) 0.74 15.78 1.02 1.29
Local Fire
Truck 1.62 11.19 1.44 1.82
Local Sawdust
Truck 1.62 10.73 1.50 1.90
* Both the Live Load and Dead Load Responses are-unfactored responses.
Table 4.13 - Rating factors & responses for rated vehicles - Floorbeam Shear – Tightened
Turnbuckle to Maximum Level – 0.75” (30 kips).
TRUCK DEAD LOAD
EFFECTS, KIPS
LIVE LOAD
EFFECTS, KIPS
CONTROLLING RF
(FULL IMPACT)
CONTROLLING RF
(REDUCED IMPACT)
HS-20
(Inventory) 0.78 15.82 0.78 0.99
HS-20
(Operating) 0.72 15.78 1.02 1.29
Local Fire
Truck 1.62 11.19 1.44 1.82
Local Sawdust
Truck 1.62 10.73 1.50 1.90
* Both the Live Load and Dead Load Responses are-unfactored responses.
FIELD TEST AND LOAD RATING REPORT - MILO ADVENTIST ACADEMY BRIDGE: DAYS CREEK, OR 38
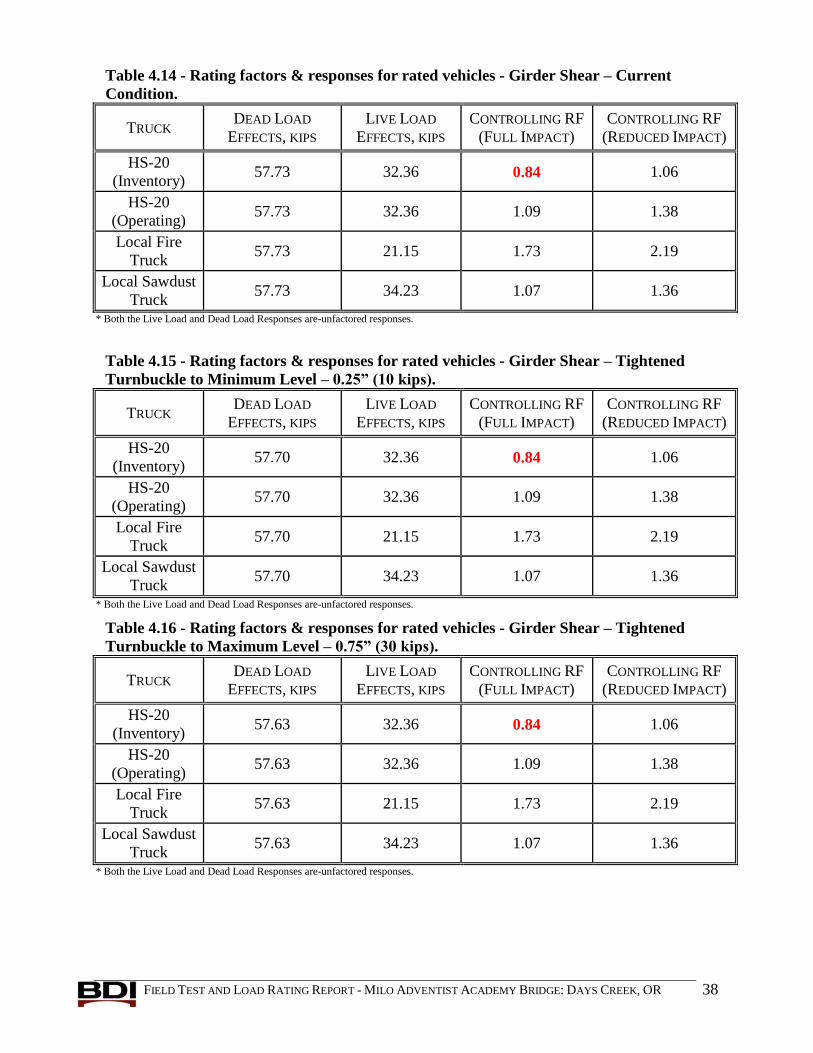
Table 4.14 - Rating factors & responses for rated vehicles - Girder Shear – Current
Condition.
TRUCK DEAD LOAD
EFFECTS, KIPS
LIVE LOAD
EFFECTS, KIPS
CONTROLLING RF
(FULL IMPACT)
CONTROLLING RF
(REDUCED IMPACT)
HS-20
(Inventory) 57.73 32.36 0.84 1.06
HS-20
(Operating) 57.73 32.36 1.09 1.38
Local Fire
Truck 57.73 21.15 1.73 2.19
Local Sawdust
Truck 57.73 34.23 1.07 1.36
* Both the Live Load and Dead Load Responses are-unfactored responses.
Table 4.15 - Rating factors & responses for rated vehicles - Girder Shear – Tightened
Turnbuckle to Minimum Level – 0.25” (10 kips).
TRUCK DEAD LOAD
EFFECTS, KIPS
LIVE LOAD
EFFECTS, KIPS
CONTROLLING RF
(FULL IMPACT)
CONTROLLING RF
(REDUCED IMPACT)
HS-20
(Inventory) 57.70 32.36 0.84 1.06
HS-20
(Operating) 57.70 32.36 1.09 1.38
Local Fire
Truck 57.70 21.15 1.73 2.19
Local Sawdust
Truck 57.70 34.23 1.07 1.36
* Both the Live Load and Dead Load Responses are-unfactored responses.
Table 4.16 - Rating factors & responses for rated vehicles - Girder Shear – Tightened
Turnbuckle to Maximum Level – 0.75” (30 kips).
TRUCK DEAD LOAD
EFFECTS, KIPS
LIVE LOAD
EFFECTS, KIPS
CONTROLLING RF
(FULL IMPACT)
CONTROLLING RF
(REDUCED IMPACT)
HS-20
(Inventory) 57.63 32.36 0.84 1.06
HS-20
(Operating) 57.63 32.36 1.09 1.38
Local Fire
Truck 57.63 21.15 1.73 2.19
Local Sawdust
Truck 57.63 34.23 1.07 1.36
* Both the Live Load and Dead Load Responses are-unfactored responses.

FIELD TEST AND LOAD RATING REPORT - MILO ADVENTIST ACADEMY BRIDGE: DAYS CREEK, OR 39
Table 4.17 – Rating factors & responses for rated vehicles - Stringer Tees Moment – All
Conditions (Turnbuckle does not significantly affect Stringers).
TRUCK DEAD LOAD
EFFECTS, KIP-INCH
LIVE LOAD
EFFECTS, KIP-IN
CONTROLLING RF
(FULL IMPACT)
CONTROLLING RF
(REDUCED IMPACT)
HS-20
(Inventory) 11.14 288 0.71 0.90
HS-20
(Operating) 11.14 288 0.92 1.17
Local Fire
Truck 11.14 158.11 1.74 2.21
Local Sawdust
Truck 11.14 128.61 2.14 2.71
Note: - Both the Live Load and Dead Load Responses are-unfactored responses.
- Stringer moment ratings were based on simple span assumption due to model mesh refinement issues.

FIELD TEST AND LOAD RATING REPORT - MILO ADVENTIST ACADEMY BRIDGE: DAYS CREEK, OR 40
Table 4.18 - Rating factors & responses for rated vehicles - Floorbeam Moment – Current
Condition.
TRUCK DEAD LOAD
EFFECTS, KIP-INCH
LIVE LOAD
EFFECTS, KIP-IN
CONTROLLING RF
(FULL IMPACT)
CONTROLLING RF
(REDUCED IMPACT)
HS-20
(Inventory) 30.44 475.74 1.32 1.67
HS-20
(Operating) 30.44 475.74 1.71 2.17
Local Fire
Truck 52.17 361.54 2.29 2.90
Local Sawdust
Truck 52.17 343.15 2.41 3.05
* Both the Live Load and Dead Load Responses are-unfactored responses.
Table 4.19 - Rating factors & responses for rated vehicles - Floorbeam Moment –
Tightened Turnbuckle to Minimum Level – 0.25” (10 kips).
TRUCK DEAD LOAD
EFFECTS, KIP-INCH
LIVE LOAD
EFFECTS, KIP-IN
CONTROLLING RF
(FULL IMPACT)
CONTROLLING RF
(REDUCED IMPACT)
HS-20
(Inventory) 30.30 475.74 1.32 1.67
HS-20
(Operating) 30.30 475.74 1.71 2.17
Local Fire
Truck 52.05 361.54 2.29 2.90
Local Sawdust
Truck 52.05 343.15 2.41 3.05
* Both the Live Load and Dead Load Responses are-unfactored responses.
Table 4.20 - Rating factors & responses for rated vehicles - Floorbeam Moment –
Tightened Turnbuckle to Maximum Level – 0.75” (30 kips).
TRUCK DEAD LOAD
EFFECTS, KIP-INCH
LIVE LOAD
EFFECTS, KIP-IN
CONTROLLING RF
(FULL IMPACT)
CONTROLLING RF
(REDUCED IMPACT)
HS-20
(Inventory) 30.04 475.74 1.32 1.67
HS-20
(Operating) 30.04 475.74 1.71 2.17
Local Fire
Truck 51.81 361.54 2.29 2.90
Local Sawdust
Truck 51.81 343.15 2.41 3.05
* Both the Live Load and Dead Load Responses are-unfactored responses.

FIELD TEST AND LOAD RATING REPORT - MILO ADVENTIST ACADEMY BRIDGE: DAYS CREEK, OR 41
Table 4.21 - Rating factors & responses for rated vehicles - Girder Moment – Current
Condition.
TRUCK DEAD LOAD
EFFECTS, KIP-INCH
LIVE LOAD
EFFECTS, KIP-IN
CONTROLLING RF
(FULL IMPACT)
CONTROLLING RF
(REDUCED IMPACT)
HS-20
(Inventory) 19633.03 6914.90 0.46 0.58
HS-20
(Operating) 19517.81 7005.80 0.60 0.76
Local Fire
Truck 19633.03 4620.40 0.93 1.18
Local Sawdust
Truck 19517.81 5943.60 0.74 0.94
* Both the Live Load and Dead Load Responses are-unfactored responses.
Table 4.22 - Rating factors & responses for rated vehicles - Girder Moment – Tightened
Turnbuckle to Minimum Level – 0.25” (10 kips).
TRUCK DEAD LOAD
EFFECTS, KIP-INCH
LIVE LOAD
EFFECTS, KIP-IN
CONTROLLING RF
(FULL IMPACT)
CONTROLLING RF
(REDUCED IMPACT)
HS-20
(Inventory) 19131.40 7005.80 0.50 0.63
HS-20
(Operating) 19131.40 7005.80 0.64 0.81
Local Fire
Truck 19131.40 4621.10 1.01 1.28
Local Sawdust
Truck 19131.40 5943.60 0.79 1.00
* Both the Live Load and Dead Load Responses are-unfactored responses.
Table 4.23 - Rating factors & responses for rated vehicles - Girder Moment – Tightened
Turnbuckle to Minimum Level – 0.25” (10 kips).
TRUCK DEAD LOAD
EFFECTS, KIP-INCH
LIVE LOAD
EFFECTS, KIP-IN
CONTROLLING RF
(FULL IMPACT)
CONTROLLING RF
(REDUCED IMPACT)
HS-20
(Inventory) 18358.61 7005.80 0.56 0.71
HS-20
(Operating) 18358.61 7005.80 0.72 0.91
Local Fire
Truck 18223.67 4700.80 1.13 1.43
Local Sawdust
Truck 18358.61 5943.60 0.88 1.11
* Both the Live Load and Dead Load Responses are-unfactored responses.
FIELD TEST AND LOAD RATING REPORT - MILO ADVENTIST ACADEMY BRIDGE: DAYS CREEK, OR 42
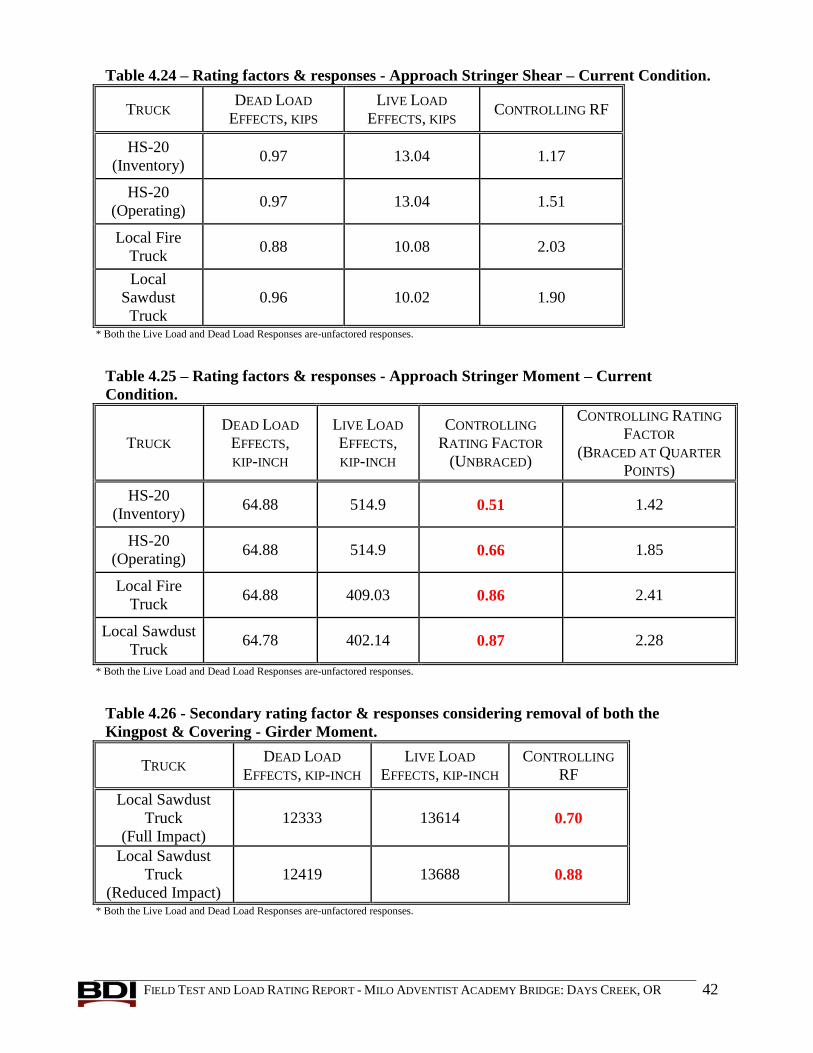
Table 4.24 – Rating factors & responses - Approach Stringer Shear – Current Condition.
TRUCK DEAD LOAD
EFFECTS, KIPS
LIVE LOAD
EFFECTS, KIPS CONTROLLING RF
HS-20
(Inventory) 0.97 13.04 1.17
HS-20
(Operating) 0.97 13.04 1.51
Local Fire
Truck 0.88 10.08 2.03
Local
Sawdust
Truck
0.96 10.02 1.90
* Both the Live Load and Dead Load Responses are-unfactored responses.
Table 4.25 – Rating factors & responses - Approach Stringer Moment – Current
Condition.
TRUCK
DEAD LOAD
EFFECTS,
KIP-INCH
LIVE LOAD
EFFECTS,
KIP-INCH
CONTROLLING
RATING FACTOR
(UNBRACED)
CONTROLLING RATING
FACTOR
(BRACED AT QUARTER
POINTS)
HS-20
(Inventory) 64.88 514.9 0.51 1.42
HS-20
(Operating) 64.88 514.9 0.66 1.85
Local Fire
Truck 64.88 409.03 0.86 2.41
Local Sawdust
Truck 64.78 402.14 0.87 2.28
* Both the Live Load and Dead Load Responses are-unfactored responses.
Table 4.26 - Secondary rating factor & responses considering removal of both the
Kingpost & Covering - Girder Moment.
TRUCK DEAD LOAD
EFFECTS, KIP-INCH
LIVE LOAD
EFFECTS, KIP-INCH
CONTROLLING
RF
Local Sawdust
Truck
(Full Impact)
12333 13614 0.70
Local Sawdust
Truck
(Reduced Impact)
12419 13688 0.88
* Both the Live Load and Dead Load Responses are-unfactored responses.
FIELD TEST AND LOAD RATING REPORT - MILO ADVENTIST ACADEMY BRIDGE: DAYS CREEK, OR 43
5. CONCLUSIONS
In general, the response data recorded during the load tests was found to be of good quality
and indicated no major signs of distress. The test data exhibited response magnitudes and shapes
typical of at two girder structure and of a multi-stringer structure. The following notable
observations were made from review of the load test data:
Significant end-restraint was observed at the girder supports of the covered span and was
likely due to the embedment/connection of the girder-ends to the abutment concrete and
adjacent stringers. This behavior reduced the midspan moment and was partially
considered for rating.
The kingpost and turnbuckle system was significantly activated by the test truck. Both
axial compressive stress and flexural stress were observed near the top of the kingpost.
The relative magnitude of the flexural stress was somewhat concerning because it may be
necessary to treat the kingpost struts as beam-columns rather than just compression
members. The initial load rating capacities were calculated based on compression
member specifications, however flexural and axial stress ratios were generated for
additional consideration.
Near the damaged girder section (section with a severely bent bottom flange), a
substantial amount of out-of plane bending was observed in the top flange. This indicated
a non-uniform stress profile across the compression flange which would cause one edge
to reach yield stress well before the theoretical moment capacity was reached. While this
was not considered in the initial load rating, information about the compression flange
stress profile has been provided to help determine if additional reduction factors should
be applied to the moment capacity.
Significant dynamic effects (20%) were observed during the normal speed test (5-7 mph).
However negligible dynamics were observed during the crawl speed tests (1-3 mph). This
observation indicates that if the heavier trucks cross at crawl speed, a much larger weight
can safely cross.
A quasi three-dimensional finite-element model of the structure was created using the
collected structural information, and subsequently calibrated until an acceptable match between
the measured and analytical responses was achieved. A good correlation between the measured
and computed response was obtained during the modeling process.
Load ratings for the standard HS-20 rating and the local fire and sawdust trucks were
performed according to the AASHTO Manual for Bridge Evaluation, 2011 Edition. The
following conclusions were made from these ratings:
Load rating results were controlled by the ultimate flexural capacity of the girders near
midspan. Only the local fire truck crossing at crawl speed had a satisfactory load rating,
which indicated that with the structure in its current state only the fire truck can cross the
structure safely if it does so at crawl speed (1-3 mph).
A primary conclusion from these ratings was that the dead-load responses were much
greater than the live-load responses. It was found that the bridge covering accounted for
approximately 30% of the dead-load, which greatly reduced the remaining live-load
capacity.

FIELD TEST AND LOAD RATING REPORT - MILO ADVENTIST ACADEMY BRIDGE: DAYS CREEK, OR 44
The kingpost system was determined to be an important structural element and
effectively reduced the peak live-load girder moment by approximately 40 percent. While
not the critical rating component, the kingposts were found to have slightly deficient
compression capacity at the upper section with no cover-plates. A recommended retrofit
would be to extend the existing cover-plates to the ends and thereby increase the
compression capacity by over 40 percent.
Other than a 0.85 condition factor at the damaged girder section, no additional capacity
reductions or live-load amplifiers were applied to account for the observed bending
stresses on primary compression members. Further investigation and consideration may
be needed to account for bending effects in the kingpost and the top girder flange.
The approach span’s stringers have unsatisfactory ratings in their current state due to the
lack of mechanical attachment to the decking members or other lateral bracing of the top
flanges. Bracing the stringer top flanges at quarter points would increase the moment
capacity so that all examined vehicles would have sufficient load ratings.
In addition to the load ratings performed on the structure in its current condition, an iterative
analysis and rating process was performed in order to determine the effects of tightening the
turnbuckle and increasing the participation of the kingpost system. The following was
determined from this process:
It was found that by tightening the turnbuckle to 10 kips (shortening the turnbuckle by
approximately ¼”) the sawdust truck could cross at crawl speed (using reduced impact).
With the turnbuckle tightened to this minimum level, the girders had a satisfactory rating
in flexure of 1.00.
Additionally, it was determined that if the turnbuckle was tightened to 30 kips of force
(~3/4” turnbuckle shortening) that the sawdust truck had a higher overall live-load
carrying capacity, with the controlling rating factor at crawl speed of 1.11 for girder
flexure. It should be noted that at this level of kingpost system participation, that the
turnbuckle rating was 1.37 for reduced impact. Since breaking of the turnbuckle is not a
ductile failure and therefore not desired, BDI considered this to be the maximum
recommended level of turnbuckle tightening.
Additional information about BDI’s integrated approach (testing, modeling and rating
procedures) and other supporting documents are available at www.bridgetest.com .
The load test, structural investigation, and load rating results presented in this report
correspond to the structure at the time of testing. Any structural degradation, damage, and/or
retrofits must be taken into account in future ratings.
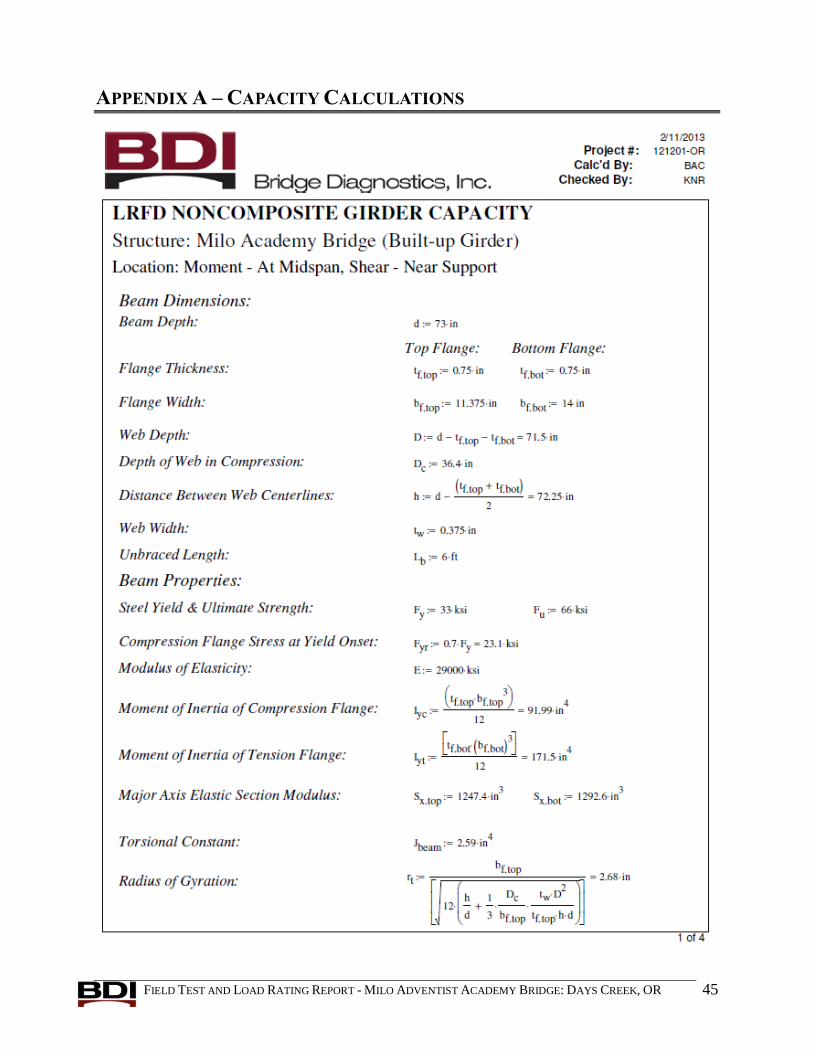
FIELD TEST AND LOAD RATING REPORT - MILO ADVENTIST ACADEMY BRIDGE: DAYS CREEK, OR 45
APPENDIX A – CAPACITY CALCULATIONS

FIELD TEST AND LOAD RATING REPORT - MILO ADVENTIST ACADEMY BRIDGE: DAYS CREEK, OR 46

FIELD TEST AND LOAD RATING REPORT - MILO ADVENTIST ACADEMY BRIDGE: DAYS CREEK, OR 47
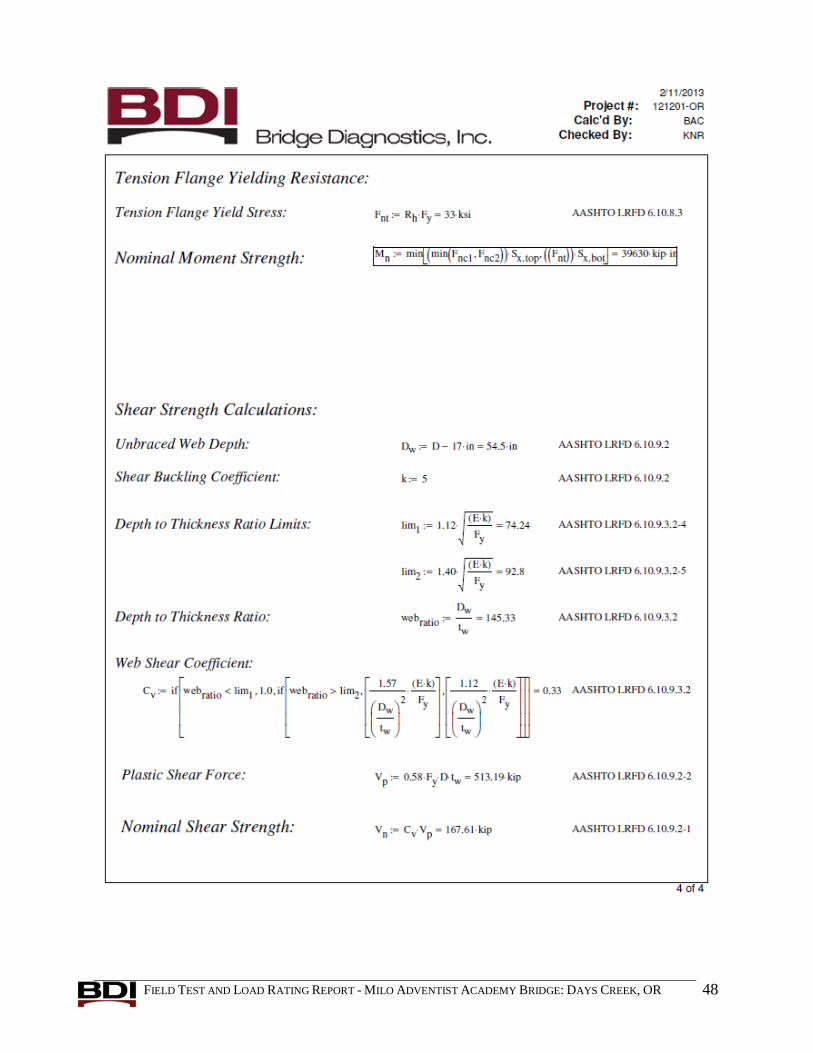
FIELD TEST AND LOAD RATING REPORT - MILO ADVENTIST ACADEMY BRIDGE: DAYS CREEK, OR 48

FIELD TEST AND LOAD RATING REPORT - MILO ADVENTIST ACADEMY BRIDGE: DAYS CREEK, OR 49

FIELD TEST AND LOAD RATING REPORT - MILO ADVENTIST ACADEMY BRIDGE: DAYS CREEK, OR 50

FIELD TEST AND LOAD RATING REPORT - MILO ADVENTIST ACADEMY BRIDGE: DAYS CREEK, OR 51
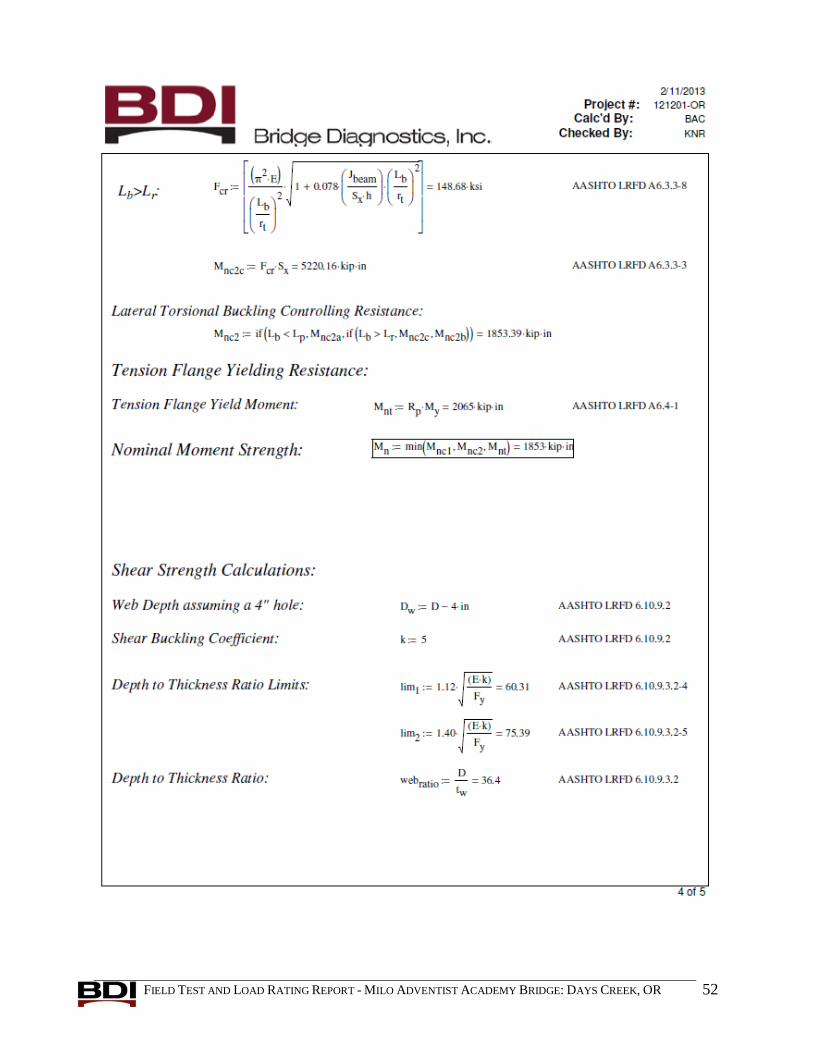
FIELD TEST AND LOAD RATING REPORT - MILO ADVENTIST ACADEMY BRIDGE: DAYS CREEK, OR 52
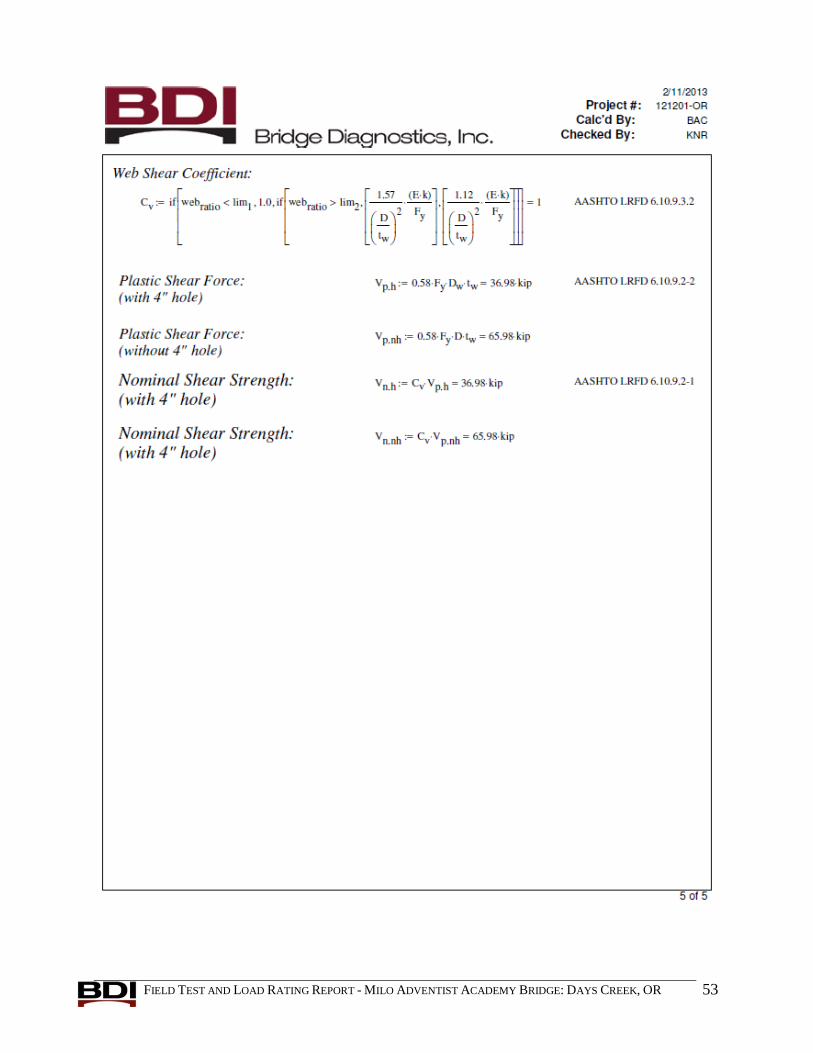
FIELD TEST AND LOAD RATING REPORT - MILO ADVENTIST ACADEMY BRIDGE: DAYS CREEK, OR 53

FIELD TEST AND LOAD RATING REPORT - MILO ADVENTIST ACADEMY BRIDGE: DAYS CREEK, OR 54
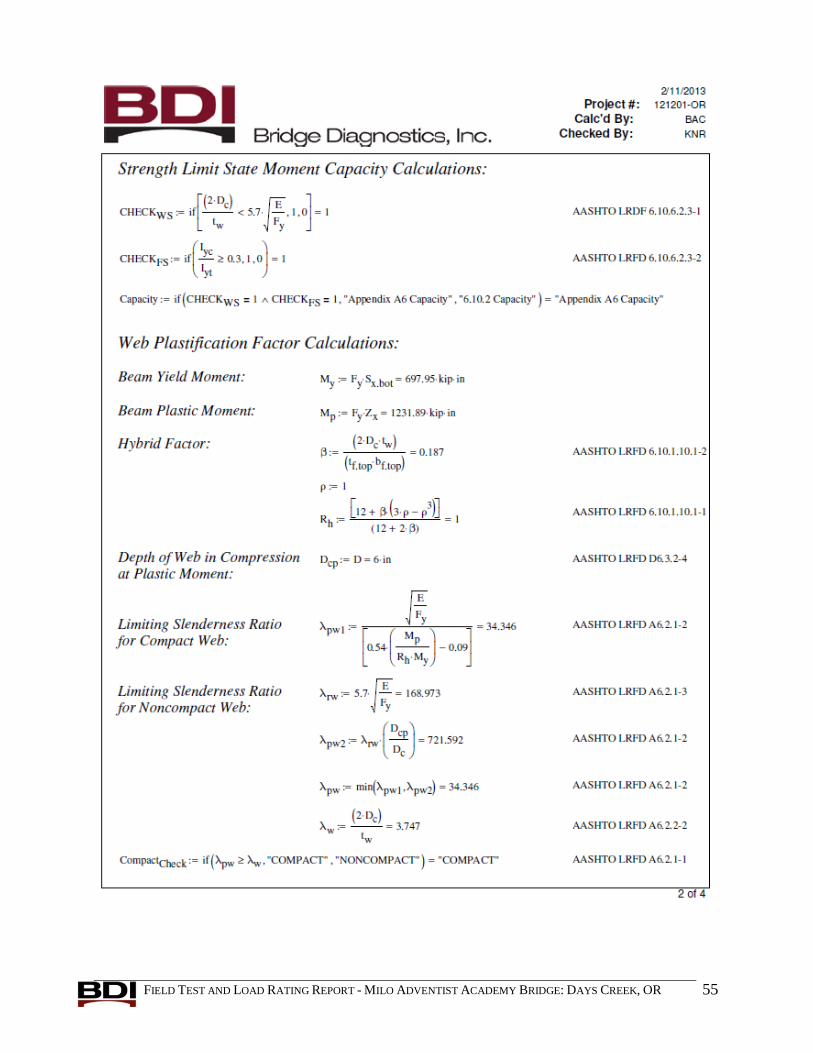
FIELD TEST AND LOAD RATING REPORT - MILO ADVENTIST ACADEMY BRIDGE: DAYS CREEK, OR 55
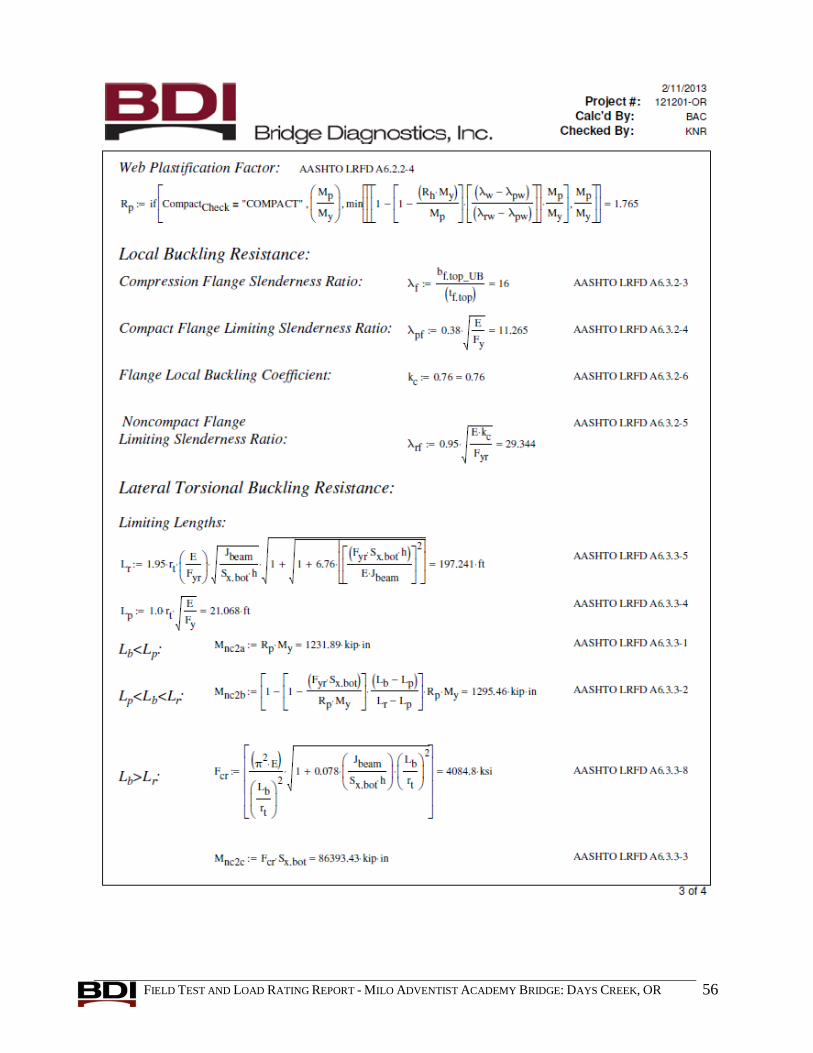
FIELD TEST AND LOAD RATING REPORT - MILO ADVENTIST ACADEMY BRIDGE: DAYS CREEK, OR 56

FIELD TEST AND LOAD RATING REPORT - MILO ADVENTIST ACADEMY BRIDGE: DAYS CREEK, OR 57
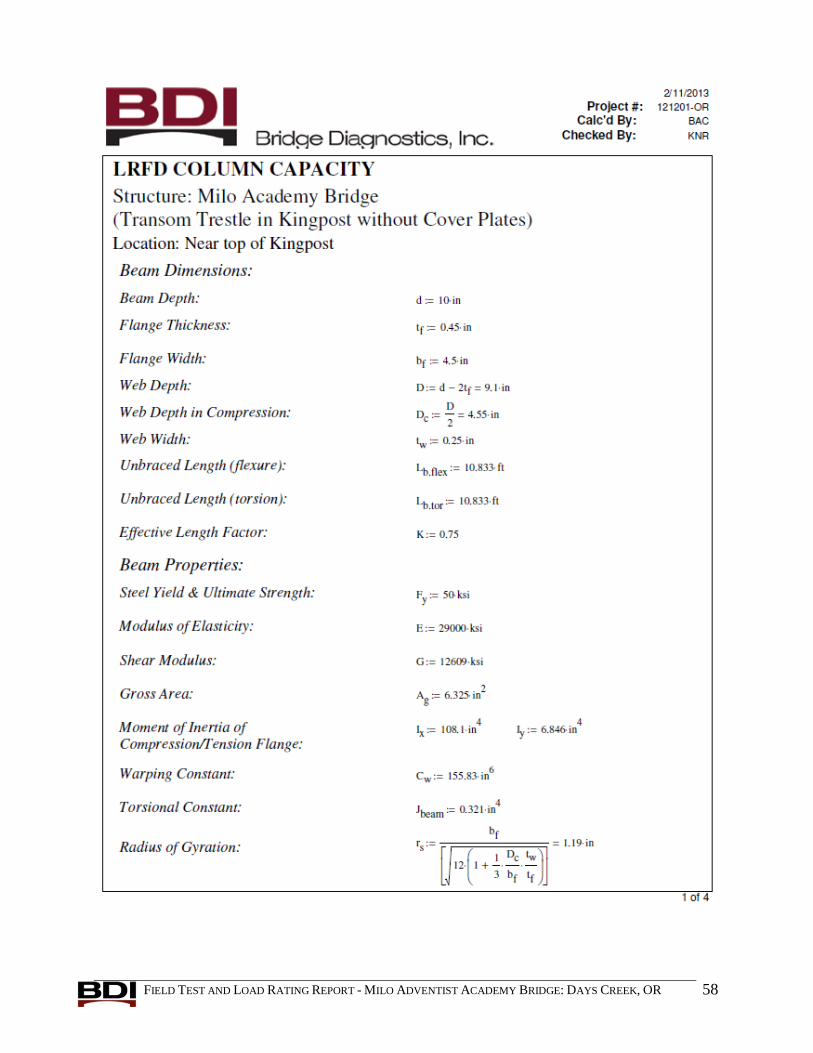
FIELD TEST AND LOAD RATING REPORT - MILO ADVENTIST ACADEMY BRIDGE: DAYS CREEK, OR 58

FIELD TEST AND LOAD RATING REPORT - MILO ADVENTIST ACADEMY BRIDGE: DAYS CREEK, OR 59

FIELD TEST AND LOAD RATING REPORT - MILO ADVENTIST ACADEMY BRIDGE: DAYS CREEK, OR 60

FIELD TEST AND LOAD RATING REPORT - MILO ADVENTIST ACADEMY BRIDGE: DAYS CREEK, OR 61
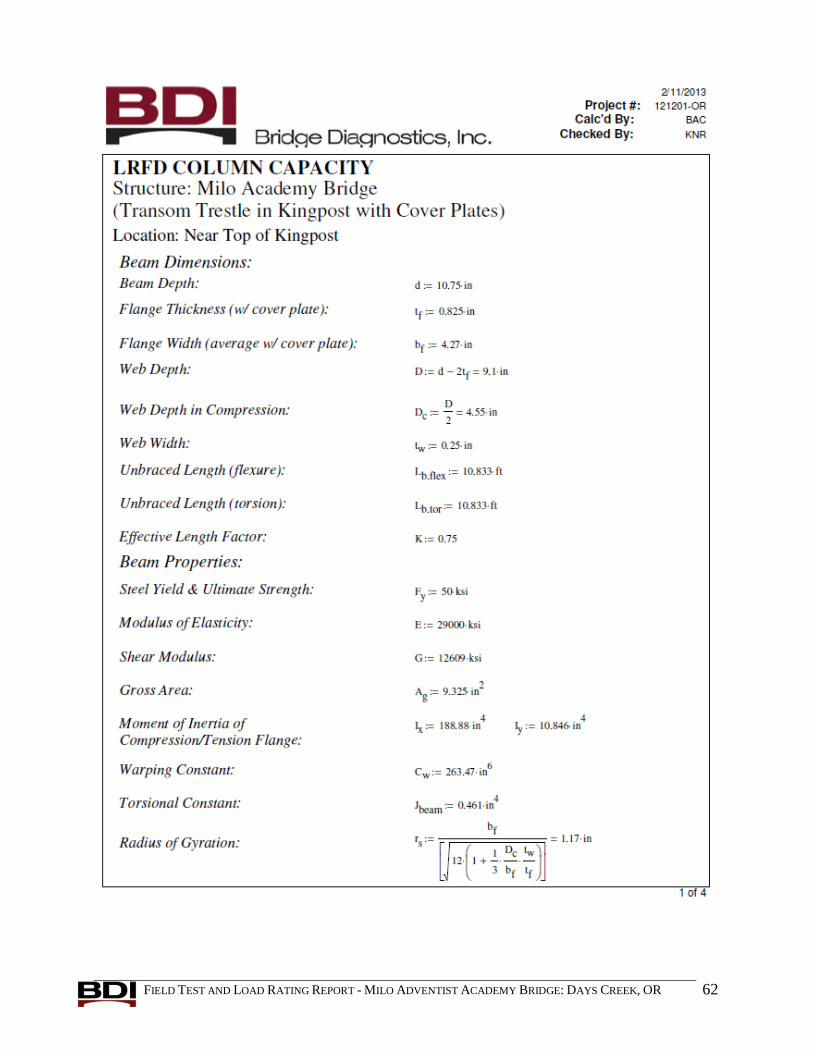
FIELD TEST AND LOAD RATING REPORT - MILO ADVENTIST ACADEMY BRIDGE: DAYS CREEK, OR 62

FIELD TEST AND LOAD RATING REPORT - MILO ADVENTIST ACADEMY BRIDGE: DAYS CREEK, OR 63
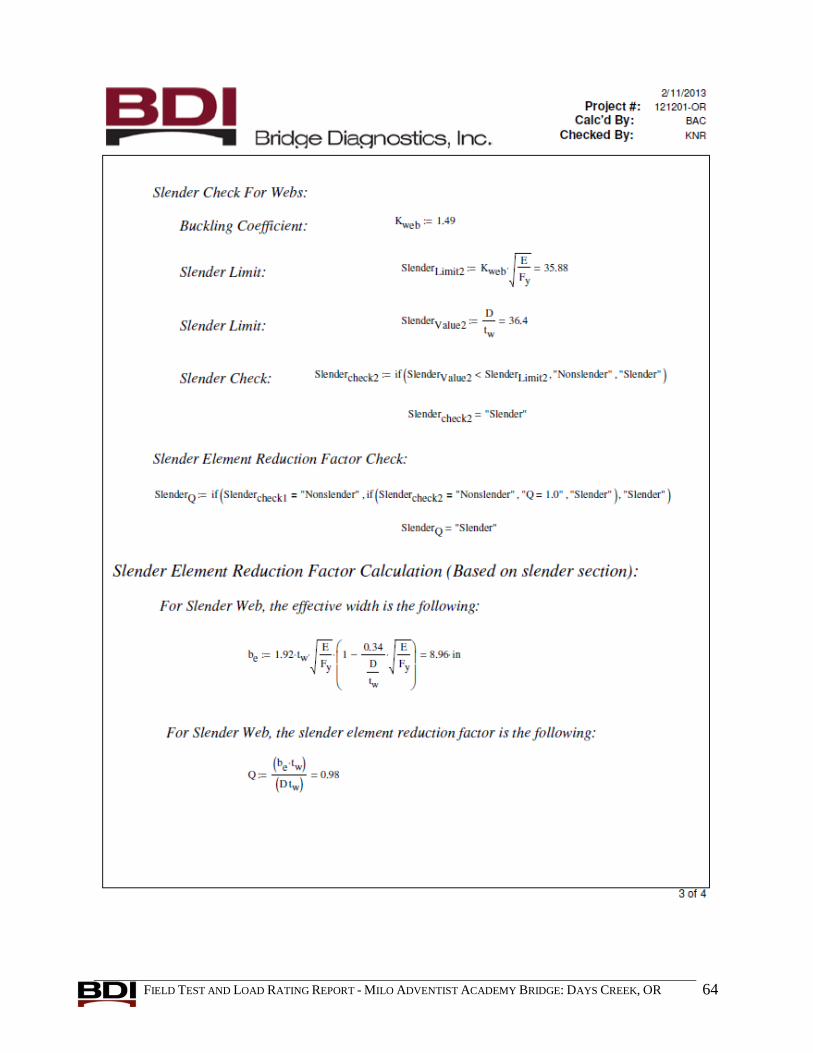
FIELD TEST AND LOAD RATING REPORT - MILO ADVENTIST ACADEMY BRIDGE: DAYS CREEK, OR 64

FIELD TEST AND LOAD RATING REPORT - MILO ADVENTIST ACADEMY BRIDGE: DAYS CREEK, OR 65
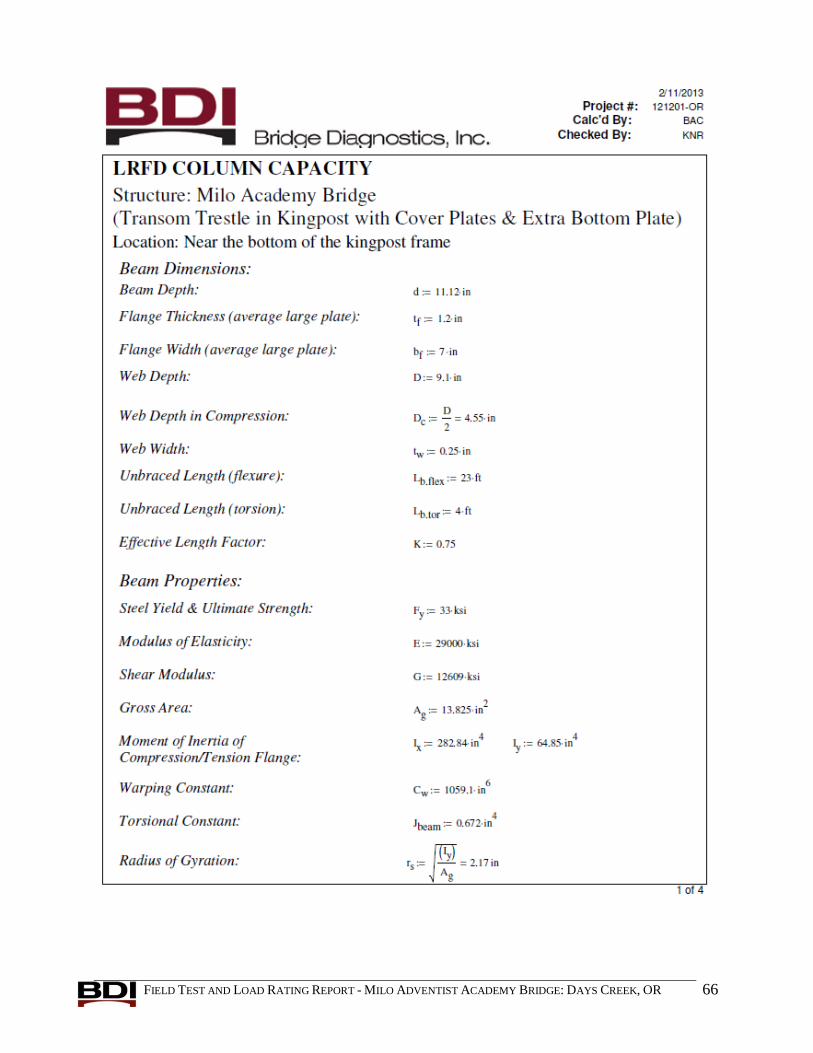
FIELD TEST AND LOAD RATING REPORT - MILO ADVENTIST ACADEMY BRIDGE: DAYS CREEK, OR 66
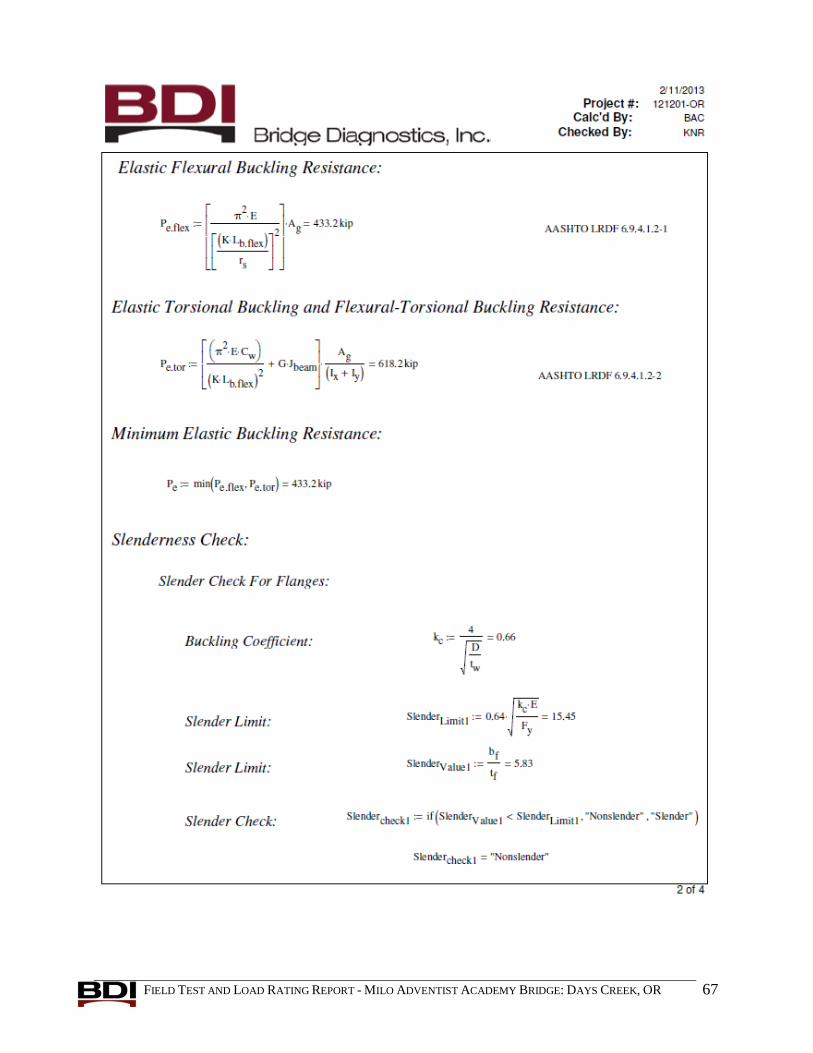
FIELD TEST AND LOAD RATING REPORT - MILO ADVENTIST ACADEMY BRIDGE: DAYS CREEK, OR 67
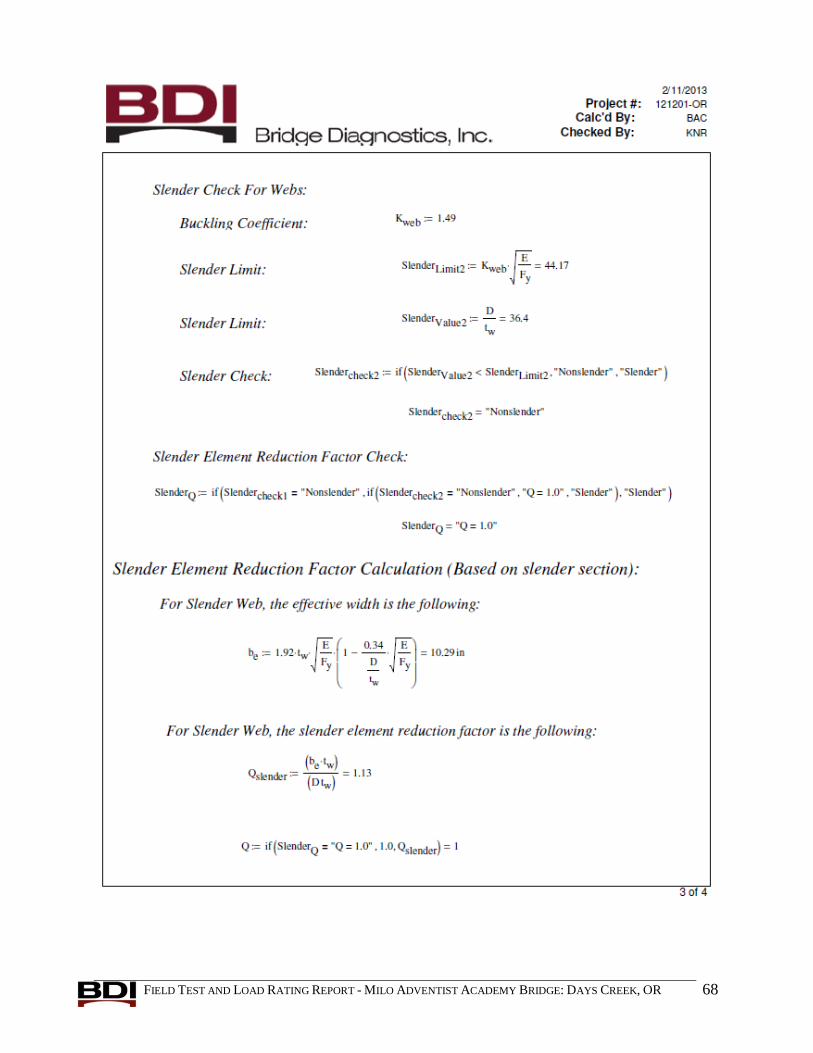
FIELD TEST AND LOAD RATING REPORT - MILO ADVENTIST ACADEMY BRIDGE: DAYS CREEK, OR 68

FIELD TEST AND LOAD RATING REPORT - MILO ADVENTIST ACADEMY BRIDGE: DAYS CREEK, OR 69
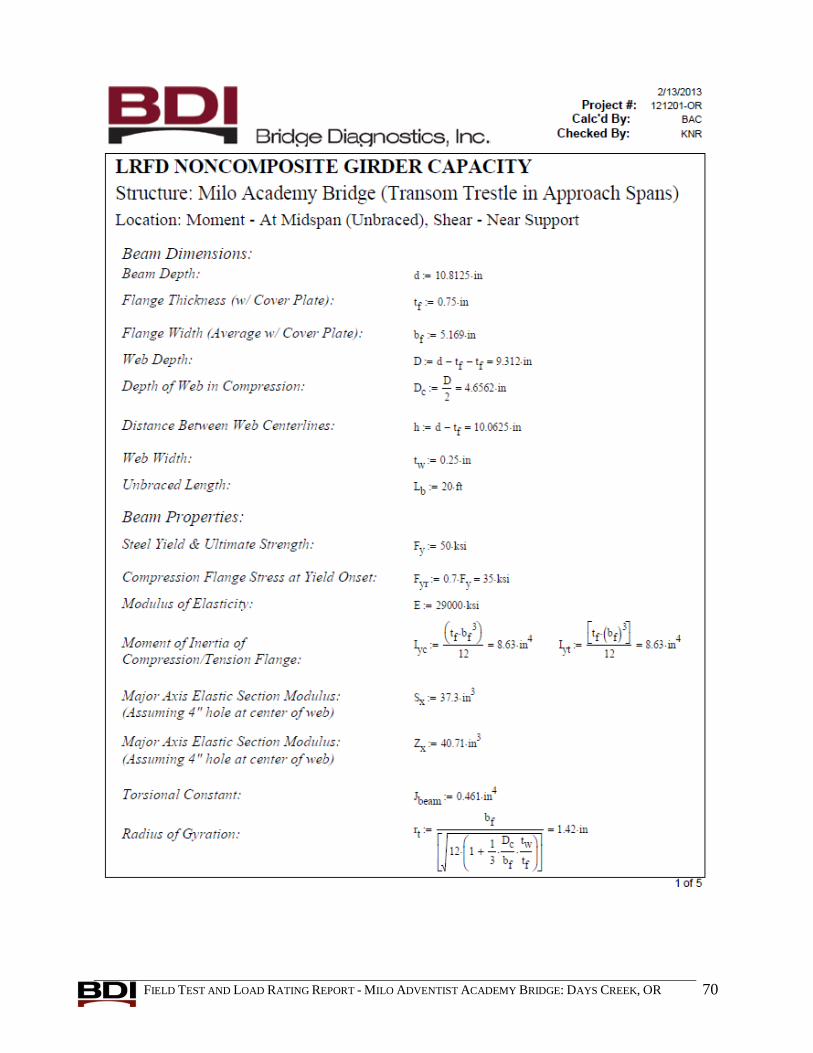
FIELD TEST AND LOAD RATING REPORT - MILO ADVENTIST ACADEMY BRIDGE: DAYS CREEK, OR 70
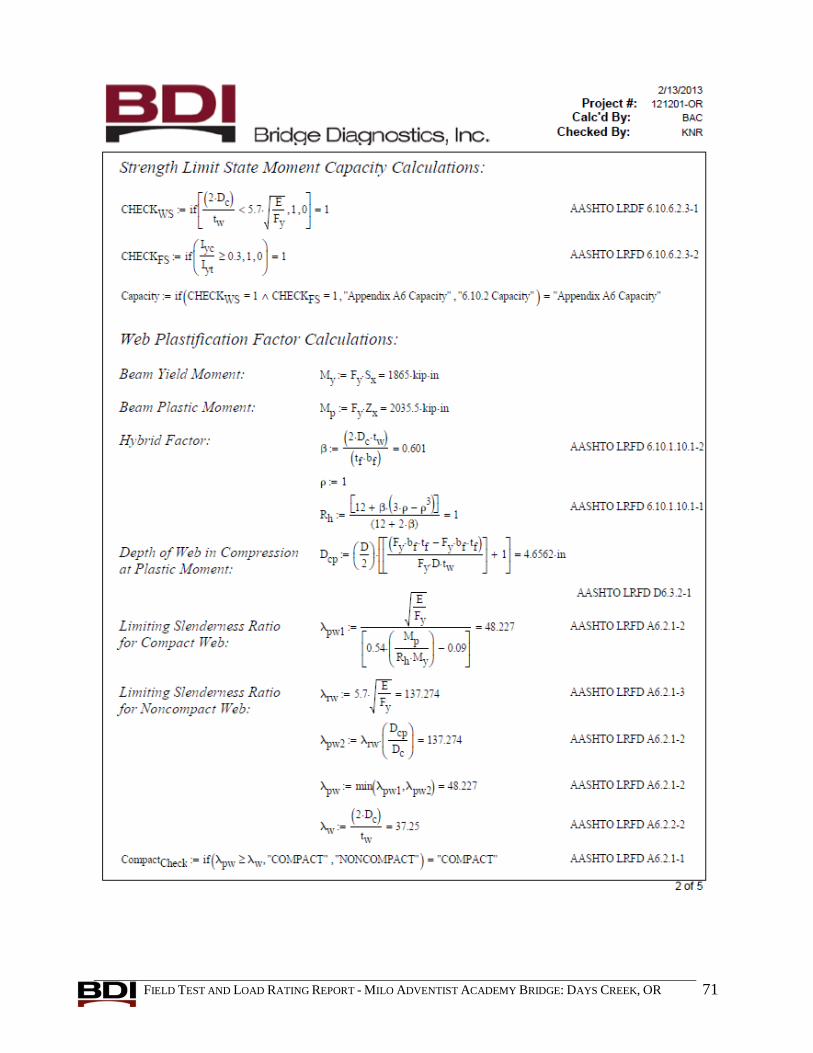
FIELD TEST AND LOAD RATING REPORT - MILO ADVENTIST ACADEMY BRIDGE: DAYS CREEK, OR 71
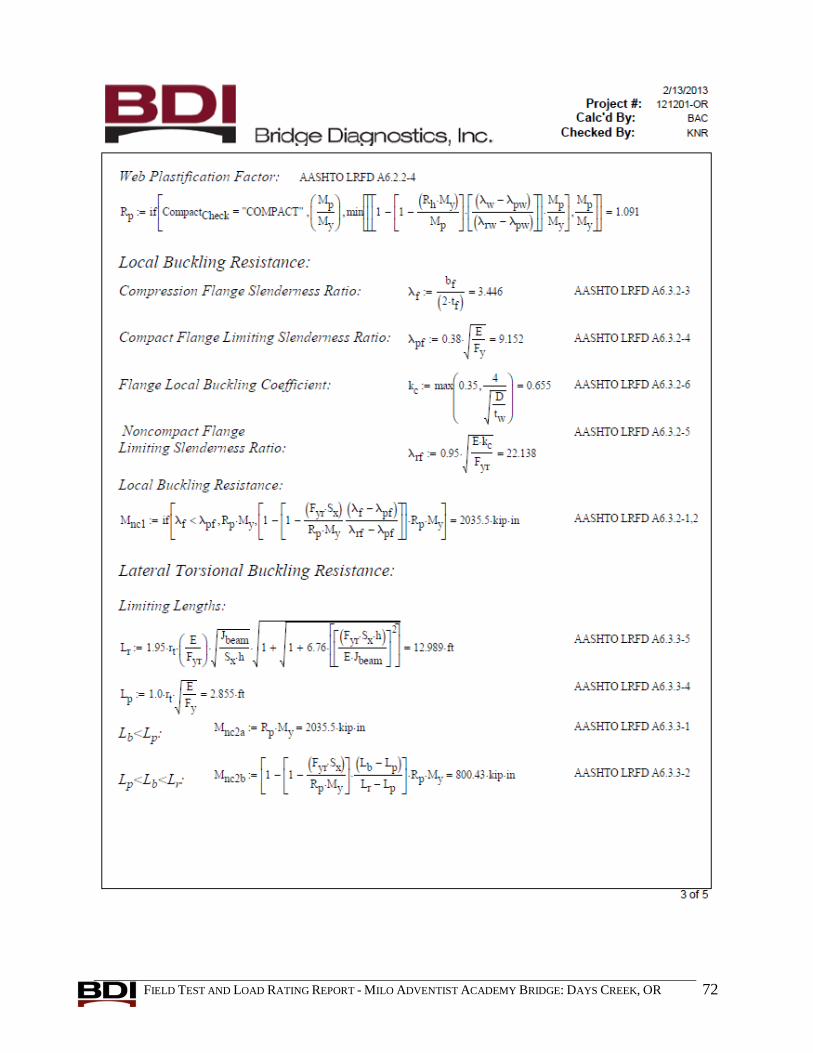
FIELD TEST AND LOAD RATING REPORT - MILO ADVENTIST ACADEMY BRIDGE: DAYS CREEK, OR 72

FIELD TEST AND LOAD RATING REPORT - MILO ADVENTIST ACADEMY BRIDGE: DAYS CREEK, OR 73
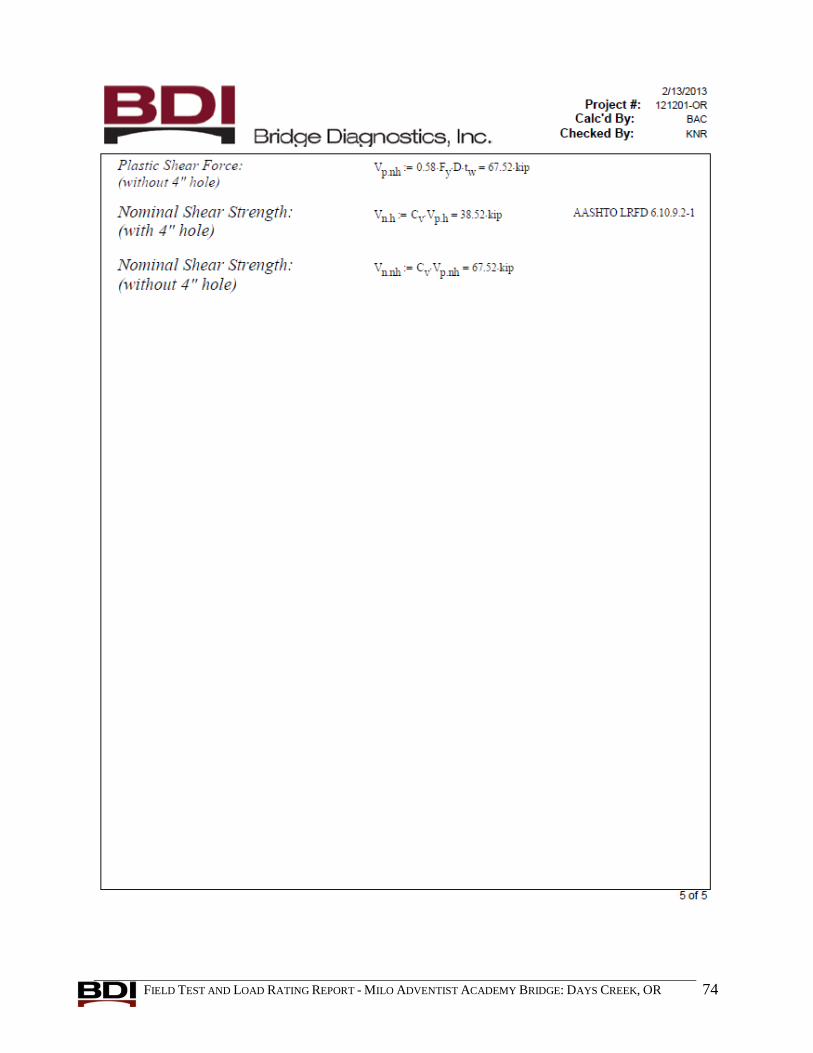
FIELD TEST AND LOAD RATING REPORT - MILO ADVENTIST ACADEMY BRIDGE: DAYS CREEK, OR 74
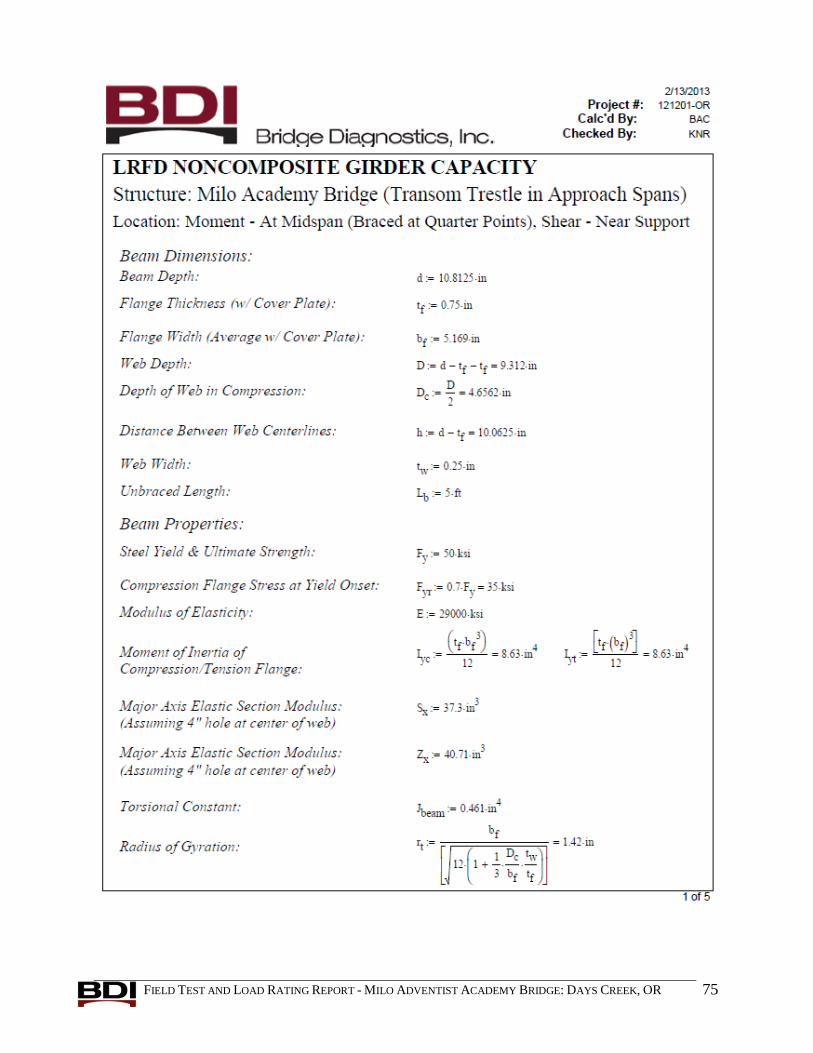
FIELD TEST AND LOAD RATING REPORT - MILO ADVENTIST ACADEMY BRIDGE: DAYS CREEK, OR 75

FIELD TEST AND LOAD RATING REPORT - MILO ADVENTIST ACADEMY BRIDGE: DAYS CREEK, OR 76

FIELD TEST AND LOAD RATING REPORT - MILO ADVENTIST ACADEMY BRIDGE: DAYS CREEK, OR 77

FIELD TEST AND LOAD RATING REPORT - MILO ADVENTIST ACADEMY BRIDGE: DAYS CREEK, OR 78

FIELD TEST AND LOAD RATING REPORT - MILO ADVENTIST ACADEMY BRIDGE: DAYS CREEK, OR 79

FIELD TEST AND LOAD RATING REPORT - MILO ADVENTIST ACADEMY BRIDGE: DAYS CREEK, OR 80
FIELD TEST AND LOAD RATING REPORT - MILO ADVENTIST ACADEMY BRIDGE: DAYS CREEK, OR 81
APPENDIX B - REFERENCES
For all references to BDI’s equipment, services, and analysis/rating methods please go to our
website:
www.bridgetest.com
AASHTO, (2010). "AASHTO LRFD Bridge Design Specifications, 5th Edition." Washington, D.C.
AASHTO, (2013). "The Manual for Bridge Evaluation, Second Edition, with 2013 Interim
Revisions." Washington, D.C.
![3.Experimental line and load spec- ificationsstc.fs.cvut.cz/pdf17/6603.pdf · 2017. 4. 12. · diagnostics VAG-COM, the software VCDS [4] 5. Results Full load : Route Kladno – Praha](https://static.fdocuments.in/doc/165x107/6118dce2beaaf7592e4f022c/3experimental-line-and-load-spec-2017-4-12-diagnostics-vag-com-the-software.jpg)