Briar Hill School Data Summary Fall 2010. Student Diversity: ESL, Special Education Based on 194...
11
Briar Hill School Data Summary Fall 2010
-
Upload
chad-abel-merritt -
Category
Documents
-
view
215 -
download
0
Transcript of Briar Hill School Data Summary Fall 2010. Student Diversity: ESL, Special Education Based on 194...

Briar Hill SchoolData Summary
Fall 2010

Student Diversity: ESL, Special Education
Based on 194 students
% of
Population Gifted 5%Other Mild/moderate 8%Severe 5% ELL
8%FSL 41%

Provincial Achievement TestGrade 3 Language Arts
A E B A E B A E B A E B A E B
2006 2007 2008 2009 2010
Total Test 100% 43% 0% 100% 33% 0% 96% 48% 4% 100% 36% 0% 100% 58% 0%
Reading 96% 65% 4%Writing 96% 35% 4%
Grade 6 Language Arts A E B A E B A E B A E B A E B
2006 2007 2008 2009 2010
Total Test 100.0%40.9
% 0.0% 100.0%73.1
% 0.0%100.0
% 55.9% 0.0%100.0
% 55.9% 0.0% 96.6% 41.4% 3.4%
Writing 100.0
% 44.1% 0.0% 86.2% 44.8% 13.8%
Reading 100.0
% 79.4% 0.0% 100.0% 48.3% 0.0%
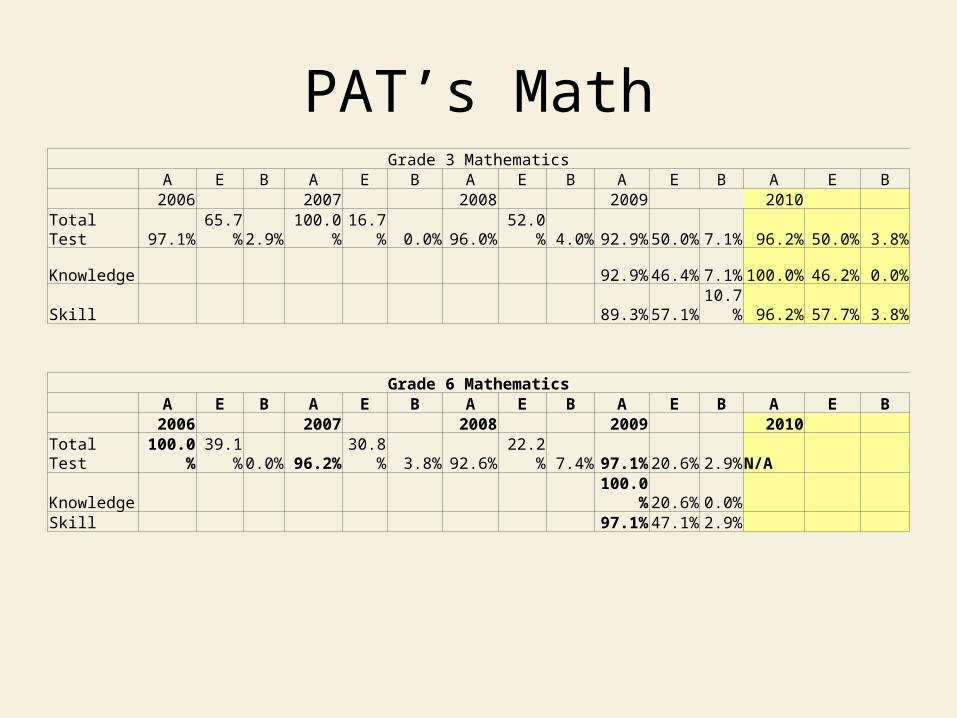
PAT’s MathGrade 3 Mathematics
A E B A E B A E B A E B A E B 2006 2007 2008 2009 2010
Total Test 97.1%65.7
% 2.9% 100.0%16.7
% 0.0% 96.0% 52.0% 4.0% 92.9% 50.0% 7.1% 96.2% 50.0% 3.8%
Knowledge 92.9% 46.4% 7.1% 100.0% 46.2% 0.0%
Skill 89.3% 57.1%10.7
% 96.2% 57.7% 3.8%
Grade 6 Mathematics A E B A E B A E B A E B A E B
2006 2007 2008 2009 2010
Total Test 100.0%39.1
% 0.0% 96.2%30.8
% 3.8% 92.6% 22.2% 7.4% 97.1% 20.6% 2.9%N/A
Knowledge 100.0
% 20.6% 0.0% Skill 97.1% 47.1% 2.9%

PAT’s- Gr. 6 Science & SocialGrade 6 Science
A E B A E B A E B A E B A E B
2006 2007 2008 2009 2010
Total Test 100.0%73.9
% 0.0% 96.0% 72.0% 4.0%100.0
% 25.9% 0.0%100.0
% 52.9% 0.0% 89.3% 21.4% 10.7%
Knowledge 100.0
% 50.0% 0.0% 89.3% 35.7% 10.7%
Skill 97.1% 64.7% 2.9% 85.7% 28.6% 14.3%
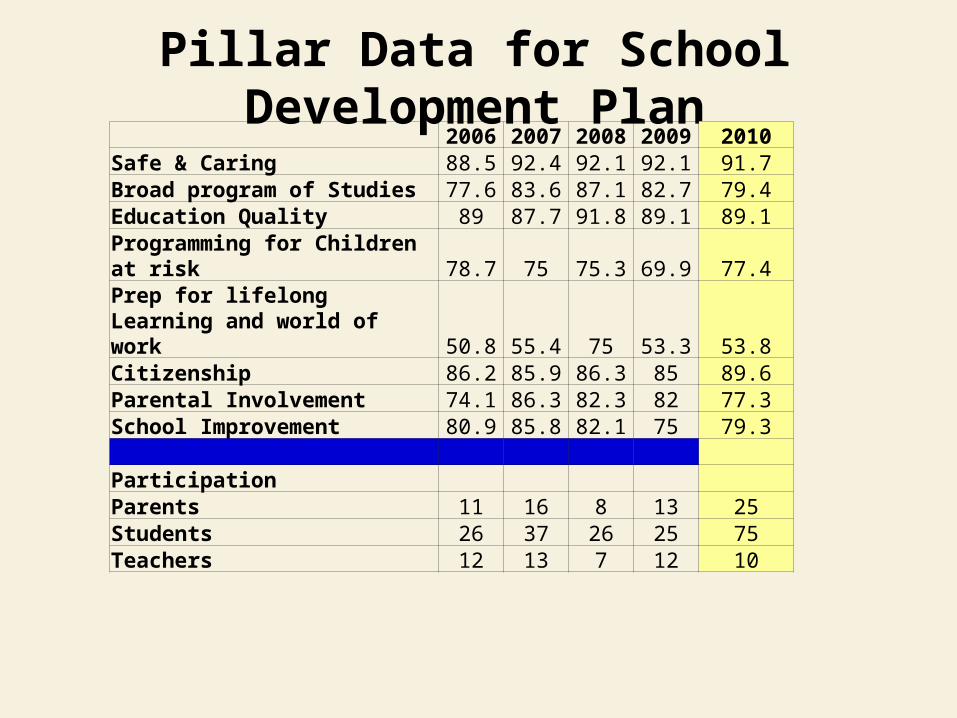
Pillar Data for School Development Plan 2006 2007 2008 2009 2010Safe & Caring 88.5 92.4 92.1 92.1 91.7Broad program of Studies 77.6 83.6 87.1 82.7 79.4Education Quality 89 87.7 91.8 89.1 89.1Programming for Children at risk 78.7 75 75.3 69.9 77.4Prep for lifelong Learning and world of work 50.8 55.4 75 53.3 53.8Citizenship 86.2 85.9 86.3 85 89.6Parental Involvement 74.1 86.3 82.3 82 77.3School Improvement 80.9 85.8 82.1 75 79.3 Participation Parents 11 16 8 13 25Students 26 37 26 25 75Teachers 12 13 7 12 10

Puddle Math Data(SKILL Students not included in this data.)
Sample size
Low Medium High ExceptionalGrade 1 Nov-09 30 0% 60% 37% 13% Jun-10 30 0% 57% 47% 7% Grade 2 Nov-09 31 39% 55% 6% 0% Jun-10 31 26% 55% 19% 0% Grade 3 Nov-09 22 32% 64% 5% 0% Jun-10 24 9% 77% 23% 0% Grade 4 Nov-09 24 13% 79% 4% 4% Jun-10 23 30% 52% 13% 4% Grade 5 Nov-09 21 33% 43% 14% 5% Jun-10 23 4% 48% 22% 26% Grade 6 Nov-09 24 29% 58% 13% 0% Jun-10 24 21% 63% 17% 0%

Math Report Card Data – June 2010
Number and Percentage of Students Receiving a “5” by Mathematics StrandsTotal School (Does not include SKILL class) – 167 Students
Report Card Strand Number of Students
Percentage of Students
Applies mathematical skills and strategies to solve problems.
18 11
Communicates understanding of mathematics through writing or speaking, using manipulatives ,pictures.
30 18
Understands mathematical concepts, skills and procedures.
40 25

Cycle of Professional Inquiry
• What do you want to see students do differently?• What are the outcomes or results you want to see?• What might you do differently in your instructional
practice (e.g. changes in instruction, assessment) to try to improve student achievement?
• What indicators would assist you in seeing if what you are doing differently is helping to create the improved student achievement you identified?

School Development PlanE-2 Academic Success
Outcome 2.1 Students demonstrate high standards in learner outcomesMeasures
Strategies2.1.01 Implement a learning model that establishes a system-wide focus on the relationship between the teacher, the student and content; the instructional core
Action• Students will engage in collaborative mathematical problem solving, communicating understanding through multiple forms of representation.
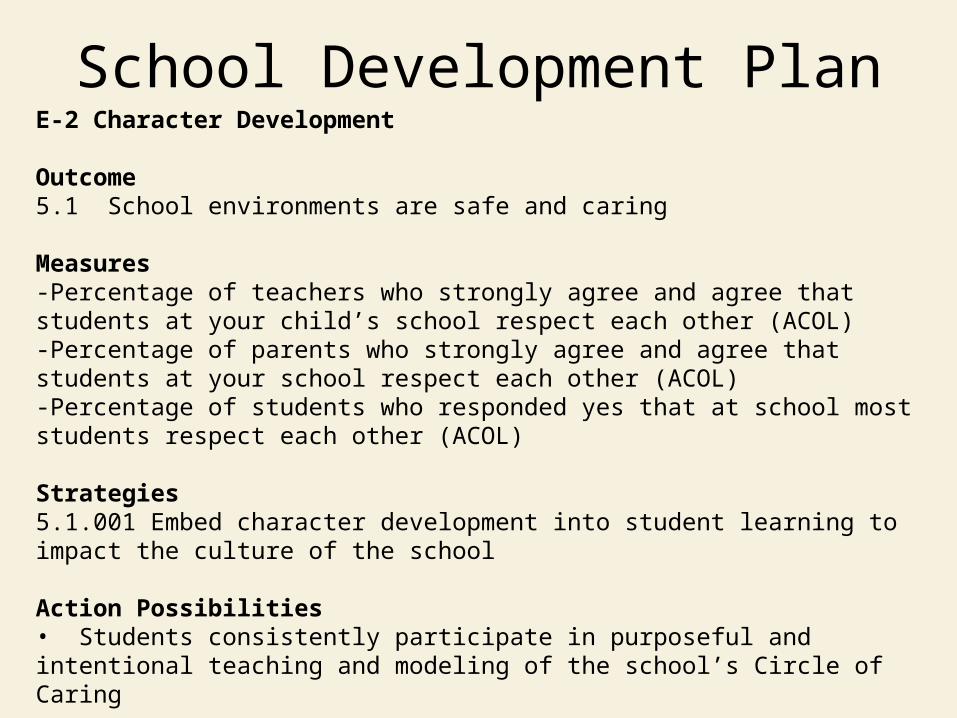
School Development PlanE-2 Character Development
Outcome 5.1 School environments are safe and caring
Measures-Percentage of teachers who strongly agree and agree that students at your child’s school respect each other (ACOL)-Percentage of parents who strongly agree and agree that students at your school respect each other (ACOL)-Percentage of students who responded yes that at school most students respect each other (ACOL)
Strategies5.1.001 Embed character development into student learning to impact the culture of the school
Action Possibilities• Students consistently participate in purposeful and intentional teaching and modeling of the school’s Circle of Caring